
Plutonium Flowsheet Development in Miniature Mixer-Settlers
46
ORN L/TM -7408 Plutonium Flowsheet Development in Miniature Mixer-Settlers B. A. Hannaford G. D. Davis
Transcript of Plutonium Flowsheet Development in Miniature Mixer-Settlers

ORN L/TM -7408
Plutonium Flowsheet Development in Miniature Mixer-Settlers
B. A. Hannaford G . D. Davis

DISCLAIMER
This report was prepared as an account of work sponsored by an agency of the United States Government. Neither the United States Government nor any agency Thereof, nor any of their employees, makes any warranty, express or implied, or assumes any legal liability or responsibility for the accuracy, completeness, or usefulness of any information, apparatus, product, or process disclosed, or represents that its use would not infringe privately owned rights. Reference herein to any specific commercial product, process, or service by trade name, trademark, manufacturer, or otherwise does not necessarily constitute or imply its endorsement, recommendation, or favoring by the United States Government or any agency thereof. The views and opinions of authors expressed herein do not necessarily state or reflect those of the United States Government or any agency thereof.

DISCLAIMER Portions of this document may be illegible in electronic image products. Images are produced from the best available original document.

r Printed in the United States of America. Available from
the Department of Energy Technical Information Center
P.O. Box 62, Oak Ridge, Tennessee 37830
L
This report was prepared as an account of work sponsored by an agency of the United StatesGovernment. Neither theU nited StatesGovernment nor any agency thereof, nor any of their employees, makes any warranty, express or implied, or assumes any legal liability or responsibility for the accuracy, completeness, or usefulness of any information, apparatus, product, or process disclosed, or represents that its use would not infringe privately owned rights. Reference herein to any specific commercial product, process, or service by trade name, trademark, manufacturer, or otherwise, does not necessarily constitute or imply its endorsement, recommendation, or favoring by the United States Government or any agency thereof. The views and opinions of authors expressed herein do not necessarily state or reflect those of theunited StatesGovernment or any agency thereof.
8
1
ORNL/TM-7408 Dist. Category UC-86
Contract No. W-7405-eng-26
Consolidated Fuel Reprocessing Program
PLUTONIUM FLOWSHEET DEVELOPMENT IN MINIATURE MIXER-SETTLERS
B. A. Hannaford G. D. Davis
Chemical Technology Division
Date Published: May 1981
OAK RIDGE NATIONAL LABORATORY Oak Ridge, Tennessee 37830
operated by UNION CARBIDE CORPORATION
for the DEPARTMENT OF ENERGY
!

iii
CONTENTS c
r
r,
Abstract . . . . . . . . . . . . . . . . . . . . . . . . . . . . . . 1
1 . Introduction . . . . . . . . . . . . . . . . . . . . . . . . . . 2
2 . Description of Facility . . . . . . . . . . . . . . . . . . . . 2
2 .1 Mixer-Settlers . . . . . . . . . . . . . . . . . . . . . . 6 2 .2 Control of Liquid Flow Rate . . . . . . . . . . . . . . . . 7 2 .3 In-line Process Monitors . . . . . . . . . . . . . . . . . 10
2 .3 .1 Density Meters . . . . . . . . . . . . . . . . . . . 10 2 .3 .2 Spectrophotometers . . . . . . . . . . . . . . . . . 14
2 .4 Automatic Data Acquisition System . . . . . . . . . . . . . 15
3 . Experimental Results . Partial Partitioning of Uranium-Plutonium . . . . . . . . . . . . . . . . . . . . . . . 17
3 .1 Shakedown Experiments . . . . . . . . . . . . . . . . . . . 17
3 .1 .1 Experiment UX-1 . . . . . . . . . . . . . . . . . . 18 3 .1 .2 Experiment UX-2 . . . . . . . . . . . . . . . . . . 18 3 . 1 . 3 Experiment UX-3 . . . . . . . . . . . . . . . . . . 22
3.2 Plutonium-Uranium Partitioning Experiments . . . 25
3.2 .1 Experiment PX-2 . . . . . . . . . . . . . . . . . . 25 3 .2 .2 Experiment PX-3 . . . . . . . . . . . . . . . . . . 32
4 . Conclusions . . . . . . . . . . . . . . . . . . . . . . . . . . 32
5 . Acknowledgments . . . . . . . . . . . . . . . . . . . . . . . . 34
6 . References . . . . . . . . . . . . . . . . . . . . . . . . . . . 35
7 . Appendixes . . . . . . . . . . . . . . . . . . . . . . . . . . . 37
Appendix A . Summary of Flow Rates and Flow Ratios for Uranium- Plutonium Partitioning Experiments . . . . . . . . 38
Appendix B . Agitator Depth Settings and Rotational Speed f o r Experiments UX-2 through PX.3 . . . . . . . . . . . 39
Appendix C . Uranium Concentration in Aqueous Solution as a Function of Density. Plutonium Concentration. and Nitric Acid Concentration . . . . 40

1
PLUTONIUM FLOWSHEET DEVELOPMENT I N MINIATURE MIXER-SETTLERS
B. A. Hannaford G. D. Davis
ABSTRACT
Initial runs were completed in a new solvent extraction facility that has been built for testing coprocessing flowsheets with simulated LWR and FBR fuel solutions. The equipment, which is assembled in glove boxes, includes three 16-stage miniature mixer- settler banks with associated in-line monitors, pump- ing equipment, and sampling apparatus.
Following shakedown runs with solutions containing uranium only, two flowsheet test runs were made with a simulated LWR fuel solution (U/Pu = 100). The solution was fed to an extraction-scrub bank, where 30% tributyl phosphate in normal paraffin hydrocarbon diluent w a s used to coextract uranium and plutonium. The extract was fed to a second mixer-settler bank, where all of the plutonium was stripped into an aqueous product stream using hydroxylamine nitrate for plutonium reduction; a controlled fraction of the uranium was simultaneously stripped t o produce a U/Pu ratio of -2. The amount of the uranium stripped with the plutonium was regulated by careful control of an organic backscrub stream. Finally, the residual uranium in the solvent was stripped in the third mixer-settler bank.
The success of the experiments depended on precise control of very l o w l i q u i d f l o w rates, and on i n - l i n e monitors which indicated the uranium or total heavy-metal concentrations. The most useful in-line device w a s the Mettler/Paar density meter, from which metal concentra- tions could be determined to within -1 g/L. spectrophotometer also gave promising results for uranium analysis.
A miniature
Preliminary use of a Hewlett-Packard data acquisi- tion system was satisfactory; recorded variables were temperature, solution density, liquid flow rates, and liquid levels. Application of the system is being expanded to include control of solution concentrations from an in-line density meter. Work was completed on feed solutions of LWR composition, and preparations were begun for flowsheet experiments with feed streams of FBR composition (-10% plutonium).

2
1. INTRODUCTION
A new solvent extraction system with minimixer-settler contactors
has been assembled in connecting alpha glove boxes in Building 3503.
This system is being used to test uranium-plutonium flowsheets and eval- uate new process options with simulated feeds prior to testing of the
flowsheets with irradiated fuel solutions in the ORNL Solvent Extraction Test Facility. It also provides a test bed for in-line instrumentation which will be used to control the solvent extraction process.
Principal emphasis in the test program is on development of copro-
cessing flowsheets for LWR and FBR fuel types.
cept, the plutonium is not separated completely from the uranium as has been traditional in the Purex process. Instead, it is maintained as the
minor component of the uranium-plutonium mixture throughout the process- ing steps, including preparation of mixed oxides for recycle. This
report describes the facility and the results of both the shakedown runs
(with uranium only) and the first two plutonium runs.
In the coprocessing con-
2. DESCRIPTION OF FACILITY
The solvent extraction contactors consist of three 16-stage mini- mixer-settler banks that are installed in alpha glove boxes in Building 3508 (Fig. 1). Also within the glove boxes are transfer pumps, in-line
process monitors, the uranium-plutonium feed tank, and solution
receivers. All feed streams not containing plutonium or uranium are
metered from facilities outside (Fig. 2).
The three banks of mini-mixer-settlers are installed in a 1.8- (6-ft)-long glove box.
and 1.6- (1/16-in.)-diam Teflon tubing were used to introduce aqueous
and organic streams to any chosen mixing chamber (Fig. 3) . The organic
phase generally flows from right to left, with transfer pumps providing
a means for automatically controlling and recording the flow between
mixer-settler banks A (extraction) and B (partitioning), and between B and C (stripping). The aqueous phase flows from left to right through
Flexible connections of 3.2-mm (1/8-in.)-diam

W
Fig. 1. Installation of three mini-mixer-settlers in an open glove box. Heater controls and agitator drive controls are located below the glove box.

F i g . 2. Liquid metering system. Flowmeasuring cap i l lar i e s , 1.07 mm I D and 1.2 to 4.6 m long (0.042 in. I D and 4 to 15 f t long), Permit automatic control and recording of flow rates .
,

.>
1 cx v. dil. HAN -HYE-HN03 I
1 BS 30% TBP
1 BX 7
ORNL DWG 79-1279R
1 AS 1 M HN03
1 A V
I I
DENSITOMETER A U CONDUCT I VIT Y CELL
I SAMPLER
EVACUATED RECEIVER
A BANK u
1c w 1c u I B P
Fig. 3. experiment PX-3.
Equipment flowsheet for plutonium-uranium partitioning HAN = hydroxylamine nitrate; HYE = hydrazine nitrate.

6
t h e i n d i v i d u a l m i x e r - s e t t l e r banks and l eaves each bank by overflowing a
a weir. The aqueous streams a r e c o l l e c t e d by vacuum t r a n s f e r i n g l a s s
r e c e i v e r s l o c a t e d i n t h e connecting glove box. In - l ine process monitors
were most f r e q u e n t l y l o c a t e d i n t h e 1BP product stream. The f a c i l i t y i s
desc r ibed i n more d e t a i l i n t h e subsec t ions t h a t follow.
2.1 Mixer -Se t t le rs
Three i d e n t i c a l banks of mixer-settlers w e r e f a b r i c a t e d accord ing t o
drawings provided by t h e Savannah River Laboratory.
s t a i n l e s s s tee l and faced f r o n t and back wi th Pyrex cover p l a t e s , each
m i x e r - s e t t l e r bank is made up of a l t e r n a t i n g mixing chambers and
s e t t l i n g chambers on each s i d e , similar t o t h e o r i g i n a l KAPL* design.
Liquid holdup volumes are -3.5 mL f o r each mixing chamber and -11.2 mL
f o r each settling chamber, f o r a t o t a l solution volume of -235 mL for an
i n d i v i d u a l bank.
Machined from
A g i t a t i o n of t h e 16 mixing chambers i n each c o n t a c t o r was provided
by square-edged, four-paddle, 6.4-mm (0.25-in.)-diam a g i t a t o r s , which
were d r iven by a s i n g l e 0-3000 rpm servomotor through an a r r a y of gears .
The a g i t a t o r speed w a s c o n t r o l l e d by manually s e t t i n g t h e d e s i r e d va lue
f o r t h e f r o n t mixers ( t h e rear mixers opera ted a t a 10% h ighe r rate
because of t h e g e a r i n g ) and v e r i f y i n g t h e a c t u a l va lue wi th a photo-
tachometer. The submergence of t h e a g i t a t o r s a l s o a f f e c t e d t h e degree
of a g i t a t i o n , t h e pumping rate between s t a g e s , and t h e p o s i t i o n of the
organic-aqueous i n t e r f a c e . Therefore , s u i t a b l e a g i t a t o r s e t t i n g s were
determined by some t r i a l - and-e r ro r experiments performed a t a f i x e d
r o t a t i o n a l speed, us ing r e f e r e n c e flowsheet cond i t ions . Following t h i s ,
t h e a g i t a t o r speed w a s i nc reased i n -50-rpm increments i n o rde r t o
e s t a b l i s h a va lue j u s t s h o r t of producing organic-phase underflow. The
r e s u l t i n g speeds were -1550, -1550, and -1600 rpm f o r banks A, B, and C
r e s p e c t i v e l y . Sampling w a s r equ i r ed t o document t h e s t eady- s t a t e compositions.
The volume of each sample had t o be l i m i t e d t o about 1 mL because of t h e
*KAPL = Knolls Atomic Power Laboratory.

7
,-,
small volume a v a i l a b l e i n t h e settlers. For t h i s purpose, a permanent
a r r a y of 32 Vacutainer* ho lde r s was mounted above t h e gear box on each
m i x e r - s e t t l e r with 1.6-mm (1/16-in.)-diam s t a i n l e s s steel tubes p r o j e c t -
i n g i n t o t h e organic o r aqueous phase of a l l s e t t l i n g chambers.
Vacuta iners were ad jus t ed t o the vacuum requ i r ed t o withdraw t h e d e s i r e d
volume, i n t h e 1- t o 3-mL range, by pumping them down i n a device
designed and b u i l t f o r t h a t purpose (Fig. 4).
The
2.2 Cont ro l of Liquid Flow Rate
The r equ i r ed l i q u i d feed rates t o t h e mixer-settlers f a l l i n t h e
range 0.1 t o 4 mL/min, and the d e s i r e d p r e c i s i o n is approximately 25% o r
b e t t e r . I n o rde r t o provide maximum f l e x i b i l i t y i n t h e meter ing
systems, they were designed around a v a l v e l e s s pump head wi th wet ted
p a r t s of alumina and Teflon (Model RHlCKC, F lu id Metering, Inc., Oyster
Bay, N.Y.) having v a r i a b l e displacements of 10 t o 100 pL pe r revolu t ion .
Gear-head servomotors (0 t o 100 rpm) were coupled t o t h e pump heads.
Modif ica t ions t o the servomotor c o n t r o l l e r s (586 BV, E l e c t r o c r a f t Corp.)
and i n t e r f a c i n g wi th Foxboro pneumatic r eco rde r -con t ro l l e r s were spec i -
f i e d by J. M. Madison and D. R. Miller, of the ORNL Ins t rumenta t ion and
Con t ro l s Divis ion.
The completed meter ing system (Fig. 5) inc luded a small c a l i b r a t i o n
tube f o r t h e purpose of p e r i o d i c a l l y v e r i f y i n g t h e flow rates i n d i c a t e d
by t h e c a p i l l a r y p re s su re drop.
mode of opera t ion , manual c o n t r o l was p o s s i b l e wi th e i t h e r t h e Foxboro
o r t he Electrodyne c o n t r o l l e r . The same basic system was a l s o used f o r
two t r a n s f e r pumps (1AP and 1BU streams) l o c a t e d w i t h i n t h e glove box; t h e s e were au tomat i ca l ly c o n t r o l l e d from a l e v e l s i g n a l from an 8-mm-ID
by 150-mm-high "surge tank" on t h e s u c t i o n of each pump.
I n a d d i t i o n t o the au tomat ic c o n t r o l
The f low rates repor t ed h e r e are not based on t h e c a p i l l a r y p re s su re
drop d a t a , but on the more d i r e c t measures provided by c a l i b r a t i o n tank
pump-down rate and the feed-tank d e p l e t i o n rate (linear r eg res s ion of
l eve l vs t i m e ) . However, experience wi th t h e system demonstrated t h a t
'
*Vacutainer is a r e g i s t e r e d trademark of Becton-Dickinson and Co., Paramus , N. J.

8
Fig. 4
. Vacuum-adjusting
device for Vacutainer tubes.

f
ORNL DWG 79-1284R2
FEED TANK
*CALIBRATION TUBE
47 I
I I
0 I I I
I I A I I I
I
ELECTRODY NE SPEED CONTROLLER
MOORE P/E TRANSDUCER
FOXBORO F R C /NSC P I E TRANSDUCER
+ TO HEWLETT - PACKARD ----- SCANNER
I I I I I
PNEUMATIC d / p CELL
CAPILLARY (4.07mm I D )
FILTER F M I ( 5 0 p m ) PUMP TO MIXER-SETTLERS
Fig. 5. Metering system f o r feed solutions, typical of six cir- cuits. The capillary is housed in a thermostated air bath.
10
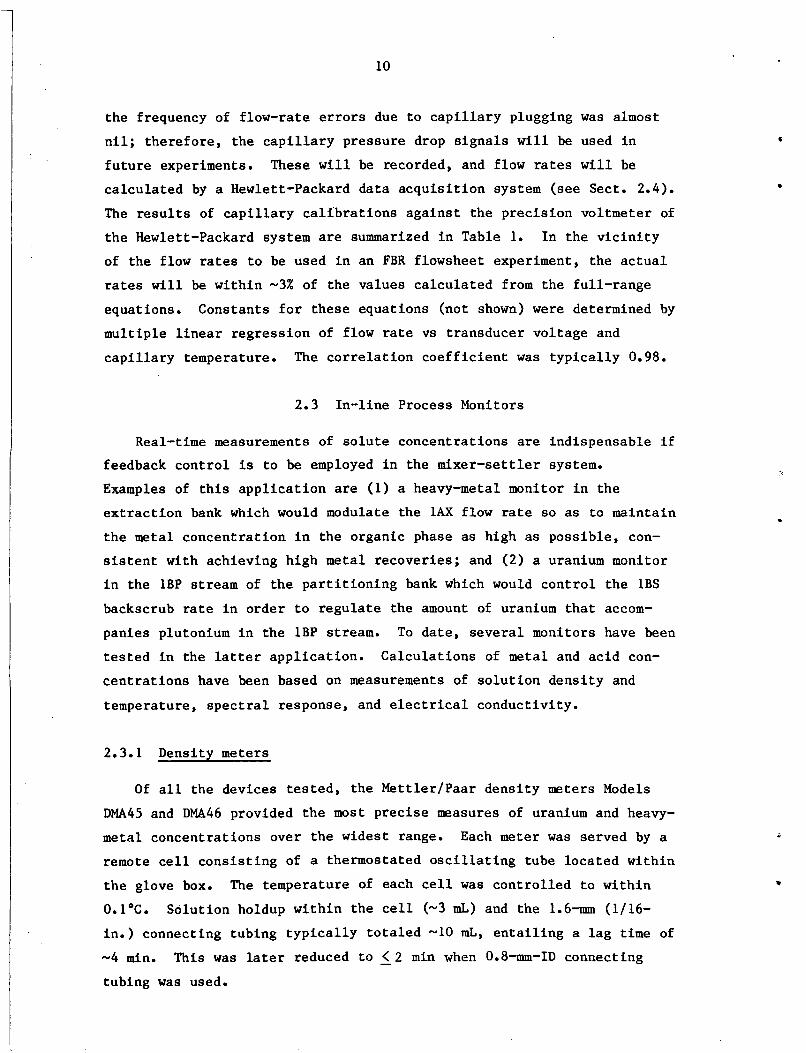
the frequency of flow-rate errors due to capillary plugging was almost
nil; therefore, the capillary pressure drop signals will be used in
future experiments. These will be recorded, and flow rates will be calculated by a Hewlett-Packard data acquisition system (see Sect. 2.4).
The results of capillary calibrations against the precision voltmeter of
the Hewlett-Packard system are summarized in Table 1. In the vicinity
of the flow rates to be used in an FBR flowsheet experiment, the actual
rates will be within -3% of the values calculated from the full-range
equations. Constants for these equations (not shown) were determined by
multiple linear regression of flow rate vs transducer voltage and
capillary temperature. The correlation coefficient was typically 0.98.
2.3 In-line Process Monitors
Real-time measurements of solute concentrations are indispensable if feedback control is to be employed in the mixer-settler system. Examples of this application are (1) a heavy-metal monitor in the extraction bank which would modulate the 1AX flow rate so as to maintain
the metal concentration in the organic phase as high as possible, con- sistent with achieving high metal recoveries; and (2) a uranium monitor
in the 1BP stream of the partitioning bank which would control the 1BS
backscrub rate in order to regulate the amount of uranium that accom-
panies plutonium in the 1BP stream. To date, several monitors have been tested in the latter application. Calculations of metal and acid con-
centrations have been based on measurements of solution density and
temperature, spectral response, and electrical conductivity.
2.3.1 Density meters
Of all the devices tested, the Mettler/Paar density meters Models
DMA45 and DMA46 provided the most precise measures of uranium and heavy-
metal concentrations over the widest range. Each meter was served by a
remote cell consisting of a thermostated oscillating tube located within
the glove box. The temperature of each cell was controlled to within
0.1OC. Solution holdup within the cell (-3 mL) and the 1.6-mm (1/16- in.) connecting tubing typically totaled -10 mL, entailing a lag time of
-4 min. tubing was used.
This was later reduced to 1 2 min when 0.8-mm-ID connecting
.

Tab le 1. R e s u l t s of c a p i l l a r y c a l i b r a t i o n s n e a r r e f e r e n c e f l o w rate v a l u e s
Dimensions of c a p i l l a r i e s : 1.07 mm I D by 1 .2 t o 4.6 m l o n g Form of t h e f u l l - r a n g e e q u a t i o n s : C = K1 + K2V + K 3 t
C a p i l l a r y Temp. No. . ("C)
T e s t s o l u t i o n
Flow rate (mL/min) Ref. Test
P I E t r a n s d u c e r v o l t a g e ( V k l o ) Ca/c tes t cb /c tes t C /C t es t
2 29.6 3 M HNO3 0.11 0.099 5.441 2 0.051 1.040 0.910 0.975
3 32.7 30% TBP-NDD 1.71 1.70 7.437 2 0.006 1.031 1.022 1.026
4 29.4 3 M HNO3 0.17 0.153 7.256 k 0.001 1.021 1.013 1.017
5 31.2 H20 1.67 1.69 6.743 +_ 0.001 1.007 1.000 1.004
-
-
6 32.8 90 g/L HML30% TBP 1.76 1.70 9.035 2 0.013 1.025 1.016 1.021
8 29.5 0.3 M HNO3 0.22 0.19 4.986 +_ 0.002 0.999 0.982 0.990 -
aFlow rate c a l c u l a t e d at (F + l a ) and (T + 0 . l " C ) . bFlow r a t e c a l c u l a t e d a t <V - l a ) and (T - 0.1"C). CFlow r a t e c a l c u l a t e d a t V,T. dHM = heavy metal.

12
The analytical results for 1-mL samples taken from the 1AP and 1BU
streams (experiment UX-2) showed excellent agreement with uranium con- centrations calculated from the in-line density measurements provided by
the Mettler/Parr density meters. Uranium concentrations for 17 density readings of the 1BU stream were calculated for the organic phase by
using the appropriate equation developed by D. R. Johnson of the
Savannah River Laboratory: 1
where dT measured density at temperature T ("C).
The calculated average (and standard deviation) was 71.4 f 0.3 g/L
(based on an assumed 0.02 - M H >, as compared with 71.7 k 0.3 g/L by the + Davies-Gray titrimetry procedure. The corresponding concentrations for the 1AP stream were 89.1 k 0.3 g/L and 90.5 k 1.4 g/L.
acid concentration on the calculated uranium concentration was small for
the expected range of acid concentration for the organic phase; this
concentration was closely estimated by computer calculations using the
SEPHIS2 code.
The effect of
Much wider ranges of nitric acid concentration are possible in the aqueous phase, depending on flowsheet conditions. Therefore, a measure-
ment of nitric acid concentration is required as input for the calcula-
tion of metal concentration. For the 1BP aqueous product stream, a
flow-type electrical conductivity cell was placed in series with the
Mettler/Paar density meter. The conductivity cell, designed by J. E.
Strain of the ORNL Analytical Chemistry Division, provided an excellent
measure of acid concentration. Since no direct determination of pluto-
nium concentration could be made during experiment PX-3, the calculated
heavy-metal concentrations in the 1BP product stream were biased on the
high side by -1 to 2 g/L (Fig. 6), which was not a significant error for control purposes. made from analytical measurements of plutonium and acid concentration in
conjunction with density measurements using the following equation
(origin detailed in Appendix C):
Post-run calculations of uranium concentrations were

13
ORNL DWG 80-142R2 20
18
n
46 \ CT U
0 0 0
- - 14 2 I U
42
10
1 I I I ,
o / / /
/ i: / / O /
- / O ‘ / /’
/”’ o / EXPERIMENT P X - 3
/ f I I I I I
20 40 42 44 46 18
[HMI ( g / L )
Fig. 6. Heavy-metal concentration calculated as f ( p , T, [H+]) vs+ heavy-metal concentration by wet analysis. = 0.48 to 0.52 - M; T = 39.8 to 40°C.
[Pu] = 4.50 * 0 . 2 g/L; [H ]

14
dT - 0.000286T + 0.00573 1.020 - 0.000773T [U](g/L) = 739.69
- 0.99707 - 0.001516 [Pu] g/L - 0.032191 r$], The resulting heavy-metal concentrations were biased on the high side by
2 g/L - not significantly different from the results obtained by using Eq. (1). Normally, either the uranium or the plutonium concentration
will be known from an in-line measurement, and a density determination
will permit the calculation of the second metal from a relationship
similar to Eq. (2).
. - 1
2.3.2 Spectrophotometers
The spectrophotometric determination of uranium concentration in the
presence of nitric acid was demonstrated by a dual-wavelength method3 for aqueous solutions. However, the application of this method
to glove-box use was not immediately practicable because of the lack of space for a suitable spectrophotometer. However, open glove-box experi-
ments were carried out (before plutonium was used) to demonstrate the principle. A very small spectrophotometer for measurements at a single
wavelength was successfully tested for later use within the glove box.
Preliminary measurements of uranium concentration with a laboratory
spectrophotometer gave encouraging results. A Perkin-Elmer Model 570
spectrophotometer (located outside the glove box) with a 5-mm flow cell
was provided with a continuous sample of the 1CU stream (uranium con-
centration, -70 g/L) during open glove-box tests with uranium only. Aside from a minor problem with deposition of carbon on the cell windows
(from the carbon liner of the sample transfer pump), this type of in-
line monitor appeared promising.
For a more accurate evaluation of the technique, three solutions were prepared by dilution of a stock solution, and an all-ceramic-and-
Teflon FMI pump was used for continuous solution transfer. The follow-
ing equation, developed by D. T. B~stick,~ was employed in the
calculations:
. .~.. . . ... . . . . . .-. . . . . . i

15
where absorbance values are for a l-mm pathlength.
The results are shown in Table 2. A Beckman DB-G spectrophotometer was used successfully to measure uranium concentrations in the range of 5 to
10 g/L in the aqueous phase (Sect. 3.1.3).
The dual-wavelength technique was judged t o be sufficiently promis- ing that penetrations were built into the glove box to accommodate the
light pipes which would be required to connect an internal cell with an
external spectrophotometer, in the event that a prototype instrument
should become available as a result of developmental work in the
Instrumentation and Controls Division. The use of such an instrument
would be directed primarily toward the determination of plutonium.
A miniature spectrophotometer (Bausch & Lomb Spectronic Mini-20) was obtained for permanent use inside the glove box. A 10-mm quartz flow
cell was fabricated, and the spectrophotometer was calibrated with
aqueous uranium solutions in the 3- to 30-g/L range. Response was
linear at 416 nm over a nitric acid concentration range of 0.03 to
- M. Suggested settings for plutonium measurements5 were 476 nm for Pu4+ (below 0.5 - M H+) and 565 nm for Pu3+,
0.25
2.4 Automatic Data Acquisition System
The objectives of the plutonium flowsheet work require the accurate measurement and recording of very small flow rates in order for the
experimental results to be confidently scaled to larger systems. A
Hewlett-Packard data acquisition system was purchased to meet that goal, as well as to record and reduce the data from in-line monitors and to
print and plot the experimental results.
Hewlett-Packard components already in place include the calculator
(Model 98258), the scanner (Model 3495A), the digital voltmeter (Model
3455A), and the printer (Model 9866B). Programming work, by J. T.
Hutton of the Instrumentation and Controls Division, has been completed
for the following tasks:

16
Table 2. Spectrophotometric determination of uranium concentrations
Nominal Reported Calculated concentrationa concentrationb concentration'
W I [H+l [ U I [H+l [ V I Solution ( g / L ) (E) ( g / L ) (E) ( g / L )
1 31.9 0.26 30.6 0.29 32.1
2 63.8 0.53 61.4 0.55 60.7
3 95.7 0.79 94.0 0.83 86.8
aBy dilution.
bBy ORNL Analytical Chemistry Division.
CBy using Eq. (1).

1.
2.
3.
4 .
5 .
The
no t y e t
17
pre-experiment entr ies t o i d e n t i f y a l l streams (up t o 17), t h e i r source , d e s t i n a t i o n , and c a p i l l a r y flowmeter, i f any;
scanning r o u t i n e s f o r 19 thermocouples, 8 c a p i l l a r y flow
meters, 2 l i q u i d l e v e l probes, and 2 d e n s i t y meters;
c a l c u l a t i o n of flow rates based on c a p i l l a r y flowmeters
and by l i n e a r r e g r e s s i o n on t h e volumes of t h e feed tanks
and r e c e i v e r s ;
c a l c u l a t i o n of vo lumetr ic ba lances f o r aqueous and o rgan ic
phases, f o r each bank;
t h e c a l c u l a t i o n of heavy-metal concen t r a t ions from i n - l i n e
d e n s i t y meters.
p l o t t e r (Model 9872A) and t h e multiprogrammer (Model 6940B) have
been connected. The f i r s t t a s k ass igned t o t h e multiprogrammer
i s process automation t o c o n t r o l t he s o l u t i o n loading i n a s e l e c t e d
s t a g e of t h e e x t r a c t i o n bank.
meter will provide t h e measure of metal c o n c e n t r a t i o n t o t h e c o n t r o l
loop.
example, t h e 1AX e x t r a c t a n t feed.
An i n - l i n e d e n s i t y meter o r spec t rophoto-
The c o n t r o l l e r ou tput w i l l vary t h e pumping rate o f , f o r
3. EXPERIMENTAL RESULTS - PARTIAL PARTITIONING OF
URANIUM-PLUTONIUM
Experimental work f o r t h i s i n i t i a l phase of t h e f lowshee t develop-
ment program w a s c a r r i e d ou t i n two s t a g e s :
g love boxes wi th uranium, and (2 ) c losed glove-box runs wi th plutonium
and uranium.
( 1 ) shakedown runs i n open
3.1 Shakedown Experiments
The open glove-box work inc luded tests t o v e r i f y flow rate c o n t r o l
f o r a l l feed streams, tests of t h e sampling system, and experiments t o
e s t a b l i s h a range of flow rates, flow rate ratios, and stirrer speeds

18
which produced acceptable hydraulic performances with reference solution
compositions. Uranium-plutonium partitioning performance in the B bank
was judged on the basis of the observed concentration of uranium and the
hypothetical concentration of plutonium in the 1BP product stream. The desired range for the Pu/(Pu + U) ratio in the 1BP stream was 0.25 to
0.40.
3.1.1 Experiment UX-1
Preliminary operation of the mixer-settlers was carried out at nomi-
~l flow rates and concentrations based on flowsheet conditions shown in
Fig. 7 and Table 3 in order to select suitable agitator settings (depth and speed) for the initial flowsheet experiment (UX-1).
Following initial operation of about 8 h, the system was shut down and samples were taken from one-fourth of the settling compartments; at this point, uranium concentrations were at 50 to 80% of the final
steady-state values. After an overnight shutdown, the experiment was
resumed; approximately steady-state concentrations in the 1BP and 1CU
streams were reached in -350 min (Fig. 8). Over the final 200 min
of the experiment, uranium analyses of the two streams showed a rate of
concentration increase of only 0.02% per minute. Continuous in-line
measurements of 1AP solution density indicated an average value of
0.9125 with a standard deviation of 0.0006, equivalent to 77.9 2 0.5
g/L.
equivalent to a Pu/HM* ratio of 0.35 if plutonium had been present in
the 1AF feed. For the B bank and much of the C bank, measured post-run
uranium stage concentrations were in good agreement with values calcu-
lated by the SEPHIS program. The measured/calculated concentration
ratio was generally 80 to 90%.
The uranium concentration in the 1BP stream would have been
3.1.2 Experiment UX-2
The agitator depth settings for experiment UX-1 covered a range of
values. Small changes were made, while operating at reference feed
rates, in order to arrive at a limited number of depth settings for
*HM = heavy metal.

ORNL DWG 80-247R
Fig. 7. Reference conditions for uranium-plutonium partial par- titioning flowsheet experiments. approximate; actual flow rates are tabulated in Appendix A.
Relative flow rates (circled) are

20
Table 3. Composition of feed solutions for partitioning experiments
b
Experiment Stream Component ux- 1 ux-2 ux-3 PX-2 PX-3
b
1AS n+, - M
1 BX HAN,a - M HYE,b - M
n+, - M
HAN, M
HYE, - M
H+, - M
- 1cx
1AX n+, - M
1 BS H+, - M
280.8
-
30.9
0.5
0.06
0.1
0.14
0.02
0.01
0.01
275.2 275.6
- - 3.02 3.03
<0.01 0.54
0.06 0.05
0.09 0.08
0.23 0.16
0.02 0.008
0.01 0.015
0.02 0.004
0.01 0.01
0.01 0.01
277.6
2.97
2.99
0.5
0.06
0.11
0.21
0.01
0.02
0.02
259.6
2.98
3.23
0.77
0.06
0.10
0.18
0.04
0.05
0.03
aHAN = hydroxylamine nitrate.
bHYE = hydrazine nitrate.

21
400 - I I I I I - - - - -m-m--.-m-m-m-m
- -
h
-J \ CT v
z I-
CK I- z W 0 z
0 10
a -
1cu -I -8-m 1 m-a-a - - - -
.- -
1 ,o-0 d -
- - 1BP I - - /O-O-o-o -
,0-0 - -
/O -
- /O
- - 0 -
0
2 3 2
K 3 -
0
- - - 0 - a - - - -
- - - - EXPERIMENT UX-1 -
I I I I I 0.2

22
experiment UX-2, These are summarized i n Appendix B. The a g i t a t o r
speed w a s increased i n 50-rpm increments t o e s t a b l i s h a va lue j u s t s h o r t
of producing organic-phase underflow.
The glove boxes were enc losed , and experiment UX-2 wi th uranium w a s
c a r r i e d out t o demonstrate that the necessary manipula t ions could be
performed through t h e gloves. P r i o r t o the experiment, t h e feed so lu-
t i o n (uranium concen t r a t ion , 280 g/L) was f i l t e r e d through an uncoated
Vacco etched-disc f i l t e r (pore s i z e , -1 vm) a t t h e rate of -1 mL min-'
cm'2 and a p r e s s u r e d i f f e r e n c e of -85 kPa (-0.85 atm) i n o rde r t o
e s t a b l i s h a r e f e r e n c e rate f o r a clean so lu t ion .
A t o t a l l i q u i d feed rate t o t h e system of 4 mL/min, which was -25%
lower than t h a t f o r experiment T-1, r e s u l t e d i n improved h y d r a u l i c
behavior. Flow rate c o n t r o l w a s very p r e c i s e , as confirmed by p res su re
drop record ings f o r a l l metering c a p i l l a r i e s (see a l s o Table 1).
A n a l y t i c a l r e s u l t s showed t h a t t h e uranium concen t r a t ions i n t h e 1AW
and 1CW streams cont inued t o d e c r e a s e du r ing the 500-min run (Fig. 9),
a l though t h e streams monitored by t h e d e n s i t y meters, 1AP and l B U , were
a t s t eady s ta te f o r >300 min (Fig. 10). This i l l u s t r a t e d t h a t t h e 1AP
and 1 B U monitors provided a u s e f u l measure of the approach t o s t e a d y
s ta te f o r cer ta in s t a g e s . Not s u r p r i s i n g l y , however, t h e approach t o
s t eady s t a t e i n streams 1AW and 1CW could no t be sensed by t h i s i n d i r e c t
measurement. Uranium c o n c e n t r a t i o n i n t h e 1BP stream i n i t i a l l y l e v e l e d
o f f a t a s a t i s f a c t o r y va lue of -13 g/L but l a t e r exceeded 36 g/L as t h e
low a c i d c o n c e n t r a t i o n i n t h e 1AS took e f f e c t . The high uranium con-
c e n t r a t i o n would have been equ iva len t t o a n unacceptably low va lue of
-12% plutonium i n t h e uranium-plutonium product , if plutonium had been
p resen t i n t h e 1AF stream.
3 . 1 . 3 Experiment UX-3
A f i n a l uranium experiment, UX-3, w a s performed t o demonstrate that
t h e r equ i r ed uranium c o n c e n t r a t i o n of 6 t o 12 g/L could be maintained i n
t h e 1BP stream, where t h e plutonium c o n c e n t r a t i o n w i l l be -4 g/L. The
1BP stream w a s cont inuous ly monitored by two i n - l i n e in s t rumen t s : a

23
ORNL DWG 80-134R 1
I I I
I
EXPERIMENT UX-2
cw E
W
A 1AW
a A
W
A
W
8
W
W
W
A A A
A A
W
W
A W A
A
1 1 I I I I
0.001 ' 4 00 200 300 400 500 0 TIME (min)
Fig. 9. Uranium concentration vs time for aqueous waste stream 1AW and stripped organic stream 1CW.

24
ORNL DWG 80-435R too 90 80 70
60
50
40
30
20
40
4cu
EXPERIMENT U X - 2
0 100 200 300 400 500 TIME ( m i d
Fig. 10. Uranium concentration vs time for high-concentration streams. Analyses by Davies-Gray titrimetry.

25
Beckman spectrophotometer (Model DB-G) and a Mettler/Parr density meter (Model DMA45). A nearly steady-state uranium concentration of 8 g/L
(equivalent to -33% plutonium) was obtained after 300 min. The 1BS
organic backscrub rate was then increased from 0.25 to 0.26 mL/min in
order to reduce the uranium concentration (Fig. 11). The uranium con-
c e n t r a t i o n subsequent ly reached the d e s i r e d value of 6 g/L, where i t was held for the remainder of the run. Results for five flowing stream
samples and ten in-line determinations from this time interval were as
follows :
Analytical results Spectrophotometer 4.76 k 0.19 g/L
5.87 * 0.072 g/L
Density meter 4.28 * 0.15 g/L
Post-run acid analyses were used to calculate uranium concentrations
from the density meter measurements.
3.2 Plutonium-Uranium Partitioning Experiments
Changes made to the system in preparation for the experiments with
plutonium included the following: (1) the flow path of 1BP solution to
the densitometer was made once-through in order to reduce the effective
time lag from >1 h to a few minutes, and (2) the spectrophotometer cell
was removed from the 1BP stream since no means was yet available for carrying the light beam to a spectrophotometer outside the glove box.
3.2.1 Experiment PX-2
Following several hours of operation with plutonium, the experiment
was interrupted in order to investigate the low HTI concentration in the
1BP stream, as indicated by the density meter. The cause was traced to
the differential pressure transmitter used to control the 1AF feed rate.
The presence of a small volume of air in the high-pressure chamber per-
mitted the chamber to act as a pneumatic accumulator, as follows: dur-
ing the pump discharge stroke, solution from the pump was forced into

cr
o
rm
00-2
0
n 0
P
UR
AN
IUM
CO
NC
ENTR
ATI
ON
, 4 B
P ST
REA
M (
g/L
1 &
&
P
Q,
d
"I"""'
i? I
I I
I I
I I
9z

27
t h e chamber (due t o back p res su re from t h e r e s t r i c t i n g c a p i l l a r y ) , where
i t w a s mixed wi th a l a r g e volume of s o l u t i o n which i n i t i a l l y conta ined
no plutonium. During t h e s u c t i o n s t r o k e of t h e pump, t h e compressed a i r
volume i n t h e chamber expanded s l i g h t l y , d e l i v e r i n g a now-diluted so lu-
t i o n t o t h e c a p i l l a r y . I n o rde r t o proceed wi th t h e experiment, i t was
necessary t o remove t h e t r a n s m i t t e r and metering c a p i l l a r y from t h e
s o l u t i o n c i r c u i t and s h i f t t h e flow c o n t r o l t o manual s e l e c t i o n of t h e
r equ i r ed speed f o r t h e servomotor.
The m i x e r - s e t t l e r s were emptied and the experiment was resumed.
A f t e r -6 h of ope ra t ion and overn ight shutdown, t h e flows were
r e s t a r t e d , and sampling w a s begun. The a n a l y t i c a l r e s u l t s (Fig. 12)
showed a d e c l i n e i n uranium c o n c e n t r a t i o n from i t s peak, fo l lowing an
i n c r e a s e i n t h e o rgan ic backscrub r a t e a t 215 min. Throughout t h e f i n a l
90 min of t h e run, t h e average plutonium c o n c e n t r a t i o n of 4.2 g/L w a s i n
e x c e l l e n t agreement wi th t h e expected va lue (Fig. 13, s t a g e No. 3 2 ) .
The average uranium concen t r a t ion , 8.6 g/L (Fig. l l ) , w a s substan-
t i a l l y h ighe r than 2.5 g/L, t h e concen t r a t ion p red ic t ed by t h e SEPHIS
program f o r t h e run cond i t ions . This d i screpancy was due, a t least i n
p a r t , t o t h e organic-phase underflow observed i n t h e second backscrub
s t age .
The Pu/HM r a t i o was w e l l w i th in t h e d e s i r e d range throughout t h e
f i n a l 400 min of t he experiment (Fig. 14) . This obse rva t ion confirmed
t h a t c o n t r o l of t h e r a t i o by t h e o rgan ic backscrub ra te is f e a s i b l e i n
cases where an in - l ine monitor provides a measure of t h e r a t i o . During
t h e experiment, t h e r a t i o w a s i n f e r r e d from t h e measurement of t o t a l HM
concen t r a t ion .
Both t h e plutonium and t h e uranium l o s s e s t o the 1AW s t ream were
<0.001% of the t o t a l metal i n t h e feed. The downward t r end f o r uranium
l o s s e s t o t h e 1AW wi th t i m e (Fig. 15) w a s similar t o t h a t observed i n
ea r l ie r experiments. The plutonium l o s s e s , a l though c h a r a c t e r i z e d by
wide v a r i a t i o n s i n concen t r a t ion , roughly p a r a l l e l e d the t rend f o r ura-
nium l o s s e s . The amount of plutonium l o s t t o t h e 1CW r e c y c l e so lven t
w a s <O . 000 1%.

2 0
15
10
28
O R N L DWG 79-1281 R
EXPERIMENT PX- 2
i\ ( P U + U )
I I I I I
0 100 200 300 400 500 600
TIME ( m i d
Fig. 12. Metal concentration in the 1BP product stream vs time. Organic backscrub, lBS, was increased from 4.17 to 4.67 v L / s (0.25 to 0.28 mL/min) at 215 min. Temperature of mixer-settler, 42-44OC.

10L I I I 1 1 1 I I I I I 12 - - - - - o EXPERIMENTAL -
SEPHIS
8 16 24 32 40 48 0.0001 0
STAGE NUMBER
Fig. 13. Plutonium concentration in aqueous phase vs stage number. Comparison of experimental measurements (post-run sampling) with con- centration calculated by the SEPHIS program.

30
0.80
- 0.70 n 3 + 3 a LI ‘ 0.60 n 3 a U Y
a m - 0.50 z z 0
b 0.40 a U LL
a
-
-
J
0.30
0 2 0
ORNL DWG 79-1282R2
I I I I I
EXPERIMENT PX-2
- 3- 0-0
\ 0
\ 0 ‘0-0- 0 MO-0 - 0,
‘ O 4 0 /ONO-O O b
0 100 200 300 400 500 600
TIME ( m i n )
Fig. 14. Plutonium/heavy metal r a t i o of 1BP product stream vs t i m e . Hor i zon ta l dashed l i n e s d e f i n e t h e d e s i r e d range: 0.25 t o 0.40 plu to- nium f r a c t i o n .

31
ORNL DWG 80-140R
3
I- LT t- z w
a
\
TIME ( m i n )
Fig.. 15. stream vs time.
Uranium and plutonium concentrations in the 1AW waste

3.2.2
32
Experiment PX-3
The r e s u l t s ob ta ined f o r experiment PX-3 demonstrated t h a t t h e
d e s i r e d Pu/HM r a t i o of 0.25 t o 0.40 could be a t t a i n e d i n t h e 1BP product
stream d e s p i t e a r e l a t i v e l y high a c i d c o n c e n t r a t i o n (1 M HNO3) i n t h e
1AS stream. Otherwise, t h e feed s o l u t i o n s (Table 3) and flow rates
(Appendix A) were almost i d e n t i c a l t o those f o r experiment PX-2.
-
Following pre l iminary o p e r a t i o n dur ing which t h e product composition
ranged from 37 t o 45% plutonium, t h e 1BX feed composition w a s found t o
be too concent ra ted i n hydroxylamine n i t r a t e (HAN). Therefore , a new
feed s o l u t i o n was prepared be fo re run PX-3 w a s resumed. The composition
of t h e product was c o n t r o l l e d by v a r i a t i o n s i n t h e flow rate of t h e 1BX
p a r t i t i o n i n g s o l u t i o n s i n c e an exper imenta l t e s t of SEPHIS c a l c u l a t i o n s
a t nominal run cond i t ions had shown t h i s t o be a more e f f e c t i v e means of
c o n t r o l than vary ing t h e 1BS o rgan ic backscrub rate. However, t h e
exper imenta l response of uranium c o n c e n t r a t i o n i n t h e product stream
appeared t o be only weakly coupled t o the 1BX r a t e . The l a r g e s t change
i n ra te (-6% reduc t ion ) d i d not produce a c l e a r l y i d e n t i f i a b l e response
i n the 1BP composition over t h e f i n a l 250 min of t h e run. The Pu/W
r a t i o a t t h e end of t h e run was near s t eady s ta te a t a va lue of 0.25
(Fig. 1 6 ) , wi th t h e uranium c o n c e n t r a t i o n i n c r e a s i n g only 0.8 g/L over
t h e f i n a l 90 min.
4. CONCLUSIONS
The min ia tu re mixe r - se t t l e r f a c i l i t y has proved t o be a f l e x i b l e
system f o r examining p rospec t ive uranium-plutonium f lowsheets . The
tests were performed without f i s s i o n products. Con t ro l of t he Pu/(Pu+U)
r a t i o i n t h e product stream was s u c c e s s f u l l y demonstrated f o r a flow-
s h e e t i n which t h e r a t i o w a s r egu la t ed by v a r i a t i o n of t h e o rgan ic back-
sc rub (1BS) rate.
Liquid flow rates were a c c u r a t e l y measured and c o n t r o l l e d a t very
low va lues , us ing c a p i l l a r y flow elements, d e s p i t e t h e p u l s a t i n g output
from the piston-type meter ing pumps.

33
0.8
0.7
a 0.5 m
z I- O LT LL
0 0.4
a
c? 0.3
0.2
ORNL DWG 80-141R
EXPERIMENT P X - 3
k\ BX COMPOSITION CHANGE
I / o
‘ I
- I \ 0 ‘0
\ 0 /O\ 0
I I I I 1 0 100 200 300 400 500 600
TIME ( m i n )
Fig. 16. Plutonium f r a c t i o n i n the 1BP stream vs t i m e . Hor i zon ta l dashed l i n e s de f ine the d e s i r e d range: 0.25 t o 0.40 plutonium f r a c t i o n .

34
In-line Mettler/Paar density monitors were very valuable for control
purposes. For uranium concentration, excellent agreement was obtained
between wet-chemical analyses and values calculated from Savannah River
Laboratory equations using measured densities and temperatures. For the
uranium-plutonium systems, the concentration of one of the heavy metals
must either be estimated or determined by an independent means (e.g., spectrophotometrically) in order to calculate the concentration of the second metal from the density measurements.
The in-line spectrophotometer proved to be an excellent monitor of uranium concentration in the aqueous phase based on absorbance measure-
ments at 416 and 426 nm. A miniature spectrophotometer for glove-box
operation displayed linear response over a concentration range of 3 to 30 g/L at 416 nm. The miniature spectrophotometer also appeared to be useful for Pu4+ measurements at 476 nm.
5. ACKNOWLEDGMENTS
The authors wish to thank D. F. Green, R. L. Hickey, and G. C.
Young for their assistance in carrying out the experiments. Gratitude
is also expressed to W. D. Bond, D. J. Crouse, and A. D. Mitchell for
their consultations on experimental design. Special appreciation is due
D. J. Crouse and V. C. A. Vaughen for their helpful suggestions as tech-
nical reviewers of this report.

35
6. REFERENCES
1.
2.
3.
4 .
5.
W. D. Burch et al., Consolidated Fuel Reprocessing Program Progress Report for Period January 1 to March 31, 1979, ORNL/TM-6836 (June 1979).
A. D. Mitchell, SEPHIS-MOD 4 : A User's Manual to a Revised Model of the Purex Solvent Extraction System, ORNL-5471 (May 1979).
D. T. Bostick, The Simultaneous Analysis of Uranium and Nitrate, ORNL/TM-6292 (April 19/9).
D. T. Bostick, "Acid Compensated Multiwavelength Determination of Uranium in Process Streams," presented at Measurement Technology for Safeguards and Material Control Conference, Charleston, S.C., Nov. 26-30, 1979.
D. T. Bostick, ORNL, personal communication (Jan. 9, 1980).

37
7. APPENDIXES

38
Appendix A: Summary of Flow Rates and Flow Ratios for Uranium-Plutonium Partitioning Experiments
Feed rate (mL/min)
1AF 1AS LAX 1 BX 1BS 1cx
Total
Relative feed rate
1AF 1AS 1AX 1 BX 1 BS 1cx
Total flow ratea
Extraction Scrub Backscrub Partition Strip
r rl
Experiment ux-1 ug=r ux-3 PX-2 PX-3 - L
0.540 0.428 0.423 0.420 0.432 0.222 0.158 0.170 0.169 0.166 1.899 1.409 1.467 1.455 1.470 0.368 0.283 0.282 0.299 0.311 0.311 0.225 0.251 0.287 0.293 2.11 1.568 1.888 1.912 2.017 5.45 4.07 4.48 4.54 4.69
1 1 1 1 1 0.41 0.37 0.40 0.40 0.38 3.5 3.3 3.5 3.5 3.4 0.68 0.66 0.67 0.71 0.72 0.58 0.53 0.59 0.68 0.68 3.9 3.7 4.5 4.6 4.7
2.661 1.995 2.06 2.044 2.068 2.121 1.567 1.637 1.624 1.636 0.679 0.508 0.533 0.586 0.604 2.267 1.917 2.000 2.041 2.074 4.009 2.977 3.355 3.367 3.487
Organic/aqueous flow ratio
Extraction Scrub Backs c r ub Partition Strip
2.34 2.40 2.47 2.48 2.46 8.55 8.92 8.63 8.77 8.86 0.85 0.795 0.89 0.85 0.94 6.00 5.77 6.09 5.85 5.67 1.05 1.042 0.910 0.910 0.874
a Total flow rate = summation of countercurrent aqueous and organic flows.

P
a
a
a
39
$3
*.
i
a a
UP
m
I E 6
5 5 $ b
N
I m u B rl b a a
X
W & 0
W
a aJ aJ a
VI
rl
a
rl U
a U
2 s 2
a m
4
U
U
Q)
VI
5 a" a
b 0
U
a U
rl
2 .. a X
rl a a
5 4
9
In
U
m
N
rl
01 M
a U
V
I
N
h
0
m
b . 0
b . U
b . m
b . m
b . a3
9
In
9 . m
b . In
9 . In
9 . 0
9
In
b . In
d . \o
co 0
0
d
0 9) 0
C
aJ M
b
0)
P 3
VI
a
N
m
d
m
0
m
m
N
03 N
r- N
9
N
In
N
In
N . d
N
m . 4 In
m . d
In
N . d
In
N 0
d
m m
m
m
m
dm
N
om
N
m
2
co U
b
U
9
U
In
U
e
U
m
U
N
U
l-4 U
0
U
m
m
00 m
b
m
9
cr)
In
m
U
m
cr) m
aJ M
a
U
V
I
N
h
0
b
h
b
a3
9
0
E: In
"0. $I
U . d d m
In
9
a3
In
9
In
co co
0 9) 0
C
Q)
M
&
aJ B n
3
VI
. aJ m a ca 0
rl C
a
bo 8 30 w 0
rl
w b Q) a C
P
P
d 0
In
In
d
a

40
Appendix C: Uranium Concentration in Aqueous Solution
and Nitric Acid Concentration as a Function of Density, Plutonium Concentration,
The following equation defines solution density in terms of the usual solution components:
+ 0.39404 [VIM + 0.49202 [PU]M + 0.063 [H+]M + 0.213 [N03-]~ - - - - In the absence of fission product nitrates, this reduces to
Substituting into Johnson's equation** for temperature dependency for
aqueous solutions containing uranium and H+ (between 20 and 55OC),
dT = 1.020 d25 + 0.000286(T) - 0.000773 d25T - 0.00573, results in
dT = [0.99707 + 0.321852 [ u ] ~ + 0.362401 [PU]M + 0.032191 [@]MI] - - -
x (1.020 - 0.000773T) + 0.000286T - 0.00573.
+ 0.032191 x [H+IM] (1.020 - 0.000773T) + 0.000286T - 0.00573, - and 0.000286T + 0.00573 dT ) - 0.99707
1.020 - 0.000773T [Pu], g/L = 659.628
1 - 0.001352 [u], g/L - 0.032191 [H+]M
[( 1.020 - 0.000773T
-
- 0.99707 1 dT - 0.000286T + 0.00573 and [U], g/L = 739.688
- 0.001516 [Pu], g/L - 0.032191 [H']
*Purex Manual.
**W. D. Burch et al., Consolidated Fuel Reprocessing Program Progress Report for Period January 1 to March 31, 1979, ORNL/TM-6836 (June 1979), pp. 2-29.

r
41
1. 2. 3. 4. 5. 6.
7-11. 12. 13. 14. 15. 16.
17-21. 22. 23. 24. 25. 26. 27.
28-32. 33. 34. 35. 36. 37. 38. 39. 40.
R. L. Anderson S. M. Babcock J. T. Bell J. E. Bigelow W. D. Bond G. L. Borsheim W. D. Burch J. A. Carter E. D. C o l l i n s J. L. C o l l i n s A. B. Crawford D. J. Crouse G. D. Davis R. D. E h r l i c h M. J. Feldman R. L. Fellows J. H. Goode W. S. Groenier P. A. Haas B. A. Hannaford F. E. Har r ington D. W. Holladay F. J. Hurst R. D. Hurt R. T. Jub in M. V. Keigan J. B. Kendall H. T. Kerr
ORNL/TM-7408 D i s t . Category UC-86
(-+Tm=s INTEKNAL DISTRIBUTION
41. 42. 43. 44. 45. 46. 47. 48. 49. 50. 51. 52. 53. 54. 55. 56. 57. 58. 59. 60. 61. 62. 63. 64.
65-66. 67. 68.
J. Q. Kirkman R. E. Leuze J. C. Mailen D. D. McCue R. E. Norman E. D. North J. R. P a r r o t t , Sr. R. L. Ph i l ippone W. W. P i t t , Jr. R. H. Powell D. J. P r u e t t R. H. Rainey J. H. S h a f f e r R. G. S tacy J. H. S tewar t , Jr. M. G. S tewar t J. R. S toke ly J. E. S t r a i n L. M. Toth W. E. Unger M. E. Whatley D. F. Williams R. G. Wymer 0. 0. Yarbro Labora tory Records Labora tory Records - RC ORNL P a t e n t S e c t i o n
EXTERNAL DISTRIBUTION
69-70. W. W. Ba l l a rd , Nuclear Fuel Cycle Div i s ion , O f f i c e of Light- Water Reac tors , U.S. Department of Energy, Washington, DC 20545
71. O f f i c e of A s s i s t a n t Manager f o r Energy Research and Development, U.S. Department of Energy - ORO, Oak Ridge, TN 37830
72-152. Given d i s t r i b u t i o n as shown i n TID-4500 under UC-86, Consol ida ted Fuel Reprocessing ca t egory (Applied)
*U S GOVERNMENT PRINTING OFFICE 1980 740 146/62