Plumas Lake Elementary School District 2013-14 Second Interim Presentation March 12, 2014.
25
Plumas Lake Elementary School District 2013-14 Second Interim Presentation March 12, 2014
-
Upload
belinda-melton -
Category
Documents
-
view
213 -
download
0
Transcript of Plumas Lake Elementary School District 2013-14 Second Interim Presentation March 12, 2014.

Plumas Lake Elementary School District
2013-14 Second Interim PresentationMarch 12, 2014

Financial Reporting Cycle• Annual financial reporting:
• Budget Adoption – Due July 1, 2013 • First Interim – Due December 16, 2013• Second Interim – Due March 17, 2014• Unaudited Actuals – Due September 15, 2014
• Budget is developed based on assumptions in June;• Assumptions are usually based on the information in the May Revise
• Assumptions change during the year and we are required to file two interim reports during the year:• First Interim – Due December 16, 2013• Second Interim – Due March 17, 2014
• Budget Timeline:• Governor released his Budget Proposal for 2013-14 in January• Governor released the May Revise in May, which is based on updated revenue and expenditure
data• Legislature met its constitutional deadline and passed the 2013-14 budget and trailer bills on
June 15 • Local Control Funding Formula -Changes how schools receive State Aid• Every district has a unique target base grant that will restore funding to 2007-08 funding
levels by full implementation • Districts will move toward the target each year• Governor signed budget bill in June
Budget development
is a continuous
process

GENERAL FUND – FUND 01

Local Control Funding Formula
• Local Control Funding Formula (LCFF) begins in 2013-14• Department of Finance estimates that achieving full funding levels under the LCFF
will take eight years• Funding based on the demographic profile of the students in the District• Goal is to simplify how state funding is provided• Local Control and Accountability Plan (LCAP) is an important component of LCFF
• District will be required to develop, adopt, and annually update a three year LCAP, beginning in July 1, 2014
• California Department of Education (CDE) making system changes to implement the new formula and does not expect to have those completed until July 2014

Local Control Funding Formula• Local Control Funding Formula (LCFF) has replaced revenue limits and works as
follows:• “Target Funding “level will be calculated every year
• Districts will receive a base grant amount based on grade-level • Adjustments will be made for class size reduction (grade span)• Districts will receive supplemental funding based on percentage of low income, English learners and
students in foster youth• Economic Recovery Target (ERT) is the difference between what the District would have received
under the old funding and the amount the District would receive under the LCFF in 2020-21 (with COLA adjustments)
• “Funding Floor” will be calculated based on 2012-13 Funding Level• Percentage of the “Gap” between the Target and Floor will be funded
• Categoricals are now a part of the LCFF with the exception of the following:• Transportation (add-on and can be used for any educational purpose)• Targeted Instructional Improvement Grant (TIIG) (add-on and can be used for any educational
purpose)• Special Ed • Child Nutrition
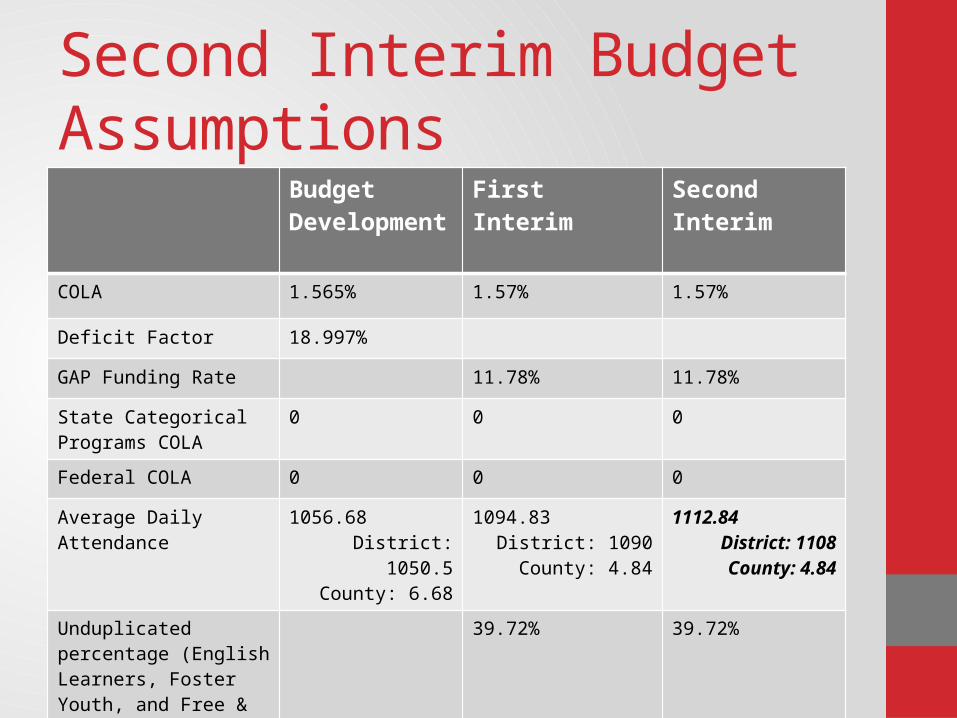
Second Interim Budget Assumptions
Budget Development
First Interim Second Interim
COLA 1.565% 1.57% 1.57%
Deficit Factor 18.997%
GAP Funding Rate 11.78% 11.78%
State Categorical Programs COLA
0 0 0
Federal COLA 0 0 0
Average Daily Attendance 1056.68District: 1050.5
County: 6.68
1094.83District: 1090County: 4.84
1112.84District: 1108County: 4.84
Unduplicated percentage (English Learners, Foster Youth, and Free & Reduced Price Meals)
39.72% 39.72%

Second Interim Budget Assumptions• Proposition 39 approved by voters on November 6, 2012
provided:• The Schools and Local Public Safety Protection Act of 2012 provides
funding through the Education Protection Account (EPA)• Not additional funding, State Aid is decreased by this amount• District will receive $1,179,455 in funding, which will be used for
teachers’ salaries• California Clean Energy Jobs Act
• Funding for clean energy projects – funded for five years• District will receive$106,252 in 2013-14 and in subsequent years
• Common Core State Standards Implementation (CCSSI) Funds – District received $216,437 in one-time funding

Budget Revisions• Board requested budget revisions:
• Riverside Meadows – added $10,000 for upgrades• Breakfast - $3,000 for free breakfast during testing• Infrastructure – Wi-Fi Nodes $5,000• Update District Web site - $5,000

2013-14 Revenue SourcesRevenue Source
2013-14Budget Development
2013-14 Budget First Interim (FI)
2013-14 Budget Second Interim (SI)
Changes (SI –FI)
Notes
Revenue Limit Sources
$6,529,561 7,441,642 $7,629,666 $188,024 LCFF Changes due toADA Changes
Federal Revenue
$277,734 $365,256 $369,770 $4,514 Impact Aid
Other State Revenue
$1,047,997 $598,640 $602,742 $4,102 Lottery
Other Local Revenue
$491,348 $444,853 $445,468 $615 Local revenue
Interfund Transfers In
$23,000 $23,000 $23,000 From Fund 52 for CFD Admin costs
Total Revenue
$8,369,640 $8,873,391 $9,070,646 $197,255
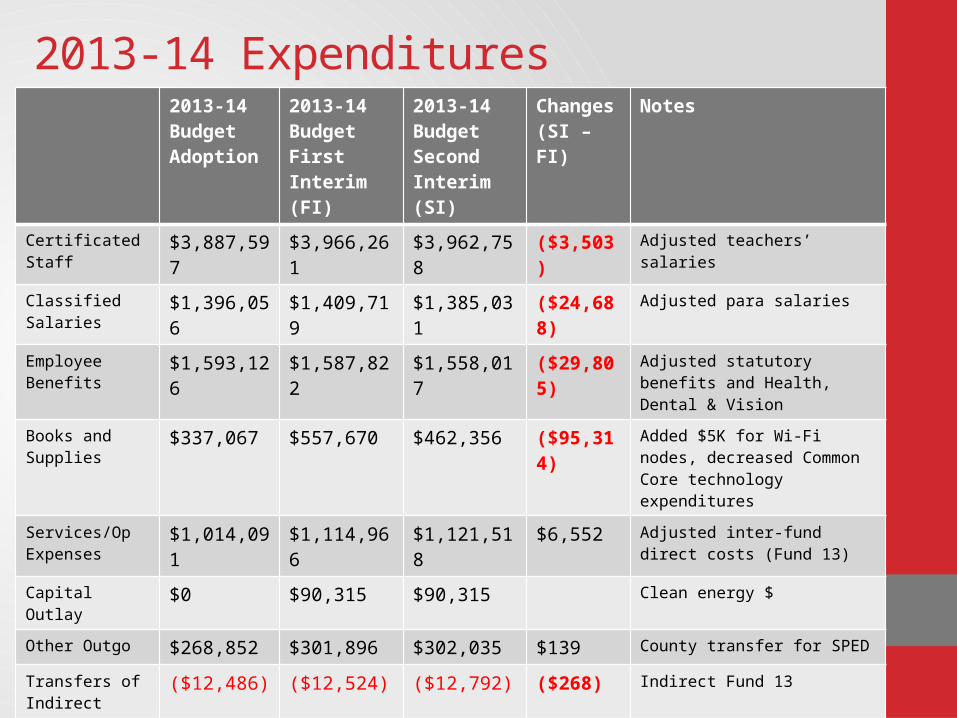
2013-14 Expenditures2013-14 Budget Adoption
2013-14 Budget First Interim (FI)
2013-14 Budget Second Interim (SI)
Changes (SI – FI)
Notes
Certificated Staff $3,887,597 $3,966,261 $3,962,758 ($3,503) Adjusted teachers’ salaries
Classified Salaries $1,396,056 $1,409,719 $1,385,031 ($24,688) Adjusted para salaries
Employee Benefits $1,593,126 $1,587,822 $1,558,017 ($29,805) Adjusted statutory benefits and Health, Dental & Vision
Books and Supplies
$337,067 $557,670 $462,356 ($95,314) Added $5K for Wi-Fi nodes, decreased Common Core technology expenditures
Services/Op Expenses
$1,014,091 $1,114,966 $1,121,518 $6,552 Adjusted inter-fund direct costs (Fund 13)
Capital Outlay $0 $90,315 $90,315 Clean energy $
Other Outgo $268,852 $301,896 $302,035 $139 County transfer for SPED
Transfers of Indirect
($12,486) ($12,524) ($12,792) ($268) Indirect Fund 13
Interfund Transfers Out
$38,711 $70,680 $70,906 $226 Adjusted transfer to Fund 13
Total Expenditures $8,523,014 $9,086,805 $8,940,144 ($146,661)

General Fund Summary Category 2013-14
Budget Development
2013-14 Budget First Interim
2013-14 Budget Second Interim
Beginning Balance $2,856,956 $2,856,956 $2,856,956
Revenue $8,369,640 $8,873,391 $9,070,646
Expenditures $8,523,014 $9,086,805 $8,940,144
Net Increase/Decrease ($153,374) ($213,414) $130,502
Ending Fund Balance $2,703,582 $2,643,542 $2,987,458
Economic Uncertainty $425,001 $454,340 $447,007
Revolving Cash $5,100 $5,100 $5,100
Restricted Funds $70,388 $29,500 $157,125CCSSI - $124,700
Committed - COP Debt Service $410,188 $410,188 $410,188
Local Control Funding Formula Impact
$193,700
Available for budget shortfalls $1,599,205 $1,744,414 $1,968,039

Multi-Year Projections (MYP) Budget Assumptions
2013-14 Budget Second Interim
2014-15Projection
2015-16Projection
Statutory COLA 1.565% 1.87% 0.86% 1.99% 2.12%
Gap Funding 11.78% 16.49% 28.05% 18.69% 33.95%
Average Daily Attendance (ADA)
K-8 DistrictCounty Special Ed
1090 11084.84
1090 11084.84
1090 11084.84
California CPI 2.3% 2.2% 2.5% 2.4%
COLA State Categoricals 1.80% 0.86% 2.3% 2.2%
Federal COLA 0 0 0
Common Core State Standards Implementation Funds
Revenue: $216,437Expenditures: $91,737
Revenue: 0Expenditures: $124,700
N/A
Prop 39 Clean Energy Jobs Act $106,252 $106,252 $106,252
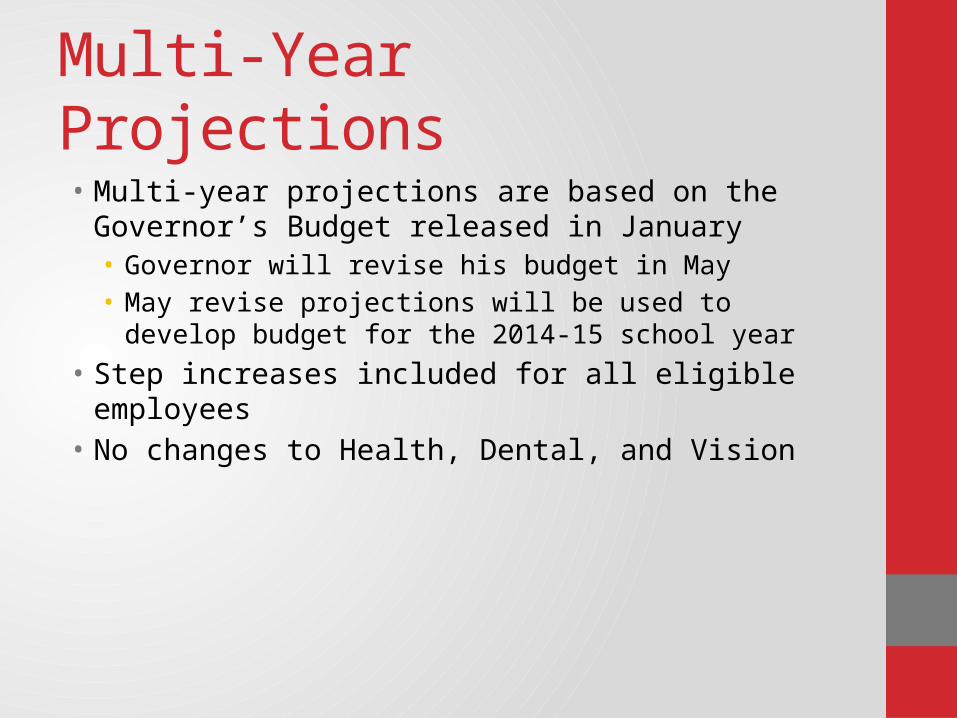
Multi-Year Projections• Multi-year projections are based on the Governor’s Budget
released in January• Governor will revise his budget in May• May revise projections will be used to develop budget for the
2014-15 school year• Step increases included for all eligible employees• No changes to Health, Dental, and Vision

Multi-Year Projections – Second Interim
2013-14 Projection 2014-15 Projection 2015-16 Projection
Beginning Fund Balance $2,856,956 $2,987,458 $3,138,649
Revenue $9,070,646 $9,269,365 $9,750,198
Expenditures $8,940,144 $9,118,174 $9,154,231
Net Increase (Decrease) in Fund Balance
$130,502 $151,191 $595,967
Ending Fund Balance $2,987,458 $3,138,649 $3,734,616
Revolving Fund & Restricted $157,125(CCSSI - $124,700)
$32,423 $32,423
Reserved for Economic Uncertainty $447,007 $455,909 $457,712
Certificates of Participation Debt Service
$410,188 $409,563 $408,788
Available for Budget Shortfalls $1,968,039 $2,235,654 $2,830,593

Cash
• Deferrals are still in the budget, cash is monitored every month• State Budget included funding to buy back most deferrals• Remaining Deferrals:
• April - 38% of the apportionment deferred to July• May – 97% of the apportionment deferred to July• June – 100% of the apportionment deferred to July
• Education Protection Account (EPA) –approximately 20 percent of our State Aid that will be paid on a quarterly basis

CAFETERIA FUND – FUND 13

Fund 13 - Cafeteria FundCategory 2013-14
Budget Development
2013-14 Budget First Interim (FI)
2013-14 Budget Second Interim (SI)
Changes(SI – FI)
Notes
Beginning Balance $500 $500 $500
Audit Adjustment ($944)
Revenue $427,512 $427,512 $427,515
Transfer In $38,711 $38,471 $38,697 $226 Contribution from General Fund
Expenditures $466,223 $465,983 $465,765 ($218) Adjusted Salaries and Direct costs
Net Increase (Decrease) in Fund Balance
$0 $0 $444
Ending Balance $500 $500 $500
DEFERRED MAINTENANCE FUND FUND 14

Fund 14 - Deferred MaintenanceCategory 2013-14 Budget
Development2013-14 Budget First Interim
2013-14 Budget Second Interim
Change Notes
Beginning Balance $86,098 $86,098 $86,098
Revenue $34,482 $1,100 $1,100
Transfers In (From General Fund)
0 $32,209 $32,209
Expenditures $35,000 $35,000 $35,000
Net Increase (Decrease) in Fund Balance
($518) (1,691) (1,691) -
Ending Fund Balance
$85,580 $84,407 $84,407

CAPITAL FACILITIES FUND FUND 25
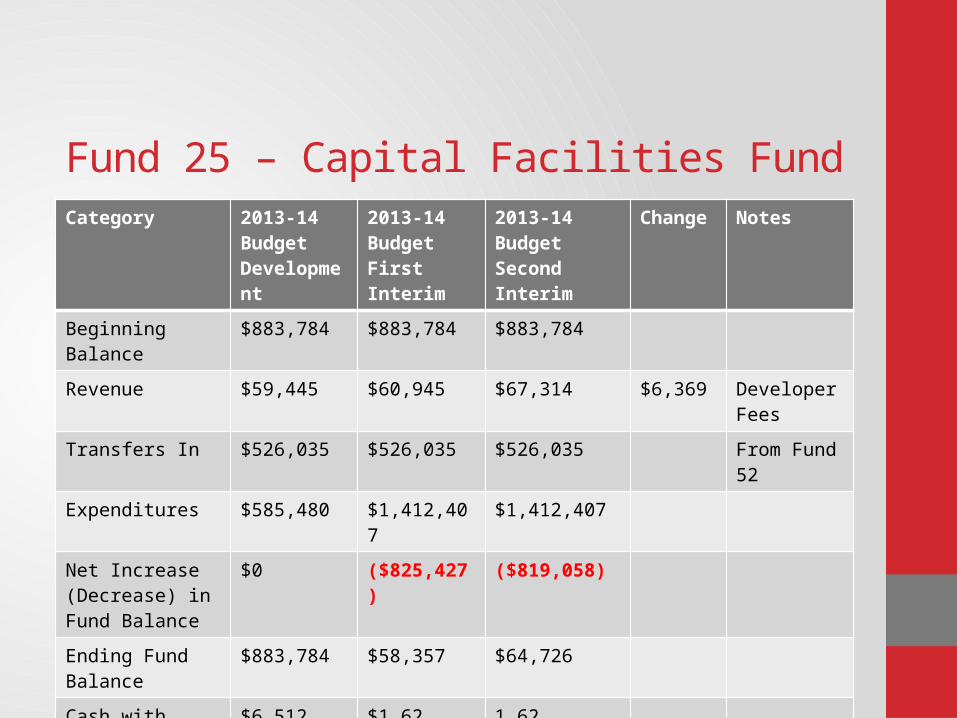
Fund 25 – Capital Facilities FundCategory 2013-14
Budget Development
2013-14 Budget First Interim
2013-14 Budget Second Interim
Change Notes
Beginning Balance $883,784 $883,784 $883,784
Revenue $59,445 $60,945 $67,314 $6,369 Developer Fees
Transfers In $526,035 $526,035 $526,035 From Fund 52
Expenditures $585,480 $1,412,407 $1,412,407
Net Increase (Decrease) in Fund Balance
$0 ($825,427) ($819,058)
Ending Fund Balance
$883,784 $58,357 $64,726
Cash with fiscal agent
$6,512 $1.62 1.62
Cash with county $877,273 $58,355 $64,724
DEBT SERVICE FUND FOR BLENDED COMPONENT UNITS
FUND 52

Fund 52 – Debt Service Fund for Blended Component Units
Category 2013-14 Budget Development
2013-14 Budget First Interim
2013-14 Budget First Interim
Change Note
Beginning Balance $1,175,302 $1,175,302 $1,175,302
Revenue $681,572 $681,752 $681,752
Expenditures $397,392 $397,392 $397,392
Interfund Transfers Out
$549,035 $549,035 $549,035
Net Increase (Decrease)
($264,855) ($264,855) ($264,855)
Ending Fund Balance $910,447 $910,447 $910,447
Cash w/ fiscal agent $402,714 $402,714 $402,695
Assigned – Debt Service
$507,733 $507,733 $507,752

Summary and Recommendation
• Second Interim projections show an operating surplus of $132,466 in the General Fund for the current year
• Based on multi-year projections and current assumptions staff recommend the Board approve Second Interim with a positive certification and the budget adjustments within

Any questions?