
Plug-in Electric Vehicle Charging Demand Estimation based ...
1
2.5 3 3.5 4 4.5 5 5.5 6 0 100 200 300 400 500 600 700 800 900 1000 r 1 (c/kWh) Charging demand (kW) P chg 1 (30 chargers) P chg 2 (30 chargers) P chg 1 (25 chargers) P chg 2 (25 chargers) Charging stations are interconnected by a road system Price sensitivity function of PEV drivers Exponentially distributed single PEV charging demand and PEV inter-arrival time 2.5 3 3.5 4 4.5 5 5.5 6 0 50 100 150 200 250 300 r 2 (c/kWh) Charging demand (kW) P chg 1 (30 chargers) P chg 2 (30 chargers) P chg 1 (25 chargers) P chg 2 (25 chargers) Plug-in Electric Vehicle Charging Demand Estimation based on Queueing Network Analysis Dr. Hao Liang (Assistant Professor) Department of Electrical and Computer Engineering, University of Alberta, Email: [email protected] Smart Grid Architecture Objectives of this Research Bulk Generation Transmission Renewable Non-Renewable Step-Up Transformer Distribution Customer Residential Industrial Commercial Microgrid Wind Solar Smart Meter WAN NAN / FAN HAN / BAN / IAN Energy Flow Bulk Generation and Power Transmission System Operation Power Distribution System and Microgrid Operation Customer Energy Management Information System Electric Power System Communication System Information Flow Battery EV Flywheel Step-Down Transformer Definition based on the IEEE 2030 Standard (September 2011) A key enabler of the smart grid is the two-way communications throughout the power system, based on which an advanced information system can make optimal decisions on power system operation and control Queuing Network Analysis Address the problem of plug-in electric vehicle (PEV) integration in the future smart grid Estimate the charging demands of PEVs, while taking into account the information obtained via smart grid communication: 1) Statistics of single PEV charging demand 2) Price sensitivity of PEV drivers 3) Statistics of PEV traffic flow in a road system Validate the analytical model based on realistic vehicle statistics Related Work and Open Issues Related work: 1) Monte Carlo simulation study; 2) Single queue models for independent charging stations Open Issue I: How to model the correlation of charging demands among nearby charging stations Open Issue II: How to model drivers’ response to charging prices System Model Charging Station 1 Charging Station 2 LDC Substation PEV Internal Combustion Engine Vehicle 1 2 3 4 5 6 7 8 9 10 Charging Station Operator Communication Link β (r s ) = max ( 1 - ✓ r s - r min r max - r min ◆ 2 , 0 ) ,r s >r min Three types of service centers: Charging service center (CS) Routing service center (RS) Decision service center (DS) Number of PEVs in each service center Stationary distribution (for a BCMP network) The average charging demand of each charging station can be calculated based on π(n), while the traffic balance equations are solved to obtain the parameters Arrival Arrival Service Service Departure Departure CS 1 CS 2 DS 1 DS 2 RS 12 RS 21 p 1,2 (r 1 ) p 1,1 (r 1 ) p 2,1 (r 2 ) p 2,L (r 2 ) p 2,2 (r 2 ) p 1,L (r 1 ) Routing Routing ⇡ (n)= φ S Y s=1 G d s (n d s ) · S Y s=1 G c s (n c s ) · S Y s=1 S Y s 0 =1 s 0 6=s G r s,s 0 (n r s,s 0 ) n = {n d s ,n c s ,n r s,s 0 |s, s 0 2 {1, 2, ··· ,S },s 6= s 0 } Case Study and Future Research Urban Rural Traffic statistics: 2009 National Household Travel Survey and New York State Transportation Federation Traffic Data Viewer Electricity price: Hourly Ontario Energy Price (HOEP) Future research directions include the utilization of the analytical results to facilitate distribution system planning and the incorporation of the analytical model in distribution load flow analysis for optimal distribution system operation in smart grid
Transcript of Plug-in Electric Vehicle Charging Demand Estimation based ...
2.5 3 3.5 4 4.5 5 5.5 60
100
200
300
400
500
600
700
800
900
1000
r1 (c/kWh)
Cha
rgin
g de
man
d (k
W)
Pchg1 (30 chargers)
Pchg2 (30 chargers)
Pchg1 (25 chargers)
Pchg2 (25 chargers)
Ø Charging stations are interconnected by a road system
Ø Price sensitivity function of PEV drivers
Ø Exponentially distributed single PEV charging demand and PEV inter-arrival time
2.5 3 3.5 4 4.5 5 5.5 60
50
100
150
200
250
300
r2 (c/kWh)
Cha
rgin
g de
man
d (k
W)
Pchg1 (30 chargers)
Pchg2 (30 chargers)
Pchg1 (25 chargers)
Pchg2 (25 chargers)
Plug-in Electric Vehicle Charging Demand Estimation based on Queueing Network Analysis
Dr. Hao Liang (Assistant Professor)
Department of Electrical and Computer Engineering, University of Alberta, Email: [email protected]
Smart Grid Architecture
Objectives of this Research
Bulk Generation Transmission
Renewable
Non-Renewable
Step-UpTransformer
Distribution Customer
Residential
Industrial
CommercialMicrogrid
Wind Solar
Smart Meter
WAN NAN / FAN HAN / BAN / IAN
Energy Flow
Bulk Generation and Power TransmissionSystem Operation Power Distribution System and Microgrid Operation Customer Energy
ManagementInformationSystem
Electric PowerSystem
CommunicationSystem
Information Flow
Battery EV FlywheelStep-DownTransformer
² Definition based on the IEEE 2030 Standard (September 2011)
² A key enabler of the smart grid is the
two-way communications throughout the power system, based on which an advanced information system can make optimal decisions on power system operation and control
Queuing Network Analysis
Ø Address the problem of plug-in electric vehicle (PEV) integration in the future smart grid
Ø Estimate the charging demands of PEVs, while taking into account the information obtained via smart grid communication:
1) Statistics of single PEV charging demand
2) Price sensitivity of PEV drivers
3) Statistics of PEV traffic flow in a road system
Ø Validate the analytical model based on realistic vehicle statistics
Related Work and Open Issues
Ø Related work: 1) Monte Carlo simulation study; 2) Single queue models for independent charging stations
Ø Open Issue I: How to model the correlation of charging demands among nearby charging stations
Ø Open Issue II: How to model drivers’ response to charging prices
System Model
Charging Station 1
Charging Station 2
LDCSubstation
PEV
Internal CombustionEngine Vehicle
1
2
3 4 5 6 7 8
9 10
Charging Station Operator
Communication Link
�(rs) = max
(1�
✓rs � r
min
rmax
� rmin
◆2
, 0
), rs > r
min
Ø Three types of service centers:
Charging service center (CS) Routing service center (RS) Decision service center (DS)
Ø Number of PEVs in each service center
Ø Stationary distribution (for a BCMP network)
Ø The average charging demand of each charging station can be calculated based on π(n), while the traffic balance equations are solved to obtain the parameters
Arrival
Arrival
Service
Service
Departure
Departure
CS1
CS2
DS1
DS2
RS12
RS21
p1,2(r1)
p1,1(r1)
p2,1(r2)
p2,L(r2)
p2,2(r2)
p1,L(r1)Routing
Routing
⇡(n) = �SY
s=1
Gds(n
ds) ·
SY
s=1
Gcs(n
cs) ·
SY
s=1
SY
s0=1s0 6=s
Grs,s0(n
rs,s0)
n = {nds , n
cs, n
rs,s0 |s, s0 2 {1, 2, · · · , S}, s 6= s0}
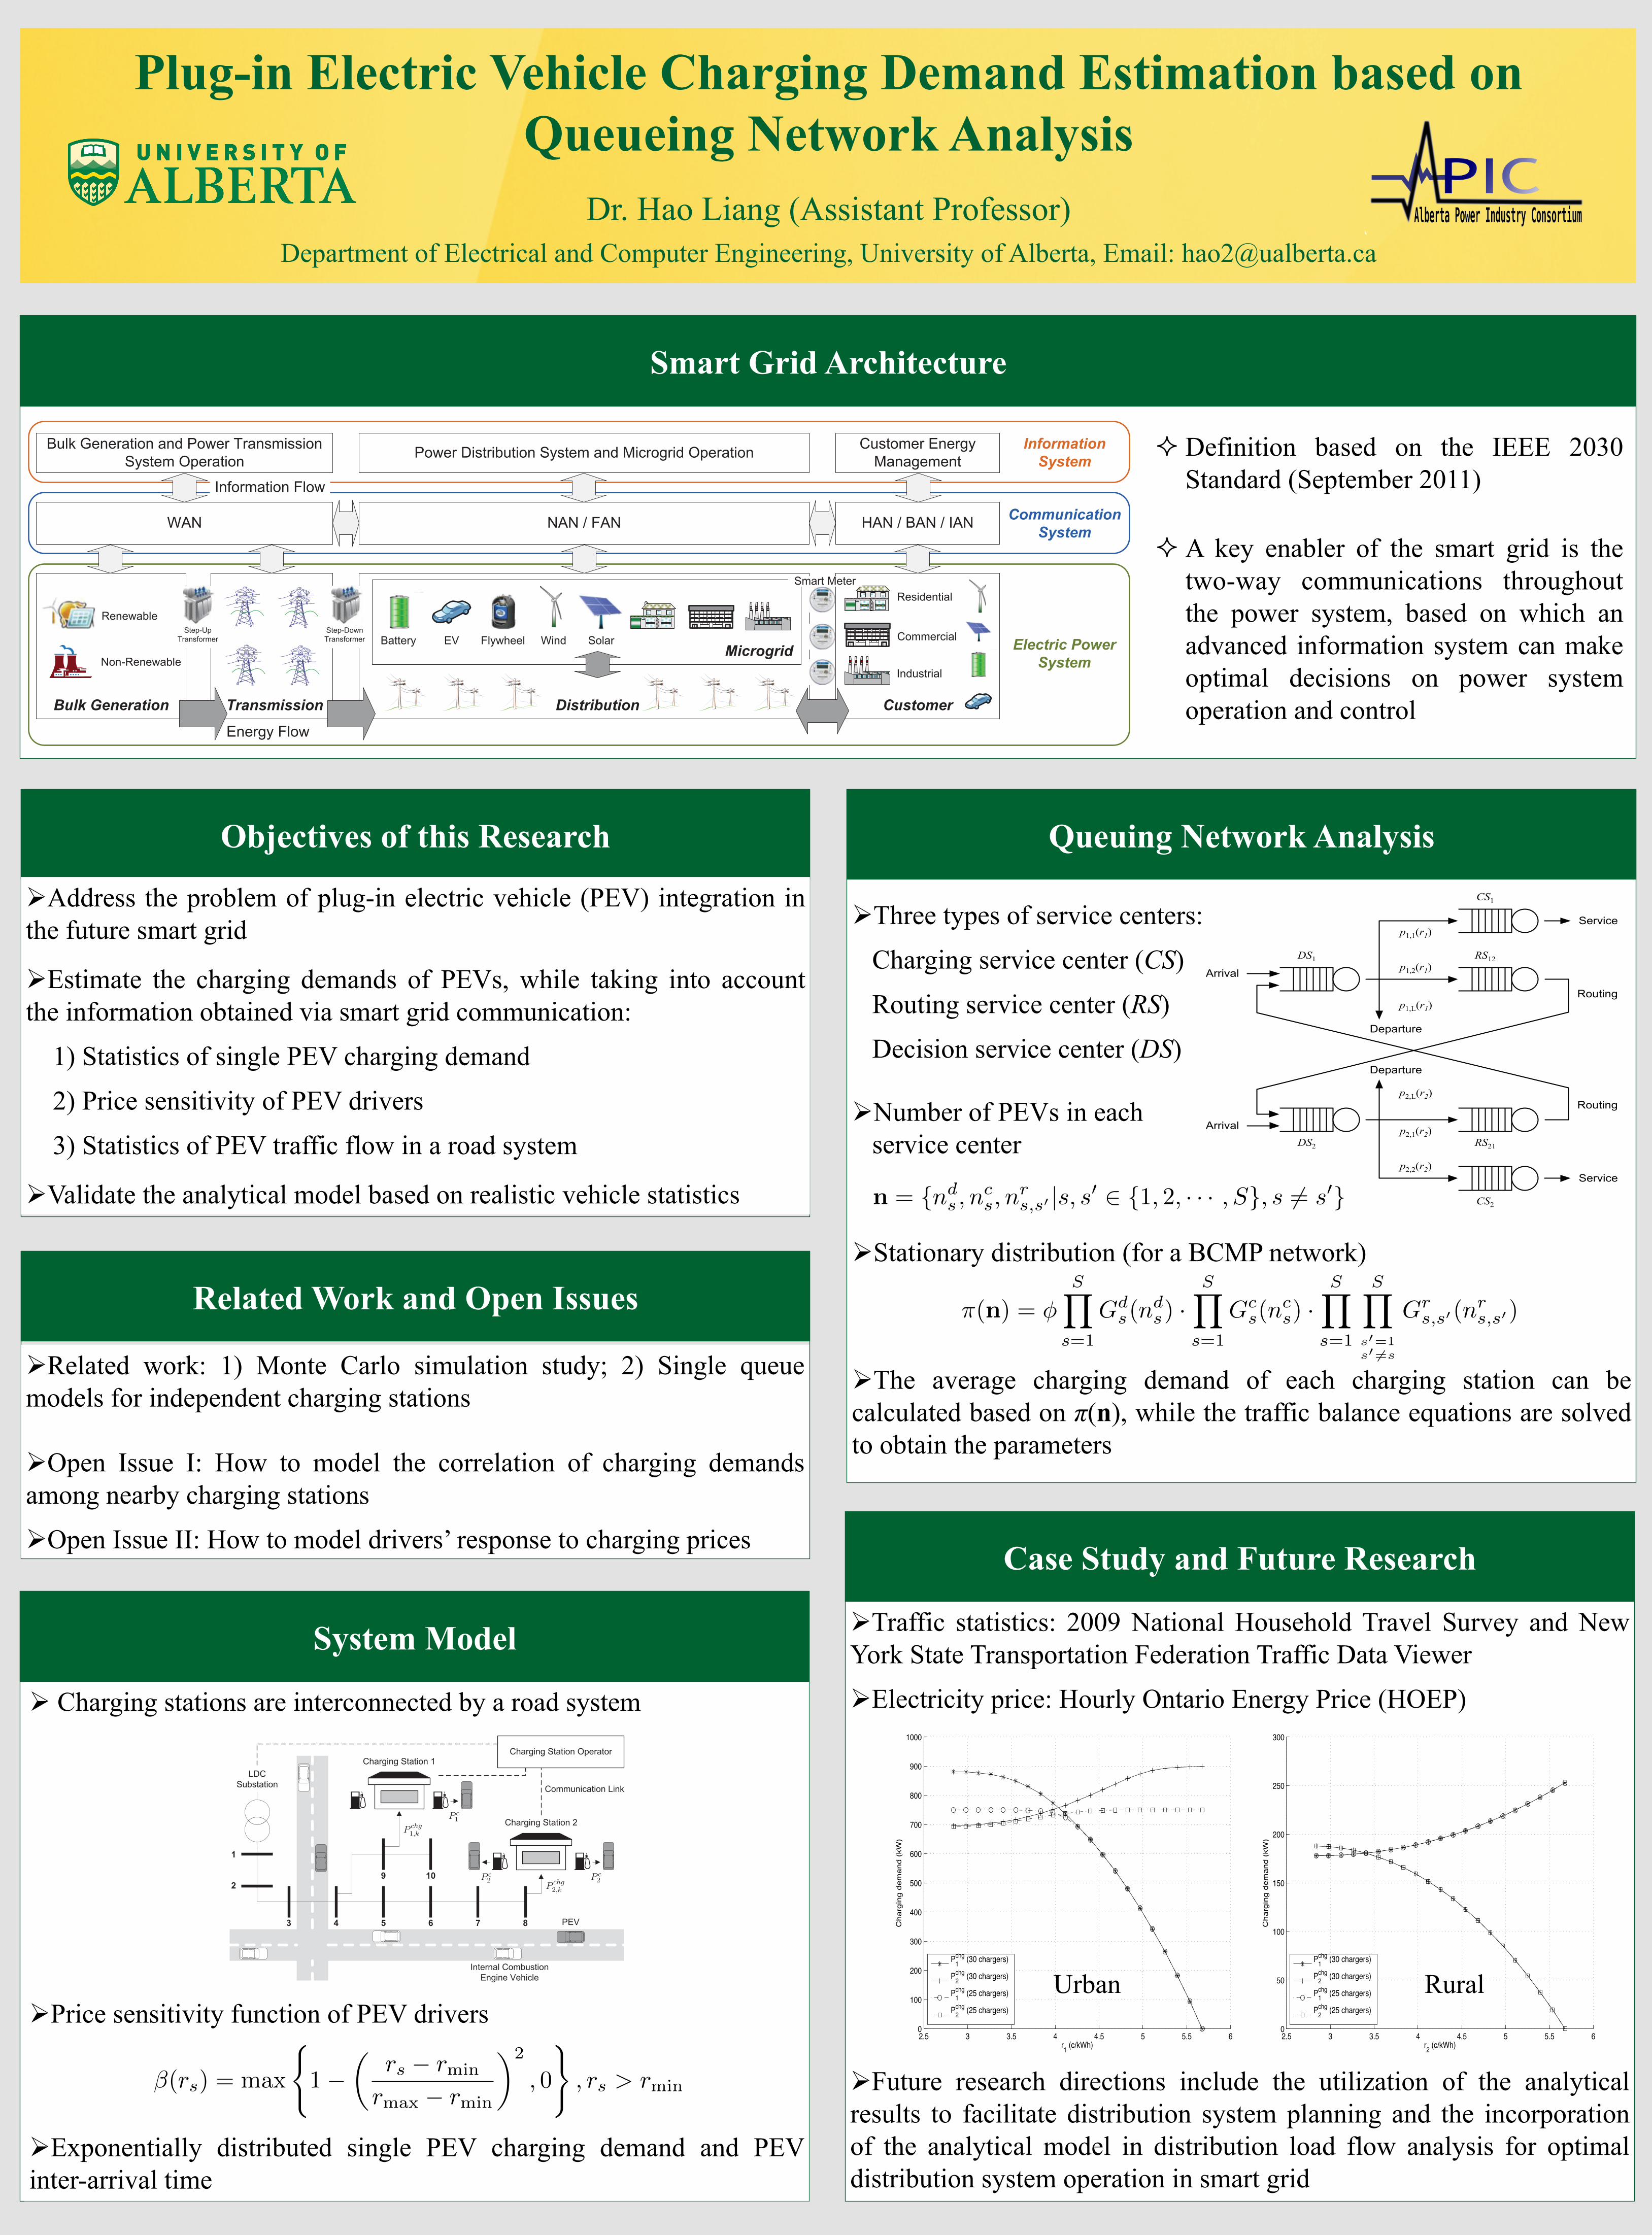
Case Study and Future Research
Urban Rural
Ø Traffic statistics: 2009 National Household Travel Survey and New York State Transportation Federation Traffic Data Viewer
Ø Electricity price: Hourly Ontario Energy Price (HOEP)
Ø Future research directions include the utilization of the analytical results to facilitate distribution system planning and the incorporation of the analytical model in distribution load flow analysis for optimal distribution system operation in smart grid