PLMPerformance Analyse
16
Seite: 1 addPLM - GmbH: [addPLM-PerformanceAnalyse_Praesentation_JFES_V2_en.pptx] (Josef Feuerstein/S.Gueth) Stand vom: [04.06.2014] Ausgabe vom: 04.06.2014 „PLMPerformanceAnalyse“ the solution for automated and permanent performance measurements for NX in the TC Environment
Transcript of PLMPerformance Analyse

Seite: 1addPLM - GmbH: [addPLM-PerformanceAnalyse_Praesentation_JFES_V2_en.pptx] (Josef Feuerstein/S.Gueth) Stand vom: [04.06.2014] Ausgabe vom: 04.06.2014
„PLMPerformanceAnalyse“ the solution for automated
and permanent performance measurements for NX in
the TC Environment

Seite: 2addPLM - GmbH: [addPLM-PerformanceAnalyse_Praesentation_JFES_V2_en.pptx] (Josef Feuerstein/S.Gueth) Stand vom: [04.06.2014] Ausgabe vom: 04.06.2014
PLM – Performance Analyse Einführung
PLM – Performance Analyse
The PLMPerformance Analyse software is a solution for automated and permanent performance measurements for NX in the TC
Environment
Description:
All complex software solutions are evaluated in addition to the software quality, especially on performance behavior. The software
performance is perceived as a “felt speed” by almost all users. Experience has shown that the performance decreases permanently
and that this is percieved, discussed and criticized only after a reduction of 30% -40%. This often leads to unusable statements that
make it difficult to improve the performance of the system.
A particularly problem is to evaluate the impact of individual measures in time relation, if no continuous measurements are available.
To improve this situation we developed the PLMPerformanceAnalyse (PPA)
The software supplies:
• Performance data on loading assemblies
• Performance data on starting TeamCenter and NX for each workstation
• the user count of logged in useres in TC
• location-based ping times
• an interactiv user interface that displays the data graphically and time-based
With this solution you achieve:
objectiv evaluation of the system performance
it helps to identify all kinds of performance degradation
it delivers important data to detect time-based performance problems
This software was developed and optimized since the beginning of 2006 in cooperation with Koenig & Bauer AG
Seite: 3addPLM - GmbH: [addPLM-PerformanceAnalyse_Praesentation_JFES_V2_en.pptx] (Josef Feuerstein/S.Gueth) Stand vom: [04.06.2014] Ausgabe vom: 04.06.2014
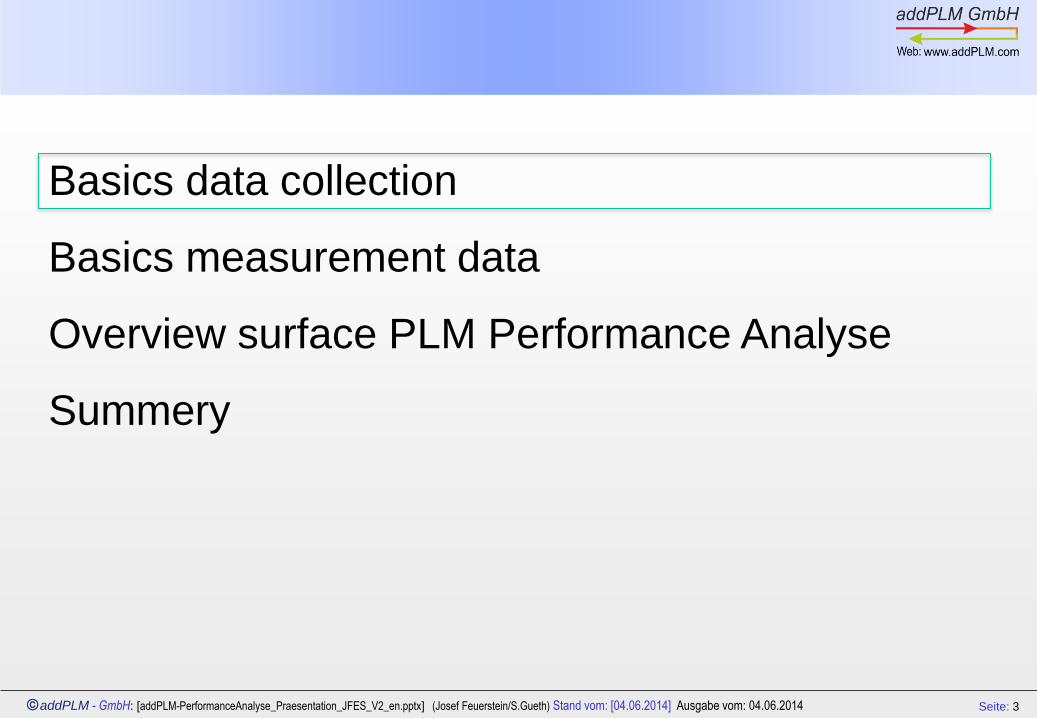
Basics data collection
Basics measurement data
Overview surface PLM Performance Analyse
Summery

Seite: 4addPLM - GmbH: [addPLM-PerformanceAnalyse_Praesentation_JFES_V2_en.pptx] (Josef Feuerstein/S.Gueth) Stand vom: [04.06.2014] Ausgabe vom: 04.06.2014
Acquire of measurement data
Process of data collection:
The measured data is acquired by an automatic start of NX on the different sites (1..3) and stored in central
directories (4). These processes can be controlled via the Windows Task Scheduler or via the PLMJobManager.
The performance analysis imports the measured data from the directories into the database (6) via batch (5). Now
the data are available for the analysis.
PLM Performance
Analyse
database
1
2
3
4
5
6

Seite: 5addPLM - GmbH: [addPLM-PerformanceAnalyse_Praesentation_JFES_V2_en.pptx] (Josef Feuerstein/S.Gueth) Stand vom: [04.06.2014] Ausgabe vom: 04.06.2014
PLMPerfClient
PLMPerfClient
Acquire of measurement data: system sketch
PLMPerfDB
(Oracle or MSSQL)
System overview1. PLMPerf Client CL1 .. CL4
• Perform the measurements
boundary condition : technical IT infrastructure and installation in the same way as the workstations of the
construction
• Import of the measurement data into the central measurement directories
2. PLMPerf Server (S1)
• Import of the measurement data (1) of the clients CL1 .. CL4 into the PLMPerfDB (2) via PLMPerfServer (S1)
• Display the measurement data with the PLMPerfServer – (S1)
CL1
CL2
PLMPerfClient
Site 2
Site 3Site 1
Site 4
CL4
PLMPerfClient
Import
CL3
Vol1
1
S12

Seite: 6addPLM - GmbH: [addPLM-PerformanceAnalyse_Praesentation_JFES_V2_en.pptx] (Josef Feuerstein/S.Gueth) Stand vom: [04.06.2014] Ausgabe vom: 04.06.2014
Basics data collection
Basics measurement data
Overview surface PLM Performance Analyse
Summery

Seite: 7addPLM - GmbH: [addPLM-PerformanceAnalyse_Praesentation_JFES_V2_en.pptx] (Josef Feuerstein/S.Gueth) Stand vom: [04.06.2014] Ausgabe vom: 04.06.2014
Loading performance measurement data source
Folie 7
MessungNr;Datum;Zeit;Users;LoadUpdCpuReal;LoadUpdCpu;TotalReal;UGMGRReal;PDIReal;SQLReal
1;04.10.2011;06:11:56;85;18,580;5,594;40,67;22,12;15,43;11,81
2;04.10.2011;06:11:56;85;17,623;5,703;24,64;11,39;4,20;1,07
3;04.10.2011;06:11:56;85;17,921;5,781;25,44;12,14;4,70;1,42
1;04.10.2011;06:41:21;83;16,820;5,843;24,86;11,97;4,67;1,53
2;04.10.2011;06:41:21;83;12,596;6,125;24,33;11,54;4,29;1,03
MessungNr: Measuring point number of the measurement series
Datum;Zeit: Time of the measurement process (end)
Users: Number of TC users during the measurement
LoadUpdCpuReal: value displayed in the graph

Seite: 8addPLM - GmbH: [addPLM-PerformanceAnalyse_Praesentation_JFES_V2_en.pptx] (Josef Feuerstein/S.Gueth) Stand vom: [04.06.2014] Ausgabe vom: 04.06.2014
Structure ping statistics
***** Ping-Statistik ******
Datum;Uhrzeit;Sender;Empfänger;gesendet;empfangen;verloren;Minimum;Maximum;Mittelwert
14.10.2011;00:54:16;FCAD50657;ORA_IM9W;20;20;0;7;25;7;
14.10.2011;00:55:19;FCAD50657;ORA_IM9W;20;20;0;7;17;8;
14.10.2011;00:56:19;FCAD50657;ORA_IM9W;20;20;0;7;13;7;
14.10.2011;00:57:19;FCAD50657;ORA_IM9W;20;20;0;7;16;9;
Datum;Uhrzeit: Time of the measurement
Sender: Name of the client that has send the ping
Empfänger: Name of the server which received the ping
gesendet: is only stored in DB, not in use
empfangen: is only stored in DB, not in use
verloren: is only stored in DB, not in use
Minimum: is only stored in DB, not in use
Maximum: is only stored in DB, not in use
Mittelwert: This values are displayed in the graphical view as yellow dots

Seite: 9addPLM - GmbH: [addPLM-PerformanceAnalyse_Praesentation_JFES_V2_en.pptx] (Josef Feuerstein/S.Gueth) Stand vom: [04.06.2014] Ausgabe vom: 04.06.2014
Basics data collection
Basics measurement data
Overview surface PLM Performance Analyse
Summery

Seite: 10addPLM - GmbH: [addPLM-PerformanceAnalyse_Praesentation_JFES_V2_en.pptx] (Josef Feuerstein/S.Gueth) Stand vom: [04.06.2014] Ausgabe vom: 04.06.2014
Overview surface PLM Performance Analyse
Analysis of the measurements of one day
Performance
Analyse
database
Measurement lines of the
sites in 2tier or 4tier -
mode
Count of loged in users in
the databases
Consolidated analyzes of
the measured data
relative to (1)
legend
1

Seite: 11addPLM - GmbH: [addPLM-PerformanceAnalyse_Praesentation_JFES_V2_en.pptx] (Josef Feuerstein/S.Gueth) Stand vom: [04.06.2014] Ausgabe vom: 04.06.2014
Overview surface PLM Performance Analyse
The various data can be switched on and off, this leads to different views on
the performance data
only performance data
User + Ping statistic
performance data
User + Ping statistic
Seite: 12addPLM - GmbH: [addPLM-PerformanceAnalyse_Praesentation_JFES_V2_en.pptx] (Josef Feuerstein/S.Gueth) Stand vom: [04.06.2014] Ausgabe vom: 04.06.2014
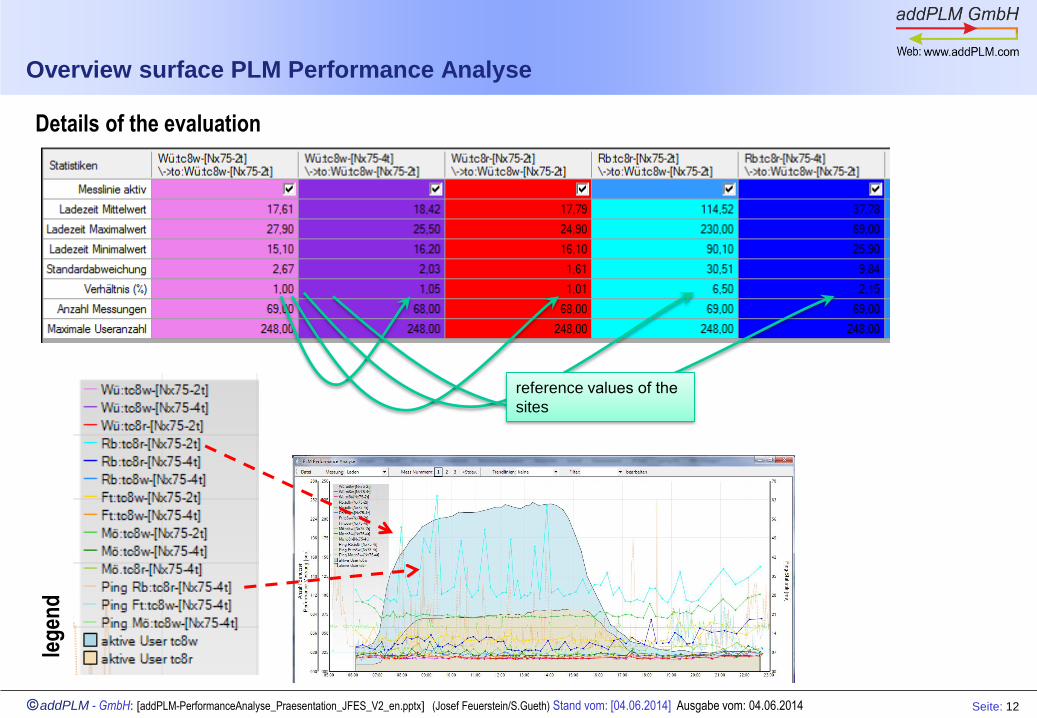
Overview surface PLM Performance Analyse
Details of the evaluation
reference values of the
sites
leg
end
Seite: 13addPLM - GmbH: [addPLM-PerformanceAnalyse_Praesentation_JFES_V2_en.pptx] (Josef Feuerstein/S.Gueth) Stand vom: [04.06.2014] Ausgabe vom: 04.06.2014
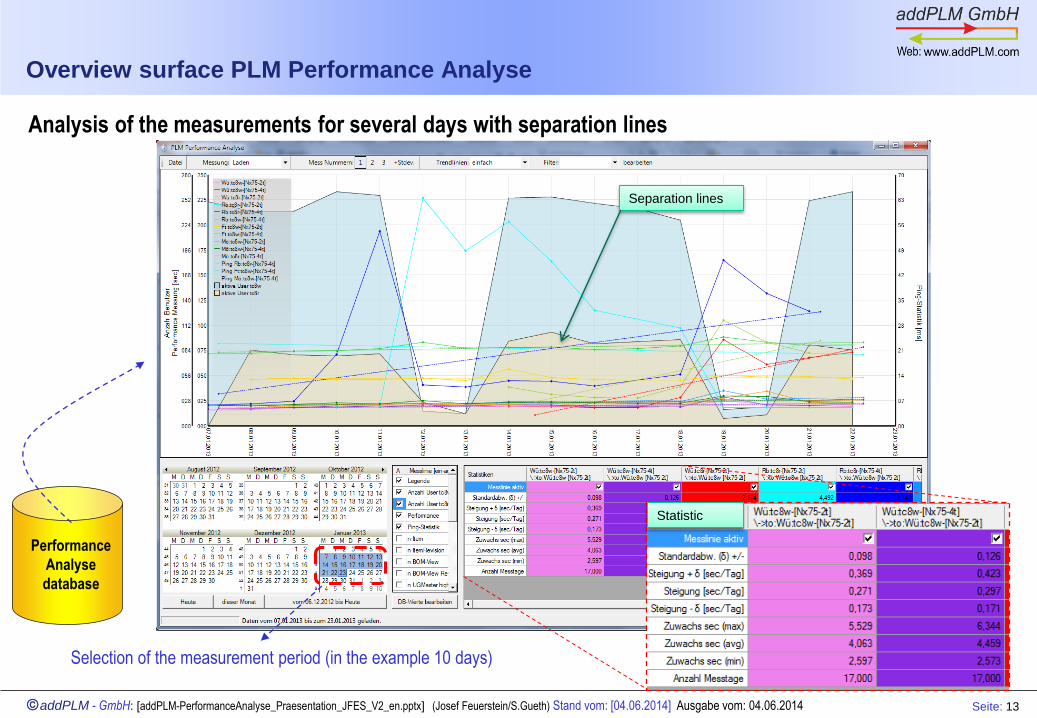
Overview surface PLM Performance Analyse
Performance
Analyse
database
Selection of the measurement period (in the example 10 days)
Analysis of the measurements for several days with separation lines
Separation lines
Statistic

Seite: 14addPLM - GmbH: [addPLM-PerformanceAnalyse_Praesentation_JFES_V2_en.pptx] (Josef Feuerstein/S.Gueth) Stand vom: [04.06.2014] Ausgabe vom: 04.06.2014
Basics data collection
Basics measurement data
Overview surface PLM Performance Analyse
Summery

Seite: 15addPLM - GmbH: [addPLM-PerformanceAnalyse_Praesentation_JFES_V2_en.pptx] (Josef Feuerstein/S.Gueth) Stand vom: [04.06.2014] Ausgabe vom: 04.06.2014
Summery
The automatic discovery of performance data has the following advantages :
The measurements treat objectively the evaluation of the performance
"indirectly" the entire PLM IT infrastructure is analysed as all systems are
addressed by the measurement
Smaller performance differences which infiltrates to the systems are recorded
systematically and time based. The time based measurement has the great
advantage that e.g. performance impacts due to changes in the IT system or to the
Software can be understood in a better way
The system informs the administrators via email when high values are measured
The software has been developed for KBA
and is in use since 2006.
Contact us:
Josef Feuerstein [email protected]
Sascha Güth [email protected]

Seite: 16addPLM - GmbH: [addPLM-PerformanceAnalyse_Praesentation_JFES_V2_en.pptx] (Josef Feuerstein/S.Gueth) Stand vom: [04.06.2014] Ausgabe vom: 04.06.2014
THANK YOU FOR YOURATTENTION
addPLM - GmbH