PLG Consulting Appalachian logistics League May 5, 2015
20
Logistics Engineering Supply Chain The North American Energy Revolution: Implications for Logistics Prepared for: Appalachian Logistics League Taylor Robinson, President, PLG Consulting May 5, 2015
-
Upload
plg-consulting -
Category
Business
-
view
198 -
download
1
Transcript of PLG Consulting Appalachian logistics League May 5, 2015

Logistics Engineering Supply Chain
The North American Energy Revolution:
Implications for Logistics
Prepared for:
Appalachian Logistics League
Taylor Robinson, President, PLG Consulting
May 5, 2015

2
Experience
Delivering value to over
200 clients since 2001
Real-world, industry
veterans
Logistics, engineering &
supply chain experts with
operational experience
Core Expertise
Bulk Logistics
Freight Rail
Energy & Chemical
Markets
Investment Advisory and
Corporate Development
Partial Client List
Services
Diagnostic assessments &
optimization
Logistics Infrastructure
design
Supply chain design &
operational improvement
Investment strategy, target
identification, due diligence,
post-transactional support
Crude by rail (CBR) and rail
tank car (RTC) forecasts
Independent technology
assessment &
implementation
Hazmat training, auditing &
risk assessment
About PLG Consulting
The North American Energy Revolution: Implications for Logistics

3
ssSource: CAPP, About Oil Sands
Source: EIA, May 2014
US Shale
Unconventional Energy Resources and Extraction Technologies
The North American Energy Revolution: Implications for Logistics
Western Canadian (WC)
Oil Sands
Source: www.epmag.com
SAGD
Horizontal Drilling & Hydraulic Fracturing
Source: Marathon, February 2014
“Moore’s Law” at play: Exponential
advances in technology, resulting in
Declining costs
Surging production
Representative Producer Gains, Eagle Ford
Source: RBN Energy, December 2014
4
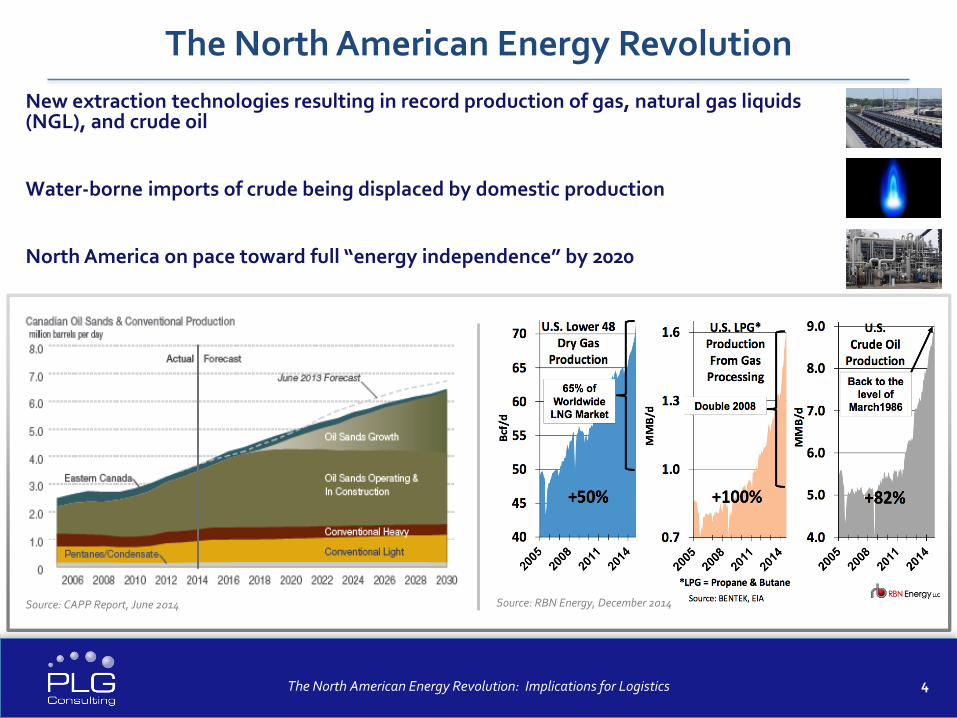
New extraction technologies resulting in record production of gas, natural gas liquids (NGL), and crude oil
Water-borne imports of crude being displaced by domestic production
North America on pace toward full “energy independence” by 2020
Source: CAPP Report, June 2014 Source: RBN Energy, December 2014
The North American Energy Revolution
The North American Energy Revolution: Implications for Logistics

5
Shale Supply Chain and Downstream Impacts
Feedstock (Ethane)
Byproduct (Condensate)
Home Heating (Propane)
Other Fuels
Other Fuels
Gasoline
Gas
NGLs
Crude
Proppants
OCTG
Chemicals
Water
Cement
Generation
Process Feedstocks
All Manufacturing
Steel
Fertilizer (Ammonia)
Methanol
Chemicals
Petroleum Products
Petro-chemicals
Inputs Wellhead Direct
Output Thermal Fuels Raw Materials
The next wave:Manufacturing renaissance in the US based on abundant, low cost
energy and feedstocks
Impacts to-date include: Dramatic reduction in crude imports, lower electricity costs, lower
gasoline prices, increased refined products exports
Downstream Products
The North American Energy Revolution: Implications for Logistics

6
0
2,000
4,000
6,000
8,000
10,000
12,000
1970
1972
1974
1976
1978
198
0
198
3
198
5
198
7
198
9
199
1
199
3
199
6
199
8
20
00
20
02
20
04
20
06
20
09
20
11
20
13
U.S. Crude Oil Production (kbpd)
Source: EIA, February 2015
U.S. crude oil production growth Crude oil production over 9 MMbpd, up from 5
MMbpd in 2008
Growth has come primarily from shale oil production of light crude
2015 production close to US record of 1970
Decrease in crude oil imports Shale crude has been pushing out light crude
imports
Heavy sour crude imports have been steady, with Canada growing to become the primary US supplier
North America now supplies 2/3 of the U.S. crude demand
0
2,000
4,000
6,000
8,000
10,000
12,000
2005 2006 2007 2008 2009 2010 2011 2012 2013 2014
U.S. Crude Oil Imports (kbpd)
Source: EIA, February 2015
Historical U.S. Crude Oil Production and Imports
The North American Energy Revolution: Implications for Logistics

7
Source: RBN Energy, January 2015
WTI, Brent & Natural Gas 2014 and 2015
Citibank cut its crude price forecasts, saying West Texas Intermediate (WTI) could go as low as the $20 per barrel range before recovering to reach a new equilibrium.- Reuters (2/9/2015)
The market doesn’t understand just how quickly oil companies are scaling back their activities, and as a result, oil prices could rebound faster than many observers expect.- Continental Resources CEO Harold Hamm (Fuelfix, 1/28/2015)
• U.S. shale oil industry has now entered
uncharted territories in its brief history
• Natural Gas and NGL pricing has also
dropped dramatically in a similar
timeframe…due to oversupply and NGL
ties to oil prices
• Market experts have widely varied
opinions on what the rest of the year
holds for pricing - ~$10-$70 per barrel…
2014: Oversupply Has Caused Precipitous Price Declines
The North American Energy Revolution: Implications for Logistics
8
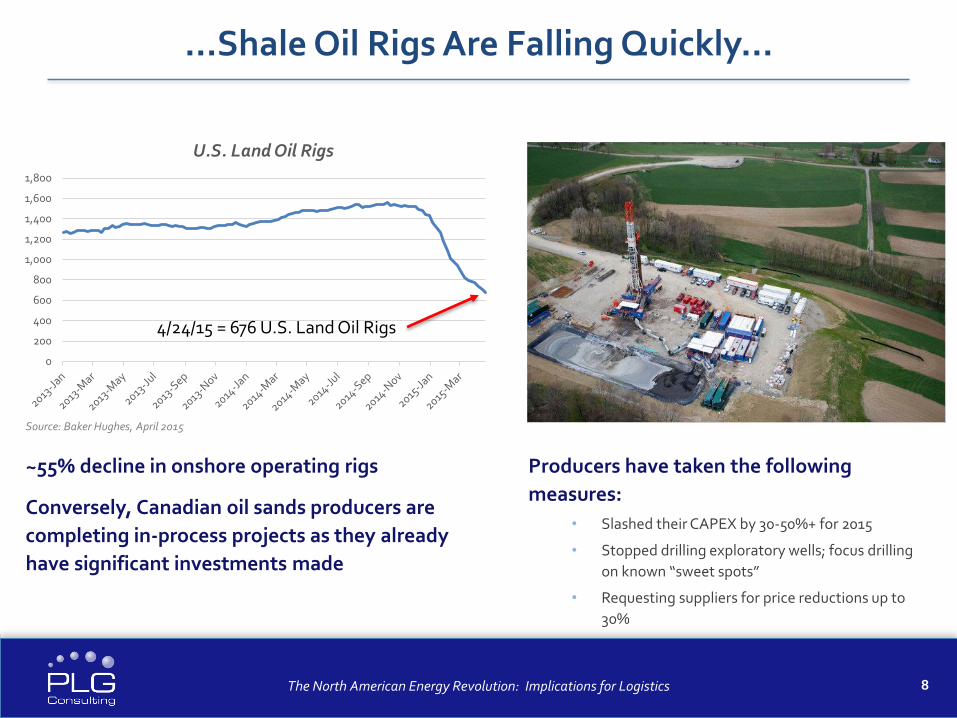
Producers have taken the following
measures:
• Slashed their CAPEX by 30-50%+ for 2015
• Stopped drilling exploratory wells; focus drilling
on known “sweet spots”
• Requesting suppliers for price reductions up to
30%
~55% decline in onshore operating rigs
Conversely, Canadian oil sands producers are
completing in-process projects as they already
have significant investments made
…Shale Oil Rigs Are Falling Quickly…
0
200
400
600
800
1,000
1,200
1,400
1,600
1,800
U.S. Land Oil Rigs
Source: Baker Hughes, April 2015
4/24/15 = 676 U.S. Land Oil Rigs
The North American Energy Revolution: Implications for Logistics

9
…However, Crude Oil Production Will Continue at High Levels
0
1
2
3
4
5
6
7
8
9
Lower 48 States (excl GOM) Crude Oil Production (MMBPD), Includes Lease Condensate
Source: EIA, February 2015 Source: CAPP, January 2015
Cost reduction focus and “sweet spot” drilling will continue to lower break even cost
Held by Production (HBP) lease clauses will help support production
Smaller, weaker players will fall while stronger producers will actually grow during downturn
Oil sands has a 20-50 year view on projects
R&D budgets cut; new greenfield projects delayed
SAGD wells have lower break even costs compared to shale wells
Current pricing is a short term issue from their perspective
The North American Energy Revolution: Implications for Logistics

10
Source: RBN Energy, February 2015
At $50/bbl oil, producers are mostly at or below breakeven
Producer Rates of Return by Play and Product(Before Cost Reductions)
The North American Energy Revolution: Implications for Logistics

11
Producer Rates of Return by Play and Product(After Cost Reductions)
Source: RBN Energy, February 2015
Producers can be profitable at $50/bbl oil with cost reductions
The North American Energy Revolution: Implications for Logistics
12
$0
$10
$20
$30
$40
$50
$60
$70
$80
$90
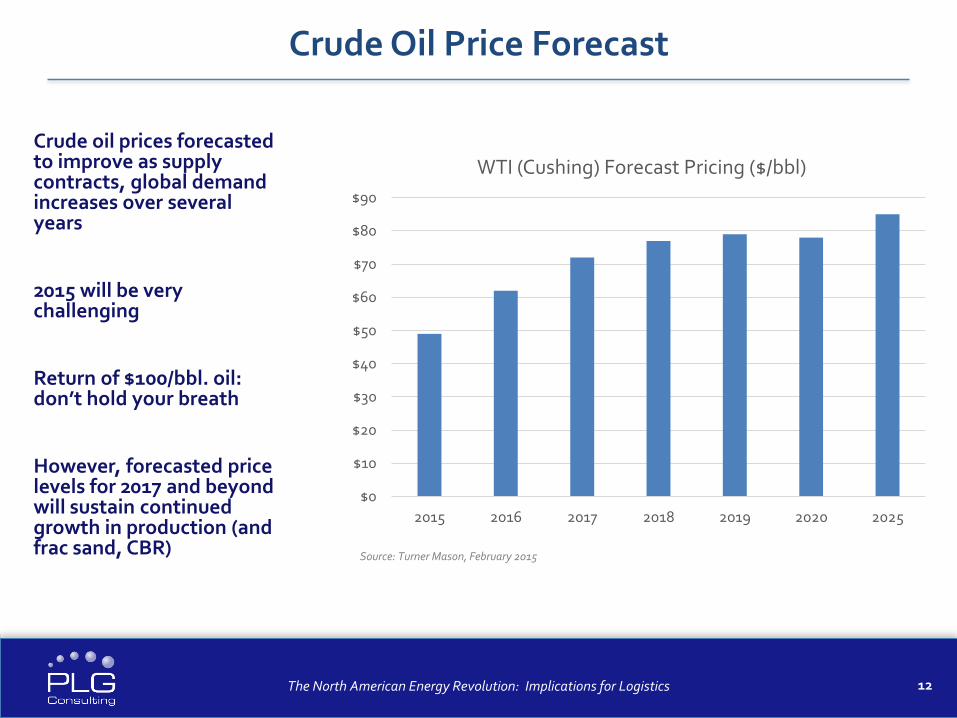
2015 2016 2017 2018 2019 2020 2025
WTI (Cushing) Forecast Pricing ($/bbl)
Source: Turner Mason, February 2015
Crude oil prices forecasted to improve as supply contracts, global demand increases over several years
2015 will be very challenging
Return of $100/bbl. oil: don’t hold your breath
However, forecasted price levels for 2017 and beyond will sustain continued growth in production (and frac sand, CBR)
Crude Oil Price Forecast
The North American Energy Revolution: Implications for Logistics

13
NA Crude Logistics Today
Sources: EIA, PLG analysis (Google Earth)
Light/Sweet
Heavy/Sour
Pacific Northwest Refiners
California Refiners
2,525kbpd
PADD VDemand
Midwest Refiners
3,375kbpd
PADD II Demand
East Coast Refiners
PADD I Demand1,075kbpd
LA Gulf Coast Refiners
TX Gulf Coast Refiners
PADD III Demand8,150
kbpd
Eagle Ford
Permian
Bakken
Rail
Pipeline
Marine
Oil Sands
GOM
The North American Energy Revolution: Implications for Logistics

14
New tank car standard (DOT 117) 9/16” shell, jacketed, full-height head
shield
Retrofit timeline 2018 – 2025 depending on Packing Group (“PG”) and CPC1232/non-CPC1232
ECP braking required for unit trains 2021 for PG I and 2023 for PG II & III
Other parts of the ruling Ruling restricts flammable trains to 50-
mph in all areas and if train contains any new non-enhanced tank car then speed is restricted to 40-mph in high-threat urban areas
Document sampling and testing program for all unrefined petroleum-based products, such as crude oil
Railroads operating flammable trains required to perform a routing analysis that considers, at a minimum, 27 safety and security factors and select a route based on its findings
DOT Final Flammable Trains Final Ruling
The North American Energy Revolution: Implications for Logistics

15
US gas demand will grow due to: Coal-fired generation plant converting to
gas
More industrial use – steel, fertilizer, methanol
Mexican export via pipeline and LNG export overseas
Increasing use as transportation fuel
US gas cost competitiveness is sustainable
30+ year supply at ~$4 mm/btu; cost of production decreasing
Supply will overwhelm demand as prices approach $5/
US government will likely limit LNG export to protect US from world gas market price
Low-cost gas and NGLs driving US industrial “renaissance”
Source: EIA, February 2015
60
65
70
75
80
85
2008 2009 2010 2011
U.S. Natural Gas Production (Bcf/day)
Actual Forecast
0
2
4
6
8
10
12
14
Natural Gas Price at Henry Hub ($/MMBTU)
Historical Futures
Source: EIA for historical and CME Group for futures as of Jan. 14, 2015
US Shale Gas Background and Future
The North American Energy Revolution: Implications for Logistics

16
Ethane and propane production growth with shale gas Raw NGLs (y-grade) are extracted creating dry gas and y-grade streams; dry gas primarily used as a fuel for heat and power
Y-grade is sent to a fractionator where it is made into “purity” NGLs – ethane, propane, butane, iso-butane, natural gasoline
Ethane and propane are the largest components of the y-grade and are therefore seeing large growth in the U.S.
U.S. infrastructure build-out continues to process the huge low cost production volume increase in ethane and propane
Source: OPIS, December 2014 & CME Group, December 2014
Gas Value Chain
Source: Bentek: North American NGLs 4Q2014
Shale Gas, NGLs, and Downstream Chemical Processing
The North American Energy Revolution: Implications for Rail
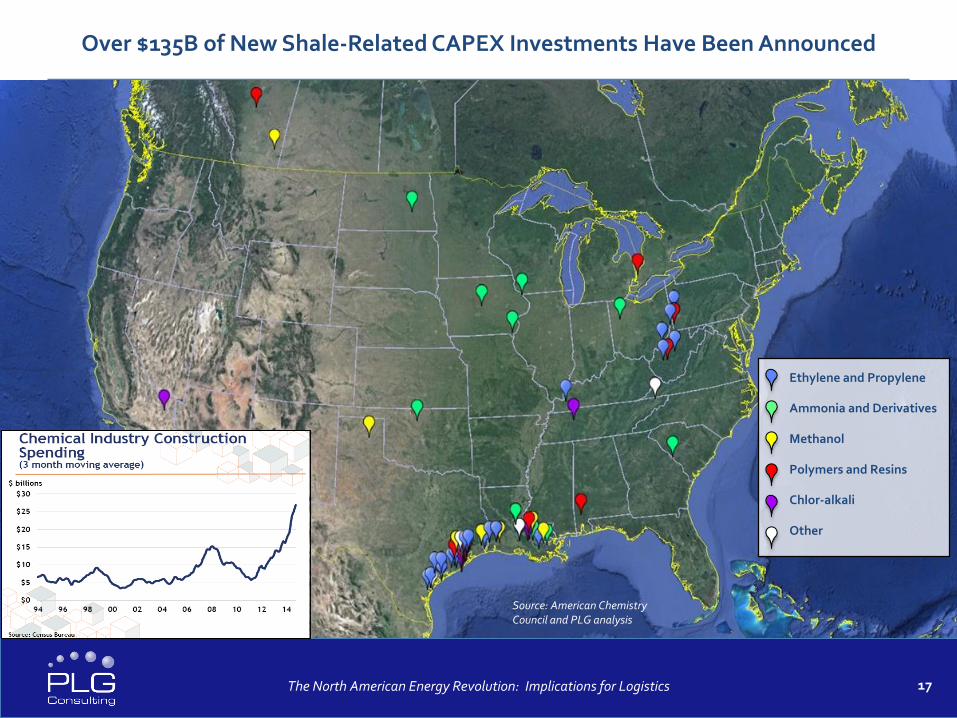
17
Ethylene and Propylene
Ammonia and Derivatives
Methanol
Polymers and Resins
Chlor-alkali
Other
Source: American Chemistry Council and PLG analysis
Over $135B of New Shale-Related CAPEX Investments Have Been Announced
The North American Energy Revolution: Implications for Logistics

18
Abundant feedstock, structural cost advantages, and domestic market growth driving US petrochemical industry expansion
Rate of expansion growth will be slowed by Lack of EPC capacity
Shortage of craft labor resources in the U.S. Gulf Coast
Increasing regulatory hurdles and delays
Expansion peak will be dampened and overall build-out will take longer than announced schedules
U.S. chemical industry is entering a historic growth period with incredible growth opportunities and challenges
Source: ACC and PLG Analysis, December 2014
ACC Estimate
PLG Estimate
U.S. Chemical Industry Capital Investment: Incremental Due to Shale Gas
0
200
400
600
800
1,000
1,200
1,400
SaudiEthane
US Ethane USWeighted
WE LowCost
AsiaNaphtha
USNaphtha
Dec. 2013
Dec. 2014
Source: Townsend Solutions, December 2014
Cash Cost US$/ton (Ethylene)
US Chemical Industry Build-Out
The North American Energy Revolution: Implications for Logistics

19
We are in the early innings of the North American energy revolution
Natural gas – the first shale “oversupply” example
Crude oil – new shale and maturation of Canadian oil sands
NGL – a valuable byproduct from natural gas and crude drilling
Downstream chemicals and manufacturing – coming soon!
Lower hydrocarbon pricing environment is mainly caused by oversupply
Pricing will speed up cost reduction throughout supply chain
Industry consolidation will ensure long term global competitiveness
Lower oil prices will dampen growth profile for frac sand and crude by rail volume in the short term
Tank car and small covered hopper market has shifted gears to “neutral” for now
Near-term (2015-2016) turbulence on the way to 10+ years of growth and industrial expansion
Net positive for rail industry; growth opportunities for wide variety of railcar types
Presentation Summary
The North American Energy Revolution: Implications for Logistics

Logistics Engineering Supply Chain
Thank You !For follow up questions and information,
please contact:
Taylor Robinson, President+1 (508) 982-1319 / [email protected]
This presentation is available for download at:http://plgconsulting.com/category/presentations/