Please refer to important information, disclosures and qualifications at the end of this material....
20
Please refer to important information, disclosures and qualifications at the end of this material. Global Investment Committee Outlook January 2013 This presentation was created by the Global Investment Committee and is provided to you courtesy of
-
Upload
joanna-gibbs -
Category
Documents
-
view
213 -
download
0
Transcript of Please refer to important information, disclosures and qualifications at the end of this material....

Please refer to important information, disclosures and qualifications at the end of this material.
Global Investment Committee Outlook
January 2013
This presentation was created by the Global Investment Committee
and is provided to you courtesy of

Past performance is no guarantee of future results. This material is not a solicitation of any offer to buy or sell any security or other financial instrument or to participate in any trading strategy.
Please refer to important information, disclosures and qualifications at the end of this material.
2013 - 2014 Outlook
European GDP turns to positive in 2014, Global and US GDP stabilizes in 2013 and improves in 2014
Earnings growth is slow in 2013, quicker in 2014
Low inflation in both developed and developing countries
Global policy: challenged in developed economies, robust optionsin developing ones
Modest US trade-weighted dollar strength; broad developed country currencies weak to developing country currencies, especially Asia
2
Source: Morgan Stanley Smith Barney Global Investment Committee, Thomson Financial, DataStream. Data as of January 2013.

Past performance is no guarantee of future results. This material is not a solicitation of any offer to buy or sell any security or other financial instrument or to participate in any trading strategy.
Please refer to important information, disclosures and qualifications at the end of this material.
Global Investment Committee Tactical Weights
3
• Cash Underweight
•
Bonds Underweight
Short Duration Underweight
Developed Sovereign Underweight
Investment Grade Overweight
Inflation-linked Securities Underweight
High Yield Underweight
Emerging Markets Overweight
• Equities Overweight US Overweight
Europe Market weight
Japan Underweight
Emerging Markets Overweight
• Alternative/Absolute Return Overweight Commodities Overweight
Global REITS Underweight
Managed Futures Overweight
Private Equity
Hedge Funds
Real Estate
Market weight only;No tactical weights{
Global Asset Class Tactical Weight

Past performance is no guarantee of future results. This material is not a solicitation of any offer to buy or sell any security or other financial instrument or to participate in any trading strategy.
Please refer to important information, disclosures and qualifications at the end of this material.
Global GDP and CPI Forecasts
4
Source: Morgan Stanley & Co. Research, Citi Research, Morgan Stanley Smith Barney. Note: Regional and global forecast are GDP weighted averages, using Purchasing Power Parity estimates. That gives greater weights to developing economies. Data as of December 2012.
2012F 2013F 2014F 2012F 2013F 2014F
Global GDP 3.1 3.1 4.0 Global GDP 3.1 3.2 3.5
Developed Economies 1.2 0.7 1.9 21 Developed Economies 1.2 0.9 1.5 22
U.S. 2.2 1.4 2.7 15 U.S. 2.2 1.6 3.0 15
Euro Area -0.5 -0.5 0.9 -2 Euro Area -0.4 -0.7 -0.4 0
U.K. -0.2 0.8 1.6 0 U.K. -0.1 0.8 1.0 0
Japan 2.0 0.4 0.8 4 Japan 1.6 0.7 0.7 3
Developing Economies 5.0 5.4 5.9 79 Developing Economies 4.7 5.3 5.3 78
Brazil 1.6 2.8 3.4 2 Brazil 1.4 3.9 4.0 2
Russia 3.6 3.1 3.7 4 Russia 3.6 3.2 3.8 4
India 5.3 6.1 6.9 11 India 5.4 6.2 6.9 12
China 7.7 8.2 8.0 38 China 7.7 7.8 7.3 40
Global Inflation 3.4 3.1 3.3 Global Inflation 3.2 3.3 3.3
Developed Economies 2.0 1.4 1.7 Developed Economies 1.9 1.8 1.9
Developing Economies 4.7 4.8 4.8 Developing Economies 4.5 4.7 4.8
U.S. Core 2.3 2.2 2.2 Core PCE Deflator 1.8 1.6 1.9
U.S. CPI 2.1 1.3 1.6 PCE Deflator 1.8 1.9 2.0
% Contribution to Growth
Citi Research(Year-over-Year % Change)
Morgan Stanley & Co.(Year-over-Year % Change)
% Contribution to Growth
2013F 2013F
Past performance is no guarantee of future results. This material is not a solicitation of any offer to buy or sell any security or other financial instrument or to participate in any trading strategy.
Please refer to important information, disclosures and qualifications at the end of this material.
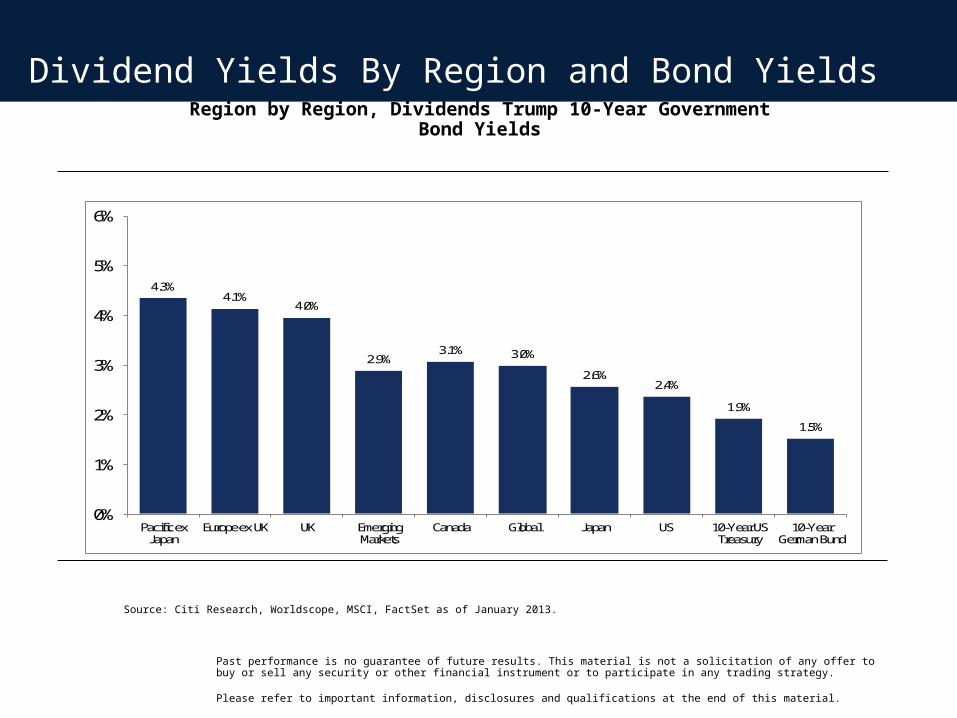
Dividend Yields By Region and Bond Yields
Source: Citi Research, Worldscope, MSCI, FactSet as of January 2013.
Region by Region, Dividends Trump 10-Year Government Bond Yields
5
4.3%4.1%
4.0%
2.9%3.1% 3.0%
2.6%2.4%
1.9%
1.5%
0%
1%
2%
3%
4%
5%
6%
Pacific ex Japan
Europe ex UK UK Emerging Markets
Canada Global Japan US 10-Year US Treasury
10-Year German Bund

Past performance is no guarantee of future results. This material is not a solicitation of any offer to buy or sell any security or other financial instrument or to participate in any trading strategy.
Please refer to important information, disclosures and qualifications at the end of this material.6
Global Short Rates
*Weighted Index of policy Interest rates, 65% developed market and 35% emerging market Sources: ISI Group as of November 2012.
1982 1984 1986 1988 1990 1992 1994 1996 1998 2000 2002 2004 2006 2008 2010 20120
2
4
6
8
10
12
14
16
18
Global Short Rates*
Aggressive Easing Pushes Policy Interest Rates Toward Historic Lows
Past performance is no guarantee of future results. This material is not a solicitation of any offer to buy or sell any security or other financial instrument or to participate in any trading strategy.
Please refer to important information, disclosures and qualifications at the end of this material.
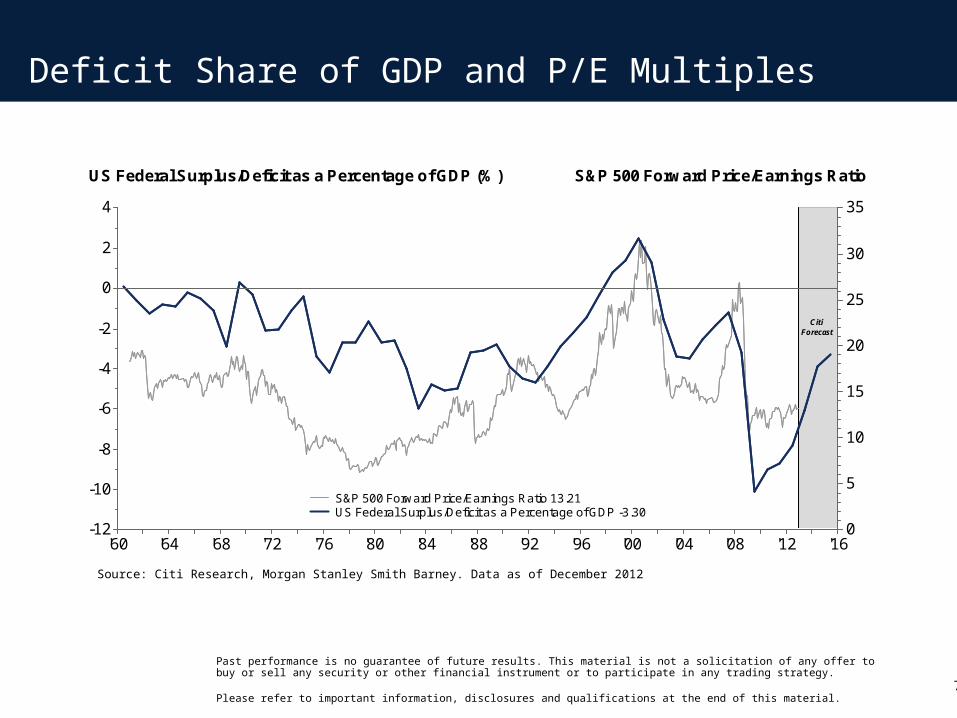
Deficit Share of GDP and P/E Multiples
7
'60 '64 '68 '72 '76 '80 '84 '88 '92 '96 '00 '04 '08 '12 '16-12
-10
-8
-6
-4
-2
0
2
4
0
5
10
15
20
25
30
35
Citi Forecast
US Federal Surplus/Deficit as a Percentage of GDP (%) S&P 500 Forward Price/Earnings Ratio
S&P 500 Forward Price/Earnings Ratio 13.21US Federal Surplus/Deficit as a Percentage of GDP -3.30
Source: Citi Research, Morgan Stanley Smith Barney. Data as of December 2012

Past performance is no guarantee of future results. This material is not a solicitation of any offer to buy or sell any security or other financial instrument or to participate in any trading strategy.
Please refer to important information, disclosures and qualifications at the end of this material.
Emerging Market Equities Are Leading Global Equities
8
Emerging Market Equities Outperformed Most Developed Market Equities
In the Decade Before March 2009 Trough and Since
Source: Morgan Stanley & Co. Research, Citi Research, Morgan Stanley Smith Barney, Thomson Financial, Standard & Poor’s.Data as of January 2013.
-3 -2
0
-1
9
26
21
18
8
22
-5
0
5
10
15
20
25
30
USA United Kingdom Europe ex UK J apan Emerging Markets
Percent (%)
3/ 99 - 3/ 09 3/ 09 - Current

Past performance is no guarantee of future results. This material is not a solicitation of any offer to buy or sell any security or other financial instrument or to participate in any trading strategy.
Please refer to important information, disclosures and qualifications at the end of this material.
Global Earnings Per Share
9
*Morgan Stanley’s current and forecast policy rate for China uses the 1-year lending rate. **Citi’s current and forecast policy rate for China uses the 1-year deposit rate.
Source: Morgan Stanley & Co. Research, Citi Research, Bloomberg, Morgan Stanley Smith Barney. Data as of December 2012.
Operating EPS ($)
YOY Change (%)
Operating EPS ($)
YOY Change (%)
Operating EPS ($)
YOY Change (%)
Operating EPS ($)
YOY Change (%)
Operating EPS ($)
YOY Change (%)
100.00 2 103.00 5 101.99 6 25.06 3 87.27 3
99.00 -1 108.00 5 111.31 9 27.88 11 99.34 14
110.00 11 113.00 5 124.35 12 31.04 11 109.15 10
52 Week Forward 111.94 27.87 99.34
2012E
2014E
S&P 500Citi Research
2013E
ConsensusMSCI AC World MSCI EMS&P 500
Morgan Stanley & Co.

Past performance is no guarantee of future results. This material is not a solicitation of any offer to buy or sell any security or other financial instrument or to participate in any trading strategy.
Please refer to important information, disclosures and qualifications at the end of this material.
Interest Rate Forecasts
Estimates of future performance are based on assumptions that may not be realized. This material is not a solicitation of any offer to buy or sell any security or other financial instrument or to participate in any trading strategy.
10
*Morgan Stanley’s current and forecast policy rate for China uses the 1-year lending rate. **Citi’s current and forecast policy rate for China uses the 1-year deposit rate.
Source: Morgan Stanley & Co. Research, Citi Research, Bloomberg, Morgan Stanley Smith Barney. Data as of December 2012.
1Q13F 4Q13F 1Q13F 4Q13F
0.00 – 0.25 0.15 0.15 US 0.00 - 0.25 0.25 0.25
0.75 0.50 0.50 Eurozone 0.75 0.50 0.25
0.10 0.05 0.05 Japan 0.10 0.10 0.10
0.50 0.50 0.50 UK 0.50 0.50 0.506.00* 6.00* 6.00* China 3.00* 3.00** 3.25**
1.89 1.84 2.24 US 1.89 1.75 2.50
1.51 1.42 1.68 Eurozone 1.51 1.50 1.50
0.82 0.95 1.20 Japan 0.82 0.85 1.10
2.09 1.74 2.20 UK 2.09 1.85 1.80
10-Year Government Bond Yields (%)
Morgan Stanley Citi ResearchCurrent Rate Current Rate
Policy Rates (%) Policy Rates (%)
US
Eurozone
Japan
UK
US
Eurozone
Japan
UK
China
10-Year Government Bond Yields (%)

Past performance is no guarantee of future results. This material is not a solicitation of any offer to buy or sell any security or other financial instrument or to participate in any trading strategy.
Please refer to important information, disclosures and qualifications at the end of this material.
Stocks vs. Bonds and Cash Valuation
'70 '72 '74 '76 '78 '80 '82 '84 '86 '88 '90 '92 '94 '96 '98 '00 '02 '04 '06 '08 '10 '12-3
-2
-1
0
1
2
3
4
-3
-2
-1
0
1
2
3Equities Relatively Expensive
Equities Relatively Cheap
Standard Deviations From Average
Cash Rate/Dividend YieldBond Yield/Dividend Yield
11
Note: Standard deviation is a statistical measurement that sheds light on historical volatility.
Source: Citi Research, Morgan Stanley & Co. Research, Morgan Stanley Smith Barney, Thomson Financial. Data as of December 2012.

Past performance is no guarantee of future results. This material is not a solicitation of any offer to buy or sell any security or other financial instrument or to participate in any trading strategy.
Please refer to important information, disclosures and qualifications at the end of this material.
US Secular Stock Bear and Bull Marketsand Inflation Since 1946
1212
'46 '48 '50 '52 '54 '56 '58 '60 '62 '64 '66 '68 '70 '72 '74 '76 '78 '80 '82 '84 '86 '88 '90 '92 '94 '96 '98 '00 '02 '04 '06 '08 '10 '12
20
30
40506070
100
200
300
400500600700
1,000
2,000
0%
1%
2%
3%
4%
5%
6%
7%
8%
9%
10%
Dec. 19
68
Au
g.198
2
Mar 2
000
Mar. 200
9
Bull 1946 - 1968Av erage Annual
Total ReturnNominal = 13%
Real = 10%Bear 1969 - 1982Av erage Annual
Total ReturnNominal = 5%
Real = (2)%
Bull 1982 - 2000Av erage Annual
Total ReturnNominal = 18%
Real = 15%
Bear 3/2000 -3/2009Av erage Annual
Total ReturnNominal = (5)%
Real = (7)%
Cyc
lical
Bu
ll
S &P 500 (log scale) Core CPI (%)
Core CPIS&P 500 Price
Note: Core Inflation is a 5-year moving average; headline inflation prior to 1963. Past performance is not a guarantee of future results. For illustrative purposes only and does not reflect any specific product. The Standard & Poor’s 500 Index (S&P 500) is an unmanaged group of large company stocks. Index returns assume reinvestment of dividends and do not reflect any fees or expenses. Cyclical Bull cycle represents March 2009 through present.
Source: Morgan Stanley Smith Barney, Bloomberg, Ibbotson Associates and FactSet. Data as of November 2012.The following disclosure pertains to Ibbotson Associates’ data on slides 12 and 13:
(c) 2013 Morningstar, Inc. All Rights Reserved. The information contained herein: (1) is proprietary to Morningstar and/or its content providers; (2) may not be copied or distributed; and (3) is not warranted to be accurate, complete or timely. Neither Morningstar nor its content providers are responsible for any damages or losses arising from any use of this information. Past performance is no guarantee of future results.
Source: Calculated by Morgan Stanley Smith Barney LLC using data provided by Morningstar. (c) 2013 Morningstar, Inc. All rights reserved. Used with permission. This information contained herein: (1) is proprietary to Morningstar and/or its content providers; (2) may not be copied or distributed; and (3) is not warranted to be accurate, complete or timely. Neither Morningstar nor its content providers are responsible for any damages or losses arising from any use of this information.

Past performance is no guarantee of future results. This material is not a solicitation of any offer to buy or sell any security or other financial instrument or to participate in any trading strategy.
Please refer to important information, disclosures and qualifications at the end of this material.
US Secular Bond Bear and Bull Marketsand Inflation Since 1946
13
A Secular Bull Market in Bonds Is Coming to an End
13
'46 '48 '50 '52 '54 '56 '58 '60 '62 '64 '66 '68 '70 '72 '74 '76 '78 '80 '82 '84 '86 '88 '90 '92 '94 '96 '98 '00 '02 '04 '06 '08 '10 '120
2
4
6
8
10
12
14
16
Sept 1981
Bear 1946 - 1981Average Annual
Total ReturnNominal = 2%
Real = (3)%
Bull 1981 - PresentAverage Annual
Total ReturnNominal = 11%
Real = 9%
Source: Bloomberg, Ibbotson and Factset.Note: Core CPI 5 YEAR ma; headline CPI prior to 1963.
LT Bond Yield (%)Core CPI (%)
Long Bond YieldCore CPI
Note: Core Inflation is a 5-year moving average; headline inflation prior to 1963.
Source: Morgan Stanley Smith Barney, Ibbotson Associates and FactSet. Data as of November 2012.

Past performance is no guarantee of future results. This material is not a solicitation of any offer to buy or sell any security or other financial instrument or to participate in any trading strategy.
Please refer to important information, disclosures and qualifications at the end of this material.14
Global Investment CommitteeEquity Strategy
This material is not a solicitation of any offer to buy or sell any security or other financial instrument or to participate in any trading strategy.
Equities expected to outperform
Overweight Emerging Markets and U.S.
Market weight Europe
Underweight Japan
Within U.S., overweight Large Caps and growth and underweight Small and
Mid Caps and value

Past performance is no guarantee of future results. This material is not a solicitation of any offer to buy or sell any security or other financial instrument or to participate in any trading strategy.
Please refer to important information, disclosures and qualifications at the end of this material.15
Global Investment CommitteeFixed Income Strategy
This material is not a solicitation of any offer to buy or sell any security or other financial instrument or to participate in any trading strategy.
Bonds expected to underperform stocks
Overweight Global IG Corporates (Munis for U.S. clients) and Emerging Market Debt
Underweight Short Duration, Developed Country Sovereign Debt, High Yield and Inflation-Linked Securities
Past performance is no guarantee of future results. This material is not a solicitation of any offer to buy or sell any security or other financial instrument or to participate in any trading strategy.
Please refer to important information, disclosures and qualifications at the end of this material.16
Global Investment CommitteeAlternative/Absolute Return Strategy
Overweight Managed Futures and Commodities
Underweight global REITs
This material is not a solicitation of any offer to buy or sell any security or other financial instrument or to participate in any trading strategy.

Past performance is no guarantee of future results. This material is not a solicitation of any offer to buy or sell any security or other financial instrument or to participate in any trading strategy.
Please refer to important information, disclosures and qualifications at the end of this material.17
Glossary of Indices
CPI
In economics, a Consumer Price Index (CPI, also retail price index) is a statistical measure of a weighted average of prices of a specified set of goods and services purchased by wage earners in urban areas. It is a price index that tracks the prices of a specified set of consumer goods and services, providing a measure of inflation. The CPI is a fixed quantity price index and a sort of cost-of-living index. The CPI can be used to track changes in prices of all goods and services purchased for consumption by urban households. User fees (such as water and sewer service) and sales and excise taxes paid by the consumer are also included. Income taxes and investment items (like stocks, bonds, life insurance, and homes) are not included. Core CPI excludes volatile food and energy prices.
MSCI EAFE
The MSCI EAFE Index (Europe, Australasia, Far East) is a free float-adjusted market capitalization index that is designed to measure developed market equity performance, excluding the US & Canada.
MSCI World Index
The MSCI World Index is a free float-adjusted market capitalization index that is designed to measure global developed market equity performance. As of May 2005 the MSCI World Index consisted of the following 23 developed market country indices: Australia, Austria, Belgium, Canada, Denmark, Finland, France, Germany, Greece, Hong Kong, Ireland, Italy, Japan, Netherlands, New Zealand, Norway, Portugal, Singapore, Spain, Sweden, Switzerland, the United Kingdom and the United States. An investment cannot be made directly in a market index.
S&P 500
Widely regarded as the best single gauge of the U.S. equities market, this world-renowned index includes a representative sample of 500 leading companies in leading industries of the U.S. economy. Although the S&P 500 focuses on the large-cap segment of the market, with over 80% coverage of U.S. equities, it is also an ideal proxy for the total market.

Past performance is no guarantee of future results. This material is not a solicitation of any offer to buy or sell any security or other financial instrument or to participate in any trading strategy.
Please refer to important information, disclosures and qualifications at the end of this material.18
Important DisclosuresThis material has been prepared for informational purposes only and is not an offer to buy or sell or a solicitation of any offer to buy or sell any security or other financial instrument or to participate in any trading strategy. This is not a research report and was not prepared by the Research Departments of Morgan Stanley & Co. LLC or Citigroup Global Markets Inc. The views and opinions contained in this material are those of the author(s) and may differ materially from the views and opinions of others at Morgan Stanley Smith Barney LLC or any of its affiliate companies. Past performance is not necessarily a guide to future performance.
The author(s) (if any authors are noted) principally responsible for the preparation of this material receive compensation based upon various factors, including quality and accuracy of their work, firm revenues (including trading and capital markets revenues), client feedback and competitive factors. Morgan Stanley Smith Barney is involved in many businesses that may relate to companies, securities or instruments mentioned in this material.
This material has been prepared for informational purposes only and is not an offer to buy or sell or a solicitation of any offer to buy or sell any security/instrument, or to participate in any trading strategy. Any such offer would be made only after a prospective investor had completed its own independent investigation of the securities, instruments or transactions, and received all information it required to make its own investment decision, including, where applicable, a review of any offering circular or memorandum describing such security or instrument. That information would contain material information not contained herein and to which prospective participants are referred. This material is based on public information as of the specified date, and may be stale thereafter. We have no obligation to tell you when information herein may change. We make no representation or warranty with respect to the accuracy or completeness of this material. Morgan Stanley Smith Barney has no obligation to provide updated information on the securities/instruments mentioned herein.
The securities/instruments discussed in this material may not be suitable for all investors. The appropriateness of a particular investment or strategy will depend on an investor’s individual circumstances and objectives. Morgan Stanley Smith Barney recommends that investors independently evaluate specific investments and strategies, and encourages investors to seek the advice of a financial advisor. The value of and income from investments may vary because of changes in interest rates, foreign exchange rates, default rates, prepayment rates, securities/instruments prices, market indexes, operational or financial conditions of companies and other issuers or other factors. Estimates of future performance are based on assumptions that may not be realized. Actual events may differ from those assumed and changes to any assumptions may have a material impact on any projections or estimates. Other events not taken into account may occur and may significantly affect the projections or estimates. Certain assumptions may have been made for modeling purposes only to simplify the presentation and/or calculation of any projections or estimates, and Morgan Stanley Smith Barney does not represent that any such assumptions will reflect actual future events. Accordingly, there can be no assurance that estimated returns or projections will be realized or that actual returns or performance results will not materially differ from those estimated herein.
This material should not be viewed as advice or recommendations with respect to asset allocation or any particular investment. This information is not intended to, and should not, form a primary basis for any investment decisions that you may make. Morgan Stanley Smith Barney is not acting as a fiduciary under either the Employee Retirement Income Security Act of 1974, as amended or under section 4975 of the Internal Revenue Code of 1986 as amended in providing this material.
Morgan Stanley Smith Barney and its affiliates do not render advice on tax and tax accounting matters to clients. This material was not intended or written to be used, and it cannot be used or relied upon by any recipient, for any purpose, including the purpose of avoiding penalties that may be imposed on the taxpayer under U.S. federal tax laws. Each client should consult his/her personal tax and/or legal advisor to learn about any potential tax or other implications that may result from acting on a particular recommendation.
International investing entails greater risk, as well as greater potential rewards compared to U.S. investing. These risks include political and economic uncertainties of foreign countries as well as the risk of currency fluctuations. These risks are magnified in countries with emerging markets, since these countries may have relatively unstable governments and less established markets and economies.
Alternative investments which may be referenced in this report, including private equity funds, real estate funds, hedge funds, managed futures funds, funds of hedge funds, private equity, and managed futures funds, are speculative and entail significant risks that can include losses due to leveraging or other speculative investment practices, lack of liquidity, volatility of returns, restrictions on transferring interests in a fund, potential lack of diversification, absence and/or delay of information regarding valuations and pricing, complex tax structures and delays in tax reporting, less regulation and higher fees than mutual funds and risks associated with the operations, personnel and processes of the advisor.
Investing in commodities entails significant risks. Commodity prices may be affected by a variety of factors at any time, including but not limited to, (i) changes in supply and demand relationships, (ii) governmental programs and policies, (iii) national and international political and economic events, war and terrorist events, (iv) changes in interest and exchange rates, (v) trading activities in commodities and related contracts, (vi) pestilence, technological change and weather, and (vii) the price volatility of a commodity. In addition, the commodities markets are subject to temporary distortions or other disruptions due to various factors, including lack of liquidity, participation of speculators and government intervention.

Past performance is no guarantee of future results. This material is not a solicitation of any offer to buy or sell any security or other financial instrument or to participate in any trading strategy.
Please refer to important information, disclosures and qualifications at the end of this material.19
Important DisclosuresBonds are subject to interest rate risk. When interest rates rise, bond prices fall; generally the longer a bond's maturity, the more sensitive it is to this risk. Bonds may also be subject to call risk, which is the risk that the issuer will redeem the debt at its option, fully or partially, before the scheduled maturity date. The market value of debt instruments may fluctuate, and proceeds from sales prior to maturity may be more or less than the amount originally invested or the maturity value due to changes in market conditions or changes in the credit quality of the issuer. Bonds are subject to the credit risk of the issuer. This is the risk that the issuer might be unable to make interest and/or principal payments on a timely basis. Bonds are also subject to reinvestment risk, which is the risk that principal and/or interest payments from a given investment may be reinvested at a lower interest rate.
Bonds rated below investment grade may have speculative characteristics and present significant risks beyond those of other securities, including greater credit risk and price volatility in the secondary market. Investors should be careful to consider these risks alongside their individual circumstances, objectives and risk tolerance before investing in high-yield bonds. High yield bonds should comprise only a limited portion of a balanced portfolio.
Interest on municipal bonds is generally exempt from federal income tax; however, some bonds may be subject to the alternative minimum tax (AMT). Typically, state tax-exemption applies if securities are issued within one's state of residence and, if applicable, local tax-exemption applies if securities are issued within one's city of residence.
Treasury Inflation Protection Securities’ (TIPS) coupon payments and underlying principal are automatically increased to compensate for inflation by tracking the consumer price index (CPI). While the real rate of return is guaranteed, TIPS tend to offer a low return. Because the return of TIPS is linked to inflation, TIPS may significantly underperform versus conventional U.S. Treasuries in times of low inflation.
Equity securities may fluctuate in response to news on companies, industries, market conditions and general economic environment.
Investing in smaller companies involves greater risks not associated with investing in more established companies, such as business risk, significant stock price fluctuations and illiquidity.
Stocks of medium-sized companies entail special risks, such as limited product lines, markets, and financial resources, and greater market volatility than securities of larger, more-established companies.
Asset allocation and diversification do not assure a profit or protect against loss in declining financial markets.
The indices are unmanaged. An investor cannot invest directly in an index. They are shown for illustrative purposes only and do not represent the performance of any specific investment.
REITs investing risks are similar to those associated with direct investments in real estate: property value fluctuations, lack of liquidity, limited diversification and sensitivity to economic factors such as interest rate changes and market recessions.
Because of their narrow focus, sector investments tend to be more volatile than investments that diversify across many sectors and companies.
Investing in foreign emerging markets entails greater risks than those normally associated with domestic markets, such as political, currency, economic and market risks.
Growth investing does not guarantee a profit or eliminate risk. The stocks of these companies can have relatively high valuations. Because of these high valuations, an investment in a growth stock can be more risky than an investment in a company with more modest growth expectations.
Value investing does not guarantee a profit or eliminate risk. Not all companies whose stocks are considered to be value stocks are able to turn their business around or successfully employ corrective strategies which would result in stock prices that do not rise as initially expected. Certain securities referred to in this material may not have been registered under the U.S. Securities Act of 1933, as amended, and, if not, may not be offered or sold absent an exemption therefrom. Recipients are required to comply with any legal or contractual restrictions on their purchase, holding, sale, exercise of rights or performance of obligations under any securities/instruments transaction.
This material is disseminated in Australia to “retail clients” within the meaning of the Australian Corporations Act by Morgan Stanley Smith Barney Australia Pty Ltd (A.B.N. 19 009 145 555, holder of Australian financial services license No. 240813).
19

Past performance is no guarantee of future results. This material is not a solicitation of any offer to buy or sell any security or other financial instrument or to participate in any trading strategy.
Please refer to important information, disclosures and qualifications at the end of this material.20
Important DisclosuresMorgan Stanley Smith Barney is not incorporated under the People's Republic of China ("PRC") law and the research in relation to this report is conducted outside the PRC. This report will be distributed only upon request of a specific recipient. This report does not constitute an offer to sell or the solicitation of an offer to buy any securities in the PRC. PRC investors must have the relevant qualifications to invest in such securities and must be responsible for obtaining all relevant approvals, licenses, verifications and or registrations from PRC's relevant governmental authorities.
Morgan Stanley Private Wealth Management Ltd, which is authorized and regulated by the Financial Services Authority, approves for the purpose of section 21 of the Financial Services and Markets Act 2000, content for distribution in the United Kingdom.
Morgan Stanley Smith Barney is not acting as a municipal advisor and the opinions or views contained herein are not intended to be, and do not constitute, advice within the meaning of Section 975 of the Dodd-Frank Wall Street Reform and Consumer Protection Act.
This material is disseminated in the United States of America by Morgan Stanley Smith Barney LLC.
Third-party data providers make no warranties or representations of any kind relating to the accuracy, completeness, or timeliness of the data they provide and shall not have liability for any damages of any kind relating to such data.
Morgan Stanley Smith Barney material, or any portion thereof, may not be reprinted, sold or redistributed without the written consent of Morgan Stanley Smith Barney.
© 2013 Morgan Stanley Smith Barney LLC. Member SIPC.