Part A . In your own words, briefly describe the content and purpose of each section.
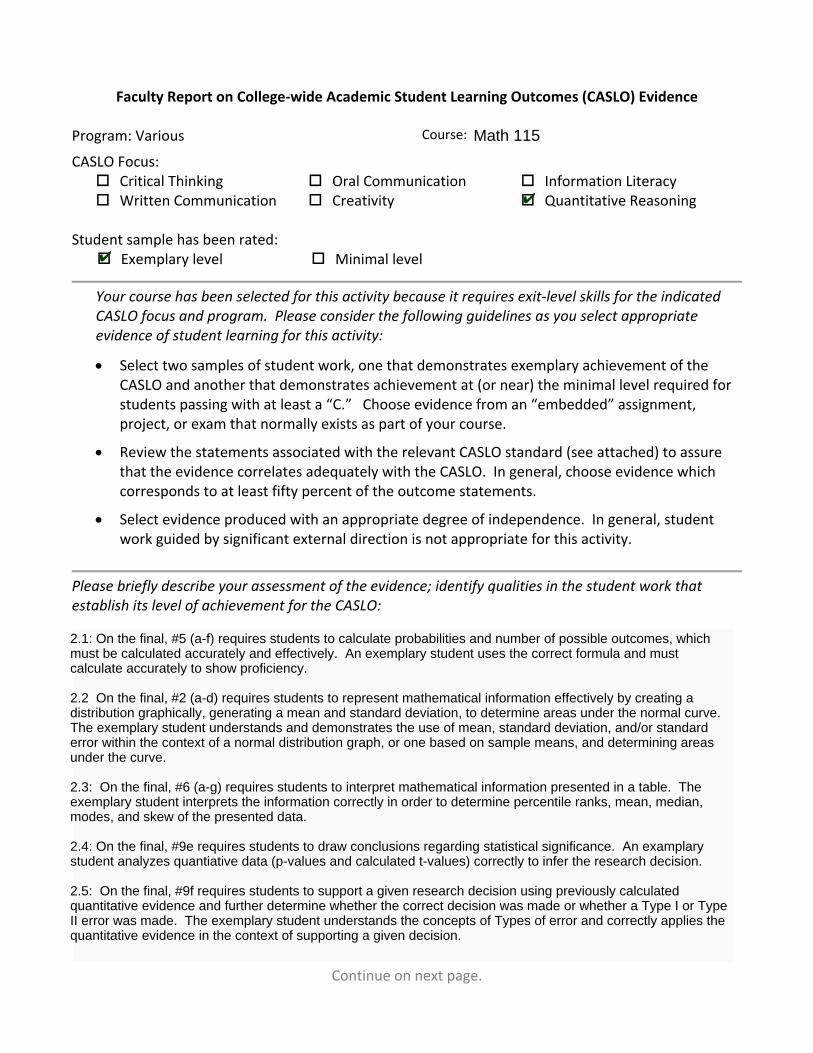
Faculty Report on College-wide Academic Student Learning Outcomes (CASLO) Evidence
Program: Various
CASLO Focus: Critical Thinking Written Communication
Oral Communication Creativity
Information Literacy Quantitative Reasoning
Student sample has been rated:
Exemplary level Minimal level
Your course has been selected for this activity because it requires exit-level skills for the indicated CASLO focus and program. Please consider the following guidelines as you select appropriate evidence of student learning for this activity:
Select two samples of student work, one that demonstrates exemplary achievement of the CASLO and another that demonstrates achievement at (or near) the minimal level required for students passing with at least a “C.” Choose evidence from an “embedded” assignment, project, or exam that normally exists as part of your course.
Review the statements associated with the relevant CASLO standard (see attached) to assure that the evidence correlates adequately with the CASLO. In general, choose evidence which corresponds to at least fifty percent of the outcome statements.
Select evidence produced with an appropriate degree of independence. In general, student work guided by significant external direction is not appropriate for this activity.
Please briefly describe your assessment of the evidence; identify qualities in the student work that establish its level of achievement for the CASLO:
Continue on next page.
✔
✔
2.1: On the final, #5 (a-f) requires students to calculate probabilities and number of possible outcomes, which must be calculated accurately and effectively. An exemplary student uses the correct formula and must calculate accurately to show proficiency.
2.2 On the final, #2 (a-d) requires students to represent mathematical information effectively by creating a distribution graphically, generating a mean and standard deviation, to determine areas under the normal curve. The exemplary student understands and demonstrates the use of mean, standard deviation, and/or standard error within the context of a normal distribution graph, or one based on sample means, and determining areas under the curve.
2.3: On the final, #6 (a-g) requires students to interpret mathematical information presented in a table. The exemplary student interprets the information correctly in order to determine percentile ranks, mean, median, modes, and skew of the presented data.
2.4: On the final, #9e requires students to draw conclusions regarding statistical significance. An examplary student analyzes quantiative data (p-values and calculated t-values) correctly to infer the research decision.
2.5: On the final, #9f requires students to support a given research decision using previously calculated quantitative evidence and further determine whether the correct decision was made or whether a Type I or Type II error was made. The exemplary student understands the concepts of Types of error and correctly applies the quantitative evidence in the context of supporting a given decision.
Math 115Course:

Please briefly describe course work designed to prepare this student to demonstrate this CASLO:
2.1: Throughout the semester, students review in-class presentations demonstrating appropriate and accuarate calculations, through the use of formulas and equations. Students demonstrate their ability to calculate accurately through graded homework assignments and quizzes (quizzes are reviewed with the class to show correct calculating, should mistakes have been made by students).
2.2: Through lecture, homework and quizzes, students are presented with data sets and tables. Graphing and numerical representations of the given data is demonstated and required of the student. The instructor encourages questions regarding the interpretation and further examples are given throughout the chapter's sections covering the concepts.
2.3: Throughout the semester, students are presented with representations of data, and interpretation of the representations are demonstated and explained by the instructor in lecture and through various homework assignments and quizzes. Through in-class discussions, students are encouraged to interpret the representations and support their interpretations.
2.4: Statistical analysis of quantiative data begins after the midterm. Students must generate specific pieces of data in order to make reasoned conclusions regarding statistical significance. Various methods of interpretation of quantitative data are demonstrated and practiced through classwork and homework.
2.5: After reviewing appropriate statistical conclusions based on quantitative data, students practice supporting given conclusions with generated quantitative evidence. Homework and class work are the best preparation for supporting given positions, since incorrect approaches can be corrected through teacher and peer demonstration.

Take-Home Final Fall 2014. Please TYPE and submit. Please NOTE: This is NOT for group effort. The work should be individually you, and you need to show/identify your work for credit.
1. Normal, Standard Curve. (4 pts)
a. On the Normal, Standard Curve, what are the two axes, and what do they represent?
b. What z-score represents the 10th percentile? c. What z-score represents the 90th percentile? d. What z-score represents the 95th percentile?
2. A.C. Neilsen reported that children between the ages of 2 and 5 watch an average of 25 hours of television per week. Assume a normal distribution, with a standard deviation of 3 hours. If 20 children between the ages of 2 and 5 are randomly selected, find the probability that the sample mean of number of hours they watch television will (4 pts)
a. Be greater than 26 hours b. Be between 24 and 26 hours c. Differ from the mean by more than 2 hours d. What’s the probability that one child watches TV for more than 26 hours a
week?
3. The standard deviation. (3pts) a. If the definition of the standard deviation is “how far, on average, the scores
in a sample vary from the mean”, why is the sum of squares divided by (n - 1) instead of by the number of scores in the sample (n).
b. If n = 25 and S = 10, what’s the standard error? c. What’s the formula for generating σ ? (3pts)

4. Researchers conducted a randomized, double-blind study to measure the effects of the drug olanzapine on patients diagnosed with bipolar disorder. A total of 115 patients with a DSM-IV diagnosis of bipolar disorder were randomly divided into two groups. Group 1 (n1 = 55) received 20 mg per day of olanzapine, while group 2 (n2 = 60) received a placebo. The effectiveness of the drug was measured using the Young-Mania rating scale, with the net improvement score recorded. Does the evidence suggest the experimental group experienced a larger mean improvement that the control group at α = .01 level of significance? (4 pts.)
Experimental Group (n1 = 55): mean improvement 14.8,
standard deviation 12.5 Control Group (n2 = 60): mean improvement 8.1,
standard deviation 12.7
a. To BEST analyze this data, specifically identify the type of statistical test. b. What’s the confidence interval? c. Based on the confidence interval, what’s the research decision? d. If the researcher decides to fail to reject the null, she’s made
a. The correct decision b. A Type I error c. A Type II error
5. Probability and Counting Principles (6pts)
a. At an ice cream parlor, customers have a choice between the sizes small or large, between 4 flavors, and 3 toppings. How many different combinations of size, flavors, and toppings can be made?
b. Before the beginning of a professional basketball game, the starting 5 players are announced 1 at a time. How many different ways can the order that the players are announced be arranged?
c. In poker, 5 cards are selected randomly from a deck of 52 cards. How many 5-card combinations exist?
d. What’s the probability of flipping a coin 5 times and getting at least one “tails”?
e. What’s the probability of rolling two die and getting “snake eyes” (rolling 2 ones)?
f. What’s the probability of drawing the Ace of Diamonds, and then 3 more diamonds without replacement?
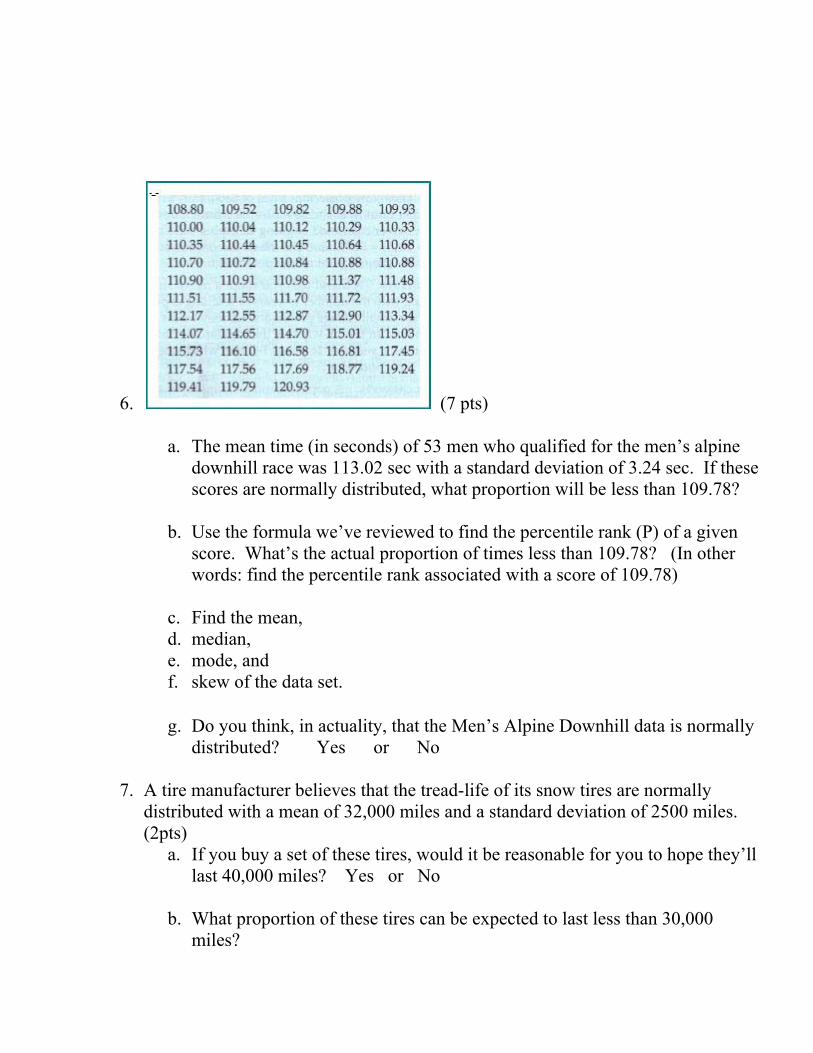
6. (7 pts)
a. The mean time (in seconds) of 53 men who qualified for the men’s alpine downhill race was 113.02 sec with a standard deviation of 3.24 sec. If these scores are normally distributed, what proportion will be less than 109.78?
b. Use the formula we’ve reviewed to find the percentile rank (P) of a given score. What’s the actual proportion of times less than 109.78? (In other words: find the percentile rank associated with a score of 109.78)
c. Find the mean, d. median, e. mode, and f. skew of the data set.
g. Do you think, in actuality, that the Men’s Alpine Downhill data is normally
distributed? Yes or No
7. A tire manufacturer believes that the tread-life of its snow tires are normally distributed with a mean of 32,000 miles and a standard deviation of 2500 miles. (2pts)
a. If you buy a set of these tires, would it be reasonable for you to hope they’ll last 40,000 miles? Yes or No
b. What proportion of these tires can be expected to last less than 30,000
miles?
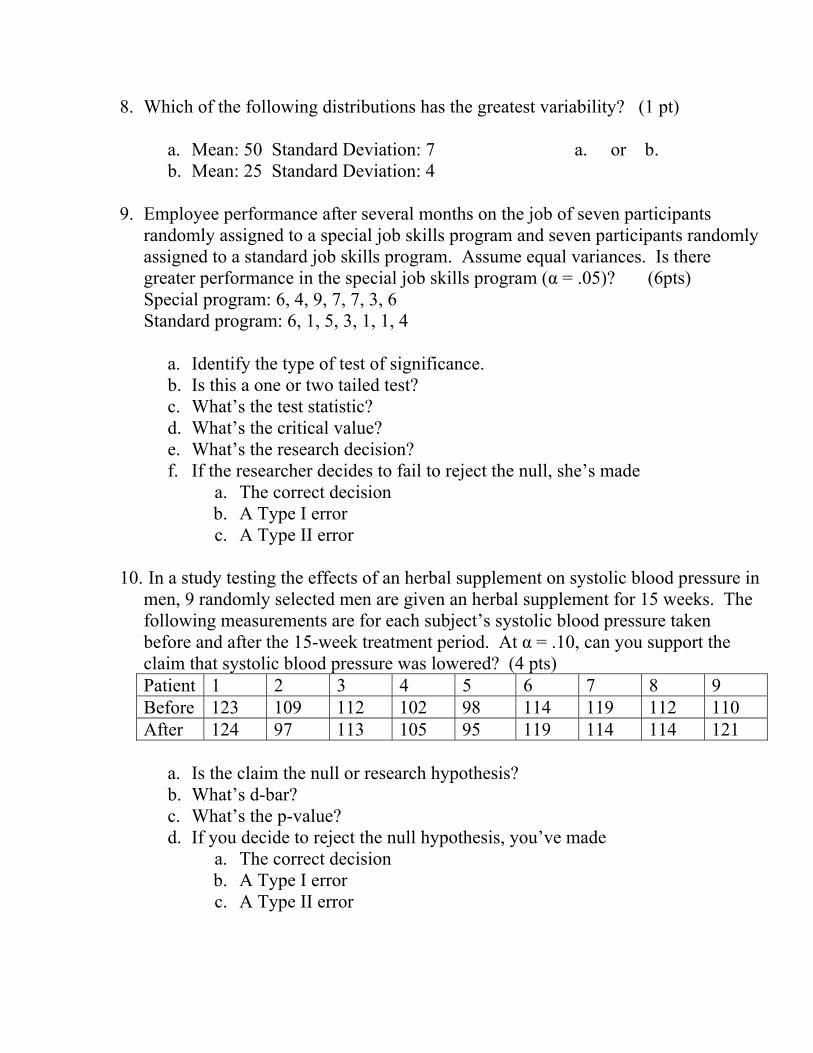
8. Which of the following distributions has the greatest variability? (1 pt)
a. Mean: 50 Standard Deviation: 7 a. or b. b. Mean: 25 Standard Deviation: 4
9. Employee performance after several months on the job of seven participants
randomly assigned to a special job skills program and seven participants randomly assigned to a standard job skills program. Assume equal variances. Is there greater performance in the special job skills program (α = .05)? (6pts) Special program: 6, 4, 9, 7, 7, 3, 6 Standard program: 6, 1, 5, 3, 1, 1, 4
a. Identify the type of test of significance. b. Is this a one or two tailed test? c. What’s the test statistic? d. What’s the critical value? e. What’s the research decision? f. If the researcher decides to fail to reject the null, she’s made
a. The correct decision b. A Type I error c. A Type II error
10. In a study testing the effects of an herbal supplement on systolic blood pressure in
men, 9 randomly selected men are given an herbal supplement for 15 weeks. The following measurements are for each subject’s systolic blood pressure taken before and after the 15-week treatment period. At α = .10, can you support the claim that systolic blood pressure was lowered? (4 pts) Patient 1 2 3 4 5 6 7 8 9 Before 123 109 112 102 98 114 119 112 110 After 124 97 113 105 95 119 114 114 121
a. Is the claim the null or research hypothesis? b. What’s d-bar? c. What’s the p-value? d. If you decide to reject the null hypothesis, you’ve made
a. The correct decision b. A Type I error c. A Type II error

11. Short Answer I. (3 pts) Imagine you’re talking to a friend who had this class a year ago and earned a B. She asks you to remind her about the three different ways to conclude that a t-test has produced a significant result (using specific statistical terms). She remembers her terms, but she wants you to remind her, in a paragraph, about each of the three basic processes used to determine significance.
12. Short Answer II. Choose any two questions. Define each term. (4 pts)
1. Why, with a t-test, is it more difficult to get a significant result if you have a
2-tailed hypothesis (2-tailed test)?
2. Using the term “probability”, explain what is meant by the phrase “a significant result”.
3. Using the terms “subjects” and “distribution”, explain the difference between conducting a 2-sample t-test and a 2-sample z-test.
4. What does a “critical value” represent?
13. Short Answer III. Choose any two questions. Define each term. (2 pts)
1. What’s the difference between taking a simple random sample and taking a stratified random sample?
2. What’s the difference between random sampling and random assignment?
3. What’s the difference between a “between-group” experimental design and a “within-group” experimental design?
4. Make up a study with results that would give a distribution skewed to the left.

49/50 (2c incorrect) Exemplary 1. Normal, Standard Curve. (4 pts)
a. The normal curve is plotted on a set of X-Y axes, where the X-axis represents “z-scores” and the Y-axis “frequency of z-scores.”
b. -1.28 (z-table) c. 1.28 (z-table) d. 1.64 (z-table)
2. A.C. Neilson (4 pts)
a. 0.068 (David m lane) b. 0.864 (David m lane) c. 0.068 (David m lane) d. 0.3694 (David m lane)
3. The Standard Deviation (3 pts) a. The sum of squares is divided by (n-1) instead of by the number of
scores in the sample because the “1/(n-1)” convention provides an unbiased estimate of the true population variance. We are looking for a greater variability.
b. σ= σ/√n
= 10/√25 = 2
c. σ = √ε (x-μ)2 / √N
4. Bipolar Disorder Data (4 pts) a. Independent sample z-test b. C.I = (0.6432, 12.7568) (using Stat Crunch) c. Reject the Null and accept the Research hypothesis d. (c) A Type II error
5. Probability and Counting Principles (6 pts)
a. 2x4x3= 24 b. 5!= 5x4x3x2x1= 120

c. 52 C 5 = 2,598,960 d. P(no tails): ½ x ½ x ½ x ½ x ½ = 1/32
P(at least 1 tail): 1-1/32= 31/32 or 0.96875 e. 2/72 or 0.0278 f. (1/52)(12/51)(11/50)(10/49)=.000203
6. Men’s Alpine Downhill Race (7 pts)
a. 0.1587 (David m lane) b. p = x/n; p = 2/53 = 0.0377 or 3.77th percentile (approximately 4th
percentile). c. 113.02358 (Stat Crunch) d. 111.55 (Stat Crunch) e. 110.88 (Stat Crunch) f. Positive Skew g. NO
7. Tire Manufacturer (2 pts) a. z= (x-μ) / σ = (40,000-32,000)/2500 = 3.2.
NO; 40,000 miles is over 3 standard deviations above the mean and therefore it would not be reasonable for you to hope the tires will last that long.
b. 0.2119 or 21.19% of these tires can be expected to last less than 30,000 miles (David m lane)
8. Greatest Variability (1 pt)
(a) CV = (Standard deviation/Mean) (100%) = (7/50) (100%) =14%

(b) CV = (Standard deviation/Mean) (100%) = (4/25) (100%) = 16%
The CV for distribution (a) is 14% and the CV of distribution (b) is 16%, therefore distribution (b) has a greater variability.
9. Employee Performance (6 pts) a. Independent sample t-test b. One-tailed test c. 2.7495 (Stat Crunch) d. 1.7823 (David m lane) e. Reject the null and accept the research hypothesis f. Type II error
10. Herbal Supplement (4 pts) a. Research hypothesis b. -0.3333 (Stat Crunch) c. 0.4408 (Stat Crunch) d. Type I error
11. Short Answer I. (3 pts)
The three different ways to conclude that a t-test has produced a significant result is by comparing the p-value to the given alpha, comparing the standardized test statistic to the critical value/determining if it is in the rejection region, and determining if the critical value is within the confidence interval. If the p-value is lesser than alpha, then reject the null and accept the research hypothesis. If the standardized test statistic is beyond the critical t value (in the rejection region) then reject the null. If the critical value is within the confidence interval then reject the null and accept the research hypothesis.

12. Short Answer II. Choose Any Two Questions (4 pts) 1.Using the term “probability”, explain what is meant by the phrase “a significant result”.
A significant result is interpreted as not likely to have occurred purely by chance and thereby have other underlying cause for its occurrence. To determine whether it is a significant result or not, we calculate the probability that the process was simply a chance encounter, and set a minimum threshold of statistical significance. If the results are obtained such that the probability that it is simply a chance process is less than this threshold of significance, then we can say the results are not due to chance. Example, if an experimenter sets his significance level (alpha) at 0.05 and the probability (p-value) is 0.04, then the experimenter can claim that the null hypothesis can be rejected.
2. What does a “critical value” represent?
A critical value is the value corresponding to a given significance level. This cutoff value determines the boundary between those samples resulting in a test statistic that leads to rejecting the null hypothesis and those that lead to a decision not to reject the null hypothesis. If the calculated value from the statistical test is less than the critical value, then you fail to reject the null hypothesis. If the calculated statistic is outside of the critical value, you may reject the null hypothesis at the pre-specified level of significance.

13. Short Answer III. Choose Any Two Questions. (2 pts) 1. What is the difference between taking a simple random sample and
taking a stratified random sample? In a simple random sample, every possible sample of the same size has the same chance of being selected, meaning a different number is assigned to each member of the population and then randomly select from the entire population. In a stratified random sample, the population is divided into subpopulations called strata, where each segment of the population is represented, and then randomly select from each of the strata.
2. What is the difference between a “between-group” experimental design and a “within-group” experimental design? A “Between-group” experimental design describes statistical comparison of two or more different groups of subjects that are subject to different experiences or treatments. “Between-group” designs are used when one doesn't have the time, interest, or means to arrive at true explanations for behavior. The subject effects are randomized throughout all conditions. “order” effects do not affect it. It is statistically easy to analyze. A“within-group experimental design is a type of experimental design where one looks at changes in behavior across treatments. It has a fewer subject (eliminates “subject” effects) compared to the “between-group.” It has possible “order” effects or “learning factors.”

Faculty Report on College-wide Academic Student Learning Outcomes (CASLO) Evidence
Program: Various
CASLO Focus: Critical Thinking Written Communication
Oral Communication Creativity
Information Literacy Quantitative Reasoning
Student sample has been rated:
Exemplary level Minimal level
Your course has been selected for this activity because it requires exit-level skills for the indicated CASLO focus and program. Please consider the following guidelines as you select appropriate evidence of student learning for this activity:
Select two samples of student work, one that demonstrates exemplary achievement of the CASLO and another that demonstrates achievement at (or near) the minimal level required for students passing with at least a “C.” Choose evidence from an “embedded” assignment, project, or exam that normally exists as part of your course.
Review the statements associated with the relevant CASLO standard (see attached) to assure that the evidence correlates adequately with the CASLO. In general, choose evidence which corresponds to at least fifty percent of the outcome statements.
Select evidence produced with an appropriate degree of independence. In general, student work guided by significant external direction is not appropriate for this activity.
Please briefly describe your assessment of the evidence; identify qualities in the student work that establish its level of achievement for the CASLO:
Continue on next page.
✔
2.1: On the final, #5 (a-f) requires students to calculate probablilites and number of possible outcomes, which must be calculated accurately and effectively. Minimal proficiency is demonstrated by correctly calculating more than four of the presented problems. The minimal proficiency designation is based on inaccurate calcuations and formulaic approach to the problems.
2.2 On the final, #2(a-d) requires students to represent mathematical information effectively by creating a distribution graphically, generating a mean and standard deviation, to determine areas under the normal curve. Minimal proficiency is determined by the student missing one of four questions. The minimal proficiency student fails to create the proper distribution (a normal distribution or a distribution of sample means), using the standard deviation instead of the standard error (or vice-versa).
2.3: On the final, #6 (a-g) requires students to interpret mathematical information presented in a table. The minimal proficiency student fails to interpret the infornation as a skewed distribution, dispite being able to generate a mean, median, mode or fails to apply his knowledge of skew to the presented data.
2.4: On the final, #9e requires students to draw conclusions regarding statistical significance. The minimal proficiency student fails to analyze the quantitative data accurately (doesn't have a clear understanding of the impact of specific data (the alpha level vs. the p-value or the calculated t-value vs. the critical value).
2.5: On the final, #9f requires students to support a given research decision using previously calculated quantitative evidence. The minimal proficiency student either calculated incorrectly or fails recognize the impact the evidence has in determining the given research decision.
Math 115Course:

Please briefly describe course work designed to prepare this student to demonstrate this CASLO:
2.1: Throughout the semester, students review in-class presentatinos demonstrating appropriate and accurate calculations, through the use of formulas and equations. Students demonstrate their abiltity to calculate accurately through graded homework assignments and quizzes (quizzes are reviewed with the class to show correct calcuations, should mistakes have been made by students).
2.2: Through lecture, homework and quizzes, students are presented with data sets and tables. Graphing and numerical representations of the given data are demonstated and required of the student. The instructor encourages questions regarding the interpretation and further examples are given throughout the chapter's sections covering the concepts.
2.3: Throughout the semester, students are presented with representations of data, and interpretation of the representations are demonstrated and explained by the instructor in lecture and through various homework assignments and quizzes. Through in-class discussions, students are encouraged to interpret the representations and support their interpretations.
2.4: Statistical analysis of quantitative data begins after the midterm. Students must generate specific pieces of data in order to make reasoned conclusions regarding statistical significance. Various methods of interpretation of quantitative data are demonstrated and practiced through classwork and homework.
2.5: After reviewing appropriate statistical conclusions based on quantitative data, students practice supporting given conclusions with generated quantitative evidence. Homework and class work are the best preparation for supporting given positions, since incorrect approaches can be corrected through teacher and peer demonstrations.

Missed 4ab, 5bdef, 8a, 9ac, 10ac, 11(-1), 12(-2) = -14.5 35/50 C- Minimal Proficiency
Take-Home Final Spr 2014. Please TYPE and submit. Please NOTE: This is NOT for group effort. The work should be individually you, and you need to show all work for credit. If you use an online calculator, identify it (dml = david m. lane site, for example).
1. Normal, Standard Curve. (4 pts) a. x-axis= z-scores, y-axis= frequency of z-scores (Statistics book)
b. - 1.282 (DML)
c. 1.282 (DML)
d. 1.645 (DML)
2. A.C. Neilson (4 pts)
a. 0.068 (DML)
b. 0.864 (DML)
c. 0.003 (DML)
d. 0.369 (DML)
3. The Standard Deviation (3 pts)
a. It is an unbiased estimate of σ . Also, the sample mean is used instead of the
population mean to get a better variability. (Powerpoint)
b. SEx= s / sqrt( n ) → 10/sqrt(25) → 10/5 = 2 (Formula from book)
c. (Stat book)

4. Bipolar Disorder Data (4 pts)
a. z-test
b. x̄ – E ≤ M ≤ x̄ + E
= 14.8- 4.34 < M < 14.8+4.34
= 10.46 < M < 19.14 (SC + TI-84)
c. Reject the null
d. Type 2 error
5. Probability and Counting Principles (6 pts)
a. 2*4*3=24 (TI-84)
b. 5 nCr 1 = 5 (TI-84)
c. 52 nCr 5 = 2,598,960 (TI-84)
d. 2^5= 32
32-1 = 31 (TI-84)
e. 1-1/36= 35/36 = .972 (TI-84)
f. (13/52)*(12/51)*(11/50)*(10/49)= 0.003 (TI-84)
6. Men’s Alpine Downhill Race (7 pts)
a. 0.15869 ≈ 0.159 (DML)
b. 3.7736 ≈ 3.774 ≈ 4% (EasyCalc)
c. 113.02358 ≈ 113.024 (SC)
d. 111.55 (SC)
e. 110.88 (SC)
f. 0.8949 ≈ 0.895 (positive skew) (SC)
g. No (used histogram on SC)
7. Tire Manufacturer (2 pts)

a. Not reasonable, because the tread-life of its snow tires have a mean of 32,000 miles
b. 0.21189 ≈ 0.212 (DML)
8. Greatest Variability (1 pt)
a. Or b.
Answer: A (drew out a graph)
9. Employee Performance (6 pts)
a. t-test
b. One-tailed
c. 4.1450957 ≈ 4.145 (SC)
d. 1.782 (t-Distribution table)
e. Reject
f. Type 2
10. Herbal Supplement (4 pts)
a. Null
b. -0.333 (SC)
c. 0.882 (SC)
d. Type 1
11. Short Answer I. (3 pts)
The level of significance is your maximum allowable probability of making a type 1 error. One can conclude that a t-test has produced a significant result in three different ways. First,

if the absolute value of t beats the critical value, it is significant. Second, if the calculated t is in the rejection region, it is significant. Third, if the p-value is as small or smaller than alpha, we say that the data is statistically significant at the level of alpha. Furthermore, the lower the significance level, the more confident you can be in replicating your results. (Lecture notes/Stats book)
12. Short Answer II. Choose Any Two Questions (4 pts)
1. What does a critical value represent?
Critical values are values that separate sample statistics that are probable from sample statistics that are improbable, or unusual. (Stats book)
2. Why, with a t-test, is it more difficult to get a significant result if you have a 2-tailed hypothesis (2-tailed test)?
If the alternate hypothesis contains the not-equal-to symbol, then the hypothesis test is a two-tailed test. It is more difficult to get a significant result in a two-tailed test because no direction is specified. Likewise, in a one-tailed test, previous research suggests a specific direction, making it more easier to get a significant level. (Notes/Stats book)
13. Short Answer III. Choose Any Two Questions. (2 pts)
1. What’s the difference between taking a simple random sample and taking a stratified random sample?
A simple random sample is a sample in which every possible sample of the same size has the same chance of being selected. In a stratified random sample, you divide the population into strata. The strata are formed based on members' shared attitudes or characteristics. When it is important for the sample to have members from each segment of the population, you should use a stratified sample. (Notes/Stats book)
2. What’s the difference between random sampling and random assignment? Random sampling allows us to obtain a sample representative of the population. Therefore, results of the study can be generalized to the population. Likewise, random assignment allows us to make sure that the only difference between the various treatment

groups is what we are studying. Therefore, causality can be inferred. In other words, random selection is how you draw the sample of people for your study from a population. Random assignment is how you assign the sample that you draw to different groups or treatments in your study. (Notes/Stats book)