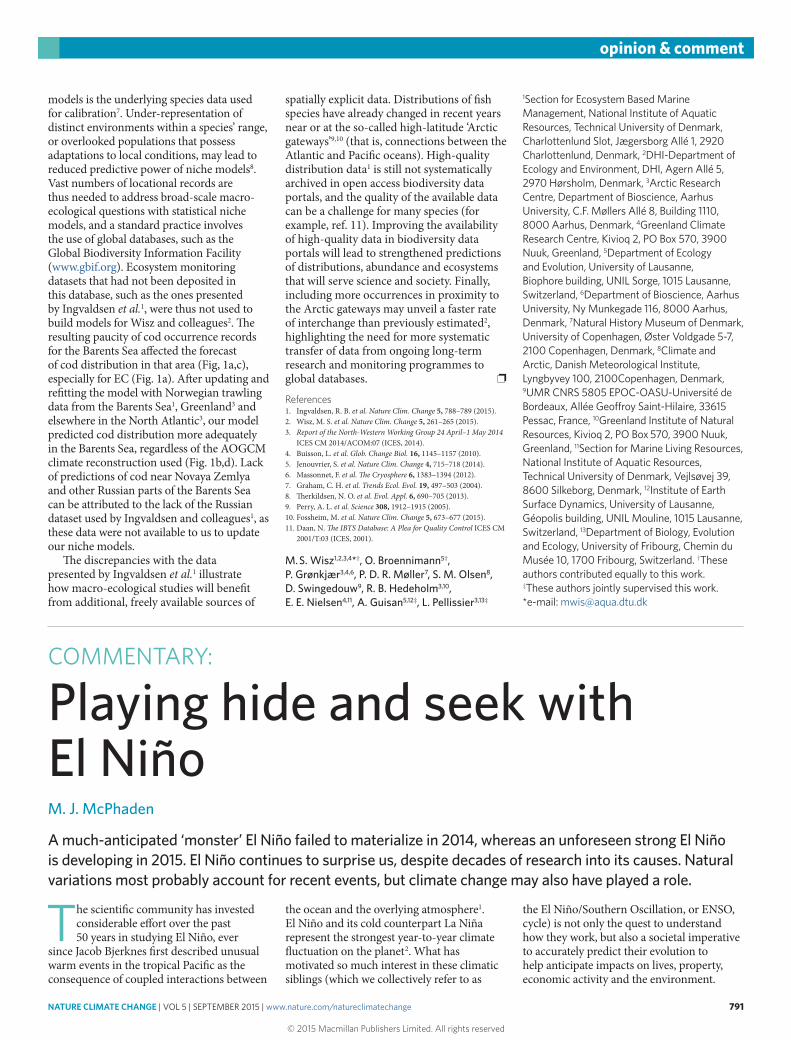
Playing hide and seek with El Niño - Alan Robock...
5
NATURE CLIMATE CHANGE | VOL 5 | SEPTEMBER 2015 | www.nature.com/natureclimatechange 791 opinion & comment models is the underlying species data used for calibration 7 . Under-representation of distinct environments within a species’ range, or overlooked populations that possess adaptations to local conditions, may lead to reduced predictive power of niche models 8 . Vast numbers of locational records are thus needed to address broad-scale macro- ecological questions with statistical niche models, and a standard practice involves the use of global databases, such as the Global Biodiversity Information Facility (www.gbif.org). Ecosystem monitoring datasets that had not been deposited in this database, such as the ones presented by Ingvaldsen et al. 1 , were thus not used to build models for Wisz and colleagues 2 . e resulting paucity of cod occurrence records for the Barents Sea affected the forecast of cod distribution in that area (Fig, 1a,c), especially for EC (Fig. 1a). Aſter updating and refitting the model with Norwegian trawling data from the Barents Sea 1 , Greenland 3 and elsewhere in the North Atlantic 3 , our model predicted cod distribution more adequately in the Barents Sea, regardless of the AOGCM climate reconstruction used (Fig. 1b,d). Lack of predictions of cod near Novaya Zemlya and other Russian parts of the Barents Sea can be attributed to the lack of the Russian dataset used by Ingvaldsen and colleagues 1 , as these data were not available to us to update our niche models. e discrepancies with the data presented by Ingvaldsen et al. 1 illustrate how macro-ecological studies will benefit from additional, freely available sources of spatially explicit data. Distributions of fish species have already changed in recent years near or at the so-called high-latitude ‘Arctic gateways’ 9,10 (that is, connections between the Atlantic and Pacific oceans). High-quality distribution data 1 is still not systematically archived in open access biodiversity data portals, and the quality of the available data can be a challenge for many species (for example, ref. 11). Improving the availability of high-quality data in biodiversity data portals will lead to strengthened predictions of distributions, abundance and ecosystems that will serve science and society. Finally, including more occurrences in proximity to the Arctic gateways may unveil a faster rate of interchange than previously estimated 2 , highlighting the need for more systematic transfer of data from ongoing long-term research and monitoring programmes to global databases. ❐ References 1. Ingvaldsen, R. B. et al. Nature Clim. Change 5, 788–789 (2015). 2. Wisz, M. S. et al. Nature Clim. Change 5, 261–265 (2015). 3. Report of the North-Western Working Group 24 April–1 May 2014 ICES CM 2014/ACOM:07 (ICES, 2014). 4. Buisson, L. et al. Glob. Change Biol. 16, 1145–1157 (2010). 5. Jenouvrier, S. et al. Nature Clim. Change 4, 715–718 (2014). 6. Massonnet, F. et al. e Cryosphere 6, 1383–1394 (2012). 7. Graham, C. H. et al. Trends Ecol. Evol. 19, 497–503 (2004). 8. erkildsen, N. O. et al. Evol. Appl. 6, 690–705 (2013). 9. Perry, A. L. et al. Science 308, 1912–1915 (2005). 10. Fossheim, M. et al. Nature Clim. Change 5, 673–677 (2015). 11. Daan, N. e IBTS Database: A Plea for Quality Control ICES CM 2001/T:03 (ICES, 2001). M. S. Wisz 1,2,3,4 * † , O. Broennimann 5† , P. Grønkjær 3,4,6 , P. D. R. Møller 7 , S. M. Olsen 8 , D. Swingedouw 9 , R. B. Hedeholm 3,10 , E. E. Nielsen 4,11 , A. Guisan 5,12‡ , L. Pellissier 3,13‡ 1 Section for Ecosystem Based Marine Management, National Institute of Aquatic Resources, Technical University of Denmark, Charlottenlund Slot, Jægersborg Allé 1, 2920 Charlottenlund, Denmark, 2 DHI-Department of Ecology and Environment, DHI, Agern Allé 5, 2970 Hørsholm, Denmark, 3 Arctic Research Centre, Department of Bioscience, Aarhus University, C.F. Møllers Allé 8, Building 1110, 8000 Aarhus, Denmark, 4 Greenland Climate Research Centre, Kivioq 2, PO Box 570, 3900 Nuuk, Greenland, 5 Department of Ecology and Evolution, University of Lausanne, Biophore building, UNIL Sorge, 1015 Lausanne, Switzerland, 6 Department of Bioscience, Aarhus University, Ny Munkegade 116, 8000 Aarhus, Denmark, 7 Natural History Museum of Denmark, University of Copenhagen, Øster Voldgade 5-7, 2100 Copenhagen, Denmark, 8 Climate and Arctic, Danish Meteorological Institute, Lyngbyvey 100, 2100Copenhagen, Denmark, 9 UMR CNRS 5805 EPOC-OASU-Université de Bordeaux, Allée Geoffroy Saint-Hilaire, 33615 Pessac, France, 10 Greenland Institute of Natural Resources, Kivioq 2, PO Box 570, 3900 Nuuk, Greenland, 11 Section for Marine Living Resources, National Institute of Aquatic Resources, Technical University of Denmark, Vejlsøvej 39, 8600 Silkeborg, Denmark, 12 Institute of Earth Surface Dynamics, University of Lausanne, Géopolis building, UNIL Mouline, 1015 Lausanne, Switzerland, 13 Department of Biology, Evolution and Ecology, University of Fribourg, Chemin du Musée 10, 1700 Fribourg, Switzerland. † These authors contributed equally to this work. ‡ These authors jointly supervised this work. *e-mail: [email protected] COMMENTARY: Playing hide and seek with El Niño M. J. McPhaden A much-anticipated ‘monster’ El Niño failed to materialize in 2014, whereas an unforeseen strong El Niño is developing in 2015. El Niño continues to surprise us, despite decades of research into its causes. Natural variations most probably account for recent events, but climate change may also have played a role. T he scientific community has invested considerable effort over the past 50 years in studying El Niño, ever since Jacob Bjerknes first described unusual warm events in the tropical Pacific as the consequence of coupled interactions between the ocean and the overlying atmosphere 1 . El Niño and its cold counterpart La Niña represent the strongest year-to-year climate fluctuation on the planet 2 . What has motivated so much interest in these climatic siblings (which we collectively refer to as the El Niño/Southern Oscillation, or ENSO, cycle) is not only the quest to understand how they work, but also a societal imperative to accurately predict their evolution to help anticipate impacts on lives, property, economic activity and the environment. © 2015 Macmillan Publishers Limited. All rights reserved
Transcript of Playing hide and seek with El Niño - Alan Robock...
NATURE CLIMATE CHANGE | VOL 5 | SEPTEMBER 2015 | www.nature.com/natureclimatechange 791
opinion & comment
models is the underlying species data used for calibration7. Under-representation of distinct environments within a species’ range, or overlooked populations that possess adaptations to local conditions, may lead to reduced predictive power of niche models8. Vast numbers of locational records are thus needed to address broad-scale macro-ecological questions with statistical niche models, and a standard practice involves the use of global databases, such as the Global Biodiversity Information Facility (www.gbif.org). Ecosystem monitoring datasets that had not been deposited in this database, such as the ones presented by Ingvaldsen et al.1, were thus not used to build models for Wisz and colleagues2. The resulting paucity of cod occurrence records for the Barents Sea affected the forecast of cod distribution in that area (Fig, 1a,c), especially for EC (Fig. 1a). After updating and refitting the model with Norwegian trawling data from the Barents Sea1, Greenland3 and elsewhere in the North Atlantic3, our model predicted cod distribution more adequately in the Barents Sea, regardless of the AOGCM climate reconstruction used (Fig. 1b,d). Lack of predictions of cod near Novaya Zemlya and other Russian parts of the Barents Sea can be attributed to the lack of the Russian dataset used by Ingvaldsen and colleagues1, as these data were not available to us to update our niche models.
The discrepancies with the data presented by Ingvaldsen et al.1 illustrate how macro-ecological studies will benefit from additional, freely available sources of
spatially explicit data. Distributions of fish species have already changed in recent years near or at the so-called high-latitude ‘Arctic gateways’9,10 (that is, connections between the Atlantic and Pacific oceans). High-quality distribution data1 is still not systematically archived in open access biodiversity data portals, and the quality of the available data can be a challenge for many species (for example, ref. 11). Improving the availability of high-quality data in biodiversity data portals will lead to strengthened predictions of distributions, abundance and ecosystems that will serve science and society. Finally, including more occurrences in proximity to the Arctic gateways may unveil a faster rate of interchange than previously estimated2, highlighting the need for more systematic transfer of data from ongoing long-term research and monitoring programmes to global databases. ❐
References1. Ingvaldsen, R. B. et al. Nature Clim. Change 5, 788–789 (2015).2. Wisz, M. S. et al. Nature Clim. Change 5, 261–265 (2015).3. Report of the North-Western Working Group 24 April–1 May 2014
ICES CM 2014/ACOM:07 (ICES, 2014).4. Buisson, L. et al. Glob. Change Biol. 16, 1145–1157 (2010).5. Jenouvrier, S. et al. Nature Clim. Change 4, 715–718 (2014).6. Massonnet, F. et al. The Cryosphere 6, 1383–1394 (2012).7. Graham, C. H. et al. Trends Ecol. Evol. 19, 497–503 (2004).8. Therkildsen, N. O. et al. Evol. Appl. 6, 690–705 (2013).9. Perry, A. L. et al. Science 308, 1912–1915 (2005).10. Fossheim, M. et al. Nature Clim. Change 5, 673–677 (2015).11. Daan, N. The IBTS Database: A Plea for Quality Control ICES CM
2001/T:03 (ICES, 2001).
M. S. Wisz1,2,3,4*†, O. Broennimann5†, P. Grønkjær3,4,6, P. D. R. Møller7, S. M. Olsen8, D. Swingedouw9, R. B. Hedeholm3,10, E. E. Nielsen4,11, A. Guisan5,12‡, L. Pellissier3,13‡
1Section for Ecosystem Based Marine Management, National Institute of Aquatic Resources, Technical University of Denmark, Charlottenlund Slot, Jægersborg Allé 1, 2920 Charlottenlund, Denmark, 2DHI-Department of Ecology and Environment, DHI, Agern Allé 5, 2970 Hørsholm, Denmark, 3Arctic Research Centre, Department of Bioscience, Aarhus University, C.F. Møllers Allé 8, Building 1110, 8000 Aarhus, Denmark, 4Greenland Climate Research Centre, Kivioq 2, PO Box 570, 3900 Nuuk, Greenland, 5Department of Ecology and Evolution, University of Lausanne, Biophore building, UNIL Sorge, 1015 Lausanne, Switzerland, 6Department of Bioscience, Aarhus University, Ny Munkegade 116, 8000 Aarhus, Denmark, 7Natural History Museum of Denmark, University of Copenhagen, Øster Voldgade 5-7, 2100 Copenhagen, Denmark, 8Climate and Arctic, Danish Meteorological Institute, Lyngbyvey 100, 2100Copenhagen, Denmark, 9UMR CNRS 5805 EPOC-OASU-Université de Bordeaux, Allée Geoffroy Saint-Hilaire, 33615 Pessac, France, 10Greenland Institute of Natural Resources, Kivioq 2, PO Box 570, 3900 Nuuk, Greenland, 11Section for Marine Living Resources, National Institute of Aquatic Resources, Technical University of Denmark, Vejlsøvej 39, 8600 Silkeborg, Denmark, 12Institute of Earth Surface Dynamics, University of Lausanne, Géopolis building, UNIL Mouline, 1015 Lausanne, Switzerland, 13Department of Biology, Evolution and Ecology, University of Fribourg, Chemin du Musée 10, 1700 Fribourg, Switzerland. †These authors contributed equally to this work. ‡These authors jointly supervised this work. *e-mail: [email protected]
COMMENTARY:
Playing hide and seek with El NiñoM. J. McPhaden
A much-anticipated ‘monster’ El Niño failed to materialize in 2014, whereas an unforeseen strong El Niño is developing in 2015. El Niño continues to surprise us, despite decades of research into its causes. Natural variations most probably account for recent events, but climate change may also have played a role.
The scientific community has invested considerable effort over the past 50 years in studying El Niño, ever
since Jacob Bjerknes first described unusual warm events in the tropical Pacific as the consequence of coupled interactions between
the ocean and the overlying atmosphere1. El Niño and its cold counterpart La Niña represent the strongest year-to-year climate fluctuation on the planet2. What has motivated so much interest in these climatic siblings (which we collectively refer to as
the El Niño/Southern Oscillation, or ENSO, cycle) is not only the quest to understand how they work, but also a societal imperative to accurately predict their evolution to help anticipate impacts on lives, property, economic activity and the environment.
© 2015 Macmillan Publishers Limited. All rights reserved

792 NATURE CLIMATE CHANGE | VOL 5 | SEPTEMBER 2015 | www.nature.com/natureclimatechange
opinion & comment
How ENSO may change in the future owing to greenhouse gas forcing is likewise one of the most compelling problems in climate research today3.
Variations in Pacific Ocean circulation associated with ENSO can have profound effects on marine ecosystems and commercially valuable fish stocks. ENSO events also disrupt the circulation of the global atmosphere, increasing the probability of floods, droughts, heat waves and other extreme weather events in far-flung corners of the planet. Sustained and
coordinated international research efforts over the past few decades have largely paid off, with scientific progress being measured in terms of new theories for the ENSO cycle, development of sophisticated computer models for seasonal forecasting and establishment of extensive ocean–atmosphere observing systems for tracking ENSO cycle variations. So it was doubly perplexing when, first, an incipient El Niño of major proportions loomed large on the horizon in early 2014, only to disappear suddenly from the radar screen; then, in
early 2015, remnants of weak 2014 warming unexpectedly flared up again, instead of quietly fading into history.
What happened? During January to April 2014, a series of strong westerly wind bursts, which are abrupt relaxations of the trade winds lasting typically one to three weeks, occurred in the western equatorial Pacific4,5 (see Box 1). The ocean response to the wind bursts in early 2014 (Fig. 1a) looked strikingly similar to that observed during the onset of the 1997–1998 El Niño (Fig. 1b), which is the strongest on record
To understand El Niño, we first need to define what is considered normal in the tropical Pacific. The trade winds, which are a relatively steady flow of air from east to west, drive ocean currents westwards beneath them (see figure). These currents drain warm surface water heated by the sun from the eastern Pacific and pile it up in the western Pacific. In response to this zonal redistribution of upper-ocean water mass, the thermocline (a region of sharp vertical temperature gradient separating the warm, sunlit surface layer from the cold, deep interior ocean) shoals in the east and is pushed down in the west. The shallowness of the thermocline in the eastern Pacific facilitates the upward transport of cold water by the trade winds, a process that is referred to as equatorial upwelling. Upwelling results in a cold tongue of surface water that extends from the west coast of South America to near the International Date Line. The east–west surface temperature contrast reinforces the westward-flowing trade winds, because atmospheric surface pressure is higher over the cooler water in the east, which drives the trade winds westwards.
As the trade winds flow from east to west, they pick up heat and moisture from the ocean. The warm, humid air mass becomes less dense and rises over the western Pacific warm pool, where deep convection leads to towering cumulus clouds and heavy precipitation. Ascending air masses in this region of deep convection return eastwards in the upper levels of the troposphere, then sink over the cooler water of the eastern Pacific.
Every few years, however, the trade winds weaken. This weakening is not a slow and uniform process, but rather one that is punctuated by episodic westerly wind bursts. Wind bursts serve as both a trigger for El Niño onset and an amplifier of ensuing warm SST anomalies4–6,16,17.
They lead to warming along the Equator through two complementary mechanisms. The first is that they force strong eastward-flowing currents that carry warm surface
waters from the western Pacific into the central Pacific. The second is that they excite eastward-propagating, downwelling equatorial Kelvin waves that take about 45 days to cross the basin. Kelvin waves focus their energy within a few degrees of the Equator and, in their wake, leave a depressed thermocline over thousands of kilometres in the east–west direction. The depressed thermocline reduces the normal upwelling of cool water to the surface. The net effect of these processes is the development warm SST anomalies along the Equator between the date line and the coast of South America (see figure).
Once warm temperature anomalies are established along the Equator, they can feed back to the atmosphere to cause further weakening of the trade winds1.
In the tropics, heated moisture-laden air rises over warm SSTs. As the central Pacific warms up during El Niño, the centre of deep atmospheric convection and heavy rainfall normally located in the far western Pacific migrates eastwards with the warm water. Surface air flow into the convective centre from the west leads to further weakening of the trade winds, which leads to further surface warming. The ocean and the atmosphere thus become locked in a mutually reinforcing feedback loop in which anomalous winds and SSTs continue to amplify. Delayed negative feedbacks involving ocean dynamics eventually take over to terminate the El Niño8,21,22, returning the system to normal or sometimes causing it to overshoot into a cold La Niña phase. It is the shifting patterns of deep convection and rainfall associated with the anomalous SSTs that lead to the global climatic impacts of El Niño and La Niña. What distinguished 2014 in this scenario was the failure of the positive feedbacks between surface winds and SST to take hold, even though conditions seemed otherwise favourable.
Box 1 | Mechanisms for El Niño development.
La Niña conditions
Thermocline
Equator
120° E 80° W
Thermocline
Thermocline120° E 80° W
El Niño conditions
Equator
Equator
Convectiveloop
Normal conditions
120° E 80° W
Schematic illustration of normal, El Niño and La Niña conditions. Arrows indicate the direction of wind and ocean currents.
© 2015 Macmillan Publishers Limited. All rights reserved
robock
Highlight
So it was doubly perplexing when, first, an incipient El Niño of major proportions loomed large on the horizon in early 2014, only to disappear suddenly from the radar screen; then, in early 2015, remnants of weak 2014 warming unexpectedly flared up again, instead of quietly fading into history

NATURE CLIMATE CHANGE | VOL 5 | SEPTEMBER 2015 | www.nature.com/natureclimatechange 793
opinion & comment
so far6. The recurrence rate of extreme El Niños such as the 1997–1998 event is once every 15–20 years, leading some experts to interpret this similarity as evidence that we were in store for a big one. Another indicator that conditions were favourable for El Niño in 2014 was the accumulation of excess heat in and above the thermocline along the Equator (Fig. 2). A build up of excess heat content has preceded, by one to three seasons, every moderate to strong El Niño in the past 35 years7, and the heat content anomaly in early 2014 was higher than any time since 1997. According to El Niño theory8, this accumulation of excess heat preconditions the ocean to El Niño onset, which can be triggered by episodic westerly
wind burst forcing. Therefore, computer models used for seasonal forecasting, especially those that incorporated subsurface temperature data in their initial conditions, predicted the development of El Niño sea surface temperature (SST) warming with a high degree of confidence during the second half of 2014. For example, based on model forecasts from June 2014 initial conditions, the National Oceanic and Atmospheric Administration (NOAA) Climate Prediction Center9 issued an advisory in early July that indicated, “the chance of El Niño is about 70% during the Northern Hemisphere summer and is close to 80% during the fall and early winter”. Given the extraordinary observations and the general agreement
among forecasts models, the scientific community and the popular press were abuzz with the possibility that a monster El Niño10 was incubating in the tropical Pacific.
But then the supposedly big El Niño went bust. The trade winds unexpectedly strengthened during the summer and, although westerly wind bursts continued to occur throughout 2014, they were far weaker than in 1997. SST anomalies (that is, deviations from climatological norms) began to decay in the eastern Pacific in mid-2014 in the face of strengthened trades, and seasonal forecasts became increasingly uncertain as the year went on. As a result, headlines changed from bullish to much more subdued and sceptical in heralding
2014
140° E 140° W 100° W180° 140° E 140° W 100° W180°
2
2
01
3
5
1
4
34
1
1
0
March
1
0
0
100
200
300
400
500
Dep
th (m
)
April
30° N
20° N
10° N
0°
10° S
20° S
30° S
30° N
20° N
10° N
0°
10° S
20° S
30° S
0
100
200
300
400
500
30° N
20° N
10° N
0°
10° S
20° S
30° S
30° N
20° N
10° N
0°
10° S
20° S
30° S
December December
5 m s−1
6
4
2
0
−2
−4
−6
Monthly m
ean subsurface tem
perature anomalies (°C
)
6
4
2
0
−2
−4
−6
Monthly averaged
SST anomalies (°C
)1997
0
0
1
10
1
0
0
0
0
2
3
0Jun–Nov Jun–Nov
60
40
20
0
−20
−40
−60
Six-month averaged outgoing
longwave radiation anom
alies (W m
−2)120° E 160° E 160° W 120° W 80° W 120° E 160° E 160° W 120° W 80° W
0
101020
0
1020
20
30
0 0
a
c
e
b
d
f
1000
0
0
0
0
10
Figure 1 | Evolution of conditions in 2014 in comparison to 1997. a,b, Monthly mean subsurface temperature anomalies for March 2014 (a) and April 1997 (b) along the Equator averaged 2° N to 2° S based on moored buoy time series data28. x symbols indicate the depths where measurements are available. The March 2014 analysis also includes Argo profiling float data (http://www.usgodae.org/argo/argo.html) to fill in large gaps where moored time series were not available. Different months are shown for the two years, as the westerly wind bursts that generated these subsurface anomalies occurred earlier in 2014 than in 1997. c,d, Monthly averaged SST and surface wind anomalies for December 2014 (c) and December 1997 (d). Black arrows show wind speed and direction. SST anomalies are from a weekly product based on blended satellite and in situ measurements29. Winds are based on the European Center for Medium-Range Weather Forecasts interim reanalysis (http://apps.ecmwf.int/datasets). The NINO-3.4 region is outlined in c. e,f, Monthly averaged outgoing longwave radiation anomaly at the top of the atmosphere for the six-month period June to November in 2014 (e) and 1997 (f). Outgoing longwave radiation is a measure of deep convection and heavy rainfall, with negative values indicating wetter and cloudier conditions, and positive values indicating sunnier and drier conditions.
© 2015 Macmillan Publishers Limited. All rights reserved
robock
Highlight
Given the extraordinary observations and the general agreement among forecasts models, the scientific community and the popular press were abuzz with the possibility that a monster El Niño10 was incubating in the tropical Pacific. But then the supposedly big El Niño went bust.

794 NATURE CLIMATE CHANGE | VOL 5 | SEPTEMBER 2015 | www.nature.com/natureclimatechange
opinion & comment
El Niño’s arrival11. By the end of 2014, even though warm conditions prevailed throughout much of the tropical Pacific (Fig. 1c), there was no consensus that an El Niño was underway, given the weakness of the warming and the inconsistency of various key oceanic and atmospheric indictors12. Even conceding that the event qualified as an El Niño, the magnitude of the SST anomalies in the season of typical peak development, namely November to January, would rank it among the weakest in the past 60 years (Fig. 3a). Based on year-end observations and model forecasts, NOAA’s January 2015 El Niño advisory stated that weak warm conditions would continue for a couple more months, then die out in early Northern Hemisphere spring13.
However, the much-ballyhooed El Niño, though moribund, was not completely dead. Surprisingly, it came roaring back with renewed vigour during the first half of 2015, energized by a new spate of strong westerly wind bursts. These episodic wind events, some of which were associated with highly unusual cyclone activity in the western Pacific in early 201514,15, are a form of stochastic forcing for El Niño. There is a significant degree of randomness in their timing, amplitude and duration, but they nonetheless preferentially occur over the warmest surface waters of the tropical Pacific16,17. Hence, lingering warm SST anomalies near to and west of the date line in early 2015 may have helped to spark the re-emergence of these wind bursts, leading El Niño to rise,
phoenix-like, from the ashes. As a measure of how rapidly El Niño conditions re-intensified in 2015, the +1 °C SST anomaly in June 2015 in the NINO-3.4 index region was the highest for any June since the 1950s, exceeded only by 1997 (Fig. 3b). It is known that ENSO predictions for conditions extending into and through the boreal spring are of relatively low reliability18. Even so, the turnabout was remarkable, considering that in early 2015 the event was expected to be over within a couple of months13. In contrast, NOAA’s July 2015 advisory note left little room for doubt: “There is a greater than 90% chance that El Niño will continue through Northern Hemisphere winter 2015–2016…with many multi-model averages predicting a strong event…”19.
Thus, after a faltering start in 2014 and a sudden rebound in 2015, the climate system seems to be heading for an extended two-year period of warming in the tropical Pacific, much like the unusual 1986–1987 El Niño (Fig. 3a). Many El Niño experts were fooled by these developments, both when the widely anticipated monster El Niño went into steep decline and again when it re-ignited with such startling intensity. This puzzling evolution has generated considerable soul-searching about why El Niño forecasts, as well as expectations based on conventional wisdom, fell so wide of the mark.
A key challenge facing the scientific community is to understand why the big event failed to materialize in 2014 when conditions otherwise seemed so favourable.
WWV and NINO-3.4 SST anomalya
SST
(°C
), W
WV
(1014
m3 ) SST (°C
), WW
V (10
14 m3)
4
3
2
1
0
−1
−2
−3
−41980 1984 1988 1992 1996 2000 2004 2008 2012
Year
b2
1
0
−1
−2F A J A O D F A J A O D F A J
2013 2014 2015
Figure 2 | Relationship between upper-ocean heat content and ENSO SST anomalies. a, Five-month running means of warm water volume (WWV; red curve), which is a measure of upper-ocean heat content in the equatorial Pacific. WWV is calculated as the anomalous volume of water integrated between 5° N and 5° S, 80° E and 120° E from the sea surface to the depth of the 20 °C isotherm, which is in the middle of thermocline7. The blue curve shows five-month running means of NINO-3.4 SST, which is the areal average of SST anomalies in the central Pacific between 5° N and 5° S, 120° W and 170° W (see Fig. 1c for an outline of the region). The NINO-3.4 SST index is highly correlated with changes in atmospheric circulation that impact global patterns of weather variability, which is why this index is so closely monitored. WWV leads NINO-3.4 typically by 3–9 months and is therefore a valuable predictor of El Niño and La Niña. b, Individual monthly means of NINO-3.4 SST and WWV since January 2013. The horizontal blue dotted line is 0.5 °C, a threshold that, when passed for five consecutive three-month seasons, indicates that an El Niño has occurred. The horizontal red dotted line is 1014 m3, a threshold that, when exceeded for five consecutive months, is often followed by development of an El Niño. F, A, J, A, O and D represent February, April, June, August, October and December, respectively.
The absence of a sustained feedback between zonal winds and SST in 2014 was symptomatic of the atmosphere’s unexpected insensitivity to warming SSTs in the central equatorial Pacific. As Bjerknes1 originally pointed out, the wind–SST feedback associated with El Niño is mediated by shifts in deep atmospheric convection and rainfall patterns. However, for the six-month period from June to November 2014, a time when these feedbacks should have promoted growing anomalies in the ocean and atmosphere20, persistent deep convection did not take hold in the central Pacific. The atmosphere remained relatively dry, despite anomalously warm SSTs, in sharp contrast to the heavy rains that occurred near to and east of the date line in 1997 (Fig. 1e,f). This lack of strong coupling between the atmosphere and the ocean is the proximate reason for why a monster El Niño did not materialize in 2014.
A complete explanation for what happened must go further though, as we need to address the question of why the Pacific Ocean and overlying atmosphere failed to fully engage with one another. We don’t have to look far for possible suspects that could have conspired to derail the developing El Niño in 2014. There are several possibilities (a few of which will be mentioned here) that may have contributed in varying degrees. The first is the null hypothesis of random chance: while the first few wind bursts energized the initial growth of SST anomalies, the subsequent wind bursts needed to amplify those anomalies failed to develop
© 2015 Macmillan Publishers Limited. All rights reserved
robock
Highlight
Many El Niño experts were fooled by these developments, both when the widely anticipated monster El Niño went into steep decline and again when it re-ignited with such startling intensity.
robock
Highlight
we need to address the question of why the Pacific Ocean and overlying atmosphere failed to fully engage with one another.
robock
Highlight
There are several possibilities
robock
Highlight
The first is the null hypothesis of random chance

NATURE CLIMATE CHANGE | VOL 5 | SEPTEMBER 2015 | www.nature.com/natureclimatechange 795
opinion & comment
for whatever reason. Another possibility is that the event got underway a month earlier in the calendar year than in 1997, which was perhaps too early, as seasonally varying background conditions favour fastest SST anomaly growth in the second half of the year18,20. In the meantime, negative feedbacks that normally damp El Niño SSTs21,22 may have had an opportunity to erode the incipient warm anomalies before they grew too large. Also, for much of 2014, the Indian Ocean Dipole was in a negative phase, mainly due to unusually warm SSTs entrenched off the coasts of Java and Sumatra in the eastern equatorial Indian Ocean12. These warm SSTs may have helped to anchor deep convection over the Indo-Pacific warm pool (defined as SSTs ≥ 28.5 °C) that brackets the maritime continent of Indonesia, thereby preventing a shift of convection to the central Pacific Ocean in response to weak warm El Niño SST anomalies.
Lower-frequency variability may have played a role as well, as the background state of the tropical Indo-Pacific has been changing on decadal timescales. For instance, the Pacific Decadal Oscillation, or equivalently the Interdecadal Pacific Oscillation, had been in a cold phase since 1999, during which trade winds were of unprecedented strength and baseline SSTs were lower in the eastern and central equatorial Pacific23. These cold background conditions, linked to the recent hiatus in global warming24, could likewise have inhibited the migration of deep convection from the western to central Pacific in 2014. In addition, over the past 50 years the Indo-Pacific warm pool has been warming and expanding in response to greenhouse
gas forcing25,26. These warming trends may have contributed to the competition between Indo-Pacific warm pool SSTs and central Pacific SSTs in affecting the location of deep convection along the Equator in 2014. Interestingly, a budding El Niño died prematurely just two years earlier in 2012, perhaps under the influence of these same changing background conditions.
We have come to appreciate that there is a lot of natural variability in the ENSO cycle and that individual events can exhibit a wide diversity of behaviors27. Evolution of conditions in the tropical Pacific in 2014–2015 emphasizes just how complex ENSO dynamics can be. Climate change may plausibly have played a role via warming trends in the Indo-Pacific warm pool, but it will be a challenge to convincingly tease out its possible influence from a broad spectrum of natural variations. Seeking answers for why an erstwhile major El Niño unexpectedly went into hiding in 2014 only to re-appear in early 2015 with renewed intensity is a priority that will provide fertile ground for new research. The stakes are high because seasonal climate variations driven by ocean–atmosphere interactions in the tropical Pacific affect so many people around the globe. ❐
M. J. McPhaden is in the NOAA Pacific Marine Environmental Laboratory (PMEL), Seattle, Washington 98115, USA. e-mail: [email protected]
References1. Bjerknes, J. Tellus 18, 820–829 (1966).2. McPhaden, M. J., Zebiak, S. E. & Glantz, M. H. Science
314, 1740–1745 (2006).3. Cai, W. et al. Nature Clim. Change 5, 849–859 (2015).4. Menkes, C. E. et al. Geophys. Res. Lett. 41, 6476–6483 (2014).
5. Chen, D. et al. Nature Geosci. 8, 339–345 (2015).6. McPhaden, M. J. Science 283, 950–954 (1999).7. McPhaden, M. J. Geophys. Res. Lett. 39, L09706 (2012).8. Jin, F. F. J. Atmos. Sci. 54, 811–829 (1997).9. ENSO Diagnostic Discussion (Climate Predication Center,
10 July 2014); http://www.cpc.ncep.noaa.gov/products/analysis_monitoring/enso_disc_jul2014/
10. Roach, J. Monster El Niño may be brewing, experts say. NBC News (19 April 2014); http://www.nbcnews.com/storyline/california-drought/monster-el-nino-may-be-brewing-experts-say-n83526
11. Plumer, B. Scientists were expecting a big El Niño this year. So where did it go? Vox (8 November 2014); http://www.vox.com/2014/11/8/7177709/el-nino-2014-forecast-weakening
12. Blunden, J. & Arndt, D. S. (eds) Bull. Am. Meteorol. Soc. 96, (State of the Climate in 2014 special supplement) S1–S267 (2015).
13. ENSO Diagnostic Discussion (Climate Predication Center, 8 January 2015); http://www.cpc.ncep.noaa.gov/products/analysis_monitoring/enso_disc_jan2015/
14. Hannam, P. Cyclone Raquel to give El Niño a major kick along. Sydney Morning Herald (3 July 2015); http://go.nature.com/XFyrJp
15. Freedman, A. Trio of Pacific typhoons intensify, creep closer to China and Japan. Mashable (8 July 2015); http://go.nature.com/jKwvoT
16. Lengaigne, M. et al. Clim. Dynam. 23, 601–620 (2004).17. Eisenman, I., Yu, L. & Tziperman, E. J. Climate
18, 5224–5238 (2005).18. Levine, A. F. Z. & McPhaden, M. J. Geophys. Res. Lett.
42, 5034–5041 (2015).19. ENSO Diagnostic Discussion (Climate Predication Center,
9 July 2015); http://www.cpc.ncep.noaa.gov/products/analysis_monitoring/enso_disc_jul2015/
20. Stein, K. et al. J. Climate 23, 5629–5643 (2010).21. Schopf, P. S. & Suarez, M. J. J. Atmos. Sci. 45, 549–566 (1988).22. Battisti, D. S. & Hirst, A. C. J. Atmos. Sci. 46, 1687–1712 (1989).23. England, M. H. et al. Nature Clim. Change 4, 222–227 (2014).24. Kosaka, Y. & Xie, S.-P. Nature 501, 403–407 (2013).25. Cravatte, S. E. et al. Clim. Dynam. 33, 565–589 (2009).26. Han, W. et al. Bull. Am. Meteorol. Soc. 95, 1679–1703 (2014).27. Capotondi, A. et al. Bull. Am. Meteorol. Soc.
96, 921–938 (2015).28. McPhaden, M. J. et al. J. Geophys. Res. 103, 14169–14240 (1998).29. Reynolds, R. W. et al. J. Climate 15, 1609–1625 (2002).
AcknowledgementsThis is PMEL publication no. 4335.
Published online: 17 August 2015
2014–2015 versus past El Niños
Julyr−1
Janyr 0
Jul Janyr+1
Jul Janyr+2
Top ten June NINO-3.4 anomalies3
2
1
0
−1
−2
−3
1.5
1.0
0.5
0.01972 1983 1957 1982 1992 1991 2002 1987 2015 1997
a b
1957–19581963–19641965–19661968–19691972–19731976–19771982–19831986–19871991–19921994–19951997–19982002–20032004–20052006–20072009–20102014–2015Average
NIN
O-3
.4 S
ST a
nom
aly
(°C
)
NIN
O-3
.4 S
ST a
nom
aly
(°C
)
Figure 3 | Monthly NINO-3.4 SST anomalies for El Niños since the 1950s. a, NINO-3.4 time series for 16 El Niños between 1957–1958 and 2014–2015 presented as 2.5-year segments beginning in July of the year before the peak (Jul yr−1) to January of the year following the end of the event (Jan yr+2). El Niños develop in year 0 and typically peak in November of year 0 to January of year 1. The El Niño event that started in 2014 (thick red line) was well below average (thick black line) during the peak November to January season. Re-emergence of warming in early 2015 is analogous to what happened during the unusually prolonged 1986–1987 El NIño (thick green line). b, Top ten NINO-3.4 values for the month of June. The colour of the bar indicates whether El Niño (red), La Niña (blue) or neutral (grey) conditions prevailed in the following November to January season. June 2015 was the second highest NINO-3.4 SST anomaly since 1950, surpassed only by June 1997, and is shaded pink given the high degree of certainty from seasonal forecasts that El Niño conditions will continue into early 201619.
© 2015 Macmillan Publishers Limited. All rights reserved
robock
Highlight
the Indian Ocean Dipole was in a negative phase, mainly due to unusually warm SSTs entrenched off the coasts of Java and Sumatra in the eastern equatorial Indian Ocean
robock
Highlight
the event got underway a month earlier in the calendar year than in 1997
robock
Highlight
Lower-frequency variability may have played a role as well
robock
Highlight
Seeking answers for why an erstwhile major El Niño unexpectedly went into hiding in 2014 only to re-appear in early 2015 with renewed intensity is a priority that will provide fertile ground for new research


![the direct role of selenocysteine in [niFese] …matias/HASE2016/P3.pdfNature Nature, © ...](https://static.fdocuments.in/doc/165x107/5e32c517c2b55328b34d748a/the-direct-role-of-selenocysteine-in-nifese-matiashase2016p3pdf-nature-nature.jpg)