Play friendly. OF SEXUAL ORIENTATION Play proud. AND ... · sically crossing the line (i.e. being...
40
Tobias Menzel, Birgit Braumüller, Ilse Hartmann-Tews THE RELEVANCE OF SEXUAL ORIENTATION AND GENDER IDENTITY IN SPORT IN EUROPE FINDINGS FROM THE OUTSPORT SURVEY ASSOCIAZIONE ITALIANA CULTURA SPORT
Transcript of Play friendly. OF SEXUAL ORIENTATION Play proud. AND ... · sically crossing the line (i.e. being...

Tobias Menzel, Birgit Braumüller, Ilse Hartmann-Tews
THE RELEVANCE OF SEXUAL ORIENTATION AND GENDER IDENTITY IN SPORT IN EUROPEFINDINGS FROM THE OUTSPORT SURVEY
Play friendly.Play proud.
progetto promosso da:
ASSOCIAZIONE ITALIANA CULTURA SPORT
• SCOPRIRE L’INFO DAY PIÙ VICINO A TE
• CONDIVIDERE LA TUA STORIA
• PARTECIPARE ALLA RICERCA
• SEGUIRE TUTTI I CONSIGLI DI ALLIE, L’ALLEATA RAINBOW DI OGNI ATLETA
su out-sport.eu potrai:
out-sport.eu
Allie ha un po’ di ottimi consigli arcobaleno per farti allenare e giocare con orgoglio e in tutta
tranquillità.
METTI FUORI GIOCO L’OMOFOBIAe PORTA IN CAMPO L’ORGOGLIO!

EDITORSTobias Menzel, Dr. Birgit Braumüller, Prof. Dr. Ilse Hartmann-Tews
CONTACTGerman Sport University CologneInstitute of Sociology and Gender StudiesAm Sportpark Müngersdorf 650933 Kölnemail: [email protected]
CITATIONMenzel, T., Braumüller, B. & Hartmann-Tews, I. (2019). The relevan-ce of sexual orientation and gender identity in sport in Europe. Findings from the Outsport survey. Cologne: German Sport Uni-versity Cologne, Institute of Sociology and Gender Studies.
LANGUAGE REVIEWAndrew Marshall (LEAP Sport Scotland)
LAYOUT & DESIGN Christine Geelhaar (Brochure)
DATEMay 2019
WEBwww.out-sport.euwww.dshs-koeln.de
The European Commission support for the production of thispublication does not constitute an endorsement of the contents which reflects the views only of the authors, and the Commission cannot be held responsi ble for any use which may be made of the information contained therein.
IMPRESSUM

Tobias Menzel, Birgit Braumüller, Ilse Hartmann-Tews
THE RELEVANCE OF SEXUAL ORIENTATION AND GENDER IDENTITY IN SPORT IN EUROPEFINDINGS FROM THE OUTSPORT SURVEY


CONTENTS
FOREWORD 6
SUMMARY 7
1. METHODOLOGY 10
2. DEMOGRAPHICS OF THE SAMPLE 15
3. GENERAL ASSESSMENT OF HOMOPHOBIA 19
4. HOMOPHOBIC / TRANSPHOBIC LANGUAGE 21
5. SPORTS PARTICIPATION AND EXCLUSION 23
6. NEGATIVE PERSONAL EXPERIENCES AND REASONS FOR NOT PARTICIPATING IN SPORTS 27
6.1 CURRENTLY ACTIVE IN SPORTS 27
6.2 PREVIOUSLY ACTIVE IN SPORTS 31
6.3 INACTIVE SINCE PHYSICAL EDUCATION 33
7. REACTIONS TO NEGATIVE EXPERIENCES 35
GLOSSARY 39

The Relevance of Sexual Orientation and Gender Identity in Sport in Europe. Findings from the Outsport Survey.6
Foreword
The OUTSPORT project is co-financed by the Euro-pean Commission through the Erasmus Plus program. It involves five European partner organisations: Ita-lian Association for Culture and Sport (AICS), LEAP Sports Scotland (LEAP), German Sport University Co-logne (DSHS), Vienna Institute for International Dia-logue and Cooperation (VIDC), Organisation for Fresh Ideas, Hungary (FRIGO).
The project seeks to address homophobia, biphobia, transphobia, and interphobia1 in sport through com-munication, awareness raising, training, scientific re-search, and by using sport itself as a tool. The main goals of the project are:
Raising awareness about discrimination in sport based on sexual orientation and/or gender identi-ty through information and awareness-raising cam-paigns.
Improving good governance in sport(organisations) specifically in relation to discrimi-nation based on sexual orientation and/or gender identity.
Fostering capacity-building and education against intolerance and discrimination for coaches and staff of organisations by developing a training toolkit for sports operators, which will empower them to pro-mote an innovative approach to tackling hate crime and discrimination based on sexual orientation and/or gender identity in sport.
Promoting sport itself as a tool for the prevention of discrimination, bullying and hate crime based on sexual orientation and/or gender identity.
Developing and proposing new guidelines concer-ning LGBTI*2 rights for inclusion in the next EU Work Plan for Sport.
1 In the following the term “homophobia” is used as a catch-all term for homophobia, biphobia and other forms of prejudice, aversion and discrimination on grounds of sexual orientation and “transphobia” as a catch-all term for all forms of prejudice, aversion and discrimination on grounds of gender identity.
2 The acronym LGBTI* denotes lesbian/gay women, gay men, bisexual people, trans people and intersex people. The asterisk denotes queer people that do not identify as lesbian, gay, bisexual, transgender or intersex, but have a non-hetero sexual orientation and/or a non-cis gender identity. As we noticed in the course of this study, the acronym LGBTI (without any further placeholder like an asterisk) is too small to cover the great diversity of people with other sexual orientati-ons or gender identities that diverge from what has emerged as a social norm.
The research component of the OUTSPORT project, led by the German Sport University Cologne, is of fundamental importance to achieving the main pro-ject goals. OUTSPORT is the first initiative at the European level to gather scientific evidence on the phenomena of homophobia/transphobia in the field of sport.
The first objective of our research is to collect relia-ble data on experiences of discrimination related to LGBTI* sexual orientation and gender identity in dif-ferent fields of sport in Europe (the quantitative part of the research). The second aim is to explore the role of relevant stakeholders in the field of sport in tackling discrimination and homophobia/transphobia in sport (the qualitative part of the research). This report presents selected results from the quantitative research, the OUTSPORT Survey 2018.
The present report is a commented overview of selec-ted results, and the purpose of this report is to pre-sent the core findings of the survey in a transparent and understandable way. Differences with regard to the five project countries are displayed in the tables/figures but are not further elaborated because of the complexity and individuality of each country’s poli-tics and sports culture, and because of the limited space of the report. A comparative analysis will be published at a later date. Differences with regard to gender identity and sexual orientation are mentio-ned in the corresponding sections in the text and, for the most part, are not presented in additional tables/figures.
FOREWORD

The Relevance of Sexual Orientation and Gender Identity in Sport in Europe. Findings from the Outsport Survey. 7
Summary
The experiences of LGBTI* people in sport are very diverse, possibly as diverse as the field of sport itself with its manifold forms, settings and contexts. This is demonstrated by the experiences of the (approx.) 5,500 LGBTI* people who participated in the OUT-SPORT Survey 2018.
Homo-/transphobia and prevention activities
The following findings illustrate that the vast majo-rity of respondents perceive homo-/transphobia to be a problem in sport and transphobia is perceived to be an especially prominent problem in sport. This assessment can be associated with several factors: current and prior personal negative experiences, wit-nessing the use of homo-/transphobic language, and prevailing opinions about sport as a fundamentally homo-/transphobic environment. The three actions that are most often supposed by respondents to be helpful to tackle homo-/transphobic discrimination in the field of sport are (a) famous sports stars co-ming out, (b) high profile anti-homophobia/trans-phobia campaigns and (c) diversity trainings.
Homo-/transphobic language
The majority of respondents witness homo-/trans-phobic language in sport, in other leisure activities and at work or in the educational system (school, university, etc.). However, the frequency of the noti-ced homo-/transphobic language is highest in other leisure activities than sport, but it is most harmful at work or in the educational system.
SUMMARY
Almost
90%consider homophobia
and particularly transphobia in sport a current problem.
5,524 LGBTI* respondents completed the survey.
7 out of 10 respondents suppose the coming
out of famous sports stars and high profile and antihomophobia/
transphobia campaigns to be helpful to tackle homo-/transphobic
discrimination.
82%have witnessed homo-/
transphobic language in sport in the last 12 months.

The Relevance of Sexual Orientation and Gender Identity in Sport in Europe. Findings from the Outsport Survey.8
Summary
Sport participation and exclusion
The most popular sports among our active respon-dents are cardio-based fitness, running, swimming and football. About one third remains completely closeted in his or her sports context, whereas a bit more than a third is open to almost everyone. Almost every fifth respondent refrains from participating in a sport that they feel attracted to as a result of their sexual orientation and/or gender identity. This is most frequently the case for trans people and refers predominantly to football/soccer, dancing, swim-ming, and boxing.
Negative personal experiences in the last 12 months
16% of respondents who are currently active in any sports have had at least one negative personal expe-rience in the last 12 months that was related to their sexual orientation or gender identity. Trans people experience negative incidents disproportionally more often, which adds to the pre-existing challenges that trans people need to face when participating in sports. Verbal insults and structural discrimination are the most common forms of homo-/transphobic incidents, indicated by more than 75% of those with negative experiences. Moreover, experiences of phy-sically crossing the line (i.e. being shoved and/or pushed) or even physical violence are not uncom-mon.
Perpetrators vary with regard to the type of incident and the sexual orientation or gender identity of the respondent. Most common perpetrators are other sport participants and team members. Lesbian/gay women and bisexual people mention their own team members most frequently as perpetrators, whereas gay men and people with other sexual orientations refer to other sport participants as the most common perpetrators. Trans people are more frequently haras-sed by coaches than cisgender people.
33% remain completely closeted
in their sports context.
Most common perpetrators:
53% other sport participants
49% team members
20% refrain from participating in a sport of interest due to their
sexual orientation and/or gender identity.
16% report at least one negative
personal experience in a sports context related to their sexual
orientation and/or gender identity. Of those with negative experiences:
82% Verbal insults, slurs
75% structural discrimination
36% physically crossing the line
20% physical violence

The Relevance of Sexual Orientation and Gender Identity in Sport in Europe. Findings from the Outsport Survey. 9
Summary
Reasons for not participating in sports
Respondents who are currently not active can be di-vided into two groups: those who have been pre-viously active and then quit their sport for some reason, and those who have never been active in any sports besides physical education at school. For both groups, the main reasons for not participating in sports (anymore) are mostly unrelated to sexual orientation and/or gender identity, except for trans people. Those report more often that feelings of un-comfortableness due to their gender identity and ne-gative experiences in physical education are primary reasons for their quitting sports, or their having ne-ver participated in sports at all.
Reactions to negative experiences
In cases where respondents have endured a homo-/transphobic incident, those respondents predomi-nantly either did not react at all or left the situation. Only a quarter confronted the perpetrator(s) and very few reported the case. Reasons for not reporting are manifold and almost half of the respondents argue that an effective intervention would be doubtful to occur.
The results further reveal that more than a third of respondents do not know of any organisation or indi-vidual to contact in case of negative experiences. If they are aware of organisations, these were primarily outside of organised sport.
5% of (previously active) respondents quitted their sports participation because they have had negative per-sonal experiences due to their sexual
orientation and/or gender identity.
38% do not know an organisation or in-dividual to contact in instances of being discriminated against in a
sports context.
53% do not react to incidents of homo-/
transphobic discrimination.
8%officially report those incidents.

The Relevance of Sexual Orientation and Gender Identity in Sport in Europe. Findings from the Outsport Survey.10
Methodology
1. METHODOLOGY
The OUTSPORT Survey 2018 is one of two distinct empirical studies within the scope of the OUTSPORT Project. The survey focuses on the experiences of LGBTI* people on an individual level, with the inten-tion to collect reliable data on personal experiences in sports related to sexual orientation and/or gender identity.
Target group
The target population of the survey was defined as:
- people who identify as lesbian, gay, bisexual, transgender and/or are intersex, - who currently live in one of the 28 member states of the European Union and - who are at least 16 years old.
Being active in sports was not mandatory to take part in the survey. People who were inactive in sports were also targeted to find out more about their rea-sons for not participating in or for quitting sports.
Questionnaire
The questionnaire was developed on a scientific ba-sis, considering prior research as well as practical knowledge from our project partners who have dealt with LGBTI* issues for many years. Furthermore, the survey was pre-tested by a diverse group of people from our target group and subsequently adjusted.
The online survey was accessible in five languages, i.e. the four languages of the participating project countries (German, English, Italian, Hungarian) and in French3.
Thematically, the questionnaire covers questions from the following areas:
- Sociodemographics and sexuality - General assessment of homophobia/transphobia - Homophobic/transphobic language - Sports participation and exclusion - (Negative) experiences in different sports contexts - Reactions to negative experiences
The questions which were without reference to any form of sports participation were usually available for every survey participant to answer. Based on current sports participation, the questionnaire distinguishes between three types of respondents: (A) Those who are currently active in sports, (B) those who have previously been active but stopped doing sports for some reason, and (C) those who only participated in physical education at school. In order to draw reaso-nable conclusions regarding the current situation in the field of sport, the survey included differentiated questions on personal experiences which have occur-red during the past 12 months (from the point of completing the survey) for those who are currently active in sports.
3 The translation was conducted by a professional translation agency (ETC- Official EU translations), using the original English version of the questionnaire as a basis. The experts from our project countries precisely double-checked the exact wording of the translated versions, especially with regard to LGBTI* specific terms and expressions.

The Relevance of Sexual Orientation and Gender Identity in Sport in Europe. Findings from the Outsport Survey. 11
Methodology
Recruiting and representativeness
The aim was to draw a comprehensive sample from our target population in each of the 28 member states of the European Union, to allow for compari-sons between the countries. A systematic sampling approach, based on the following steps, was used to realise an appropriate sample. As a first step, LGBTI* organisations in each of the 28 EU countries were randomly contacted and asked for contact details from other national LGBTI* organisations, LGBTI* sport organisations and national umbrella sport or-ganisations.
As a second step, each of the national organisations were supplied with a standardised package of our ad-vertisement material (pictures, videos and texts) to promote the survey via social media, web pages or mailing lists in their country in a uniform way.
In addition, international LGBTI* organisations like the European Gay & Lesbian Sport Federation (EGLSF) and the International Lesbian, Gay, Bisexual, Trans-and Intersex Organisation (ILGA) promoted the sur-vey. Apart from the support of organisations, social
targeting (commercial Facebook advertising) was used to increase our reach and to balance out lower participation rates in specific countries. The adverti-sements were developed by the Italian project part-ner (AICS).
The online survey was open to anyone who saw the link. The present sample can be considered ‘self-se-lected’ and as such, the research does not claim to be representative, as there is no knowledge about the basic population and socio-structural parameters about it. One key concern was to promote the survey in a neutral way, in order to attract LGBTI* indivi-duals both with and without negative experiences related to their sexual orientation or gender identi-ty. Accordingly, the words and expressions “negative experiences”, ”discrimination” or “harassment” were not used in any of our promotional activities.
Additionally:paid Facebook advertisement (personalised, LGBTI* background)
Further networks (i.e. head organisations like EGLSF)Snowball sampling
Figure 01: Acquisition of Partners
62.7
62.7
62.7
62.7
“Acquisition of Partners“on a national level in all 28 EU member states
3 national multipliers per country & category
LGBTI*Organisations
1) ...2) ...3) ...
1) ...2) ...3) ...
1) ...2) ...3) ...
LGBTI* SportsOrganisations
Umbrella Sports Organisations
Distribution / Promotion of the questionnaire via social media, web pages, mailing lists
Figure 1: Acquisition of partners

The Relevance of Sexual Orientation and Gender Identity in Sport in Europe. Findings from the Outsport Survey.12
Methodology
Sample
The final sample contains 5,524 valid cases. Between March and August 2018, 6,344 people completed the survey. 820 cases were removed from the sample in several stages of data cleansing, most frequently be-cause those cases did not belong to the defined tar-get group (if they did not live in the EU, if they were too young and/or if they did not identify as LGBTI*) or because they had answered less than 80% of the questions.
The breakdown by country of residence is shown in table 3, highlighting the five project countries. By comparing the share of each country’s respondents in the sample with the share of each country’s in-habitants in the EU population, some countries are overrepresented in our sample: Hungary (5.5% vs. 1.9%), Scotland (3.2% vs. 1.1%) and Austria (2.9% vs. 1.7%). Conversely, Germany (15.5% vs. 16.2%) and Italy (11.3% vs. 11.9%) are slightly underrepre-sented.
POLAND
CZECHREPUBLIC
ENGLANDWALES
SCOTLAND
AUSTRIAFRANCE
BELGIUM
BULGARIA
GREECESPAINPORTUGAL
GERMANY
SWEDEN
2.9%
15.5%
3.2%
11.3%
5.5%
2.4%
3.1%
4.7%0.6%2.2%
0.6%
4.9%
4.2%1.9%
2.9%
3.0%
0.8%
3.3%
2.2%2.3%
1.9%
2.1%
1.6%
2.1%
1.2%2.1%
3.3%
2.0%
1.8%
2.7%
1.9%
FINLAND
ITALY
HUNGARY
SLOVAKIA
ROMANIA
LITHUANIA
LATVIA
ESTONIA
IRELAND
NORTHERN IRELAND
CROATIASLOVENIA
DENMARK
MALTA
LUXEMBURG
NETHERLANDS
CYPRUS
Tab 1: Country of residence
AustriaBelgium
Bulgaria
Croatia
Cyprus
Czech Republik
Denmark
England
Estonia
Finland
France
GermanyGreece
HungaryIreland
ItalyLatvia
Lithuania
Luxembourg
Malta
Netherlands
Northern Ireland
Poland
Portugal
Romania
ScotlandSlovakia
Slovenia
Spain
Sweden
Wales
TOTAL
2.9
3.1
2.1
1.9
1.2
2.2
3.0
4.7
1.8
2.7
4.9
15.5
2.1
5.5
2.2
11.3
2.0
3.3
0.8
2.1
2.9
0.6
3.3
1.9
1.6
3.2
2.3
1.9
4.2
2.4
0.6
100.0
% n
159
170
118
105
64
120
164
258
101
147
268
858
117
304
122
625
111
184
42
115
159
34
183
103
88
176
126
103
233
132
34
5524
Figure 2: Country of residence
Question: “Mainly what country have you lived in for the last 12 moths?“, Single choice, figures in %. Database: all. Project countries highlighted

The Relevance of Sexual Orientation and Gender Identity in Sport in Europe. Findings from the Outsport Survey. 13
Methodology
How to read the tables and figures of the report
The majority of the tables in this report follow the same structure as displayed in table 2. The columns represent the five project countries, a summarisation of all other EU countries and the total of all EU count-ries. There are three basic types of tables, depending on the related Type of question (single choice, mul-tiple choice or scale). The type of question is always mentioned in the table signature beneath the ques-tion text (see below):
-- The column total is always 100% and thus the to-tal is not additionally displayed.-- Tables with single choice questions always show
percentages summed up by column. The column to-tal is always 100% and thus the total is not additio-nally displayed.-- Tables with multiple choice questions also dis-
play percentages (c.f. table 13), but the column total can exceed 100%. Each value represents the share of respondents who checked the corresponding item in the questionnaire.
-- The database – displayed in the last row (“N”) indi-cates the number of participants who (a) saw the ques-tion and (b) who checked at least one of the items.
-- Tables which show the results for questions with scales either display the share of participants in each point of the scale in percentages (like the sin-gle choice tables), or the mean value together with the standard deviation as a measure of dispersion, or both combined in one table.
Some questions are intended for a certain group of respondents by using filters. This target group of re-spondents is defined and displayed in the database in every table signature. The main filter in this sur-vey is “participation in sports” (active in the last 12 months, previously active, inactive except for physi-cal education, c.f. figure 6).
The total case numbers of the tables can vary. This can be because the particular question was not ad-dressed to every respondent (due to the filter), or because some of the respondents did not answer the question for other reasons (item/unit non-response).
Table 2: Abbreviations
%
2.9
3.1
2.1
1.9
1.2
2.2
3.0
4.7
1.8
2.7
4.9
15.5
2.1
5.5
2.2
11.3
n
159
170
118
105
64
120
164
258
101
147
268
858
117
304
122
625
n
111
184
42
115
159
34
183
103
88
176
126
103
233
132
34
5524
%
2.0
3.3
0.8
2.1
2.9
0.6
3.3
1.9
1.6
3.2
2.3
1.9
4.2
2.4
0.6
100.0
Latvia
Lithuania
Luxembourg
Malta
Netherlands
Northern Ireland
Poland
Portugal
Romania
Scotland
Slovakia
Slovenia
Spain
Sweden
Wales
Austria
Belgium
Bulgaria
Croatia
Cyprus
Czech Republic
Denmark
England
Estonia
Finland
France
Germany
Greece
Hungary
Ireland
Italy
TOTAL
Characteristics A
Characteristics B
N
AUT
74.1
25.9
174
GER
64.3
35.7
861
HUN
33.0
67.0
276
ITA
72.7
27.3
626
SCO
53.2
46.8
141
EU Total
60.8
39.2
5252
EU Other
59.5
40.5
3174
Abbrv.
M
SD
MIN
MAX
N
-
-
-
-
-
Term
Mean
Standard deviation
Minimum
Maximum
Number
Database
Single choice
Multiple choice
Open Question
Mandatory Question
Interpretation
Arithmetic mean: Sum of all values in a set of data divided by the count of all values in the set.
Measure of dispersion of a set of data from its mean. It shows how much the single values are spread out around the mean value.
Lowest value in a data set.
Highest value in a data set.
Count of all values in a data set.
All cases which are included in the analysis. Missing values can occur due to the filtering of the questionnaire or due to the response behavior of the participants (item/ unit non-responses).
Question with only one option to check.
Question with multiple options to check.
Option to type in an answer.
A question which has to be answered in order to continue the questionnaire.
TAB 1
TAB 2
TAB 3
%
2.9
3.1
2.1
1.9
1.2
2.2
3.0
4.7
1.8
2.7
4.9
15.5
2.1
5.5
2.2
11.3
n
159
170
118
105
64
120
164
258
101
147
268
858
117
304
122
625
n
111
184
42
115
159
34
183
103
88
176
126
103
233
132
34
5524
%
2.0
3.3
0.8
2.1
2.9
0.6
3.3
1.9
1.6
3.2
2.3
1.9
4.2
2.4
0.6
100.0
Latvia
Lithuania
Luxembourg
Malta
Netherlands
Northern Ireland
Poland
Portugal
Romania
Scotland
Slovakia
Slovenia
Spain
Sweden
Wales
Austria
Belgium
Bulgaria
Croatia
Cyprus
Czech Republic
Denmark
England
Estonia
Finland
France
Germany
Greece
Hungary
Ireland
Italy
TOTAL
Characteristics A
Characteristics B
N
AUT
74.1
25.9
174
GER
64.3
35.7
861
HUN
33.0
67.0
276
ITA
72.7
27.3
626
SCO
53.2
46.8
141
EU Total
60.8
39.2
5252
EU Other
59.5
40.5
3174
Abbrv.
M
SD
MIN
MAX
N
-
-
-
-
-
Term
Mean
Standard deviation
Minimum
Maximum
Number
Database
Single choice
Multiple choice
Open Question
Mandatory Question
Interpretation
Arithmetic mean: Sum of all values in a set of data divided by the count of all values in the set.
Measure of dispersion of a set of data from its mean. It shows how much the single values are spread out around the mean value.
Lowest value in a data set.
Highest value in a data set.
Count of all values in a data set.
All cases which are included in the analysis. Missing values can occur due to the filtering of the questionnaire or due to the response behavior of the participants (item/ unit non-responses).
Question with only one option to check.
Question with multiple options to check.
Option to type in an answer.
A question which has to be answered in order to continue the questionnaire.
TAB 1
TAB 2
TAB 3
Question: “How does a good table look like?“, Single choice, figures in %. Database: all. Project countries highlighted
Table 1: Example table

The Relevance of Sexual Orientation and Gender Identity in Sport in Europe. Findings from the Outsport Survey.14
Methodology
Limitations
The findings of the OUTSPORT Survey 2018 should be interpreted against the background of some li-mitations.
As mentioned, this study does not claim to be repre-sentative so the results cannot be generalised to a wider population. One of the reasons is the language barrier. The questionnaire was addressing respon-dents from all of the 28 EU states and was availa-ble in five languages, i.e. English, French, German, Hungarian and Italian. People who could not respond in their mother language could be underrepresented in the sample as it is less convenient to complete a survey in a foreign language.
Another factor is that people who completed the survey in a foreign language may have encountered more difficulty in understanding the questions than those who completed the survey in their native lan-guage.
Finally, quantitative research reduces complexity by describing ‘reality’ with concepts of commonplace knowledge and academic cognitive maps. This im-plies that the report cannot take appropriate account of the wide range of diverse individual experiences of LGBTI* people.

The Relevance of Sexual Orientation and Gender Identity in Sport in Europe. Findings from the Outsport Survey. 15
Demographics of the sample
A U T
2 7 . 3
1 1 . 3
1 6
5 8
1 4 3
M
S D
M I N
M A X
N
G E R
3 3 . 1
1 1 . 7
1 6
7 4
8 0 4
H U N
2 7 . 0
9 . 2
1 6
6 3
2 8 8
I T A
2 5 . 7
1 0 . 8
1 6
7 6
5 8 1
S C O
3 2 . 9
1 3 . 0
1 6
7 8
1 6 4
EU Total
26.5
11 .6
16
78
5186
EU Other
24.5
11 . 1
16
77
3206
No formal education
Lower secondary education or still at school
Upper secondary education
Post-secondary education other than college/ university
College/ university higher academic education
Doctoral degree /PhD
Other
N
A U T
4 . 9
1 8 . 9
3 0 . 8
7 . 7
3 7 . 8
0 . 0
0 . 0
1 4 3
G E R
0 . 4
8 . 0
2 2 . 6
1 0 . 9
5 6 . 8
1 . 0
0 . 4
8 0 5
H U N
2 . 1
1 0 . 3
2 4 . 1
1 7 . 7
4 5 . 7
0 . 0
0 . 0
2 8 2
I T A
0 . 5
1 9 . 3
4 4 . 2
3 . 8
3 2 . 0
0 . 2
0 . 0
5 8 4
S C O
1 . 2
2 . 4
1 7 . 1
4 . 3
7 5 . 0
0 . 0
0 . 0
1 6 4
EU Total
1 . 3
1 1 . 6
3 3 . 7
9 . 4
4 3 . 6
0 . 3
0 . 2
5 1 7 5
EU Other
1 . 5
1 1 . 3
3 6 . 3
9 . 6
4 0 . 8
0 . 2
0 . 3
3 1 9 7
TAB 4
TAB 5
TAB 6 Assigned sex at birth
Female
Male
N
A U T
8 0 . 5
1 9 . 5
1 5 9
G E R
6 3 . 3
3 6 . 7
8 5 8
H U N
2 8 . 6
7 1 . 4
3 0 4
I T A
6 8 . 8
3 1 . 2
6 2 5
S C O
4 9 . 4
5 0 . 6
1 7 6
EU Total
59.9
40.1
5524
EU Other
59.8
40.2
3402
2. DEMOGRAPHICS OF THE SAMPLE
The age of our survey participants ranged between 16 and 78 years and the average age of respondents is 26.5 years (±11.6). The comparatively young age of respondents could be a result of the recruitment via social media, which is predominantly used by younger people. Noticeable differences can be found among the German and Scottish participants, who are six to seven years older on average than the par-ticipants from Austria, Hungary and Italy (table 3).
The share of college or university graduates among the respondents was relatively high (44%). 1% had no formal education and 12% had achieved lower se-condary education or were still at school, whereas 34% had completed upper secondary education. 9% graduated in a post-secondary education other than
college or university. Doctoral degrees or PhD’s were rare (table 4). Respondents with lower secondary education or who were still at school were more like-ly to be from Italy (19%) or Austria (19%) than from Germany (8%), Hungary (10%), or Scotland (2%). Scotland (75%) has by far the most respondents with a university degree, followed by Germany (57%) and Hungary (46%).
Remarkable differences can be found with regard to sex assigned at birth. Eight out of ten respondents in Austria were assigned female at birth, which is consi-derably more than the corresponding percentages in the Italian (69%), German (63%), Scottish (49%) or Hungarian (29%) sub-samples (table 5).
A U T
2 7 . 3
1 1 . 3
1 6
5 8
1 4 3
M
S D
M I N
M A X
N
G E R
3 3 . 1
1 1 . 7
1 6
7 4
8 0 4
H U N
2 7 . 0
9 . 2
1 6
6 3
2 8 8
I T A
2 5 . 7
1 0 . 8
1 6
7 6
5 8 1
S C O
3 2 . 9
1 3 . 0
1 6
7 8
1 6 4
EU Total
26.5
11 .6
16
78
5186
EU Other
24.5
11 . 1
16
77
3206
No formal education
Lower secondary education or still at school
Upper secondary education
Post-secondary education other than college/ university
College/ university higher academic education
Doctoral degree /PhD
Other
N
A U T
4 . 9
1 8 . 9
3 0 . 8
7 . 7
3 7 . 8
0 . 0
0 . 0
1 4 3
G E R
0 . 4
8 . 0
2 2 . 6
1 0 . 9
5 6 . 8
1 . 0
0 . 4
8 0 5
H U N
2 . 1
1 0 . 3
2 4 . 1
1 7 . 7
4 5 . 7
0 . 0
0 . 0
2 8 2
I T A
0 . 5
1 9 . 3
4 4 . 2
3 . 8
3 2 . 0
0 . 2
0 . 0
5 8 4
S C O
1 . 2
2 . 4
1 7 . 1
4 . 3
7 5 . 0
0 . 0
0 . 0
1 6 4
EU Total
1 . 3
1 1 . 6
3 3 . 7
9 . 4
4 3 . 6
0 . 3
0 . 2
5 1 7 5
EU Other
1 . 5
1 1 . 3
3 6 . 3
9 . 6
4 0 . 8
0 . 2
0 . 3
3 1 9 7
TAB 4
TAB 5
TAB 6 Assigned sex at birth
Female
Male
N
A U T
8 0 . 5
1 9 . 5
1 5 9
G E R
6 3 . 3
3 6 . 7
8 5 8
H U N
2 8 . 6
7 1 . 4
3 0 4
I T A
6 8 . 8
3 1 . 2
6 2 5
S C O
4 9 . 4
5 0 . 6
1 7 6
EU Total
59.9
40.1
5524
EU Other
59.8
40.2
3402
Question: “How old are you?“ Open question. Mean, standard deviation, minimum and maximum age. Database: all.
Table 3: Age
Question: “What is the highest level of education you have achieved?” Single choice, figures in percent. Database: all.
Table 4: Education

The Relevance of Sexual Orientation and Gender Identity in Sport in Europe. Findings from the Outsport Survey.16
Demographics of the sample
Gender identity and sexual orientation
Two central concepts in our study are sexual orien-tation and gender identity. Gender identity can be described as “an individual’s internal sense of being male, female, transgender or something else” (Krane, 2016, p. 241)4. In this survey, two subsequently as-ked questions were used to retrieve data about the gender identity of respondents.
First, respondents were asked for sex assigned at birth, which could be either male or female5. They were then asked how the respondent would descri-be themselves with regard to their gender identity, offering four options: female, male, transgender and
the option “I do not identify myself as male, female or transgender”. Crossanalysis of these two questions resulted in the 6 categories of the respondents’ gen-der identity, which is presented in table 6.
A U T
2 7 . 3
1 1 . 3
1 6
5 8
1 4 3
M
S D
M I N
M A X
N
G E R
3 3 . 1
1 1 . 7
1 6
7 4
8 0 4
H U N
2 7 . 0
9 . 2
1 6
6 3
2 8 8
I T A
2 5 . 7
1 0 . 8
1 6
7 6
5 8 1
S C O
3 2 . 9
1 3 . 0
1 6
7 8
1 6 4
EU Total
26.5
11 .6
16
78
5186
EU Other
24.5
11 . 1
16
77
3206
No formal education
Lower secondary education or still at school
Upper secondary education
Post-secondary education other than college/ university
College/ university higher academic education
Doctoral degree /PhD
Other
N
A U T
4 . 9
1 8 . 9
3 0 . 8
7 . 7
3 7 . 8
0 . 0
0 . 0
1 4 3
G E R
0 . 4
8 . 0
2 2 . 6
1 0 . 9
5 6 . 8
1 . 0
0 . 4
8 0 5
H U N
2 . 1
1 0 . 3
2 4 . 1
1 7 . 7
4 5 . 7
0 . 0
0 . 0
2 8 2
I T A
0 . 5
1 9 . 3
4 4 . 2
3 . 8
3 2 . 0
0 . 2
0 . 0
5 8 4
S C O
1 . 2
2 . 4
1 7 . 1
4 . 3
7 5 . 0
0 . 0
0 . 0
1 6 4
EU Total
1 . 3
1 1 . 6
3 3 . 7
9 . 4
4 3 . 6
0 . 3
0 . 2
5 1 7 5
EU Other
1 . 5
1 1 . 3
3 6 . 3
9 . 6
4 0 . 8
0 . 2
0 . 3
3 1 9 7
TAB 4
TAB 5
TAB 6 Assigned sex at birth
Female
Male
N
A U T
8 0 . 5
1 9 . 5
1 5 9
G E R
6 3 . 3
3 6 . 7
8 5 8
H U N
2 8 . 6
7 1 . 4
3 0 4
I T A
6 8 . 8
3 1 . 2
6 2 5
S C O
4 9 . 4
5 0 . 6
1 7 6
EU Total
59.9
40.1
5524
EU Other
59.8
40.2
3402
Question: “What sex were you assigned at birth?“, Single choice, figures in percent. Database: all (mandatory question).
Table 5: Assigned sex at birth
Question: “How do you describe yourself?” and question “What sex were you assigned at birth?” Single choices, figures in percent. Database: all (mandatory
questions).
Cisgender
Female
Male
Transgender
Female
Male
Non-binary
I do not identify me as male, female or transgender
N
A U T
6 1 . 6
1 7 . 6
1 . 9
4 . 4
5 . 7
8 . 8
1 5 9
G E R
4 4 . 6
3 0 . 2
3 . 5
5 . 1
6 . 6
9 . 9
8 5 8
H U N
2 4 . 3
6 8 . 4
1 . 3
0 . 7
1 . 0
4 . 3
3 0 4
I T A
5 9 . 8
2 8 . 8
0 . 3
2 . 2
1 . 6
7 . 2
6 2 5
S C O
3 6 . 4
4 4 . 3
1 . 7
3 . 4
8 . 5
5 . 7
1 7 6
EU Other
4 6 . 6
3 7 . 3
0 . 8
2 . 1
4 . 1
9 . 1
3 4 0 2
EU Total
4 6 . 7
3 6 . 6
1 . 2
2 . 6
4 . 2
8 . 6
5 5 2 4
Gay men
Lesbian/ gay women
Bisexual
Heterosexual
Other
Not sure
Prefer not to say
N
1 8 . 2
2 4 . 5
3 7 . 1
1 0 . 7
7 . 5
1 . 9
0 . 0
1 5 9
2 8 . 2
1 6 . 8
3 4 . 4
1 2 . 4
4 . 2
2 . 0
1 . 5
8 5 8
6 2 . 2
1 2 . 8
1 5 . 8
5 . 3
3 . 6
0 . 3
0 . 0
3 0 4
2 4 . 8
2 5 . 6
3 3 . 9
7 . 8
5 . 3
1 . 0
1 . 6
6 2 5
4 2 . 6
1 5 . 3
3 0 . 1
6 . 8
3 . 4
0 . 6
1 . 1
1 7 6
3 1 . 7
2 8 . 8
2 0 . 4
1 1 . 3
5 . 7
1 . 1
1 . 0
3 4 0 2
3 2 . 1
2 5 . 2
2 4 . 6
1 0 . 6
5 . 3
1 . 2
1 . 1
5 5 2 4
A U T G E R H U N I T A S C O EU Other
EU Total
A U T
1 . 3
9 8 . 7
1 5 9
Y e s
N o
N
G E R
3 . 8
9 6 . 2
8 5 3
H U N
1 . 7
9 8 . 3
3 0 3
I T A
6 . 1
9 3 . 9
6 2 5
S C O
1 . 1
9 8 . 9
1 7 6
EU Other
3 . 5
9 6 . 5
3 3 9 8
EU Total
3 . 6
9 6 . 4
5 5 1 4
TAB 8 Sexual orientation
TAB 7: Gender Identity
TAB 9: Intersexuality
Table 6: Gender identitiy
4 Krane V. (2016). Inclusion to exclusion. Sport for LGBT athletes. In R. J. Schinke, K. R. MacGannon & B. Smith (Ed.), Routledge International Handbook of Sport Psychology (238-247). New York: Routledge.
5 Our respondents had to be at least 16 years old to participate in the survey. At the time of respondents’ birth or earlier, none of the 28 EU member states has offici-ally recognized a third sex at birth.

The Relevance of Sexual Orientation and Gender Identity in Sport in Europe. Findings from the Outsport Survey. 17
Demographics of the sample
The vast majority identify as cisgender, with more cisgender women (47%) than cisgender men (37%). One out of twelve respondents (8%) identify as transgender and of those, most identify as non-bina-ry (4%), followed by those identifying as trans wo-men (3%) and lastly those identifying as trans men (1%). Again, one out of twelve respondents (9%) do not identify as male, female or transgender at all. Trans people are a little more frequent in the German (15%), Scottish (13%) and Austrian (12%) samples, in comparison to the Hungarian (3%) and Italian (4%) samples.
When referring to gender identity, it will be primarily distinguished between three categories:
- Cisgender people (cisgender women, cis- gender men) - Trans people (trans women, trans men and
non-binary trans people) - Non-identifying people (people who do not
identify as male, female or transgender)
Sexual orientation was assessed by asking in what way people would describe themselves with regard to their sexual orientation. Seven response options were provided: Almost one third identify as gay (32%), one quarter identify as lesbian (25%) and another quarter identify as bisexual (25%). 11% of the respondents identify as heterosexual.6 5% indicate having another sexual orientation, 1% indicate being unsure and 1% preferred not to say (table 7).
The five project countries vary considerably with re-gard to the sexual orientation of respondents from each: Hungary has by far the highest percentage of gay men (62%) and the lowest percentage of les-bian/gay women (13%). A similar structure can be found in the Scottish sample, which is made up of 43% gay men and 15% lesbian/gay women. Austria (37%), Germany (34%) and Italy (34%) have above average numbers of bisexual respondents. Lesbian/gay women are more strongly represented in Austria (25%) and Italy (25%).
In order to build sufficiently large categories, sexual orientation is summarized with four categories in the report:
- Gay men - Lesbian/gay women - Bisexual people - Other* (including “heterosexual/straight”,
“other”, “not sure” or “prefer not to say”)
95% of those identifying as gay men are cisgen-der and 89% of those identifying as lesbian are cisgender. Bisexual people are most likely to be cisgender women (67%) and less likely to be cis-gender men (17%). Respondents from the other* category are mostly trans and non-identifying people (47%) or cisgender women (43%).
Cisgender
Female
Male
Transgender
Female
Male
Non-binary
I do not identify me as male, female or transgender
N
A U T
6 1 . 6
1 7 . 6
1 . 9
4 . 4
5 . 7
8 . 8
1 5 9
G E R
4 4 . 6
3 0 . 2
3 . 5
5 . 1
6 . 6
9 . 9
8 5 8
H U N
2 4 . 3
6 8 . 4
1 . 3
0 . 7
1 . 0
4 . 3
3 0 4
I T A
5 9 . 8
2 8 . 8
0 . 3
2 . 2
1 . 6
7 . 2
6 2 5
S C O
3 6 . 4
4 4 . 3
1 . 7
3 . 4
8 . 5
5 . 7
1 7 6
EU Other
4 6 . 6
3 7 . 3
0 . 8
2 . 1
4 . 1
9 . 1
3 4 0 2
EU Total
4 6 . 7
3 6 . 6
1 . 2
2 . 6
4 . 2
8 . 6
5 5 2 4
Gay men
Lesbian/ gay women
Bisexual
Heterosexual
Other
Not sure
Prefer not to say
N
1 8 . 2
2 4 . 5
3 7 . 1
1 0 . 7
7 . 5
1 . 9
0 . 0
1 5 9
2 8 . 2
1 6 . 8
3 4 . 4
1 2 . 4
4 . 2
2 . 0
1 . 5
8 5 8
6 2 . 2
1 2 . 8
1 5 . 8
5 . 3
3 . 6
0 . 3
0 . 0
3 0 4
2 4 . 8
2 5 . 6
3 3 . 9
7 . 8
5 . 3
1 . 0
1 . 6
6 2 5
4 2 . 6
1 5 . 3
3 0 . 1
6 . 8
3 . 4
0 . 6
1 . 1
1 7 6
3 1 . 7
2 8 . 8
2 0 . 4
1 1 . 3
5 . 7
1 . 1
1 . 0
3 4 0 2
3 2 . 1
2 5 . 2
2 4 . 6
1 0 . 6
5 . 3
1 . 2
1 . 1
5 5 2 4
A U T G E R H U N I T A S C O EU Other
EU Total
A U T
1 . 3
9 8 . 7
1 5 9
Y e s
N o
N
G E R
3 . 8
9 6 . 2
8 5 3
H U N
1 . 7
9 8 . 3
3 0 3
I T A
6 . 1
9 3 . 9
6 2 5
S C O
1 . 1
9 8 . 9
1 7 6
EU Other
3 . 5
9 6 . 5
3 3 9 8
EU Total
3 . 6
9 6 . 4
5 5 1 4
TAB 8 Sexual orientation
TAB 7: Gender Identity
TAB 9: Intersexuality
Question: “How do you describe yourself?” Single choice, figures in percent. Database: all (mandatory question).
6 As the adjusted sample only contains respondents with an LGBTI* background, people who identified as heterosexual are non-cisgender and/or intersex respec-tively.
Table 7: Sexual orientation
The Relevance of Sexual Orientation and Gender Identity in Sport in Europe. Findings from the Outsport Survey.18
Demographics of the sample
Figure 10: OpennessQuestion: ”Please select the statement which suits you best.”Single choice, figures in percent. Database: all.
0 25 50 75 100
“In most contexts I am trying to hide my sexual orientation/
gender identity.”
“In some contexts I am trying to hide my sexual orientation/
gender identity.”
“I don't care if people know about my sexual orientation/
gender identity.”
EU Total
EU Other
Scotland
Italy
Hungary
Germany
Austria 146
814
289
595
165
3258
5267
N
32.2 57.5 10.3
44.8 9.6
19.451.6
39.3
37.0
46.7
45.8
15.5
4.8
15.3
14.2
45.6
29.1
45.2
58.2
38.0
39.9
Question: “Please select the statement which suits you best.” Single choice, figures in percent. Database: all.
Respondents who are intersex make up almost 4% of the sample and are most strongly represented in the Italian sample (6%) (table 8).
Within the scope of this report, intersex respondents are assigned to the corresponding category regarding their sexual orientation (31% gay men, 23% lesbi-an/gay women, 23% bisexual people and 23% other) and their gender identity (3% trans women, 4% trans men, 9% non-binary trans people, 33% cisgender wo-men, 38% cisgender men and 14% non-identifying people).
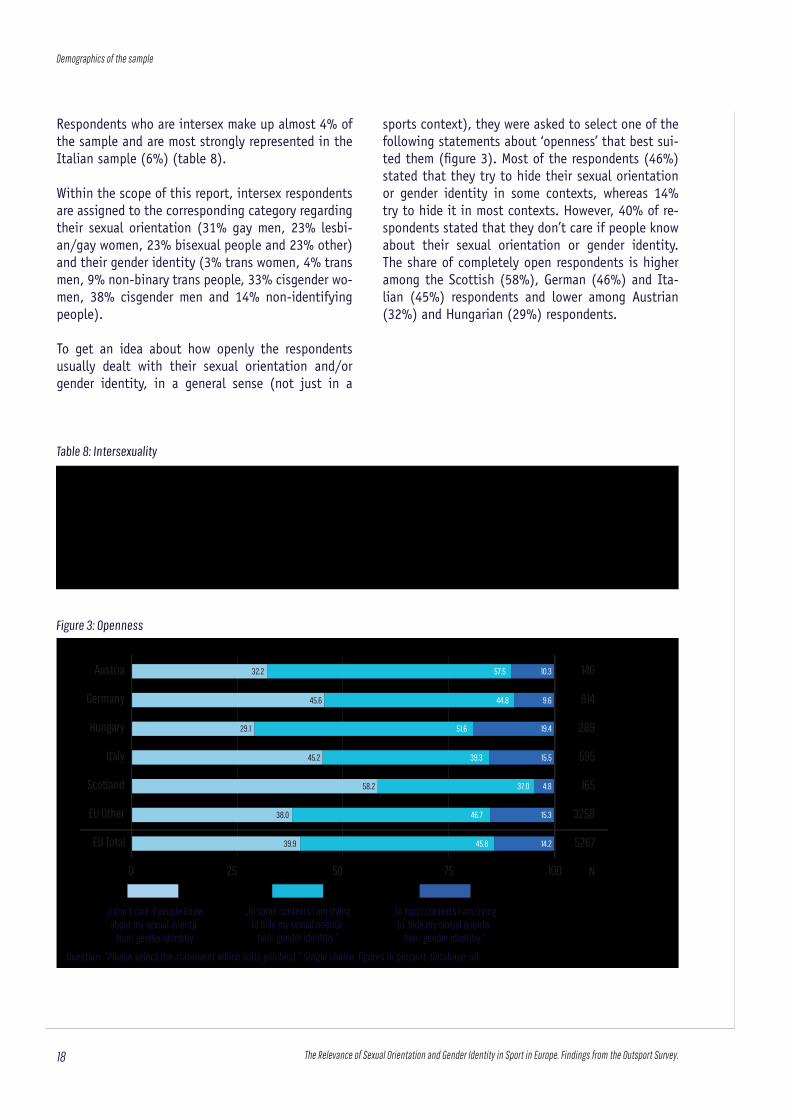
To get an idea about how openly the respondents usually dealt with their sexual orientation and/or gender identity, in a general sense (not just in a
sports context), they were asked to select one of the following statements about ‘openness’ that best sui-ted them (figure 3). Most of the respondents (46%) stated that they try to hide their sexual orientation or gender identity in some contexts, whereas 14% try to hide it in most contexts. However, 40% of re-spondents stated that they don’t care if people know about their sexual orientation or gender identity. The share of completely open respondents is higher among the Scottish (58%), German (46%) and Ita-lian (45%) respondents and lower among Austrian (32%) and Hungarian (29%) respondents.
Cisgender
Female
Male
Transgender
Female
Male
Non-binary
I do not identify me as male, female or transgender
N
A U T
6 1 . 6
1 7 . 6
1 . 9
4 . 4
5 . 7
8 . 8
1 5 9
G E R
4 4 . 6
3 0 . 2
3 . 5
5 . 1
6 . 6
9 . 9
8 5 8
H U N
2 4 . 3
6 8 . 4
1 . 3
0 . 7
1 . 0
4 . 3
3 0 4
I T A
5 9 . 8
2 8 . 8
0 . 3
2 . 2
1 . 6
7 . 2
6 2 5
S C O
3 6 . 4
4 4 . 3
1 . 7
3 . 4
8 . 5
5 . 7
1 7 6
EU Other
4 6 . 6
3 7 . 3
0 . 8
2 . 1
4 . 1
9 . 1
3 4 0 2
EU Total
4 6 . 7
3 6 . 6
1 . 2
2 . 6
4 . 2
8 . 6
5 5 2 4
Gay men
Lesbian/ gay women
Bisexual
Heterosexual
Other
Not sure
Prefer not to say
N
1 8 . 2
2 4 . 5
3 7 . 1
1 0 . 7
7 . 5
1 . 9
0 . 0
1 5 9
2 8 . 2
1 6 . 8
3 4 . 4
1 2 . 4
4 . 2
2 . 0
1 . 5
8 5 8
6 2 . 2
1 2 . 8
1 5 . 8
5 . 3
3 . 6
0 . 3
0 . 0
3 0 4
2 4 . 8
2 5 . 6
3 3 . 9
7 . 8
5 . 3
1 . 0
1 . 6
6 2 5
4 2 . 6
1 5 . 3
3 0 . 1
6 . 8
3 . 4
0 . 6
1 . 1
1 7 6
3 1 . 7
2 8 . 8
2 0 . 4
1 1 . 3
5 . 7
1 . 1
1 . 0
3 4 0 2
3 2 . 1
2 5 . 2
2 4 . 6
1 0 . 6
5 . 3
1 . 2
1 . 1
5 5 2 4
A U T G E R H U N I T A S C O EU Other
EU Total
A U T
1 . 3
9 8 . 7
1 5 9
Y e s
N o
N
G E R
3 . 8
9 6 . 2
8 5 3
H U N
1 . 7
9 8 . 3
3 0 3
I T A
6 . 1
9 3 . 9
6 2 5
S C O
1 . 1
9 8 . 9
1 7 6
EU Other
3 . 5
9 6 . 5
3 3 9 8
EU Total
3 . 6
9 6 . 4
5 5 1 4
TAB 8 Sexual orientation
TAB 7: Gender Identity
TAB 9: Intersexuality
Question: “Are you intersex?” Single choice, figures in percent. Database: all.
Table 8: Intersexuality
Figure 3: Openness
„In most contexts I am trying to hide my sexual orienta-
tion/ gender identitiy.“
„In some contexts I am trying to hide my sexual orienta-
tion/ gender identitiy.“
„I don‘t care if people know about my sexual orienta-
tion/ gender identitiy

The Relevance of Sexual Orientation and Gender Identity in Sport in Europe. Findings from the Outsport Survey. 19
General assessment of homophobia
3. GENERAL ASSESSMENT OF HOMOPHOBIA
Question: “Do you think there is a problem with homophobia in sport?” Scale from 1 “no problem” to 5 “big problem”. Figures in percent (top), mean and
standard deviation (bottom). Database: all.
Figure 4: General assessment of homophobia in sport
Figure 4: General assessment of homophobia in sportQuestion: ”Do you think there is a problem with homophobia in sport?“Scale from 1 “no problem” to 5 “big problem”. Figures in percent, mean and standard deviation. Database: all.
0 25 50 75 100
EU Total
EU Other
Scotland
Italy
Hungary
Germany
Austria
1 (no problem) 2 3 4 5 (big problem) don‘t know
3.52
3.75
3.62
3.73
3.88
3.69
3.71
M
1.02
0.92
1.13
1.01
0.97
1.05
1.02
SD
159
858
304
625
176
3398
5520
N
9.44.4
5.9
1.9
1.7
25.8 39.0 13.8 7.5
2.9
8.620.736.2
32.5 24.0 6.6
4.029.036.4
21.040.228.3
19.78.9
1.5
3.3
3.0
8.5 26.6
22.76.3
7.3 24.1 31.9 21.7 11.7
9.221.833.824.87.4
6.1
1 (no problem) 2 3 4 5 (big problem) don‘t know
All of the respondents were asked to assess homo-/transphobia in sport on a general level (“Do you think that there is a problem with homophobia/transphobia in sport?”). The options to respond to this question were organised as a five-point scale, going from 1 (no problem) to 5 (big problem). Both concepts were defined in the survey as follows:
- Homophobia is “prejudice or discrimination on grounds of homo- or bisexual orientation” - Transphobia is “prejudice or discrimination on
grounds of transgender identity”
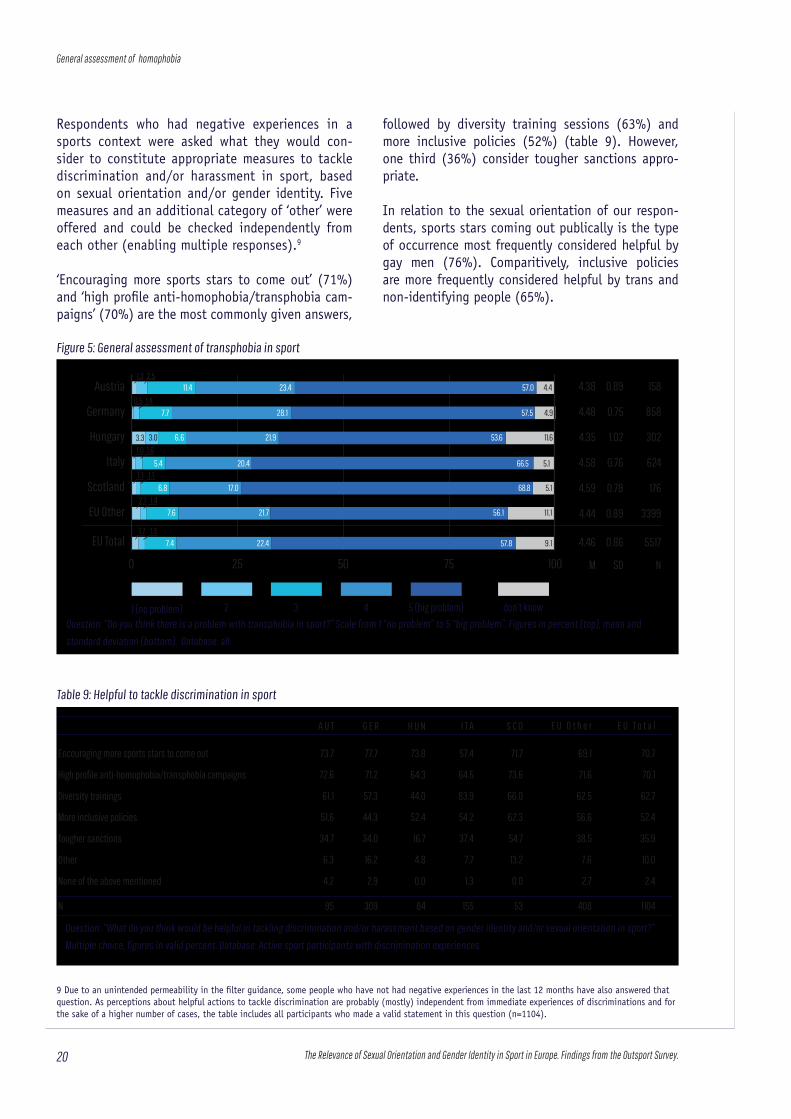
Referring to homophobia, the vast majority of our respondents think that it is a problem in sport and 22% identify it as a big problem (figure 4). The mean value is 3.71.
With regard to the diversity of sexual orientations and gender identities surveyed, the data indicates that gay men perceive homophobia to be a bigger problem than lesbian/gay women and bisexual peo-ple. Regarding gender identity, trans and non-identi-fying people evaluate the problem to be worse more often than cisgender people making the same eva-luation.7
Overall, transphobia (M=4.46) in sport is perceived to be a bigger problem than homophobia (M=3.71) (figure 5) – irrespective of gender identity and with only small differences regarding sexual orientation: bisexual people rate the problem of transphobia in sport lower than gay men and lesbian/gay women.8
7 As the adjusted sample only contains respondents with an LGBTI* background, people who identified as heterosexual are non-cisgender and/or inter sex respectively.
8 Gay men: M=4.51, SD=.83; Lesbian/gay women: M=4.51, SD=.82; Bisexual people: M=4.38, SD=.90
The Relevance of Sexual Orientation and Gender Identity in Sport in Europe. Findings from the Outsport Survey.20
General assessment of homophobia
Respondents who had negative experiences in a sports context were asked what they would con-sider to constitute appropriate measures to tackle discrimination and/or harassment in sport, based on sexual orientation and/or gender identity. Five measures and an additional category of ‘other’ were offered and could be checked independently from each other (enabling multiple responses).9
‘Encouraging more sports stars to come out’ (71%) and ‘high profile anti-homophobia/transphobia cam-paigns’ (70%) are the most commonly given answers,
followed by diversity training sessions (63%) and more inclusive policies (52%) (table 9). However, one third (36%) consider tougher sanctions appro-priate.
In relation to the sexual orientation of our respon-dents, sports stars coming out publically is the type of occurrence most frequently considered helpful by gay men (76%). Comparitively, inclusive policies are more frequently considered helpful by trans and non-identifying people (65%).
Tab 13: Helpful to tackle discrimination
Encouraging more sports stars to come out
High profile anti-homophobia/transphobia campaigns
Diversity trainings
More inclusive policies
Tougher sanctions
Other
None of the above mentioned
N
70.7
70.1
62.7
52.4
35.9
10.0
2.4
1104
73.7
72.6
61.1
51.6
34.7
6.3
4.2
95
77.7
71.2
57.3
44.3
34.0
16.2
2.9
309
73.8
64.3
44.0
52.4
16.7
4.8
0.0
84
57.4
64.5
83.9
54.2
37.4
7.7
1.3
155
71.7
73.6
66.0
62.3
54.7
13.2
0.0
53
69.1
71.6
62.5
56.6
38.5
7.6
2.7
408
A U T G E R H U N I T A S C O E U O t h e r
E U T o t a l
Tab 14: Homo- and transphobic language in comparison witnessed
In sports (physical activity, spectator sports, etc.)
In leisure activities (other than sports)
At workplace / In the educational system (school, university, etc.)
N
(1.26)
(1.32)
(1.30)
143
(1.24)
(1.13)
(1.22)
792
2.73
2.97
2.33
(1.31)
(1.27)
(1.34)
268
3.03
3.31
3.26
(1.28)
(1.23)
(1.35)
551
3.12
3.61
3.41
(1.25)
(1.12)
(1.32)
162
2.90
2.70
2.70
(1.35)
(1.27)
(1.35)
3006
2.96
3.15
3.12
2.83
2.96
2.56
A U T G E R H U N I T A S C O E U O t h e r
E U T o t a l
(1.32)
(1.26)
(1.37)
4922
2.94
3.16
3.01
Tab 15: Homo- and transphobic language in comparison felt
In sports (physical activity, spectator sports, etc.)
In leisure activities (other than sports)
At workplace / In the educational system (school, university, etc.)
N
(1.24)
(1.29)
(1.32)
118
(1.28)
(1.25)
(1.29)
640
2.71
2.75
2.70
(1.23)
(1.20)
(1.27)
223
3.55
3.49
3.60
(1.39)
(1.33)
(1.36)
480
3.09
3.24
3.42
(1.23)
(1.28)
(1.28)
134
3.28
3.06
3.18
(1.34)
(1.29)
(1.32)
2459
2.95
3.03
3.20
2.64
2.61
2.78
A U T G E R H U N I T A S C O E U O t h e r
E U T o t a l
(1.34)
(1.30)
(1.34)
4054
2.97
3.02
3.17
Question: “What do you think would be helpful in tackling discrimination and/or harassment based on gender identity and/or sexual orientation in sport?”
Multiple choice, figures in valid percent. Database: Active sport participants with discrimination experiences.
Figure 5: General assessment of transphobia in sportQuestion: ”Do you think there is a problem with transphobia in sport?“Scale from 1 “no problem” to 5 “big problem”. Figures in percent, mean and standard deviation. Database: all.
0 25 50 75 100
EU Total
EU Other
Scotland
Italy
Hungary
Germany
Austria 4.38
4.48
4.35
4.58
4.59
4.44
4.46
M
0.89
0.75
1.02
0.76
0.78
0.89
0.86
SD
158
858
302
624
176
3399
5517
N
11.40.5 1.4
3.01.0
1.1
2.1 1.4
1.1
1.63.3
1.3 2.523.4 57.0 4.4
4.9
11.653.6
66.5 5.1
5.168.8
57.528.1
21.96.6
5.4 20.4
17.06.8
7.6 21.7 56.1 11.1
9.157.822.47.4
7.7
1 (no problem) 2 3 4 5 (big problem) don‘t know
1.7 1.5
Question: “Do you think there is a problem with transphobia in sport?” Scale from 1 “no problem” to 5 “big problem”. Figures in percent (top), mean and
standard deviation (bottom). Database: all.
9 Due to an unintended permeability in the filter guidance, some people who have not had negative experiences in the last 12 months have also answered that question. As perceptions about helpful actions to tackle discrimination are probably (mostly) independent from immediate experiences of discriminations and for the sake of a higher number of cases, the table includes all participants who made a valid statement in this question (n=1104).
Table 9: Helpful to tackle discrimination in sport
Figure 5: General assessment of transphobia in sport
1 (no problem) 2 3 4 5 (big problem) don‘t know

The Relevance of Sexual Orientation and Gender Identity in Sport in Europe. Findings from the Outsport Survey. 21
Homophobic / transphobic language
4. HOMOPHOBIC / TRANSPHOBIC LANGUAGE
To get an idea of how widespread the use of homopho-bic/transphobic language is, our respondents were as-ked to report instances in which they had witnessed the use of homophobic/transphobic language in the last 12 months. They were asked for three different subareas of their lives: sport, leisure activities (other than sport) and workplace/educational systems. Response options were provided using a five-point scale, going from “ne-ver” (1) to “very often” (5). Homophobic/transphobic language was defined as “the use of expressions like ‘that‘s so gay’, derogatory words and/or jokes about se-xual orientation and gender identity issues.”
The mean values of responses to this question vary bet-ween 2.94 in sport and 3.16 in leisure activities (other than sport), which indicates that homophobic/trans-phobic language can be witnessed in all three contexts to more or less the same degree. However, there is a tendency of homophobic/transphobic language being witnessed more often in other leisure activities than sport (table 10).
Substantial differences regarding sexual orientation and gender identity can only be found in the subareas ‘leisure activities (other than sports)’ and ‘workplace/
educational system’. Gay men witness homophobic/transphobic language less often than lesbian/gay wo-men, bisexual people and people with other sexual orientations. Regarding gender identity, non-binary trans and non-identifying people witness the most usa-ges of homophobic/transphobic language.10
We also wanted to know how often respondents felt discriminated against or offended by usages of homo-phobic/transphobic language, where they have witnes-sed those usages (table 11). The subarea ‘workplace/educational system’ seems to be the context in which homophobic/transphobic language is most harmful, followed by the contexts of non-sporting leisure acti-vities and sport.
Within the context of sport, bisexual people feel less frequently offended or discriminated against by the use of homophobic/transphobic language than gay men or lesbian/gay women. Regarding gender identity, trans women and non-binary trans people are more likely to feel offended than cisgender people.11
Tab 13: Helpful to tackle discrimination
Encouraging more sports stars to come out
High profile anti-homophobia/transphobia campaigns
Diversity trainings
More inclusive policies
Tougher sanctions
Other
None of the above mentioned
N
70.7
70.1
62.7
52.4
35.9
10.0
2.4
1104
73.7
72.6
61.1
51.6
34.7
6.3
4.2
95
77.7
71.2
57.3
44.3
34.0
16.2
2.9
309
73.8
64.3
44.0
52.4
16.7
4.8
0.0
84
57.4
64.5
83.9
54.2
37.4
7.7
1.3
155
71.7
73.6
66.0
62.3
54.7
13.2
0.0
53
69.1
71.6
62.5
56.6
38.5
7.6
2.7
408
A U T G E R H U N I T A S C O E U O t h e r
E U T o t a l
Tab 14: Homo- and transphobic language in comparison witnessed
In sports (physical activity, spectator sports, etc.)
In leisure activities (other than sports)
At workplace / In the educational system (school, university, etc.)
N
(1.26)
(1.32)
(1.30)
143
(1.24)
(1.13)
(1.22)
792
2.73
2.97
2.33
(1.31)
(1.27)
(1.34)
268
3.03
3.31
3.26
(1.28)
(1.23)
(1.35)
551
3.12
3.61
3.41
(1.25)
(1.12)
(1.32)
162
2.90
2.70
2.70
(1.35)
(1.27)
(1.35)
3006
2.96
3.15
3.12
2.83
2.96
2.56
A U T G E R H U N I T A S C O E U O t h e r
E U T o t a l
(1.32)
(1.26)
(1.37)
4922
2.94
3.16
3.01
Tab 15: Homo- and transphobic language in comparison felt
In sports (physical activity, spectator sports, etc.)
In leisure activities (other than sports)
At workplace / In the educational system (school, university, etc.)
N
(1.24)
(1.29)
(1.32)
118
(1.28)
(1.25)
(1.29)
640
2.71
2.75
2.70
(1.23)
(1.20)
(1.27)
223
3.55
3.49
3.60
(1.39)
(1.33)
(1.36)
480
3.09
3.24
3.42
(1.23)
(1.28)
(1.28)
134
3.28
3.06
3.18
(1.34)
(1.29)
(1.32)
2459
2.95
3.03
3.20
2.64
2.61
2.78
A U T G E R H U N I T A S C O E U O t h e r
E U T o t a l
(1.34)
(1.30)
(1.34)
4054
2.97
3.02
3.17
Question: “In the last 12 months, have you witnessed the use of any homophobic or transphobic language?” Scale from 1 “never” to 5 “very often”. Mean and
standard deviation. Database: all.
Table 10: Homo- and transphobic language in comparison (witnessed)
10 In Leisure activities: Other: M=3.34, SD=1.22; Bisexual people: M=3.28, SD=1.25;Lesbian/gay women: M=3.17, SD=1.26; Gay men: M=2.97, SD=1.25; Non-identifying people: M=3.37, SD=1.24; Non-binary trans people: M=3.32, SD=1.22; Cisgender women: M=3.25, SD=1.25; Trans women: M=3.18, SD=1.31; Trans men: M=3.16, SD=1.18; Cisgender men: M=2.99, SD=1.26. At workplace/In the educational system: Other: M=3.26, SD=1.35; Bisexual people: M=3.21, SD=1.35;Lesbian/gay women: M=3.00, SD=1.36; Gay men: M=2.72, SD=1.34; Non-identifying people: M=3.25, SD=1.32; Non-binary trans people: M=3.24, SD=1.39; Cisgender women: M=3.13, SD=1.36; Trans men: M=3.03, SD=1.39; Trans women: M=2.83, SD=1.39; Cisgender men: M=2.78, SD=1.36.
11 Gay men: M=3.01, SD=1.32; Lesbian/gay women: M=2.95, SD=1.29; Bisexual people: M=2.79, SD=1.35; Trans women: M=3.80, SD=1.27; Non-binary trans people: M=3.48, SD=1.22; Cisgender men M=2.95, SD=1.33; Cisgender women: M=2.84, SD=1.33.

The Relevance of Sexual Orientation and Gender Identity in Sport in Europe. Findings from the Outsport Survey.22
Homophobic / transphobic language
Tab 13: Helpful to tackle discrimination
Encouraging more sports stars to come out
High profile anti-homophobia/transphobia campaigns
Diversity trainings
More inclusive policies
Tougher sanctions
Other
None of the above mentioned
N
70.7
70.1
62.7
52.4
35.9
10.0
2.4
1104
73.7
72.6
61.1
51.6
34.7
6.3
4.2
95
77.7
71.2
57.3
44.3
34.0
16.2
2.9
309
73.8
64.3
44.0
52.4
16.7
4.8
0.0
84
57.4
64.5
83.9
54.2
37.4
7.7
1.3
155
71.7
73.6
66.0
62.3
54.7
13.2
0.0
53
69.1
71.6
62.5
56.6
38.5
7.6
2.7
408
A U T G E R H U N I T A S C O E U O t h e r
E U T o t a l
Tab 14: Homo- and transphobic language in comparison witnessed
In sports (physical activity, spectator sports, etc.)
In leisure activities (other than sports)
At workplace / In the educational system (school, university, etc.)
N
(1.26)
(1.32)
(1.30)
143
(1.24)
(1.13)
(1.22)
792
2.73
2.97
2.33
(1.31)
(1.27)
(1.34)
268
3.03
3.31
3.26
(1.28)
(1.23)
(1.35)
551
3.12
3.61
3.41
(1.25)
(1.12)
(1.32)
162
2.90
2.70
2.70
(1.35)
(1.27)
(1.35)
3006
2.96
3.15
3.12
2.83
2.96
2.56
A U T G E R H U N I T A S C O E U O t h e r
E U T o t a l
(1.32)
(1.26)
(1.37)
4922
2.94
3.16
3.01
Tab 15: Homo- and transphobic language in comparison felt
In sports (physical activity, spectator sports, etc.)
In leisure activities (other than sports)
At workplace / In the educational system (school, university, etc.)
N
(1.24)
(1.29)
(1.32)
118
(1.28)
(1.25)
(1.29)
640
2.71
2.75
2.70
(1.23)
(1.20)
(1.27)
223
3.55
3.49
3.60
(1.39)
(1.33)
(1.36)
480
3.09
3.24
3.42
(1.23)
(1.28)
(1.28)
134
3.28
3.06
3.18
(1.34)
(1.29)
(1.32)
2459
2.95
3.03
3.20
2.64
2.61
2.78
A U T G E R H U N I T A S C O E U O t h e r
E U T o t a l
(1.34)
(1.30)
(1.34)
4054
2.97
3.02
3.17
Question: “Did you feel discriminated against or offended by this language?” Scale from 1 “never” to 5 “very often”. Mean and standard deviation. Database:
Witnesses of homo-/transphobic language.
Table 11 : Homo- and transphobic language in comparison (felt discriminated against)
The Relevance of Sexual Orientation and Gender Identity in Sport in Europe. Findings from the Outsport Survey. 23
Sports participation and exclusion
The following section deals with the sports participa-tion of respondents and perceived feelings of exclu-sion from particular sports.
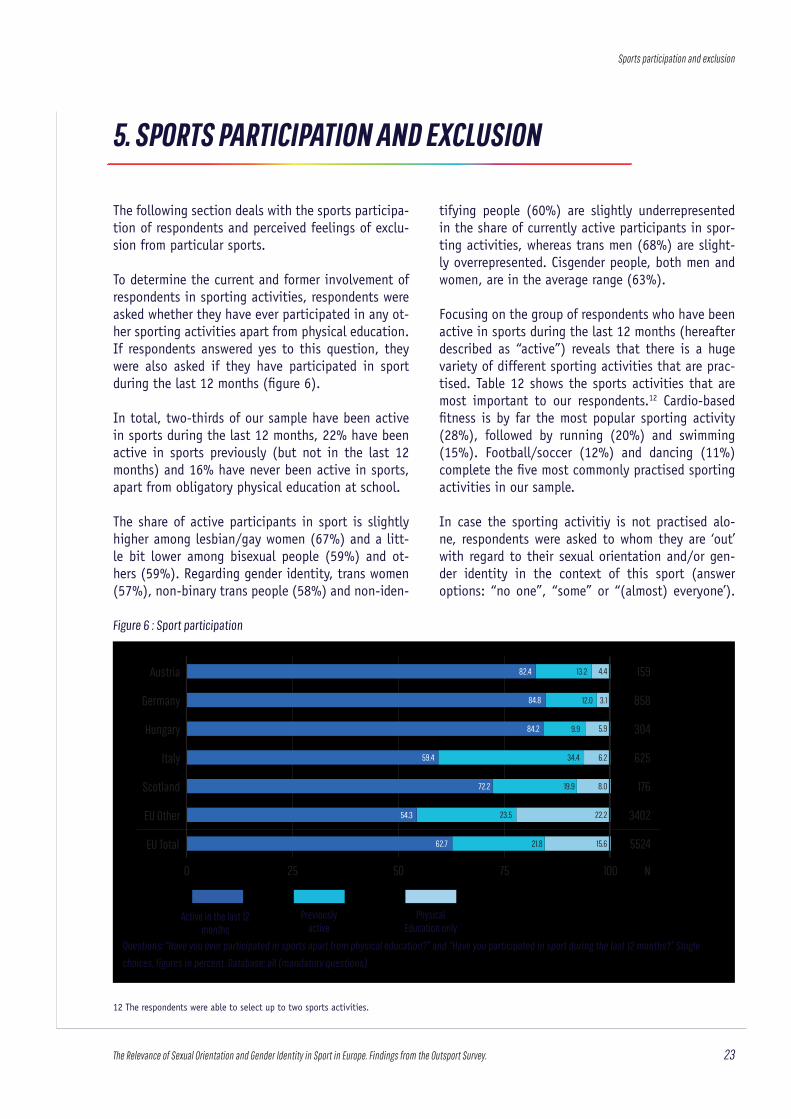
To determine the current and former involvement of respondents in sporting activities, respondents were asked whether they have ever participated in any ot-her sporting activities apart from physical education. If respondents answered yes to this question, they were also asked if they have participated in sport during the last 12 months (figure 6).
In total, two-thirds of our sample have been active in sports during the last 12 months, 22% have been active in sports previously (but not in the last 12 months) and 16% have never been active in sports, apart from obligatory physical education at school.
The share of active participants in sport is slightly higher among lesbian/gay women (67%) and a litt-le bit lower among bisexual people (59%) and ot-hers (59%). Regarding gender identity, trans women (57%), non-binary trans people (58%) and non-iden-
5. SPORTS PARTICIPATION AND EXCLUSION
tifying people (60%) are slightly underrepresented in the share of currently active participants in spor-ting activities, whereas trans men (68%) are slight-ly overrepresented. Cisgender people, both men and women, are in the average range (63%).
Focusing on the group of respondents who have been active in sports during the last 12 months (hereafter described as “active”) reveals that there is a huge variety of different sporting activities that are prac-tised. Table 12 shows the sports activities that are most important to our respondents.12 Cardio-based fitness is by far the most popular sporting activity (28%), followed by running (20%) and swimming (15%). Football/soccer (12%) and dancing (11%) complete the five most commonly practised sporting activities in our sample.
In case the sporting activitiy is not practised alo-ne, respondents were asked to whom they are ‘out’ with regard to their sexual orientation and/or gen-der identity in the context of this sport (answer options: “no one”, “some” or “(almost) everyone’).
Questions: “Have you ever participated in sports apart from physical education?” and “Have you participated in sport during the last 12 months?” Single
choices, figures in percent. Database: all (mandatory questions).
Figure 6: Sport participationQuestion: ”Have you ever participated in sports apart from physical education?” and “Have you participated in sport during the last 12 months?”Single choice, figures in percent. Database: all. (mandatory questions).
0 25 50 75 100
Previously active
Active in thelast 12 Months
Physical Education only
EU Total
EU Other
Scotland
Italy
Hungary
Germany
Austria 159
858
304
625
176
3402
5524
N
82.4 13.2 4.4
12.0 3.1
5.99.9
34.4
19.9
23.5
21.8
6.2
8.0
22.2
15.6
84.8
84.2
59.4
72.2
54.3
62.7
12 The respondents were able to select up to two sports activities.
Figure 6 : Sport participation
Active in the last 12 months
Previously active
Physical Education only

The Relevance of Sexual Orientation and Gender Identity in Sport in Europe. Findings from the Outsport Survey.24
Sports participation and exclusion
Referring to the most important sports activity of our respondents, the respondents are distributed more or less evenly over all categories. 33% remain in the closet, 31% are out to some people in their sports ac-tivity and 36% are out to (almost) everyone (figure 7).
Lesbian/gay women (48%) and gay men (42%) are more often out to (almost) everyone in a specific sports context, in comparison to bisexual people (22%) and people with other sexual orientations (27%). The latter group remain in the closet more often within their most important sport (bisexual
people: 44%, others: 40%). Regarding gender identi-ty, rather small differences occur with one exception: trans women appear to be more frequently out to everyone (60%) than all other groups in the survey.
Question: “What sports activities that you took part in during the last 12 months were most important to you?” Multiple choice, figures in percent (sports with
over 2%). Database: Active in the last 12 months.
Tab 16: Sport participation
Active in the last 12 months
Previously active
Physical Education only
N
82.4
13.2
4.4
159
84.8
12.0
3.1
858
84.2
12.0
3.1
304
84.2
9.9
5.9
625
72.2
19.9
8.0
176
54.3
23.5
22.2
3402
A U T G E R H U N I T A S C O E U O t h e r
E U T o t a l
62.7
21.8
15.6
5524
Tab 17: Most important sports activities
Tab 16: Sport participation
Verbal insults, slurs
Discrimination
Verbal threats
E-bullying
Physically “crossing the line“
Physical violence
Other
N
85.7
64.3
21.4
28.6
14.3
14.3
14.3
14
80.9
71.3
40.4
36.2
31.9
21.3
14.9
94
90.5
61.9
52.4
42.9
42.9
19.0
4.8
21
80.8
76.9
11.5
15.4
15.4
3.8
11.5
26
70.6
64.7
52.9
35.3
41.2
17.6
29.4
17
82.3
79.7
49.4
45.5
40.7
22.1
9.5
231
A U T G E R H U N I T A S C O E U O t h e r
E U T o t a l
81.9
75.4
44.2
40.2
36.2
20.1
11.7
403
Tab 17: Most important sports activities
Fitness-cardio
Running
Swimming
Football (soccer)
Dance
Weight training
Martial Arts
Yoga
Volleyball
Walking
Badminton
Basketball
Climbing
Hiking
Bicycling
Tennis
Boxing
Gymnastics
Athletics
Equestrian sports
Rugby
Mountain biking
N
26.5
21.2
13.6
25.8
9.8
9.8
6.1
6.1
7.6
3.0
3.8
1.5
6.8
3.0
2.3
1.5
2.3
4.5
4.5
0.8
1.5
3.8
132
30.4
24.3
13.5
17.6
7.4
6.9
6.7
6.9
5.1
3.2
4.8
1.9
5.2
3.7
5.2
2.2
3.2
3.2
2.1
1.5
1.4
3.6
727
34.3
21.3
16.5
6.3
8.7
18.9
5.1
7.5
5.9
4.3
3.9
2.8
0.8
5.5
5.5
2.4
2.0
3.5
3.1
0.8
0.0
2.8
254
22.5
13.0
16.0
15.2
7.0
8.4
9.5
4.9
13.3
6.5
0.3
3.8
3.0
1.4
0.3
5.1
3.5
4.9
3.8
1.1
2.7
1.4
369
17.3
27.6
11.8
11.8
7.1
7.9
5.5
1.6
1.6
6.3
8.7
5.5
5.5
5.5
5.5
4.7
2.4
0.0
2.4
1.6
11.0
0.0
127
27.1
18.2
15.8
8.4
13.8
6.1
6.3
6.2
4.8
6.3
3.8
4.7
3.2
3.6
2.4
3.1
2.9
2.3
2.4
3.6
2.4
1.7
1847
GERAUT H U N I T A S C O E U O t h e r
E U T o t a l
27.5
19.6
15.2
11.7
11.0
7.7
6.6
6.1
5.8
5.4
3.8
3.8
3.6
3.6
3.1
3.1
2.9
2.8
2.6
2.5
2.3
2.1
3456
Table 12 : Most important sports activities
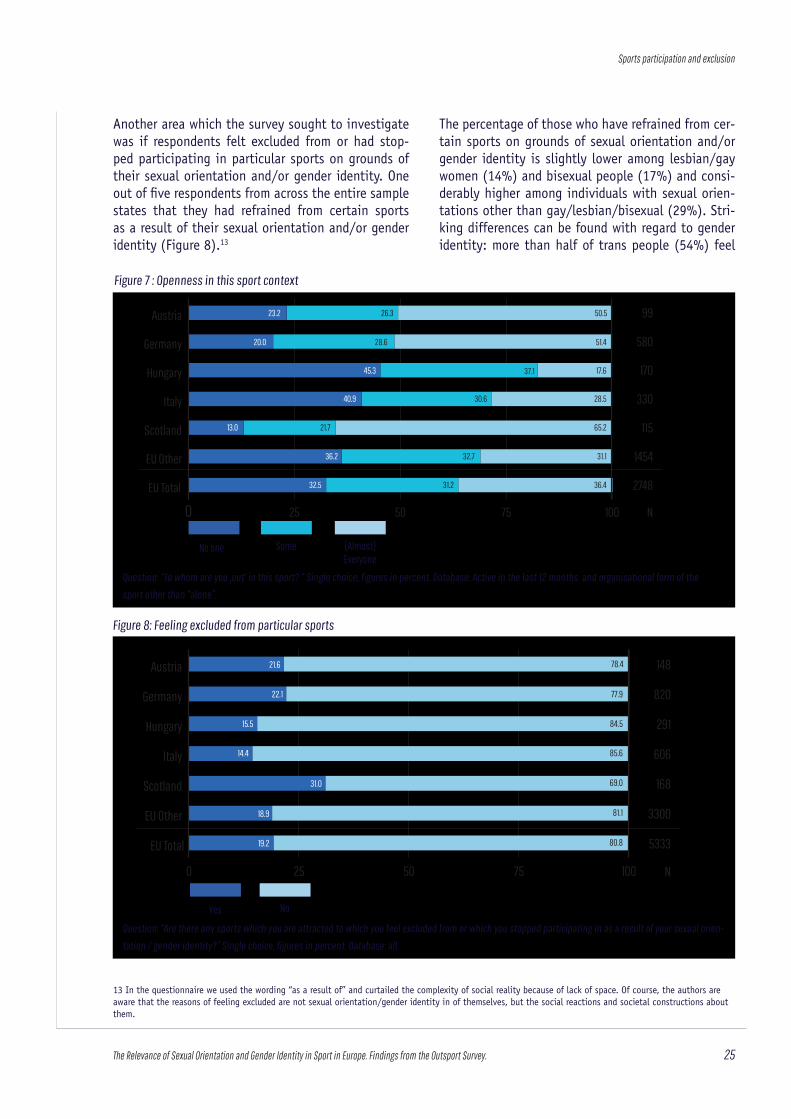
The Relevance of Sexual Orientation and Gender Identity in Sport in Europe. Findings from the Outsport Survey. 25
Sports participation and exclusion
Another area which the survey sought to investigate was if respondents felt excluded from or had stop-ped participating in particular sports on grounds of their sexual orientation and/or gender identity. One out of five respondents from across the entire sample states that they had refrained from certain sports as a result of their sexual orientation and/or gender identity (Figure 8).13
The percentage of those who have refrained from cer-tain sports on grounds of sexual orientation and/or gender identity is slightly lower among lesbian/gay women (14%) and bisexual people (17%) and consi-derably higher among individuals with sexual orien-tations other than gay/lesbian/bisexual (29%). Stri-king differences can be found with regard to gender identity: more than half of trans people (54%) feel
Question: “Are there any sports which you are attracted to which you feel excluded from or which you stopped participating in as a result of your sexual orien-
tation / gender identity?” Single choice, figures in percent. Database: all.
13 In the questionnaire we used the wording “as a result of” and curtailed the complexity of social reality because of lack of space. Of course, the authors are aware that the reasons of feeling excluded are not sexual orientation/gender identity in of themselves, but the social reactions and societal constructions about them.
No one (Almost) Everyone
Figure 7: Openness in this sport contextQuestion: “To whom are you 'out' in this sport? “ Single choice, figures in percent. Database: Active in the last 12 months and organisational form of the sport other than “alone”.Single choice, figures in percent. Database: Active in the last 12 months and organisational form of the sport other than “alone”.
0 25 50 75 100
EU Total
EU Other
Scotland
Italy
Hungary
Germany
Austria 99
580
170
330
115
1454
2748
N
23.2 26.3 50.5
51.428.620.0
45.3 37.1
30.640.9
13.0 21.7
32.736.2
32.5 31.2
17.6
28.5
65.2
31.1
36.4
SomeQuestion: “To whom are you ‚out‘ in this sport? “ Single choice, figures in percent. Database: Active in the last 12 months and organisational form of the
sport other than “alone”.
Figure 7 : Openness in this sport context
Figure 8: Feeling excluded from particular sports
148
820
291
606
168
3300
5333
N
23.2
Figure 8: Feeling excluded from particular sportsQuestion: ”Are there any sports which you are attracted to which you feel excluded from or which you stopped participating in as a result of your sexual orientation/ gender identity?“Single Choice, figures in percent. Database: all.
0 25 50 75 100
EU Total
EU Other
Scotland
Italy
Hungary
Germany
Austria
Yes No
21.6
22.1
15.5
14.4
31.0
18.9
19.2
78.4
77.9
84.5
85.6
69.0
81.1
80.8
No one Some (Almost) Everyone
Yes No

The Relevance of Sexual Orientation and Gender Identity in Sport in Europe. Findings from the Outsport Survey.26
Sports participation and exclusion
excluded from particular sports or have at one point stopped participating in a particular sport or sports as a result of their gender identity. Trans men have the highest share (57%), followed by trans women (53%) and non-binary trans people (52%). Non-iden-tifying people (38%) also often feel excluded, where-as the shares are smaller for cisgender people (males: 19%, females: 10%).
Table 13 details the sports which respondents feel ex-cluded from or stopped participating in due to their sexual orientation and/or gender identity. The most
prominent sport is football/soccer, in which almost 28% feel excluded, followed by 17% from dancing and 16% from swimming .Two combat sports comple-te the top five sports from which most respondents feel excluded, with 14% from boxing and 11% from martial arts.
Tab 17: Sports activities which people are attracted to but feel excluded from
Football (soccer)
Dance
Swimming
Boxing
Martial Arts
Basketball
Ballet
Rugby
Fitness-cardio
American Football
Gymnastics
Volleyball
Weight Training
Yoga
Ice Hockey
Badminton
Baseball / Softball
Shooting
Motorsports
Skateboarding
Athletics (Track-and-field)
Handball
Ice Skating
Hockey
N
20.0
13.3
20.0
26.7
16.7
3.3
-
-
3.3
13.3
-
3.3
6.7
3.3
10.0
-
6.7
6.7
3.3
3.3
3.3
-
-
-
30
26.5
12.4
25.9
8.2
11.2
4.1
5.9
4.1
7.6
5.3
5.9
4.1
2.9
1.2
1.8
1.8
1.2
4.1
2.4
1.2
0.6
2.4
-
1.8
170
20.5
18.2
9.1
13.6
15.9
6.8
9.1
-
6.8
-
6.8
11.4
6.8
11.4
-
11.4
-
-
2.3
-
-
6.8
4.5
2.3
44
29.8
16.7
7.1
22.6
7.1
10.7
8.3
10.7
2.4
7.1
3.6
6.0
3.6
3.6
2.4
2.4
4.8
-
7.1
4.8
1.2
-
6.0
-
84
41.2
5.9
13.7
9.8
11.8
3.9
5.9
17.6
5.9
-
3.9
5.9
3.9
3.9
-
5.9
3.9
2.0
-
-
2.0
-
-
3.9
51
26.9
19.4
15.4
14.0
10.5
9.3
8.2
7.2
6.3
5.8
6.0
5.2
5.3
4.3
4.5
2.7
3.2
3.2
2.7
3.3
3.5
3.0
2.8
2.3
599
GERAUT H U N I T A S C O E U O t h e r
E U T o t a l
27.3
17.0
16.3
13.9
10.8
8.0
7.5
7.0
6.1
5.5
5.5
5.3
4.8
4.0
3.6
3.0
3.0
3.0
2.9
2.8
2.6
2.6
2.5
2.0
978
Question: “Which sports are you attracted to but feel excluded from?” Multiple choice, figures in percent (sports with over 2%). Database: Respondents
who are attracted to but feel excluded from specific sports.
Table 13 : Sports which people are attracted to but feel excluded from

The Relevance of Sexual Orientation and Gender Identity in Sport in Europe. Findings from the Outsport Survey. 27
Negative personal experiences and reasons for not participating in sports
6. NEGATIVE PERSONAL EXPERIENCES AND REASONS FOR NOT PARTICIPATING IN SPORTS
The following chapter concerns a central element of the survey, detailing key findings around negative experiences in a sports context. It is structured into three parts with each part referring to respondents’ status of sports participation, i.e. active in the last 12 months, previously active, or inactive except for physical education. Therefore, this chapter details a different sample subgroup in each case. The first sec-tion deals with those who have been active in sports during the last 12 months.
6.1 CURRENTLY ACTIVE IN SPORTS
Occurrence
One of the core survey questions concerns whether
respondents active in sports had any negative perso-nal experiences in the first and second sports which they identified as most important to them, during the past 12 months.14 In formulating the question, the following was emphasized:
- personal character of the negative experiences, - causal attribution to one’s own sexual orientation
and/or gender identity, - topicality (during the last 12 months), and - connection to the specific sports context that
was previously indicated in the questionnaire.
One out of six currently active respondents in our sample (16%) reports to have had negative personal experiences (figure 9).
Figure 9: Negative experiences in a sports context by country, sexual orientation and gender identity
14 If respondents practice more than one sport, or the same sport in different settings, every question that was related to the sports context was asked twice. Figure 9 refers to negative experiences in both contexts – for instance, if someone hasn’t had negative experiences in one sports context but in the other, that counts as a “yes”.
0
25
50
75
100
Figure 9: Negative personal experiences in sportQuestion: ”Looking back at the last 12 months, did you personally have any negative experiences in this specific sports context as a result of your sexual orientation /gender identity?“Single choice, figures in percent. Database: Active in the last 12 months.
0
25
50
75
100Gender identitySexual orientationCountry
female
transg
ende
r
not ide
ntified
as m
ale,
female
or tra
nsgen
der
non-bi
nary tra
nsgen
der
male tra
nsgen
der
male cis
gende
r
female
cisge
nder
other
lesbia
n
gay
bisex
ual
EU To
tal
EU Ot
her
Scotl
and
Italy
Hunga
ry
Germ
any
Austr
ia
No
Yes
15.3 16.2 12.9 11.9 19.7 16.4 15.7
87.2 85.9 85.1
76.7
89.4 86.7
70.464.2 63.1
53.8
12.8
84.383.680.3
88.187.183.884,7
14.1 14.9 23.3 10.6 13.3 29.6 35.8 36.9 46.2
Yes No
Question: “In the last 12 months, have you witneessed the use of any homophobic or transphobic language within the context of this specific sports activity?“

The Relevance of Sexual Orientation and Gender Identity in Sport in Europe. Findings from the Outsport Survey.28
Negative personal experiences and reasons for not participating in sports
- Verbal threats (threats of harm, being intimidated) - Physically ‘crossing the line’ (shoved, pushed; in-
appropriate touching; etc.) - Physical violence (kicked, punched, deliberately
injured; sexual assaults) - Discrimination (unfair treatment, exclusion, un-
equal opportunities, etc.) - E-bullying (harassment via social media, messen-
gers, webpages) - Other (Please specify….)
The next section focuses on respondents with nega-tive experiences in their most important sports acti-vity (n=403). Table 14 shows the different forms of these experiences in descending order and the per-centages displayed in the table represent the share of respondents who experienced the corresponding form at least once during the last 12 months.
Differences between gay men (14%), lesbian/gay wo-men (15%) and bisexual people (13%) are marginal (figure 10) in comparison to people with other sexual orientations. Almost a quarter of these people (23%) report to have had negative personal experiences.
While cisgender people report negative experiences in 12% of cases (females 11%, males 13%), more than a third (36%) of all non-cisgender people have had bad experiences in their sports – three times more than cisgender people. The subgroup of trans women (46%) displays the highest percentage of in-dividuals affected, followed by non-identifying peo-ple (37%), non-binary trans people (36%) and trans men (30%).
Forms and frequencies
To investigate the variety and forms of negative per-sonal experiences, respondents who had experienced at least one negative incident in the past 12 months were asked how often they experienced each of the following seven forms, from “never” (1) to ”very of-ten” (5):
- Verbal insults / slurs (ridiculing; name-calling; derogatory words like ‘dyke‘, ‘faggot‘, ‘poofter‘, etc.)
Tab 16: Sport participation
Active in the last 12 months
Previously active
Physical Education only
N
82.4
13.2
4.4
159
84.8
12.0
3.1
858
84.2
12.0
3.1
304
84.2
9.9
5.9
625
72.2
19.9
8.0
176
54.3
23.5
22.2
3402
A U T G E R H U N I T A S C O E U O t h e r
E U T o t a l
62.7
21.8
15.6
5524
Tab 17: Most important sports activities
Tab 16: Sport participation
Verbal insults, slurs
Discrimination
Verbal threats
E-bullying
Physically “crossing the line“
Physical violence
Other
N
85.7
64.3
21.4
28.6
14.3
14.3
14.3
14
80.9
71.3
40.4
36.2
31.9
21.3
14.9
94
90.5
61.9
52.4
42.9
42.9
19.0
4.8
21
80.8
76.9
11.5
15.4
15.4
3.8
11.5
26
70.6
64.7
52.9
35.3
41.2
17.6
29.4
17
82.3
79.7
49.4
45.5
40.7
22.1
9.5
231
A U T G E R H U N I T A S C O E U O t h e r
E U T o t a l
81.9
75.4
44.2
40.2
36.2
20.1
11.7
403
Tab 17: Most important sports activities
Fitness-cardio
Running
Swimming
Football (soccer)
Dance
Weight training
Martial Arts
Yoga
Volleyball
Walking
Badminton
Basketball
Climbing
Hiking
Bicycling
Tennis
Boxing
Gymnastics
Athletics
Equestrian sports
Rugby
Mountain biking
N
26.5
21.2
13.6
25.8
9.8
9.8
6.1
6.1
7.6
3.0
3.8
1.5
6.8
3.0
2.3
1.5
2.3
4.5
4.5
0.8
1.5
3.8
132
30.4
24.3
13.5
17.6
7.4
6.9
6.7
6.9
5.1
3.2
4.8
1.9
5.2
3.7
5.2
2.2
3.2
3.2
2.1
1.5
1.4
3.6
727
34.3
21.3
16.5
6.3
8.7
18.9
5.1
7.5
5.9
4.3
3.9
2.8
0.8
5.5
5.5
2.4
2.0
3.5
3.1
0.8
0.0
2.8
254
22.5
13.0
16.0
15.2
7.0
8.4
9.5
4.9
13.3
6.5
0.3
3.8
3.0
1.4
0.3
5.1
3.5
4.9
3.8
1.1
2.7
1.4
369
17.3
27.6
11.8
11.8
7.1
7.9
5.5
1.6
1.6
6.3
8.7
5.5
5.5
5.5
5.5
4.7
2.4
0.0
2.4
1.6
11.0
0.0
127
27.1
18.2
15.8
8.4
13.8
6.1
6.3
6.2
4.8
6.3
3.8
4.7
3.2
3.6
2.4
3.1
2.9
2.3
2.4
3.6
2.4
1.7
1847
GERAUT H U N I T A S C O E U O t h e r
E U T o t a l
27.5
19.6
15.2
11.7
11.0
7.7
6.6
6.1
5.8
5.4
3.8
3.8
3.6
3.6
3.1
3.1
2.9
2.8
2.6
2.5
2.3
2.1
3456
Question: “In the last 12 months, how often did you personally experience the following as a result of your sexual orientation /gender identity?” Scale from
1 “never” to 5 “very often”. Figures show percentage of respondents who checked response options 2 through 5. Database: Respondents who personally had
negative experiences in the last 12 months.
Table 14: Forms of negative experiences

The Relevance of Sexual Orientation and Gender Identity in Sport in Europe. Findings from the Outsport Survey. 29
Negative personal experiences and reasons for not participating in sports
There are two forms of negative experiences which are most prominent: verbal insults (82%) and struc-tural forms of discrimination (75%)(table 14). Apart from that verbal threats and instances of intimida-tion occur in 44% of the cases with negative expe-riences. Negative experiences of a physical nature are also relatively widespread; more than a third (36%) experienced physically ‘crossing the line’ and one fifth (20%) has been a victim of physical violence. Harassment via social media, messengers or webpa-ges (e-bullying) happens to 40%.
The spread and diversity of these forms of negative experiences facing LGBTI* people are remarkable (fi-gure 10). The percentage of gay men who experienced verbal insults at least once in the past year (90%) is higher in comparison to bisexual people (85%), les-bian/gay women (82%) and people with other sexual orientations (72%) in particular. Moreover, verbal threats are more frequently directed against gay men (53%) than lesbian/gay women (36%).
Figure 10: Forms of negative experiencesQuestion: „In the last 12 months, how often did you personally experience the following as a result of your sexual orientation /gender identity?“Scale from 1 “never” to 5 “very often”. Figures show percentage of respondents who checked response options 2 through 5. Database: Respondents who personally had negative experiences in the last 12 months.
20
60
100 Other
Physical violence
Physical ‘crossing the line’
E-bullying
Verbal threats
Verbal insults. slurs
Discrimination
Non-identifying
Male Cisgender
Female Cisgender
Trans (m, f, nb)
Other
Bisexual
Lesbian
Gay
40
80
Figure 22: Forms of negative experiencesQuestion: „In the last 12 months, how often did you personally experience the following as a result of your sexual orientation /gender identity?“Scale from 1 “never” to 5 “very often”. Figures show percentage of respondents who checked response options 2 through 5. Database: Respondents who personally had negative experiences in the last 12 months.
20
40
60
80
100 Other
Physical violence
Physical ‘crossing the line’
E-bullying
Verbal threats
Verbal insults. slurs
Discrimination
Non-identifying
Male Cisgender
Female Cisgender
Trans (m, f, nb)
Other
Bisexual
Lesbian
Gay
Figure 10: Forms of negative experiences in a sports context on grounds of sexual orientation and / or gender identity.
Tab 24: Perpetrator/ offenders (all forms in most important sports activities)
Other sports participants
Team members
Spectators
Opponent team member
Coaches
Other officials
Other
N
60.0
46.7
33.3
33.3
40.0
13.3
6.7
15
64.1
38.0
32.6
31.5
28.3
25.0
9.8
92
52.6
52.6
31.6
31.6
15.8
21.1
0.0
19
44.0
60.0
24.0
8.0
24.0
4.0
4.0
25
50.0
56.3
37.5
37.5
31.3
25.0
31.3
16
48.6
51.4
41.7
40.7
32.9
18.1
7.9
216
A U T G E R H U N I T A S C O E U O t h e r
E U T o t a l
52.7
48.8
37.3
35.5
30.5
19.1
8.6
383
Tab 25: Reasons for quiting
I did not have the time
I did not have friends to do sports with
I did not like competitive activities
A disability or illness prevented me from doing sport
It was too expensive
There were no suitable sports infrastructures close to where I live(d)
I felt uncomfortable due to my sexual orientation / gender identity
I have personally had negative experiences due to my sexual orientation / gender identity
I felt that the sport I practiced did not fit my gender
Don't know
Other
N
33.3
28.6
9.5
19.0
14.3
19.0
14.3
4.8
0.0
14.3
23.8
21
45.6
26.2
15.5
26.2
13.6
14.6
22.3
7.8
3.9
6.8
9.7
103
66.7
43.3
20.0
13.3
13.3
33.3
3.3
3.3
0.0
6.7
3.3
30
60.5
15.8
20.0
13.0
22.8
12.1
7.0
1.9
1.9
8.4
7.0
215
47.1
23.5
11.8
41.2
23.5
20.6
14.7
5.9
0.0
2.9
11.8
34
61.5
29.4
19.4
17.4
17.0
13.4
10.8
4.9
1.8
8.1
7.0
799
59.2
26.9
18.8
18.0
17.8
14.1
11.1
4.6
1.8
8.3
7.2
1202
A U T G E R H U N I T A S C O E U O t h e r
E U T o t a l
Sexual Orientation
Gay
Other*
Bisexual
Lesbian
Gender Identity
Trans (male, female, non-binary)
Male cisgender
Non-identifying
Female cisgender
TOTAL
M
6 . 8 3
6 . 6 4
6 . 3 8
5 . 4 3
7 . 3 0
6 . 8 0
6 . 2 7
5 . 4 2
6 . 3 5
( S D )
( 4 . 8 5 )
( 5 . 0 8 )
( 5 . 3 8 )
( 4 . 1 1 )
( 5 . 6 4 )
( 5 . 1 5 )
( 4 . 7 6 )
( 3 . 7 9 )
( 4 . 8 6 )
N
1 1 6
1 1 5
7 3
9 9
7 0
1 2 6
8 3
1 2 4
4 0 3
Tab 23: Frequency score of all negative experiences in most important sports activity
Question: “In the last 12 months, how often did you personally experience the following as a result of your sexual orientation /gender identity?” Scale from
1 “never” to 5 “very often”. Figures show the frequency score (mean and standard deviation) for all seven forms of negative incidents combined. Database:
Respondents who personally had negative experiences in the last 12 months.
Table 15: Frequency score of all negative experiences in most important sports activities

The Relevance of Sexual Orientation and Gender Identity in Sport in Europe. Findings from the Outsport Survey.30
Negative personal experiences and reasons for not participating in sports
Structural discrimination is more commonly expe-rienced by trans people (86%) than by cisgender women (72%) and cisgender men (71%). Trans and non-identifying people also indicate experiencing ‘other’ forms of negative incidents (19%) comparati-vely often, which are typically associated with mis-gendering or being looked at in an unpleasant or disdainful way (figure 10).
Considering the mean values that emerge from the five-point scale (1 “never” to 5 “very often) for each form, a frequency score was built in order to summa-te all forms of negative incidents with a single value with a possible range from 1 to 28 (table 15). Gay men show particularly higher scores than lesbian/gay women in particular and trans people show higher values than cisgender women.
Perpetrators
Besides the forms and frequencies of negative ex-periences, respondents were also asked about the perpetrators of negative incidents. They were asked for every form that occurred, “Who said or did this?” with the option to choose one or more options.
Table 16 shows the percentages for all seven forms of negative incidents combined. The percentages can be interpreted as the share of respondents who na-med the corresponding perpetrator at least once (in any of the occurring forms). The basis of the data consists of respondents who personally had negative experiences in the last 12 months and who named at
least one perpetrator (n=383). It should also be ta-ken into account that the type of perpetrator is also associated with the type of sport, the sport setting, and other variables – which cannot be further discus-sed in this report.
The perpetrators behind the negative incidents are most frequently other sport participants (53%) or members of respondents own team(s) (49%). 37% of respondents identify spectators and 36% members of opposition teams as perpetrators. Almost one third of the respondents report at least one negative in-cident caused by a coach (31%) and almost one out of five caused by other officials (19%).
Noticeable differences can be found between gay men on the one hand and lesbian/gay women and bisexual people on the other hand. While the latter group seems to have more problems with their own team members (lesbian/gay women: 57%, bisexual people: 61%; gay men: 43%, other: 40%), gay men (56%) and people with other sexual orientations (59%) are more frequently confronted with other sport participants as perpetrators (lesbian/gay wo-men: 47%, bisexual people: 44%).
Trans (35%) and non-identifying people (35%) seem to be confronted more frequently with coaches as perpetrators in comparison to cisgender women (27%) and cisgender men (28%).
Question: “Who said or did this?” Multiple choices, figures in percent. Database: Respondents who personally had negative experiences in the last 12 months
and named at least one perpetrator.
Tab 24: Perpetrator/ offenders (all forms in most important sports activities)
Other sports participants
Team members
Spectators
Opponent team member
Coaches
Other officials
Other
N
60.0
46.7
33.3
33.3
40.0
13.3
6.7
15
64.1
38.0
32.6
31.5
28.3
25.0
9.8
92
52.6
52.6
31.6
31.6
15.8
21.1
0.0
19
44.0
60.0
24.0
8.0
24.0
4.0
4.0
25
50.0
56.3
37.5
37.5
31.3
25.0
31.3
16
48.6
51.4
41.7
40.7
32.9
18.1
7.9
216
A U T G E R H U N I T A S C O E U O t h e r
E U T o t a l
52.7
48.8
37.3
35.5
30.5
19.1
8.6
383
Tab 25: Reasons for quiting
I did not have the time
I did not have friends to do sports with
I did not like competitive activities
A disability or illness prevented me from doing sport
It was too expensive
There were no suitable sports infrastructures close to where I live(d)
I felt uncomfortable due to my sexual orientation / gender identity
I have personally had negative experiences due to my sexual orientation / gender identity
I felt that the sport I practiced did not fit my gender
Don't know
Other
N
33.3
28.6
9.5
19.0
14.3
19.0
14.3
4.8
0.0
14.3
23.8
21
45.6
26.2
15.5
26.2
13.6
14.6
22.3
7.8
3.9
6.8
9.7
103
66.7
43.3
20.0
13.3
13.3
33.3
3.3
3.3
0.0
6.7
3.3
30
60.5
15.8
20.0
13.0
22.8
12.1
7.0
1.9
1.9
8.4
7.0
215
47.1
23.5
11.8
41.2
23.5
20.6
14.7
5.9
0.0
2.9
11.8
34
61.5
29.4
19.4
17.4
17.0
13.4
10.8
4.9
1.8
8.1
7.0
799
59.2
26.9
18.8
18.0
17.8
14.1
11.1
4.6
1.8
8.3
7.2
1202
A U T G E R H U N I T A S C O E U O t h e r
E U T o t a l
Sexual Orientation
Gay
Other*
Bisexual
Lesbian
Gender Identity
Trans (male, female, non-binary)
Male cisgender
Non-identifying
Female cisgender
TOTAL
M
6 . 8 3
6 . 6 4
6 . 3 8
5 . 4 3
7 . 3 0
6 . 8 0
6 . 2 7
5 . 4 2
6 . 3 5
( S D )
( 4 . 8 5 )
( 5 . 0 8 )
( 5 . 3 8 )
( 4 . 1 1 )
( 5 . 6 4 )
( 5 . 1 5 )
( 4 . 7 6 )
( 3 . 7 9 )
( 4 . 8 6 )
N
1 1 6
1 1 5
7 3
9 9
7 0
1 2 6
8 3
1 2 4
4 0 3
Tab 23: Frequency score of all negative experiences in most important sports activity
Table 16: Perpetrators / offenders (all forms in most important sports activity)

The Relevance of Sexual Orientation and Gender Identity in Sport in Europe. Findings from the Outsport Survey. 31
Negative personal experiences and reasons for not participating in sports
6.2 PREVIOUSLY ACTIVE IN SPORTS
As well as investigating the current situation of LGBTI* people inside the sport system, another concern of the survey was to investigate reasons for not participating in sports at the moment. 37.4% of our sample (n=2066) is currently not active in sports. 15.6% has never started to participate in sports (except for physical education at school) and some 21.8% have previously been active but stopped participating in sports for some reason. This chapter deals with respondents who ended their sports participation (previously active).
Reasons for quitting sports
The reasons for quitting sports are multifarious. Based on the eleven response options (within a multiple se-lection), the six main reasons for quitting sport are not related to sexual orientation or gender identity issues (table 17).
By far the most frequent answer is having insufficient time to participate in sporting activities (59%). The percentages of the remaining reasons are considerably fewer; the next reasons in order are not having enough friends to participate in those activities with (27%), having an aversion to competition (19%), having a de-bilitating disability or illness (18%), financial reasons (18%), or the lack of a suitable infrastructure (14%).
One out of ten respondents (11%) indicates feeling un-comfortable due to their sexual orientation or gender identity and one out of twenty (5%) has personally had negative experiences for the same reasons. 2% stopped the sport because they felt it did not fit their gender.
Gay men (14%) and people with other sexual orienta-tions (17%) quit their sports participation more fre-quently because they felt uncomfortable with their se-xual orientation compared to lesbian/gay women (9%) and bisexual (5%) people.
Regarding gender identity, one finding of tremendous importance is that almost every second trans person (45%) has stopped participating in sports because they felt uncomfortable due to their gender identity. In con-trast, this is indicated much less frequently by cisgender women (3%) and cisgender men (10%). Non-identify-ing people have stopped participating in sports for this reason in 24% of the cases. The share of respondents who stopped participating in sports as a result of ne-gative incidents related to their sexual orientation and/or gender identity is also highest among trans people (10%), followed by non-identifying people (8%) and cisgender people (cisgender men 5%, cisgender women 2%).“
Question: “Why did you stop doing sports?” Multiple choice, figures in valid percent. Database: Previously active in sports (but not in the last 12 months)
Tab 24: Perpetrator/ offenders (all forms in most important sports activities)
Other sports participants
Team members
Spectators
Opponent team member
Coaches
Other officials
Other
N
60.0
46.7
33.3
33.3
40.0
13.3
6.7
15
64.1
38.0
32.6
31.5
28.3
25.0
9.8
92
52.6
52.6
31.6
31.6
15.8
21.1
0.0
19
44.0
60.0
24.0
8.0
24.0
4.0
4.0
25
50.0
56.3
37.5
37.5
31.3
25.0
31.3
16
48.6
51.4
41.7
40.7
32.9
18.1
7.9
216
A U T G E R H U N I T A S C O E U O t h e r
E U T o t a l
52.7
48.8
37.3
35.5
30.5
19.1
8.6
383
Tab 25: Reasons for quiting
I did not have the time
I did not have friends to do sports with
I did not like competitive activities
A disability or illness prevented me from doing sport
It was too expensive
There were no suitable sports infrastructures close to where I live(d)
I felt uncomfortable due to my sexual orientation / gender identity
I have personally had negative experiences due to my sexual orientation / gender identity
I felt that the sport I practiced did not fit my gender
Don't know
Other
N
33.3
28.6
9.5
19.0
14.3
19.0
14.3
4.8
0.0
14.3
23.8
21
45.6
26.2
15.5
26.2
13.6
14.6
22.3
7.8
3.9
6.8
9.7
103
66.7
43.3
20.0
13.3
13.3
33.3
3.3
3.3
0.0
6.7
3.3
30
60.5
15.8
20.0
13.0
22.8
12.1
7.0
1.9
1.9
8.4
7.0
215
47.1
23.5
11.8
41.2
23.5
20.6
14.7
5.9
0.0
2.9
11.8
34
61.5
29.4
19.4
17.4
17.0
13.4
10.8
4.9
1.8
8.1
7.0
799
59.2
26.9
18.8
18.0
17.8
14.1
11.1
4.6
1.8
8.3
7.2
1202
A U T G E R H U N I T A S C O E U O t h e r
E U T o t a l
Sexual Orientation
Gay
Other*
Bisexual
Lesbian
Gender Identity
Trans (male, female, non-binary)
Male cisgender
Non-identifying
Female cisgender
TOTAL
M
6 . 8 3
6 . 6 4
6 . 3 8
5 . 4 3
7 . 3 0
6 . 8 0
6 . 2 7
5 . 4 2
6 . 3 5
( S D )
( 4 . 8 5 )
( 5 . 0 8 )
( 5 . 3 8 )
( 4 . 1 1 )
( 5 . 6 4 )
( 5 . 1 5 )
( 4 . 7 6 )
( 3 . 7 9 )
( 4 . 8 6 )
N
1 1 6
1 1 5
7 3
9 9
7 0
1 2 6
8 3
1 2 4
4 0 3
Tab 23: Frequency score of all negative experiences in most important sports activity
Table 17: Reasons for quitting sports
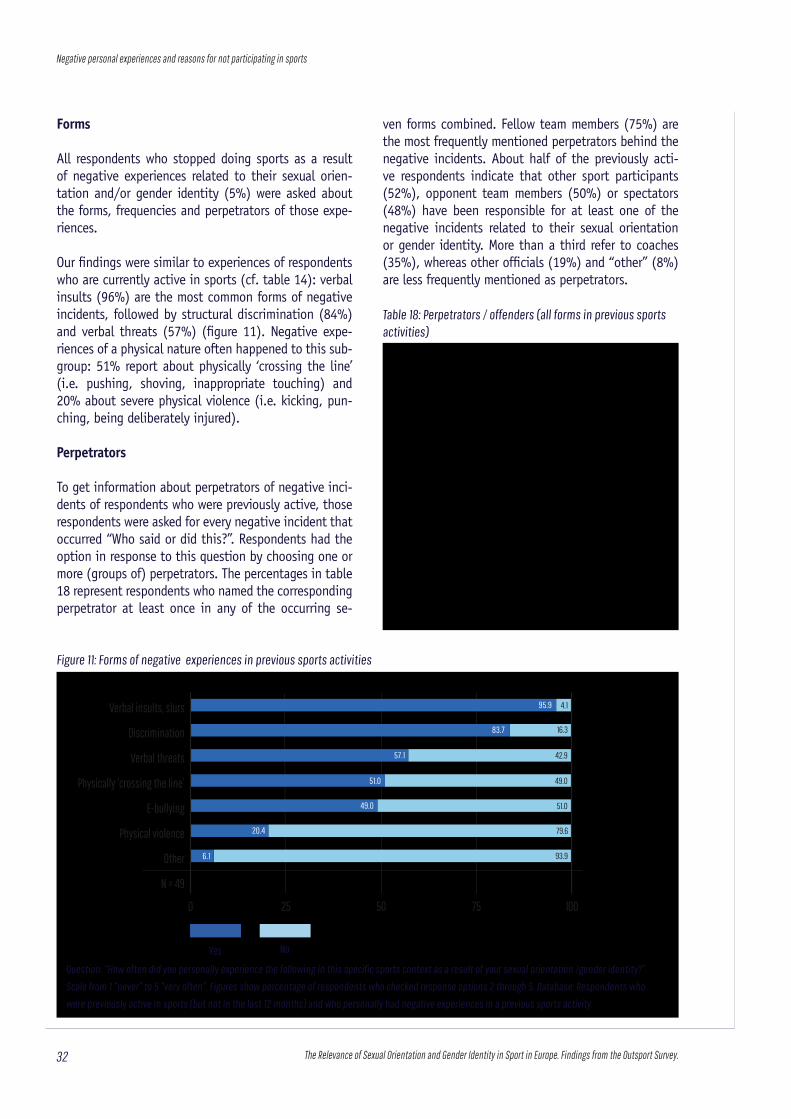
The Relevance of Sexual Orientation and Gender Identity in Sport in Europe. Findings from the Outsport Survey.32
Negative personal experiences and reasons for not participating in sports
Question: “How often did you personally experience the following in this specific sports context as a result of your sexual orientation /gender identity?”
Scale from 1 “never” to 5 “very often”. Figures show percentage of respondents who checked response options 2 through 5. Database: Respondents who
were previously active in sports (but not in the last 12 months) and who personally had negative experiences in a previous sports activity.
Forms
All respondents who stopped doing sports as a result of negative experiences related to their sexual orien-tation and/or gender identity (5%) were asked about the forms, frequencies and perpetrators of those expe-riences.
Our findings were similar to experiences of respondents who are currently active in sports (cf. table 14): verbal insults (96%) are the most common forms of negative incidents, followed by structural discrimination (84%) and verbal threats (57%) (figure 11). Negative expe-riences of a physical nature often happened to this sub-group: 51% report about physically ‘crossing the line’ (i.e. pushing, shoving, inappropriate touching) and 20% about severe physical violence (i.e. kicking, pun-ching, being deliberately injured).
Perpetrators
To get information about perpetrators of negative inci-dents of respondents who were previously active, those respondents were asked for every negative incident that occurred “Who said or did this?”. Respondents had the option in response to this question by choosing one or more (groups of) perpetrators. The percentages in table 18 represent respondents who named the corresponding perpetrator at least once in any of the occurring se-Figure 26: Forms of negative experiences in previous sports activities
Question: “How often did you personally experience the following in this specific sports contextas a result of your sexual orientation /gender identity?”Scale from 1 “never” to 5 “very often”. Figures show percentage of respondents who checked response options 2 through 5.
Database: Inactive respondents who personally had negative experiences in a previous sports activity.
0 25 50 75 100
N = 49
Other
Physical violence
E-bullying
Physically ‘crossing the line’
Verbal threats
Discrimination
Verbal insults, slurs 95.9 4.1
16.3
42.9
49.0
51.0
79.6
93.9
83.7
57.1
51.0
49.0
20.4
6.1
ven forms combined. Fellow team members (75%) are the most frequently mentioned perpetrators behind the negative incidents. About half of the previously acti-ve respondents indicate that other sport participants (52%), opponent team members (50%) or spectators (48%) have been responsible for at least one of the negative incidents related to their sexual orientation or gender identity. More than a third refer to coaches (35%), whereas other officials (19%) and “other” (8%) are less frequently mentioned as perpetrators.
Figure 11: Forms of negative experiences in previous sports activities
Question: “Who said or did this?” Multiple choices, figures in percent.
Database: Respondents who were previously active in sports (but not in
the last 12 months) and who personally had negative experiences in a
previous sports activity.
Tab 26: Forms of negative experiences in previous sports actvities
Verbal insults, slurs
Discrimination
Verbal threats
E-bullying
Physically “crossing the line“
Physical violence
Other
N
E U T o t a l
95.9
83.7
57.1
51.0
49.0
20.4
6.1
49
Tab 27: Perpetrators / offenders (all forms in previous sports activities)
Team members
Other sport participants
Opponent team members
Spectators
Coaches
Other officials
Other
N
E U T o t a l
75.0
52.1
50.0
47.9
35.4
18.8
8.3
49
Tab 28: reasons for not participating in sport aside from physical education
I did not like competitive activities
I did not have the time
I did not have friends to do sports with
I felt uncomfortable due to my sexual orientation / gender identity
There were no suitable sports infrastructures close to where I live(d)
It was too expensive
I have personally had negative experiences in physical education due to my sexual orientation / gender identity
I anticipated not to be accepted because of my sexual orientation / gender identity
A disability or illness prevented me from doing sport
Don't know
Other
N
/
/
/
/
/
/
/
/
/
/
/
7
25.9
37.0
25.9
29.6
7.4
11.1
11.1
18.5
3.7
18.5
22.2
27
22.2
50.0
38.9
11.1
16.7
11.1
16.7
16.7
5.6
11.1
16.7
18
32.5
17.5
17.5
17.5
12.5
20.0
5.0
12.5
0.0
15.0
15.0
40
57.1
21.4
42.9
42.9
7.1
7.1
28.6
35.7
14.3
0.0
14.3
14
39.9
34.9
34.1
18.3
16.9
15.2
11.6
9.0
10.5
16.8
8.9
744
38.9
34.2
33.4
18.9
16.4
15.3
11.6
10.0
9.6
16.5
9.9
850
A U T G E R H U N I T A S C O E U O t h e r
E U T o t a l
Table 18: Perpetrators / offenders (all forms in previous sports activities)
Yes No

The Relevance of Sexual Orientation and Gender Identity in Sport in Europe. Findings from the Outsport Survey. 33
Tab 26: Forms of negative experiences in previous sports actvities
Verbal insults, slurs
Discrimination
Verbal threats
E-bullying
Physically “crossing the line“
Physical violence
Other
N
E U T o t a l
95.9
83.7
57.1
51.0
49.0
20.4
6.1
49
Tab 27: Perpetrators / offenders (all forms in previous sports activities)
Team members
Other sport participants
Opponent team members
Spectators
Coaches
Other officials
Other
N
E U T o t a l
75.0
52.1
50.0
47.9
35.4
18.8
8.3
49
Tab 28: reasons for not participating in sport aside from physical education
I did not like competitive activities
I did not have the time
I did not have friends to do sports with
I felt uncomfortable due to my sexual orientation / gender identity
There were no suitable sports infrastructures close to where I live(d)
It was too expensive
I have personally had negative experiences in physical education due to my sexual orientation / gender identity
I anticipated not to be accepted because of my sexual orientation / gender identity
A disability or illness prevented me from doing sport
Don't know
Other
N
/
/
/
/
/
/
/
/
/
/
/
7
25.9
37.0
25.9
29.6
7.4
11.1
11.1
18.5
3.7
18.5
22.2
27
22.2
50.0
38.9
11.1
16.7
11.1
16.7
16.7
5.6
11.1
16.7
18
32.5
17.5
17.5
17.5
12.5
20.0
5.0
12.5
0.0
15.0
15.0
40
57.1
21.4
42.9
42.9
7.1
7.1
28.6
35.7
14.3
0.0
14.3
14
39.9
34.9
34.1
18.3
16.9
15.2
11.6
9.0
10.5
16.8
8.9
744
38.9
34.2
33.4
18.9
16.4
15.3
11.6
10.0
9.6
16.5
9.9
850
A U T G E R H U N I T A S C O E U O t h e r
E U T o t a l
6.3 INACTIVE SINCE PHYSICAL EDUCATION
The last subgroup consists of those who have never participated in any sport other than physical education at school (16%).
Reasons for never participating in sports apart from physical education
Providing the same eleven response options as before (and again allowing for multiple selections), most of the respondents either indicate that they dislike com-petitive activities (39%), do not have enough time to participate in sporting activities (34%) or a lack of friends to participate in sporting activities with (33%) as a reason for not participating in sports (table 19).15
Reasons for inactivity since physical education that are related to sexual orientation and gender identity are less frequently mentioned. 19% indicate as a reason for not having participated in sport aside from physi-cal education that they felt uncomfortable due to their sexual orientation or gender identity. 12% report nega-tive personal experiences on grounds of sexual orienta-tion and/or gender identity in physical education. One out of ten respondents has never participated in sport
because they anticipated a lack of acceptance because of their sexual orientation or gender identity.
Notable differences with regard to sexual orientation can be found between gay men and lesbian/gay wo-men: Gay men (25%) more frequently avoid partici-pating in sports because they feel uncomfortable due to their sexual orientation than lesbian/gay women (16%), they experienced more negative incidents in physical education (16%) than lesbian/gay women (7%) and they anticipated more frequently (15%) not to be accepted because of their sexual orientation than lesbian/gay women (8%).
Again, the share of respondents who have never parti-cipated in sport because of feeling uncomfortable with their gender identity and/or sexual orientation is hig-hest among trans people (62%) - which is clearly more than the share of cisgender women (5%), cisgender men (22%) or non-identifying people (30%). 23% of non-identifying people stay away from sport because they have had negative personal experiences in phy-sical education – more than cisgender women (4%), cisgender men (16%) and trans people (10%). 20% of trans people never took up sport because they antici-pated not being accepted.
Question: “Why have you never participated in sports apart from physical education?” Multiple choice, figures in valid percent. Database: Inactive since
physical education.
15 In order to avoid incorrect conclusions and misinterpretations, this report only display percentages and mean values which emerge from a column wise database of at least 10 cases, i.e. in this case data from Austria is not presented.
Table 19: Reasons for not participating in sport aside from physical education
Negative personal experiences and reasons for not participating in sports

The Relevance of Sexual Orientation and Gender Identity in Sport in Europe. Findings from the Outsport Survey.34
Negative personal experiences and reasons for not participating in sports
FormsRespondents who have never participated in sport as a result of their negative personal experiences in phy-sical education (n=99) were asked about the forms of those experiences. With regard to figure 12, it should be kept in mind that the results do not reflect the quantity and types of negative incidents in physical education as a whole, as not all participants were asked about their experiences in physical education. Neither do they reflect the quantity or types of negative inci-dents experienced in physical education by those who never participated in sport for other reasons.
The most common forms of negative personal expe-rience among this subgroup are verbal insults (92%) and structural discrimination (87%), with those two forms jointly being reported by around nine out of ten respondents. Negative experiences of a physical nature seem to happen much more frequently against this background: 76% of this subgroup have experienced incidents where perpetrators physically ‘crossing the line’ and half of the subgroup (52%) have experienced incidents where perpetrators inflicted physical violen-ce. Verbal threats (75%) and e-bullying (57%) are also relatively common.
Perpetrators
Table 20 displays the share of respondents from this subgroup who had at least one negative experience out of the above list. The negative experiences were pri-marily made with classmates (92%), teachers (47%), or other people (21%) in the context of physical edu-cation.
Question: “Who said or did this?” Multiple choices, figures in percent.
Database: Respondents who were previously active in sports (but not in
the last 12 months) and who personally had negative experiences in a
previous sports activity.
Tab 30: Perpetrators / offenders (all forms in physical education)
Classmates
Teacher
Other
N
E U T o t a l
91.6
47.4
21.1
96
Tab 32: Reasons for not reporting
I doubted that effective intervention would occur
I perceived the harassment to be a minor problem
I feared making the situation worse
I was concerned about the staff members` reactions
Other reason(s)
N
38.6
42.9
21.4
5.7
15.7
70
38.0
40.2
21.4
9.6
18.3
234
36.1
52.5
23.0
9.8
8.2
62
54.2
28.0
20.6
7.5
16.8
107
55.0
32.5
25.0
12.5
20.0
40
50.0
31.6
39.2
20.2
11.7
336
A U T G E R H U N I T A S C O E U O t h e r
E U T o t a l
45.5
36.0
28.6
13.3
14.7
849
Tab 31: Reactions to discrimination
I did not react
I left the situation
I confronted the individual(s)
It motivated me to perform better
I officially reported it (telling it to the coach. to officials. etc)
I changed my behavior
I changed the sporting environment
Other
N
61.3
30.7
30.7
10.7
4.0
1.3
1.3
6.7
75
56.2
23.9
29.1
8.8
7.6
3.2
4.4
7.2
257
74.2
22.7
15.2
16.7
3.0
1.5
3.0
3.0
67
27.6
43.1
29.3
17.1
8.1
6.5
4.1
5.7
123
54.5
22.7
18.2
22.7
9.1
4.5
9.1
4.5
44
55.2
36.0
21.9
15.7
10.4
7.7
6.4
8.0
379
53.6
31.7
24.8
14.0
8.2
5.2
5.0
6.9
945
A U T G E R H U N I T A S C O EU Other
EU Total
Table 20: Perpetrators / offenders (all forms in physical education)
Figure 29: Forms of negative experiences in physical educationQuestion: “How often did you personally experience the following in physical educationas a result of your sexual orientation /gender identity?”Scale from 1 “never” to 5 “very often”. Figures show percentage of respondents who checked response options 2 through 5.
Database: Inactive since physical education and personally had negative experiences in physical education.
0 25 50 75 100
N = 96
Other
Physical violence
E-bullying
Verbal threats
Physically ‘crossing the line’
Discrimination
Verbal insults. slurs84.7
87.1
88.1
80.3
83.8
83.6
84.3
91.7
86.5
76.0
75.0
57.3
52.1
8.3
8.3
13.5
24.0
25.0
42.7
47.9
91.7
Question: “How often did you personally experience the following in physical education as a result of your sexual orientation /gender identity?” Scale from 1
“never” to 5 “very often”. Figures show percentage of respondents who checked response options 2 through 5. Database: Inactive since physical education
and personally had negative experiences in physical education.
Figure 12: Forms of negative experiences in physical education
Yes No

The Relevance of Sexual Orientation and Gender Identity in Sport in Europe. Findings from the Outsport Survey. 35
Reactions to negative experiences
This chapter concerns reactions of respondents to the negative experiences that they have experien-ced in sports and their awareness and usage of help points, organisations and/or individuals concerned with matters of discrimination. Since not every re-spondent has had negative experiences related to their sexual orientation and/or gender identity in sport, this section focuses on those who reported a specific negative incident, irrespective of the time of occurrence.
Since reactions to diverse forms of harassment and discrimination can be different from case to case, respondents were asked to think about one particular negative incident in a sports context that they re-member and to complete the subsequent questions with regard to that experience. Respondents to this question identify the following forms of negative in-cident, in order of popularity: verbal insults (69%), structural discrimination (14%), e-bullying (3%), physically ‘crossing the line’ (3%), verbal threats (2%), physical violence (1%) and other forms (10%). The types of reactions listed are not exclusive re-actions, however, most of the respondents name one reaction only (table 21).
7. REACTIONS TO NEGATIVE EXPERIENCES
Most of the respondents indicate they did not react in the incidents in focus. Almost one third (32%) left the situation and 5% changed their chosen spor-ting environment. One out of four (25%) respondents confronted the perpetrator directly, whereas 8% offi-cially reported the incident, i.e. telling the coach or other officials about it. Some respondents indicate that this incident motivated them to perform better (14%) and others changed their behaviour as a result of the incident (5%).
Officially reporting incidents is slightly more com-mon among gay men (13%) than lesbian/gay women (5%), bisexual people (6%) or people with other se-xual orientations (9%). Regarding gender identity, the same is true for trans people (12%) in compa-rison to cisgender women (6%) and non-identifying people (8%).
Tab 30: Perpetrators / offenders (all forms in physical education)
Classmates
Teacher
Other
N
E U T o t a l
91.6
47.4
21.1
96
Tab 32: Reasons for not reporting
I doubted that effective intervention would occur
I perceived the harassment to be a minor problem
I feared making the situation worse
I was concerned about the staff members` reactions
Other reason(s)
N
38.6
42.9
21.4
5.7
15.7
70
38.0
40.2
21.4
9.6
18.3
234
36.1
52.5
23.0
9.8
8.2
62
54.2
28.0
20.6
7.5
16.8
107
55.0
32.5
25.0
12.5
20.0
40
50.0
31.6
39.2
20.2
11.7
336
A U T G E R H U N I T A S C O E U O t h e r
E U T o t a l
45.5
36.0
28.6
13.3
14.7
849
Tab 31: Reactions to discrimination
I did not react
I left the situation
I confronted the individual(s)
It motivated me to perform better
I officially reported it (telling it to the coach. to officials. etc)
I changed my behavior
I changed the sporting environment
Other
N
61.3
30.7
30.7
10.7
4.0
1.3
1.3
6.7
75
56.2
23.9
29.1
8.8
7.6
3.2
4.4
7.2
257
74.2
22.7
15.2
16.7
3.0
1.5
3.0
3.0
67
27.6
43.1
29.3
17.1
8.1
6.5
4.1
5.7
123
54.5
22.7
18.2
22.7
9.1
4.5
9.1
4.5
44
55.2
36.0
21.9
15.7
10.4
7.7
6.4
8.0
379
53.6
31.7
24.8
14.0
8.2
5.2
5.0
6.9
945
A U T G E R H U N I T A S C O EU Other
EU Total
Question: “What was (were) your reaction(s) in this particular case?” Multiple choice, figures in percent. Database: Respondents who reported discrimination
experiences.
Table 21: Reactions to discrimination

36 The Relevance of Sexual Orientation and Gender Identity in Sport in Europe. Findings from the Outsport Survey.
There are various reasons why only a small proportion of 8% officially reported their incidents and a majo-rity of 92% did not report it (table 22). Almost half of those who refrain from reporting (46%) doubted that an effective intervention would occur, 36% did not report it because they perceived the incident to be a minor problem, 29% feared that reporting would make the situation worse or and 13% were concerned about the reactions of staff members.
Choosing not to report an incident because it was perceived to be a minor problem is less frequently indicated by respondents with another sexual orien-tation (26%) compared to gay men (39%), lesbian/gay women (40%) and bisexual people (36%). The same is true for trans people (26%) in comparison to cisgender people (38%). Trans people are also more frequently concerned about staff members’ reactions (21%).
In order to find out how aware people are of whom to turn to in cases of an incident of harassment, re-spondents were asked (a) if they know of any organi-sations or individuals that they can get in touch with if they experience such an incident in sport (table 23) and (b) if they have ever contacted any of those organisations or individuals in cases of experiencing such an incident (table 24).
Tab 33: Awareness of organisations or individuals to contact
Non-governmental organisation (outside the sport system)
Local sport organisation
Regional / national sport association
Governmental organisation (outside sport system)
Other
None of the above mentioned
N
38.9
9.7
12.5
9.7
4.2
40.3
72
31.6
20.1
11.5
11.1
3.7
47.1
244
52.4
14.3
1.6
4.8
6.3
28.6
63
31.1
10.7
14.8
11.5
7.4
37.7
122
27.3
29.5
34.1
22.7
9.1
27.3
44
35.5
18.7
13.7
11.7
5.9
34.4
358
34.9
17.5
13.3
11.4
5.5
38.0
903
A U T G E R H U N I T A S C O E U O t h e r
E U T o t a l
Tab 34: Contact to organisations or individuals
Non-governmental organisation (outside the sport system)
Local sport organisation
Regional / national sport association
Governmental organisation (outside sport system)
Other
None of the above mentioned
N
5.6
1.4
0.0
4.2
2.8
88.9
72
9.0
1.6
1.2
0.4
2.0
86.9
244
11.1
0.0
0.0
0.0
1.6
87.3
63
9.0
2.5
2.5
3.3
4.1
79.5
122
4.5
2.3
15.9
4.5
4.5
72.7
44
10.3
3.6
4.5
1.7
3.4
78.5
358
9.2
2.9
2.8
1.8
3.0
82.1
903
A U T G E R H U N I T A S C O E U O t h e r
E U T o t a l
Tab 17: Most important sports activities
Fitness-cardio
Running
Swimming
Football (soccer)
Dance
Weight training
Martial Arts
Yoga
Volleyball
Walking
Badminton
Basketball
Climbing
Hiking
Bicycling
Tennis
Boxing
Gymnastics
Athletics
Equestrian sports
Rugby
Mountain biking
N
26.5
21.2
13.6
25.8
9.8
9.8
6.1
6.1
7.6
3.0
3.8
1.5
6.8
3.0
2.3
1.5
2.3
4.5
4.5
0.8
1.5
3.8
132
30.4
24.3
13.5
17.6
7.4
6.9
6.7
6.9
5.1
3.2
4.8
1.9
5.2
3.7
5.2
2.2
3.2
3.2
2.1
1.5
1.4
3.6
727
34.3
21.3
16.5
6.3
8.7
18.9
5.1
7.5
5.9
4.3
3.9
2.8
0.8
5.5
5.5
2.4
2.0
3.5
3.1
0.8
0.0
2.8
254
22.5
13.0
16.0
15.2
7.0
8.4
9.5
4.9
13.3
6.5
0.3
3.8
3.0
1.4
0.3
5.1
3.5
4.9
3.8
1.1
2.7
1.4
369
17.3
27.6
11.8
11.8
7.1
7.9
5.5
1.6
1.6
6.3
8.7
5.5
5.5
5.5
5.5
4.7
2.4
0.0
2.4
1.6
11.0
0.0
127
27.1
18.2
15.8
8.4
13.8
6.1
6.3
6.2
4.8
6.3
3.8
4.7
3.2
3.6
2.4
3.1
2.9
2.3
2.4
3.6
2.4
1.7
1847
GERAUT H U N I T A S C O E U O t h e r
E U T o t a l
27.5
19.6
15.2
11.7
11.0
7.7
6.6
6.1
5.8
5.4
3.8
3.8
3.6
3.6
3.1
3.1
2.9
2.8
2.6
2.5
2.3
2.1
3456
Question: “Please tell us if you (a) know of any organisations or individuals that you can get in touch with if you experience discrimination or harassment in sport
and (b) have ever contacted any of those organisations or individuals.” Multiple choice, figures in percent. Database: Respondents who reported discrimination
experiences.
Table 23: Awareness of organisations or individuals to contact
Reactions to negative experiences
Tab 30: Perpetrators / offenders (all forms in physical education)
Classmates
Teacher
Other
N
E U T o t a l
91.6
47.4
21.1
96
Tab 32: Reasons for not reporting
I doubted that effective intervention would occur
I perceived the harassment to be a minor problem
I feared making the situation worse
I was concerned about the staff members` reactions
Other reason(s)
N
38.6
42.9
21.4
5.7
15.7
70
38.0
40.2
21.4
9.6
18.3
234
36.1
52.5
23.0
9.8
8.2
62
54.2
28.0
20.6
7.5
16.8
107
55.0
32.5
25.0
12.5
20.0
40
50.0
31.6
39.2
20.2
11.7
336
A U T G E R H U N I T A S C O E U O t h e r
E U T o t a l
45.5
36.0
28.6
13.3
14.7
849
Tab 31: Reactions to discrimination
I did not react
I left the situation
I confronted the individual(s)
It motivated me to perform better
I officially reported it (telling it to the coach. to officials. etc)
I changed my behavior
I changed the sporting environment
Other
N
61.3
30.7
30.7
10.7
4.0
1.3
1.3
6.7
75
56.2
23.9
29.1
8.8
7.6
3.2
4.4
7.2
257
74.2
22.7
15.2
16.7
3.0
1.5
3.0
3.0
67
27.6
43.1
29.3
17.1
8.1
6.5
4.1
5.7
123
54.5
22.7
18.2
22.7
9.1
4.5
9.1
4.5
44
55.2
36.0
21.9
15.7
10.4
7.7
6.4
8.0
379
53.6
31.7
24.8
14.0
8.2
5.2
5.0
6.9
945
A U T G E R H U N I T A S C O EU Other
EU Total
Question: “Why did you not report it?” Multiple choice, figures in percent. Database: Respondents who reported discrimination experiences and did not report it.
Table 22: Reasons for not reporting

37The Relevance of Sexual Orientation and Gender Identity in Sport in Europe. Findings from the Outsport Survey.
One out of three respondents (35%) indicates that they are aware of non-governmental organisati-ons outside of organized sport (table 23) who they could get in touch with and further 11% are aware of governmental organisations outside of organized sport. In contrast, far less indicate awareness of or-ganisations inside of organized sport, i.e. local sport organisations (18%) or umbrella sport organisations on a regional or national level (13%). In total, the relative majority of 38% either do not know or are not aware of any of the response options (classified as “none of the above mentioned”).
When it comes to contacting organisations or indivi-duals, 82% did not contact any of the aforementio-ned organisations or individuals (table 24). The most frequently mentioned organisations are non-govern-mental organisations outside of the sport system, at 9%.
Tab 33: Awareness of organisations or individuals to contact
Non-governmental organisation (outside the sport system)
Local sport organisation
Regional / national sport association
Governmental organisation (outside sport system)
Other
None of the above mentioned
N
38.9
9.7
12.5
9.7
4.2
40.3
72
31.6
20.1
11.5
11.1
3.7
47.1
244
52.4
14.3
1.6
4.8
6.3
28.6
63
31.1
10.7
14.8
11.5
7.4
37.7
122
27.3
29.5
34.1
22.7
9.1
27.3
44
35.5
18.7
13.7
11.7
5.9
34.4
358
34.9
17.5
13.3
11.4
5.5
38.0
903
A U T G E R H U N I T A S C O E U O t h e r
E U T o t a l
Tab 34: Contact to organisations or individuals
Non-governmental organisation (outside the sport system)
Local sport organisation
Regional / national sport association
Governmental organisation (outside sport system)
Other
None of the above mentioned
N
5.6
1.4
0.0
4.2
2.8
88.9
72
9.0
1.6
1.2
0.4
2.0
86.9
244
11.1
0.0
0.0
0.0
1.6
87.3
63
9.0
2.5
2.5
3.3
4.1
79.5
122
4.5
2.3
15.9
4.5
4.5
72.7
44
10.3
3.6
4.5
1.7
3.4
78.5
358
9.2
2.9
2.8
1.8
3.0
82.1
903
A U T G E R H U N I T A S C O E U O t h e r
E U T o t a l
Tab 17: Most important sports activities
Fitness-cardio
Running
Swimming
Football (soccer)
Dance
Weight training
Martial Arts
Yoga
Volleyball
Walking
Badminton
Basketball
Climbing
Hiking
Bicycling
Tennis
Boxing
Gymnastics
Athletics
Equestrian sports
Rugby
Mountain biking
N
26.5
21.2
13.6
25.8
9.8
9.8
6.1
6.1
7.6
3.0
3.8
1.5
6.8
3.0
2.3
1.5
2.3
4.5
4.5
0.8
1.5
3.8
132
30.4
24.3
13.5
17.6
7.4
6.9
6.7
6.9
5.1
3.2
4.8
1.9
5.2
3.7
5.2
2.2
3.2
3.2
2.1
1.5
1.4
3.6
727
34.3
21.3
16.5
6.3
8.7
18.9
5.1
7.5
5.9
4.3
3.9
2.8
0.8
5.5
5.5
2.4
2.0
3.5
3.1
0.8
0.0
2.8
254
22.5
13.0
16.0
15.2
7.0
8.4
9.5
4.9
13.3
6.5
0.3
3.8
3.0
1.4
0.3
5.1
3.5
4.9
3.8
1.1
2.7
1.4
369
17.3
27.6
11.8
11.8
7.1
7.9
5.5
1.6
1.6
6.3
8.7
5.5
5.5
5.5
5.5
4.7
2.4
0.0
2.4
1.6
11.0
0.0
127
27.1
18.2
15.8
8.4
13.8
6.1
6.3
6.2
4.8
6.3
3.8
4.7
3.2
3.6
2.4
3.1
2.9
2.3
2.4
3.6
2.4
1.7
1847
GERAUT H U N I T A S C O E U O t h e r
E U T o t a l
27.5
19.6
15.2
11.7
11.0
7.7
6.6
6.1
5.8
5.4
3.8
3.8
3.6
3.6
3.1
3.1
2.9
2.8
2.6
2.5
2.3
2.1
3456
Question: “Please tell us if you (a) know of any organisations or individuals that you can get in touch with if you experience discrimination or harassment
in sport, and (b) have ever contacted any of those organisations or individuals.” Multiple choice, figures in percent. Database: Respondents who reported
discrimination experiences.
Table 24: Contact to organisations or individual
Reactions to negative experiences


Bisexual A person emotionally, physically, and/or sexually at-tracted to more than one gender. This attraction does not have to be equally split between genders and there may be a preference for one gender over others.
Cisgender describes someone who identifies with the gender identity and gender expression expectations assigned to them at birth.
Gay Term used in some cultural settings to represent men who are attracted to other men in a romantic, sexual and/or emotional sense. Not all men who engage in “homosexual behaviour” identify as gay, and as such this label should be used with caution. This term is often also used to refer to the LGBTQI community as a whole, or as an individual identity label for anyone who does not identify as heterosexual.
Gender binary The false notion that there are only two genders – male/female or man/woman and that a person must be strictly gendered as either/or.
Gender identity A person’s internal sense of being male, female, transgender or something else.
Homophobia Prejudice, aversion and discrimination based on ir-rational fear against those who are or are perceived to be homosexual people, homosexuality, or any be-havior or belief that does not conform to rigid sex role stereotypes. It is this fear that often reinforces sexism as well as heterosexism. In this report, the term “homophobia” is used as a catch-all term for homophobia, biphobia and other forms of prejudice on grounds of sexual orientation.
16 ILGA Europe (2019, March 3). Intersex. Retrieved from https://www.ilga-europe.org/what-we-do/our-advocacy-work/trans-and-intersex/intersex
Homosexual A person primarily emotionally, physically, and/or se-xually attracted to members of the same sex.
Intersex “Intersex people are born with physical, hormonal or genetic features that are neither wholly female nor wholly male; or a combination of female and male; or neither female nor male. Many forms of intersex exist; it is a spectrum or umbrella term, rather than a single category.”16
Lesbian Term used to describe female-identified people at-tracted romantically, sexually, and/or emotionally to other female-identified people. The term lesbian is derived from the name of the Greek island of Les-bos and, as such, is sometimes considered a Euro-centric category that does not necessarily represent the identities of those of African descent and other non-European ethnic groups. That being said, indi-vidual female-identified people from diverse ethnic groups, including African-Americans, often embrace the term ‘lesbian’ as an identity label.
Transphobia Prejudice, aversion and discrimination based on irra-tional fear against those who have a gender identity that does not correspond to the sex that was assig-ned at birth. In this report, the term “transphobia” is used as a catch-all term for transphobia, interpho-bia and other forms of prejudice and aversion on grounds of gender identity.
GLOSSARY
Glossary
39The Relevance of Sexual Orientation and Gender Identity in Sport in Europe. Findings from the Outsport Survey.

www.out-sport.eu