Platts Biofuels Conference, Geneva, April 13 2016 Biofuels Conference, Geneva, April 13th 2016 Dr...
22
© 2016 LMC International. All rights reserved. www.lmc.co.uk Platts Biofuels Conference, Geneva, April 13 th 2016 Dr Caroline Midgley
Transcript of Platts Biofuels Conference, Geneva, April 13 2016 Biofuels Conference, Geneva, April 13th 2016 Dr...
© 2016 LMC International. All rights reserved. www.lmc.co.uk
Platts Biofuels Conference, Geneva, April 13th 2016 Dr Caroline Midgley

Table of Contents:
The RED amendments
The German GHG mandate
The Outlook for EU Biofuels
Conclusions
The 2015 amendments to the RED
© 2016 LMC International. All rights reserved. March 2016
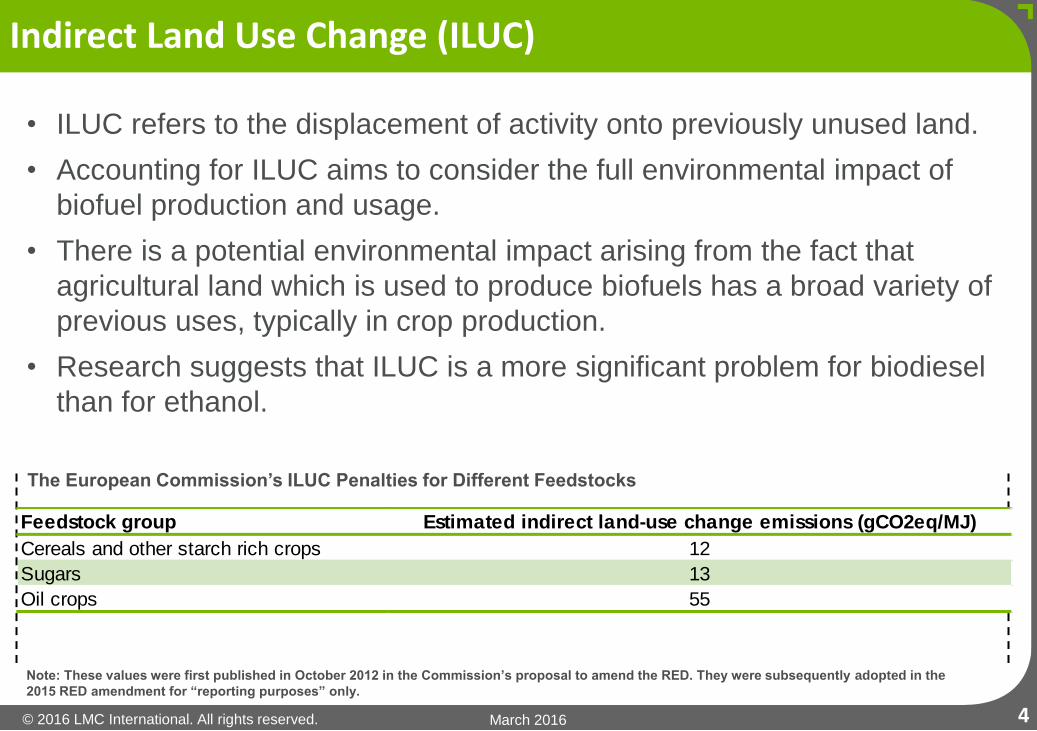
Indirect Land Use Change (ILUC)
Note: These values were first published in October 2012 in the Commission’s proposal to amend the RED. They were subsequently adopted in the
2015 RED amendment for “reporting purposes” only.
• ILUC refers to the displacement of activity onto previously unused land.
• Accounting for ILUC aims to consider the full environmental impact of
biofuel production and usage.
• There is a potential environmental impact arising from the fact that
agricultural land which is used to produce biofuels has a broad variety of
previous uses, typically in crop production.
• Research suggests that ILUC is a more significant problem for biodiesel
than for ethanol.
The European Commission’s ILUC Penalties for Different Feedstocks
4
Feedstock group Estimated indirect land-use change emissions (gCO2eq/MJ)
Cereals and other starch rich crops 12
Sugars 13
Oil crops 55
© 2016 LMC International. All rights reserved. March 2016
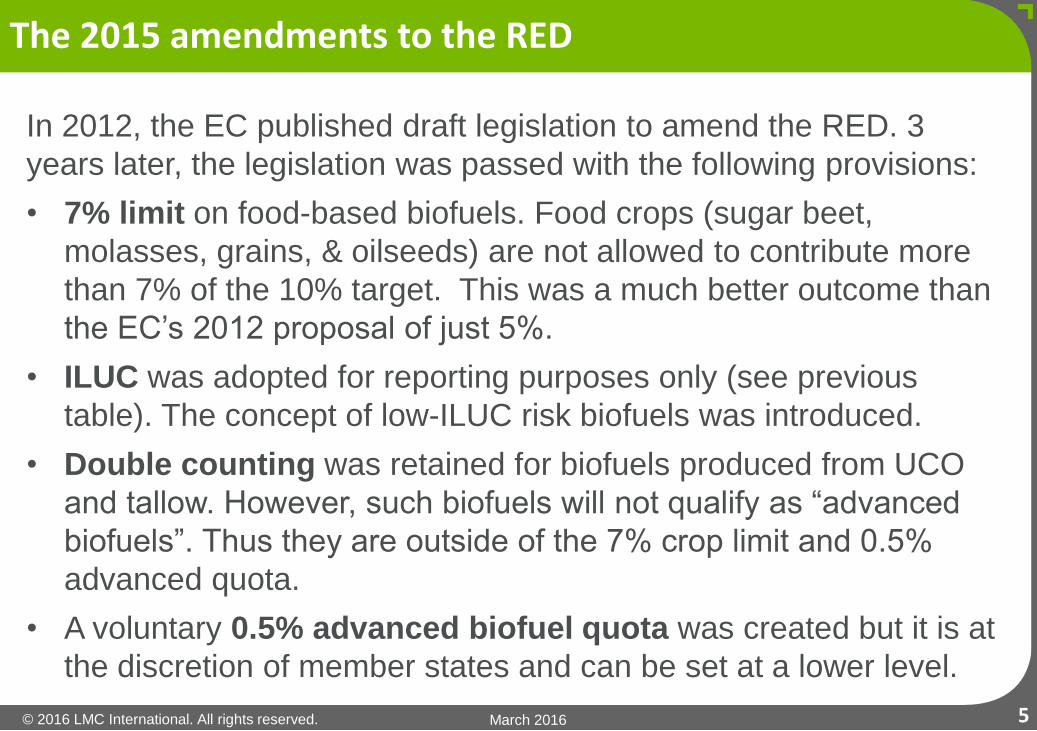
In 2012, the EC published draft legislation to amend the RED. 3
years later, the legislation was passed with the following provisions:
• 7% limit on food-based biofuels. Food crops (sugar beet,
molasses, grains, & oilseeds) are not allowed to contribute more
than 7% of the 10% target. This was a much better outcome than
the EC’s 2012 proposal of just 5%.
• ILUC was adopted for reporting purposes only (see previous
table). The concept of low-ILUC risk biofuels was introduced.
• Double counting was retained for biofuels produced from UCO
and tallow. However, such biofuels will not qualify as “advanced
biofuels”. Thus they are outside of the 7% crop limit and 0.5%
advanced quota.
• A voluntary 0.5% advanced biofuel quota was created but it is at
the discretion of member states and can be set at a lower level.
The 2015 amendments to the RED
5
© 2016 LMC International. All rights reserved. March 2016
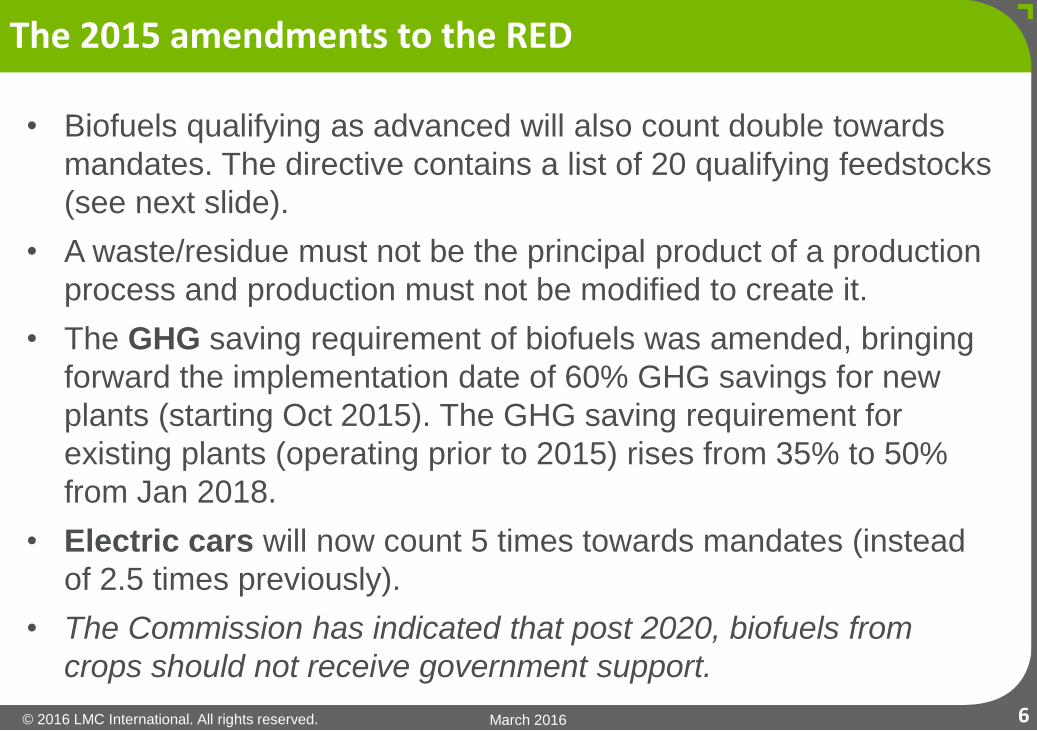
• Biofuels qualifying as advanced will also count double towards
mandates. The directive contains a list of 20 qualifying feedstocks
(see next slide).
• A waste/residue must not be the principal product of a production
process and production must not be modified to create it.
• The GHG saving requirement of biofuels was amended, bringing
forward the implementation date of 60% GHG savings for new
plants (starting Oct 2015). The GHG saving requirement for
existing plants (operating prior to 2015) rises from 35% to 50%
from Jan 2018.
• Electric cars will now count 5 times towards mandates (instead
of 2.5 times previously).
• The Commission has indicated that post 2020, biofuels from
crops should not receive government support.
The 2015 amendments to the RED
6
© 2016 LMC International. All rights reserved. March 2016
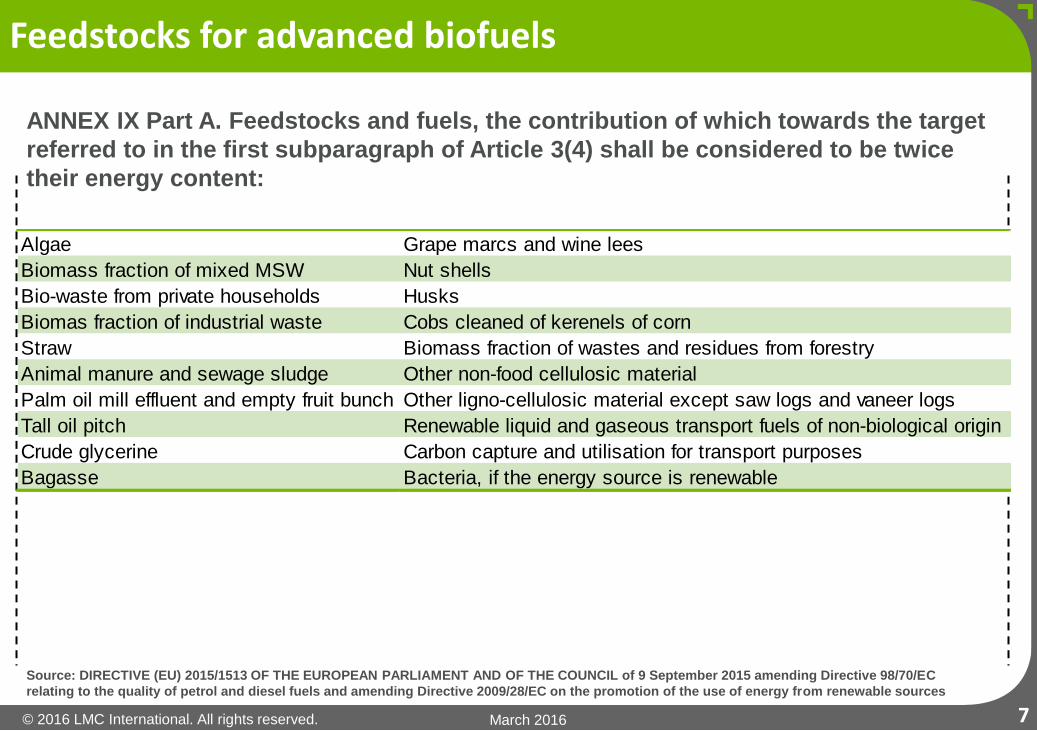
Feedstocks for advanced biofuels
ANNEX IX Part A. Feedstocks and fuels, the contribution of which towards the target
referred to in the first subparagraph of Article 3(4) shall be considered to be twice
their energy content:
Source: DIRECTIVE (EU) 2015/1513 OF THE EUROPEAN PARLIAMENT AND OF THE COUNCIL of 9 September 2015 amending Directive 98/70/EC
relating to the quality of petrol and diesel fuels and amending Directive 2009/28/EC on the promotion of the use of energy from renewable sources
7
Algae Grape marcs and wine lees
Biomass fraction of mixed MSW Nut shells
Bio-waste from private households Husks
Biomas fraction of industrial waste Cobs cleaned of kerenels of corn
Straw Biomass fraction of wastes and residues from forestry
Animal manure and sewage sludge Other non-food cellulosic material
Palm oil mill effluent and empty fruit bunch Other ligno-cellulosic material except saw logs and vaneer logs
Tall oil pitch Renewable liquid and gaseous transport fuels of non-biological origin
Crude glycerine Carbon capture and utilisation for transport purposes
Bagasse Bacteria, if the energy source is renewable
© 2016 LMC International. All rights reserved. March 2016
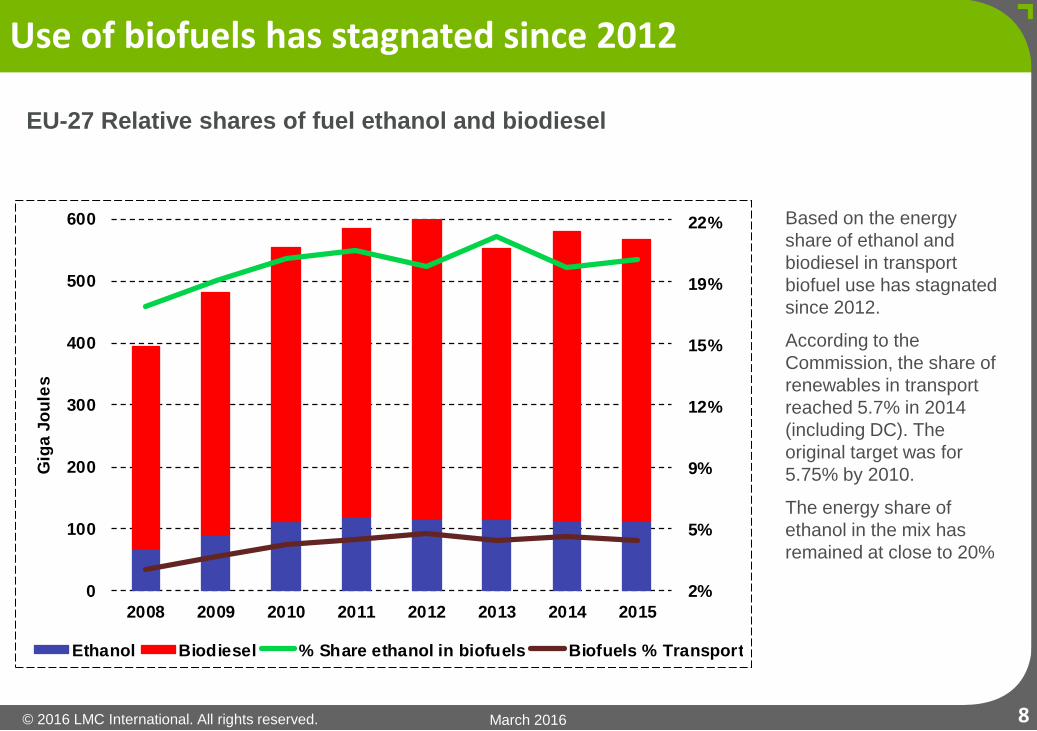
Based on the energy
share of ethanol and
biodiesel in transport
biofuel use has stagnated
since 2012.
According to the
Commission, the share of
renewables in transport
reached 5.7% in 2014
(including DC). The
original target was for
5.75% by 2010.
The energy share of
ethanol in the mix has
remained at close to 20%
Use of biofuels has stagnated since 2012
EU-27 Relative shares of fuel ethanol and biodiesel
8
2%
5%
9%
12%
15%
19%
22%
0
100
200
300
400
500
600
2008 2009 2010 2011 2012 2013 2014 2015
Gig
a J
ou
les
Ethanol Biodiesel % Share ethanol in biofuels Biofuels % Transport
The German GHG mandate
© 2016 LMC International. All rights reserved. March 2016
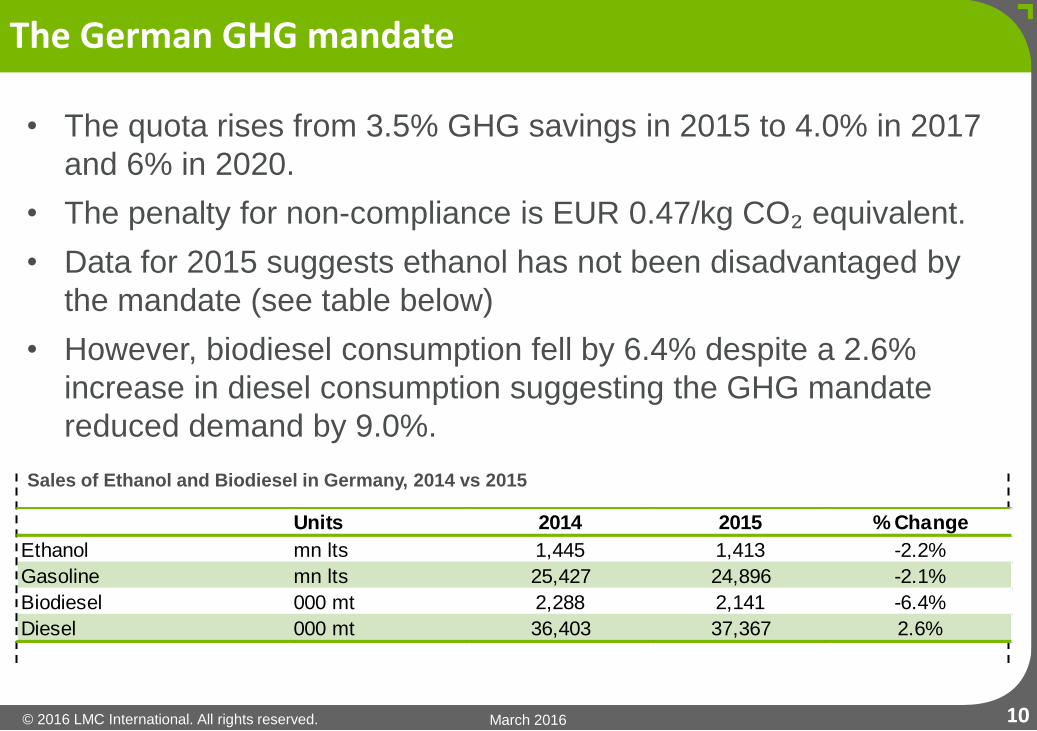
The German GHG mandate
• The quota rises from 3.5% GHG savings in 2015 to 4.0% in 2017
and 6% in 2020.
• The penalty for non-compliance is EUR 0.47/kg CO₂ equivalent.
• Data for 2015 suggests ethanol has not been disadvantaged by
the mandate (see table below)
• However, biodiesel consumption fell by 6.4% despite a 2.6%
increase in diesel consumption suggesting the GHG mandate
reduced demand by 9.0%.
Sales of Ethanol and Biodiesel in Germany, 2014 vs 2015
10
Units 2014 2015 % Change
Ethanol mn lts 1,445 1,413 -2.2%
Gasoline mn lts 25,427 24,896 -2.1%
Biodiesel 000 mt 2,288 2,141 -6.4%
Diesel 000 mt 36,403 37,367 2.6%
© 2016 LMC International. All rights reserved. March 2016
• This was because the GHG savings for biodiesel were higher
than expected, reducing the volume of biodiesel needed to meet
the mandate.
• The value of double counting biofuels is worth less in Germany
under the GHG mandate. The value of DC falls from a factor of 2
to 1.4 (with UCOME at 85% and RME at 60%).
• The market share of German producers improved in 2015 a result
of the mandate as local product has better GHG savings.
• The lesson from Germany is that it is difficult to anticipate future
reductions in CO2 savings and this results in a tendency to set
the mandate too low, reducing physical demand.
The German GHG mandate
11

The Outlook for EU Biofuels
© 2016 LMC International. All rights reserved. March 2016
• No EU wide biofuel mandates after 2020.
• The EU is seeking GHG reduction targets that will apply to all
renewables, not just transport.
• Thus it will be up to individual member states to provide specific
targets for biofuels.
• The RED revision of 2015 created a voluntary 0.5% mandate for
advanced biofuels, paving the way for 2G.
• Italy, Finland and Germany have already announced 2G
mandates. Denmark will decide in March 2016.
• Before the end of 2016, states must inform the Commission how
they intend to implement the revised RED.
• Only France has committed to raising mandates beyond 2020.
• Finland and Sweden have targets above 10% by 2020.
The outlook for EU biofuel policy
13
© 2016 LMC International. All rights reserved. March 2016
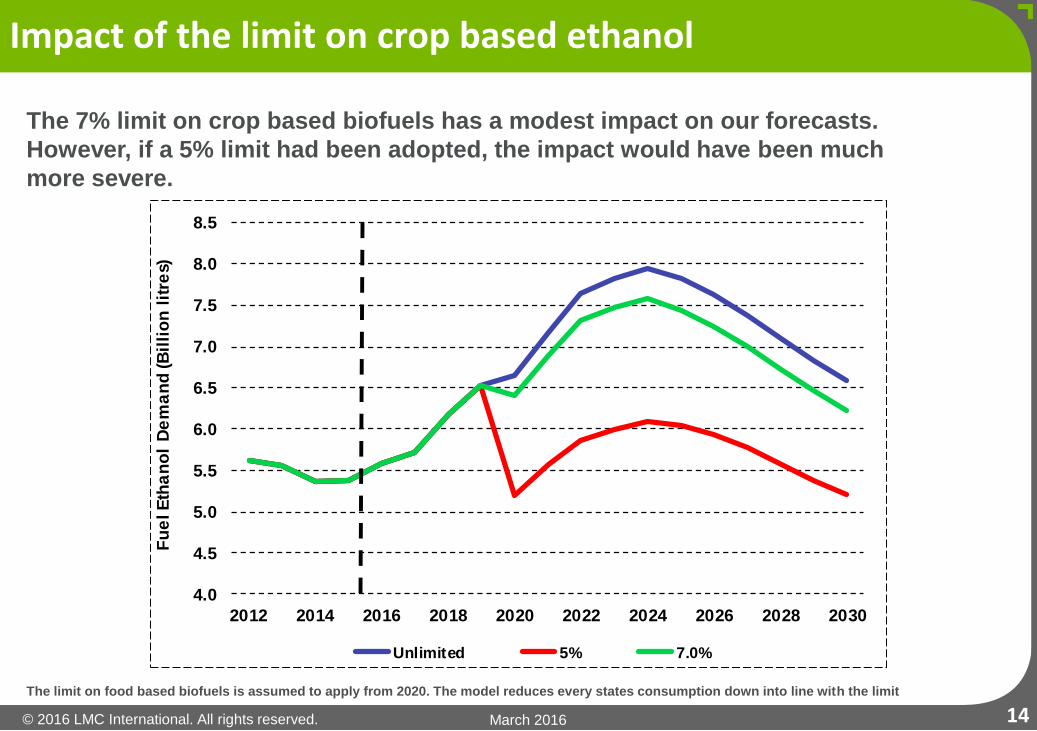
The 7% limit on crop based biofuels has a modest impact on our forecasts.
However, if a 5% limit had been adopted, the impact would have been much
more severe.
Impact of the limit on crop based ethanol
The limit on food based biofuels is assumed to apply from 2020. The model reduces every states consumption down into line with the limit
14
4.0
4.5
5.0
5.5
6.0
6.5
7.0
7.5
8.0
8.5
2012 2014 2016 2018 2020 2022 2024 2026 2028 2030
Fu
el E
tha
no
l D
em
an
d (B
illi
on
lit
res)
Unlimited 5% 7.0%
© 2016 LMC International. All rights reserved. March 2016
The current supply of waste-based ethanol
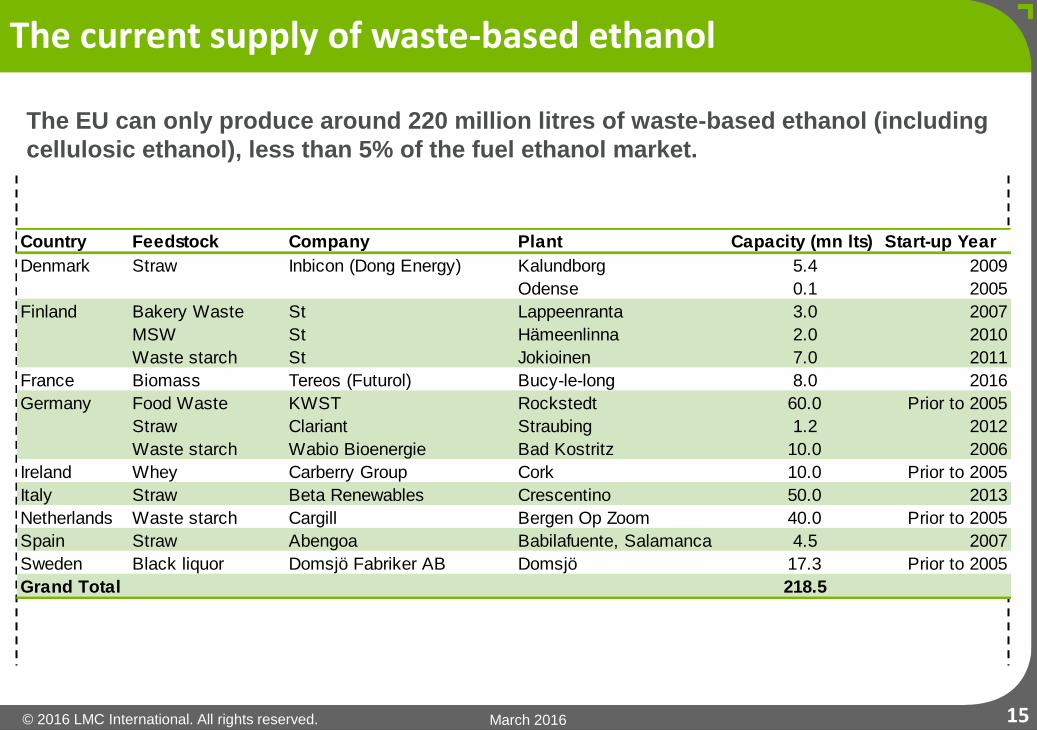
The EU can only produce around 220 million litres of waste-based ethanol (including
cellulosic ethanol), less than 5% of the fuel ethanol market.
15
Country Feedstock Company Plant Capacity (mn lts) Start-up Year
Denmark Straw Inbicon (Dong Energy) Kalundborg 5.4 2009
Odense 0.1 2005
Finland Bakery Waste St Lappeenranta 3.0 2007
MSW St Hämeenlinna 2.0 2010
Waste starch St Jokioinen 7.0 2011
France Biomass Tereos (Futurol) Bucy-le-long 8.0 2016
Germany Food Waste KWST Rockstedt 60.0 Prior to 2005
Straw Clariant Straubing 1.2 2012
Waste starch Wabio Bioenergie Bad Kostritz 10.0 2006
Ireland Whey Carberry Group Cork 10.0 Prior to 2005
Italy Straw Beta Renewables Crescentino 50.0 2013
Netherlands Waste starch Cargill Bergen Op Zoom 40.0 Prior to 2005
Spain Straw Abengoa Babilafuente, Salamanca 4.5 2007
Sweden Black liquor Domsjö Fabriker AB Domsjö 17.3 Prior to 2005
Grand Total 218.5
© 2016 LMC International. All rights reserved. March 2016
The potential supply of waste-based ethanol
16
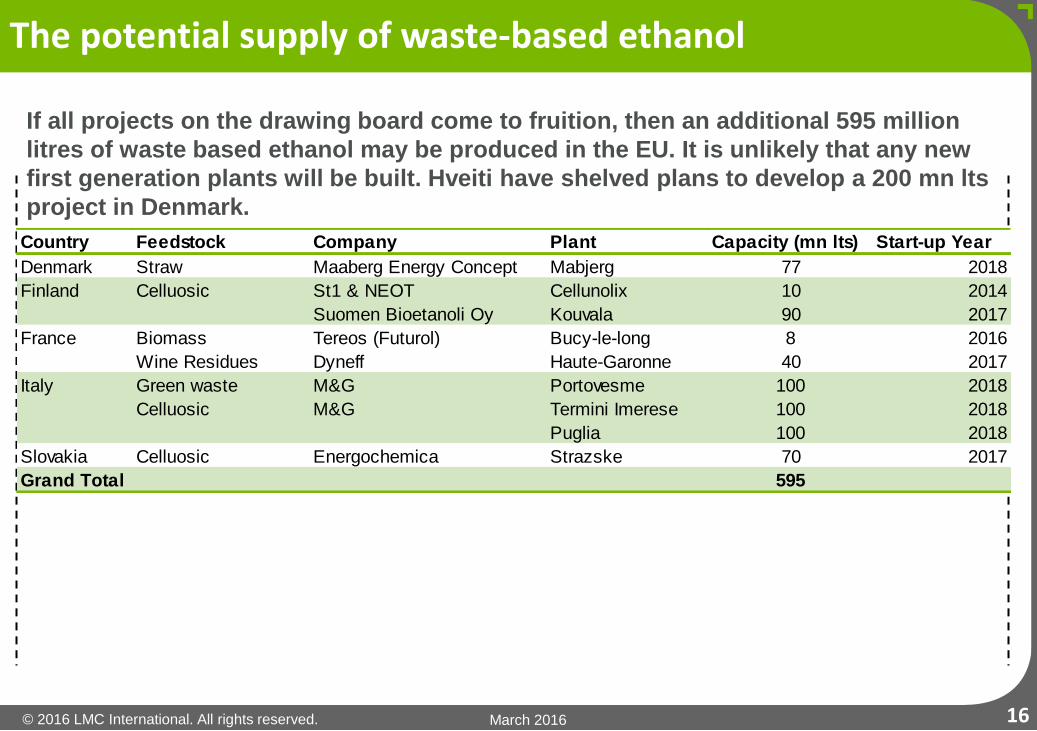
Country Feedstock Company Plant Capacity (mn lts) Start-up Year
Denmark Straw Maaberg Energy Concept Mabjerg 77 2018
Finland Celluosic St1 & NEOT Cellunolix 10 2014
Suomen Bioetanoli Oy Kouvala 90 2017
France Biomass Tereos (Futurol) Bucy-le-long 8 2016
Wine Residues Dyneff Haute-Garonne 40 2017
Italy Green waste M&G Portovesme 100 2018
Celluosic M&G Termini Imerese 100 2018
Puglia 100 2018
Slovakia Celluosic Energochemica Strazske 70 2017
Grand Total 595
If all projects on the drawing board come to fruition, then an additional 595 million
litres of waste based ethanol may be produced in the EU. It is unlikely that any new
first generation plants will be built. Hveiti have shelved plans to develop a 200 mn lts
project in Denmark.
© 2016 LMC International. All rights reserved. March 2016
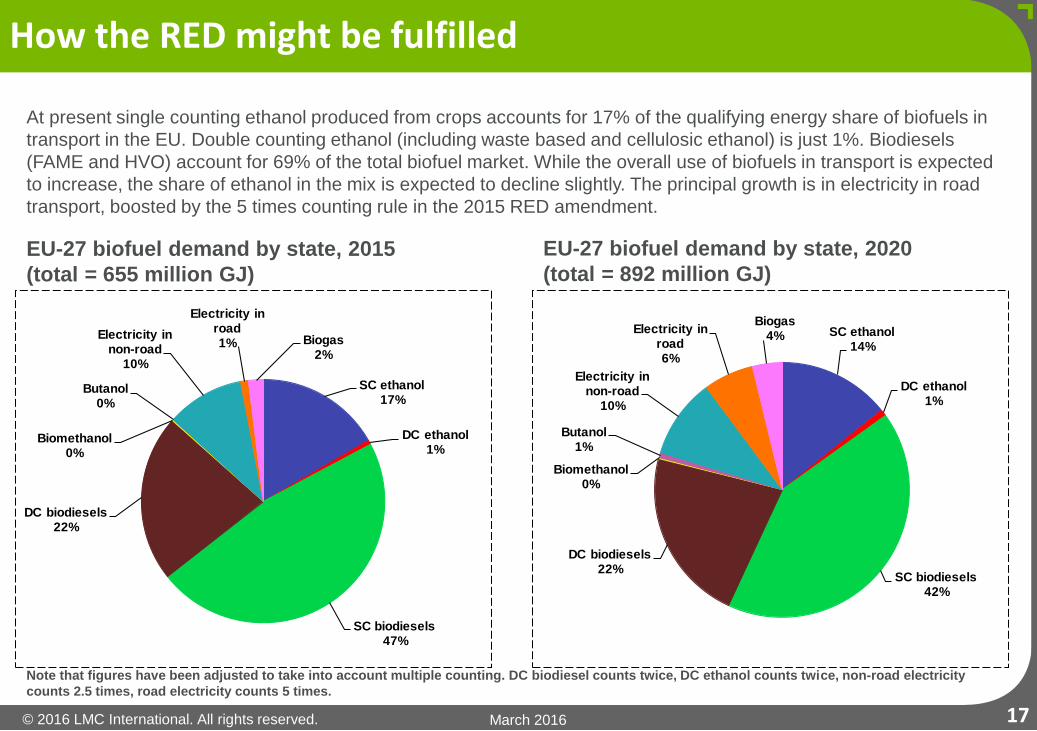
At present single counting ethanol produced from crops accounts for 17% of the qualifying energy share of biofuels in
transport in the EU. Double counting ethanol (including waste based and cellulosic ethanol) is just 1%. Biodiesels
(FAME and HVO) account for 69% of the total biofuel market. While the overall use of biofuels in transport is expected
to increase, the share of ethanol in the mix is expected to decline slightly. The principal growth is in electricity in road
transport, boosted by the 5 times counting rule in the 2015 RED amendment.
EU-27 biofuel demand by state, 2015
(total = 655 million GJ)
EU-27 biofuel demand by state, 2020
(total = 892 million GJ)
How the RED might be fulfilled
Note that figures have been adjusted to take into account multiple counting. DC biodiesel counts twice, DC ethanol counts twice, non-road electricity
counts 2.5 times, road electricity counts 5 times.
17
SC ethanol17%
DC ethanol1%
SC biodiesels47%
DC biodiesels22%
Biomethanol0%
Butanol0%
Electricity in non-road
10%
Electricity in road1% Biogas
2%
SC ethanol14%
DC ethanol1%
SC biodiesels42%
DC biodiesels22%
Biomethanol0%
Butanol1%
Electricity in non-road
10%
Electricity in road6%
Biogas4%
Conclusions
© 2016 LMC International. All rights reserved. March 2016
• From relatively simple beginnings in 2003, EU biofuel policy has
become highly complex as the European Parliament has
struggled to reconcile the demands of NGOs with those in the
industry.
• Implementation of the 2009 RED has taken far longer than the 18
months originally envisaged. It would not be surprising if
implementation of the 2015 revision was subject to similar delays.
• Policy was been implemented on a piecemeal basis with many
states delaying the implementation of sustainability requirements.
• The number of sustainability and certification schemes has
proliferated. This has greatly increased the administrative burden
on producers.
Conclusions
19
© 2016 LMC International. All rights reserved. March 2016
• The Commission’s announcement in 2011 that it would amend the
RED caused widespread uncertainty and put the market on hold
for 4 years. Finance for new 1G projects dried up, governments
refused to raise mandates and demand stagnated.
• The 2015 revision may put the market back on track but mandate
rises look set to remain on hold until 2017, the deadline for
announcing advanced biofuel mandates.
• The double counting policy largely benefited the biodiesel market
where waste oils (UCO/Tallow) could be converted into biodiesel
using existing technology.
• By contrast, large scale conversion of wastes and residues for
ethanol relies on the availability of cellulosic technology which is
still being commercialised.
Conclusions
20
© 2016 LMC International. All rights reserved. March 2016
• The trend is towards dropping ethanol or biodiesel specific
mandates in favour of GHG saving mandates. The lesson from
Germany is that accurately quantifying the GHG savings from
biofuels is key. As technology improves the GHG savings of
biofuels over time, such mandates will tend to reduce physical
demand for biofuels.
• More 2G capacity will be needed if states implement advanced
biofuel mandates. An EU wide 0.5% mandate would require 2.8
billion litres of cellulosic ethanol (replacing 0.5% of gasoline with
ethanol).
• It is looking increasingly likely that there will be no EU wide
targets for biofuels in transport after 2020. It will therefore be
down to individual member states to promote biofuels.
Conclusions
21
© 2016 LMC International. All rights reserved. March 2016
Singapore
16 Collyer Quay #21-00
Singapore 049318
Singapore
Tel: +65 6818 9231
This presentation and its contents are to be held confidential by the client, and are not to be disclosed, in whole or in part, in any
manner, to a third party without the prior written consent of LMC International.
While LMC has endeavoured to ensure the accuracy of the data, estimates and forecasts contained in this presentation,
any decisions based on them (including those involving investment and planning) are at the client’s own risk.
LMC International can accept no liability regarding information analysis and forecasts contained in this presentation.
© LMC International, 2016
All rights reserved
New York
1841 Broadway
New York, NY 10023
USA
T +1 (212) 586-2427
F +1 (212) 397-4756
Oxford
4th Floor, Clarendon House
52 Cornmarket Street
Oxford OX1 3HJ
UK
T +44 1865 791737
F +44 1865 791739
Kuala Lumpur
B-03-19, Empire Soho
Empire Subang
Jalan SS16/1, SS16
47500 Subang Jaya
Selangor Darul Ehsan
Malaysia
T +603 5611 9337
www.lmc.co.uk