Platts 3rd Asian refining Summit · Platts 3rd Asian refining Summit March 2016 2 The new market...
16
1 Singapore – 3-4 March 2016 European refining environment Dario Scaffardi – Saras SpA Platts 3 rd Asian refining Summit
Transcript of Platts 3rd Asian refining Summit · Platts 3rd Asian refining Summit March 2016 2 The new market...

1
Singapore – 3-4 March 2016
European refining environmentDario Scaffardi – Saras SpA
Platts 3rd Asian refining Summit
Platts 3rd Asian refining Summit March 2016 2
The new market cycle derives from 6 key structural changes
i
ii
iii
iv
v
vi
($/bl)
2009-2014: market downturn
Improved product demand in Europe and worldwide
More balanced oil prices, robust supply
Ongoing rationalization of European refining capacity Over estimation of global spare capacity
Correction of market distortions Reduction of global spare capacity Increase of international freight rates
Healthy crack spreads and widening of light-heavy product differentials (greater benefits for complex refineries)
Significant increase in production of heavy crudes
Market Downturn from 2009 to 2014
Falling product demand in Europe
New Market Cycle from 2015 onwards
High crude prices
Refining overcapacity
Strong competition from: • Wide Brent-WTI spread • Non-OECD refineries
Low crack spreads and tight light-heavy products differentials
Low availability of heavy sour crudes
2,1
4,5 4,7
2,83,3 3,2
0,7 0,6
-1,1
0,9
-1,2
-0,5
4,0 4,1
-2
-1
0
1
2
3
4
5
6
2003 2004 2005 2006 2007 2008 2009 2010 2011 2012 2013 2014 2015 2016-to-date
Yearly EMC Benchmark margin (FOB Med)
As of 29th Feb 2016
Platts 3rd Asian refining Summit March 2016 3
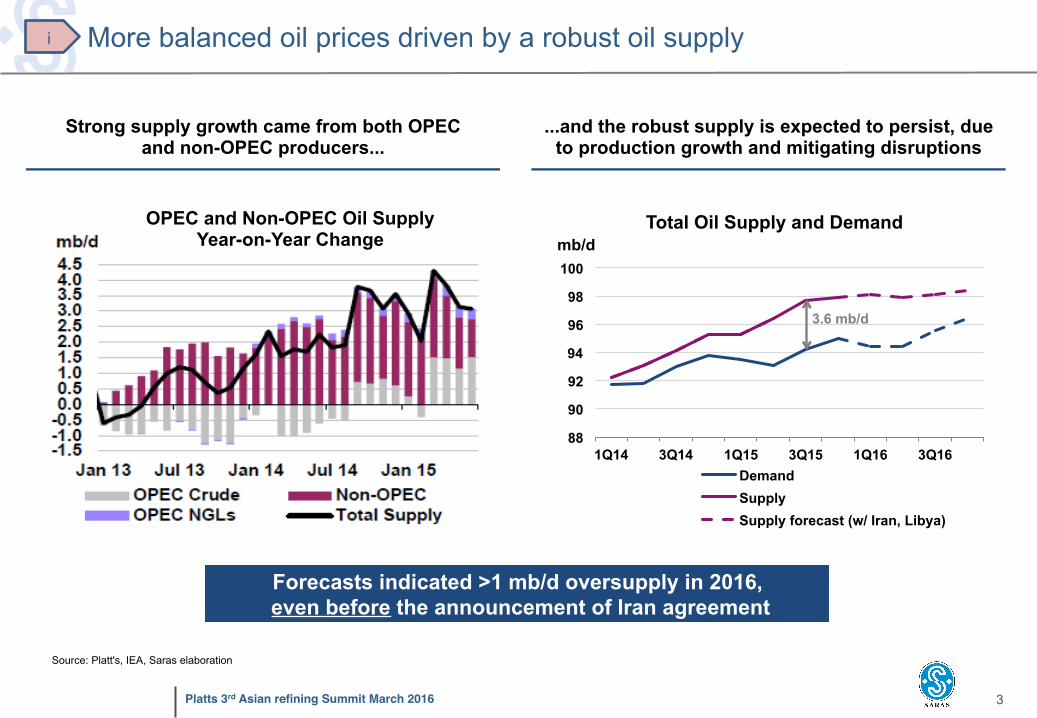
More balanced oil prices driven by a robust oil supply
Forecasts indicated >1 mb/d oversupply in 2016, even before the announcement of Iran agreement
OPEC and Non-OPEC Oil Supply Year-on-Year Change
Source: Platt's, IEA, Saras elaboration
Strong supply growth came from both OPEC and non-OPEC producers...
...and the robust supply is expected to persist, due to production growth and mitigating disruptions
88
90
92
94
96
98
100
1Q14 3Q14 1Q15 3Q15 1Q16 3Q16
Total Oil Supply and Demand
Demand Supply Supply forecast (w/ Iran, Libya)
mb/d
i
3.6 mb/d

Platts 3rd Asian refining Summit March 2016 4
Significant increase of non-standard grades (heavy sour, heavy acidic, etc.) ii
1. E.g. Nigeria, Angola 2. E.g. Congo, Gabon and Mauritania Source: IEA
Colombia • 2Q15 production:
1.0 mb/d
Venezuela • 2Q15 production:
2.4 mb/d
Brazil • Growth forecast for '16: + 300 kb/d • Heavy crudes 50% of reserves
Canada • Growth forecast for '16: + 200 kb/d • New pipelines to enter in operation:
– 1.1 mb/d from Alberta to Montreal – 1.5 mb/d from Alberta to USGC
Iraq • Growth forecast for '16: + 300 kb/d • New pipelines from Kurdistan to Med active • New Basrah heavy production on stream
Iran • 2Q15 production:
2.8 mb/d • Potential return to
pre-sanction production level by '16: 4 mb/d
West Africa • Production levels of traditional producers not at
their highest1 and new suppliers2 coming in • Increasingly shifting focus from North America
to Europe and Asia
Caspian region • Increase in CPC production • Development of Kazak crudes (e.g.
Kashagan and condensates) • Increase of Turkmenistan production

Platts 3rd Asian refining Summit March 2016 5
Supply changes drive relative premiums/discounts, leading to opportunities
Azeri premium vs Libyan production Arabian Heavy discount vs Iranian export
-12-11-10-9-8-7-6-5-4-3-2-10126,000
4,000
2,000
0
Iranexport(kb/d)
2014201320122011
Arab.H.DiscountvsBrent($/bbl)
-4
-3
-2
-1
0
1
2
3
4
5
65,000
4,000
3,000
2,000
1,000
0
AzeriPremiumvsBrent($/bbl)
LibyaproducNon(kb/d)
2013201220112010
Azeri Light premium increasing when alternative Libyan grades not available in the Med market
Arabian Heavy discounts intensify as alternative Iranian grades become more
abundant Source: IEA, Platts
Brent
Brent
ii

Platts 3rd Asian refining Summit March 2016 6
08'-12' 13'-14'
2015 is appearing as the inflection point of product demand
Sharp drop in Europe's total demand until 2012, stabilization in 2013-2014... ... and clear growth trends began in 2015
13.8
2.7
Lightdis4llates
2014
0.9
-1%
Middledis4llates
-3%
Others
Fueloil
3.4
2009
15.3
3.0
1.4
7.5
3.4
2008
16.0
1.5
7.8
3.5
3.1
7.4
2.9
2013
14.0
2.7
1.0
7.4
2.9
2012
14.2
2.7
1.1
7.4
3.0
2011
14.7
2.9
1.2
7.5
3.2
2010
15.1
3.0
1.3
7.5
Source: BP Statistical Review, JBC Energy, IEA, JODI, SuDeP
CAGR
Europe: total product demand (mb/d)
500
0
1,000
-1,000
-500
(kb/d)
Jan/15Jan/14 Apr/14 Oct/14 Jul/15Jul/14 Apr/15
TotalEuropeancountrieswithdemanddecrease
TotalEurope
TotalEuropeancountrieswithdemandgrowth
Total products – demand growth
CAGR
-3.7%
-1.3%
-9.1%
-3.5%
-2.4%
-0.5%
-6.2%
-0.7%
iii
Oct/15
Platts 3rd Asian refining Summit March 2016 7
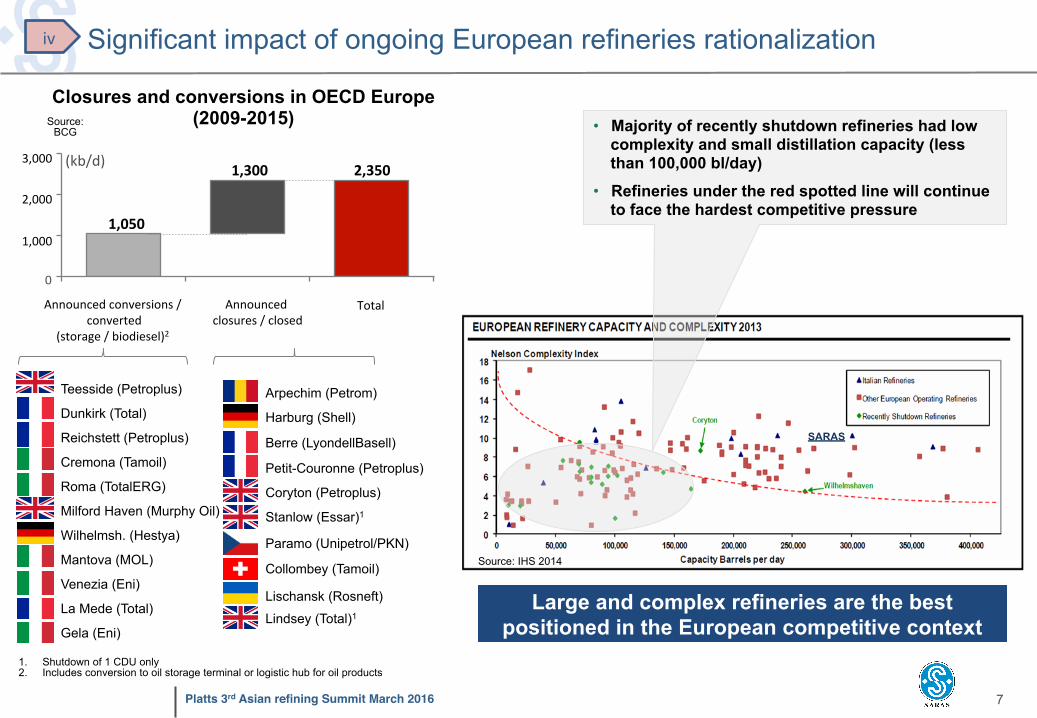
Closures and conversions in OECD Europe (2009-2015)
2,000
1,000
0
3,0002,3501,300
1,050
(kb/d)
Announcedclosures/closed
TotalAnnouncedconversions/converted
(storage/biodiesel)2
Significant impact of ongoing European refineries rationalization
Gela (Eni)
Teesside (Petroplus)
Dunkirk (Total)
Reichstett (Petroplus)
Cremona (Tamoil)
Roma (TotalERG)
Milford Haven (Murphy Oil)
Wilhelmsh. (Hestya)
Mantova (MOL)
Venezia (Eni)
Arpechim (Petrom)
Harburg (Shell)
Berre (LyondellBasell)
Petit-Couronne (Petroplus)
Coryton (Petroplus)
Stanlow (Essar)1
Paramo (Unipetrol/PKN)
Collombey (Tamoil)
Lischansk (Rosneft)
Lindsey (Total)1 La Mede (Total)
1. Shutdown of 1 CDU only 2. Includes conversion to oil storage terminal or logistic hub for oil products
• Majority of recently shutdown refineries had low complexity and small distillation capacity (less than 100,000 bl/day)
• Refineries under the red spotted line will continue to face the hardest competitive pressure
Large and complex refineries are the best positioned in the European competitive context
SARAS
Source: IHS 2014
Source: BCG
iv
Platts 3rd Asian refining Summit March 2016 8
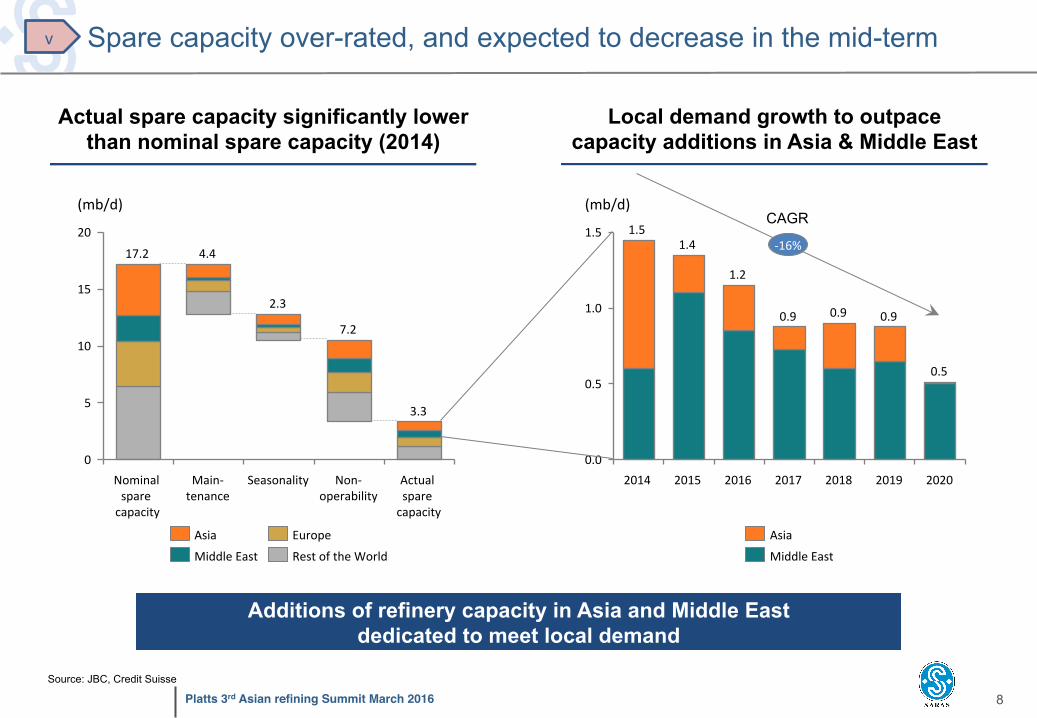
Spare capacity over-rated, and expected to decrease in the mid-term
20
15
10
5
0
2.3
17.2 4.4
7.2
3.3
(mb/d)
Actualsparecapacity
Non-operability
SeasonalityMain-tenance
Nominalsparecapacity
RestoftheWorld
Europe
MiddleEast
Asia
Source: JBC, Credit Suisse
Actual spare capacity significantly lower than nominal spare capacity (2014)
Local demand growth to outpace capacity additions in Asia & Middle East
1.5
1.0
0.5
0.0
0.5
0.90.90.9
1.2
1.41.5
(mb/d)
-16%
2020201920182017201620152014
MiddleEast
Asia
Additions of refinery capacity in Asia and Middle East dedicated to meet local demand
CAGR
v

Platts 3rd Asian refining Summit March 2016 9
... and long in Gasoline1 Europe is short of Gasoil/Diesel...
0
200
400
Mton
Imports
127.1
Others
10.1
Exports
93.2
Production
-258.4
Demand
282.1
-200
0
200
Demand
82.6
Mton
Imports
25.8
Others
-9.3
Exports
68.7
Production
-116.2
2014
20
08
0
200
400
Imports
Mton
Demand
-282.8
Production
80.7 111.0
Others
10.1
Exports
303.0
-200
0
200
Production
-143.2
Demand
102.3
Exports
-0.6
Imports Others
31.4
73.0
Mton 30.3 Mton of net
Imports,10% of total demand
33,9 Mton of net Imports,12% of total
demand
41.6 Mton of net exports,41% of total
demand
42.9 Mton of net exports,52% of total
demand
EU historically unable to meet regional demand for diesel/gasoil
1. Total gasoline: motor gasoline + aviation gasoline + gasoline type jet fuel 2. Includes Transfers, Stock change, Intl. Marine bunkers, Statistical difference Source: “IEA Oil Information” August 2015
v
Platts 3rd Asian refining Summit March 2016 10
-10
-5
0
5
10
15
20
25
30
Jan-05
Jul-0
5Jan-06
Jul-0
6Jan-07
Jul-0
7Jan-08
Jul-0
8Jan-09
Jul-0
9Jan-10
Jul-1
0Jan-11
Jul-1
1Jan-12
Jul-1
2Jan-13
Jul-1
3Jan-14
Jul-1
4Jan-15
Jul-1
5Jan-16
$/bl
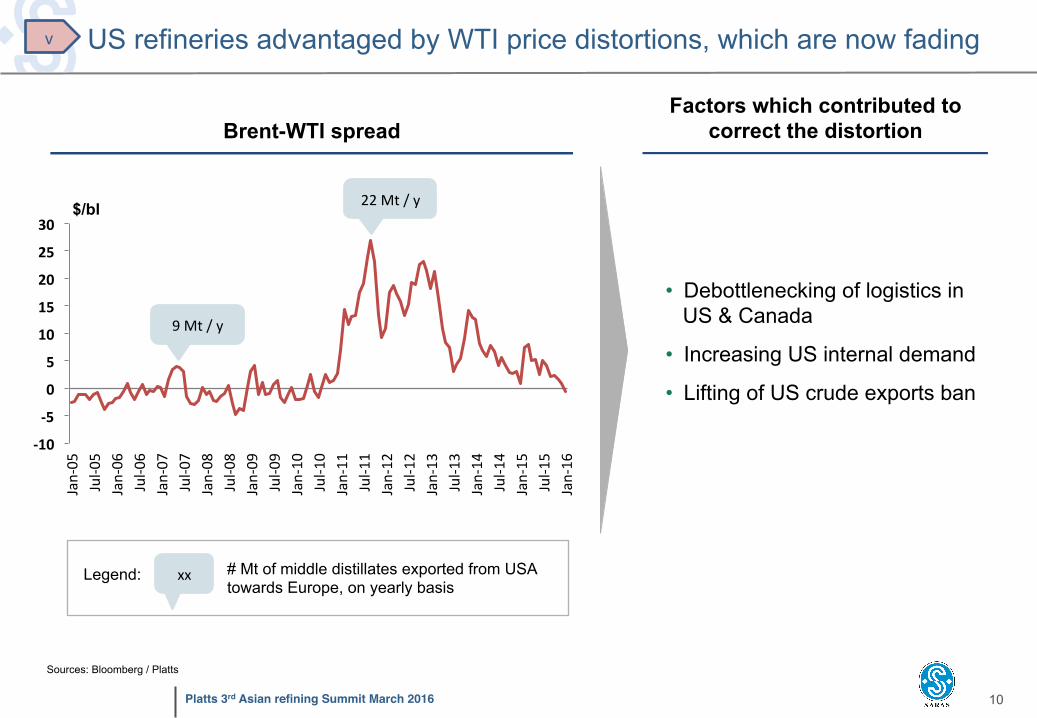
Brent-WTI spread Factors which contributed to
correct the distortion
• Debottlenecking of logistics in US & Canada
• Increasing US internal demand
• Lifting of US crude exports ban
9Mt/y
22Mt/y
Sources: Bloomberg / Platts
US refineries advantaged by WTI price distortions, which are now fading
xx # Mt of middle distillates exported from USA towards Europe, on yearly basis
Legend:
v
Platts 3rd Asian refining Summit March 2016 11
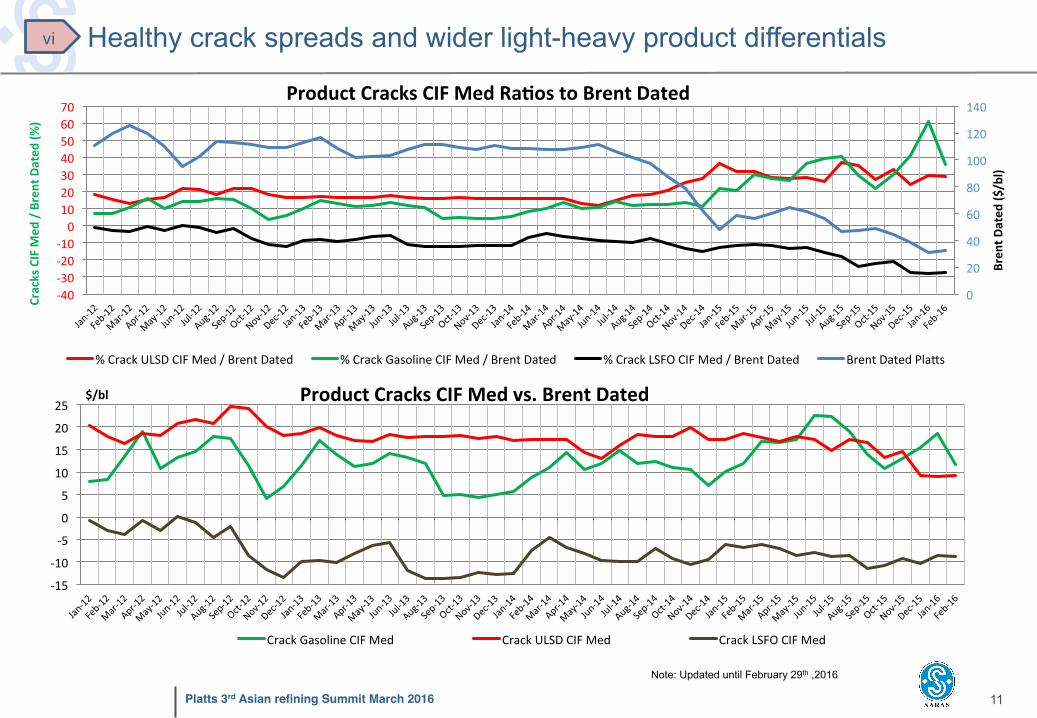
Healthy crack spreads and wider light-heavy product differentials vi
Note: Updated until February 29th ,2016
0
20
40
60
80
100
120
140
-40-30-20-10010203040506070
Bren
tDated
($/bl)
CracksCIFM
ed/BrentDated
(%)
ProductCracksCIFMedRaNostoBrentDated
%CrackULSDCIFMed/BrentDated %CrackGasolineCIFMed/BrentDated %CrackLSFOCIFMed/BrentDated BrentDatedPla^s
-15
-10
-5
0
5
10
15
20
25$/bl ProductCracksCIFMedvs.BrentDated
CrackGasolineCIFMed CrackULSDCIFMed CrackLSFOCIFMed
Platts 3rd Asian refining Summit March 2016 12
0
7
14
21
28
35
42
20
40
60
80
100
120
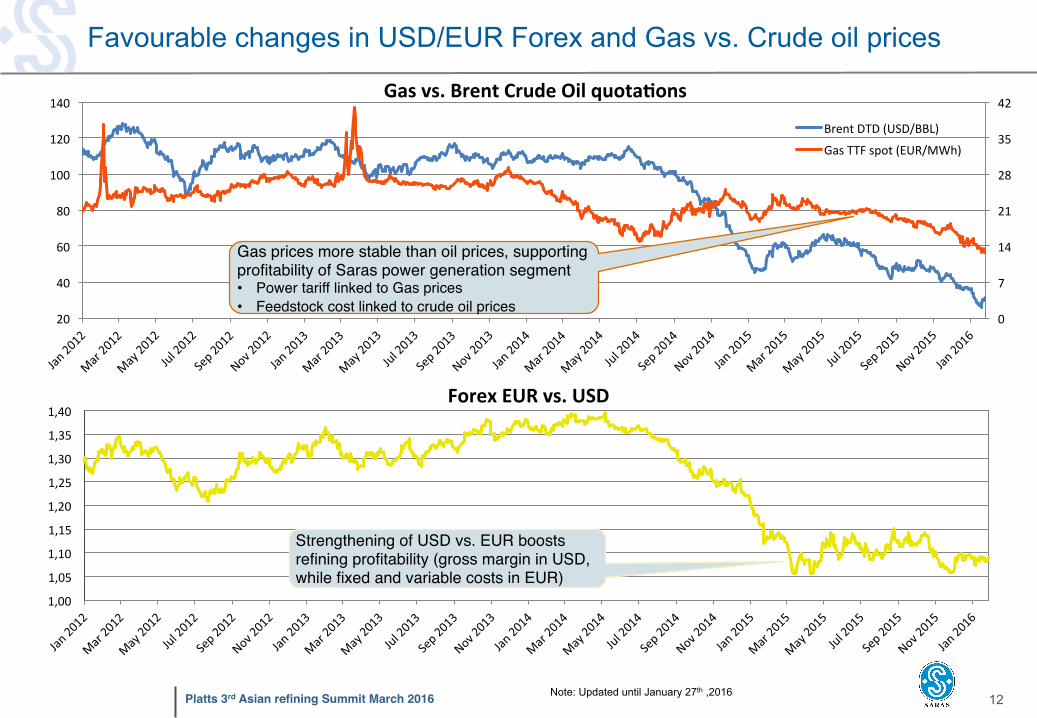
140Gasvs.BrentCrudeOilquotaNons
BrentDTD(USD/BBL)
GasTTFspot(EUR/MWh)
1,00
1,05
1,10
1,15
1,20
1,25
1,30
1,35
1,40ForexEURvs.USD
Gas prices more stable than oil prices, supporting profitability of Saras power generation segment• Power tariff linked to Gas prices• Feedstock cost linked to crude oil prices
Strengthening of USD vs. EUR boosts refining profitability (gross margin in USD, while fixed and variable costs in EUR)
Favourable changes in USD/EUR Forex and Gas vs. Crude oil prices
Note: Updated until January 27th ,2016

Platts 3rd Asian refining Summit March 2016 13
-7-6-5-4-3-2-1012345
$/bb
l
CrudedifferenNalsvsBrentdtd
Saras' crude flexibility and integrated approach to Supply Chain Management are strong competitive advantages...
39% 22%
30% 37%
14% 28% 7%
11% 3%
2014
100%
11%
2010
100% +157%
2014
36
2010
14
Ø Flexible asset capable of processing multiple crude types
§ Exploit opportunities in crude differentials
Ø Central hub with diversified supply from all over the world
§ Flexibility in crude origin and optimization of supply
... which allowed Saras to overcome major supply disruptions and exploit market opportunities
Change in variety of
crudes processed and origin of crudes
purchased
Market volatility
and variations of discounts / premiums for
crudes
North Africa FSU Others Middle East North Sea
Types of crude Origins of crude
~ 4 $/bl Azeri
~ -3 $/bl Dalia
~1.5 $/bl
~ -5 $/bl
~ -1 $/bl
~ -4.5 $/bl
($/b)
Basrah
Platts 3rd Asian refining Summit March 2016 14
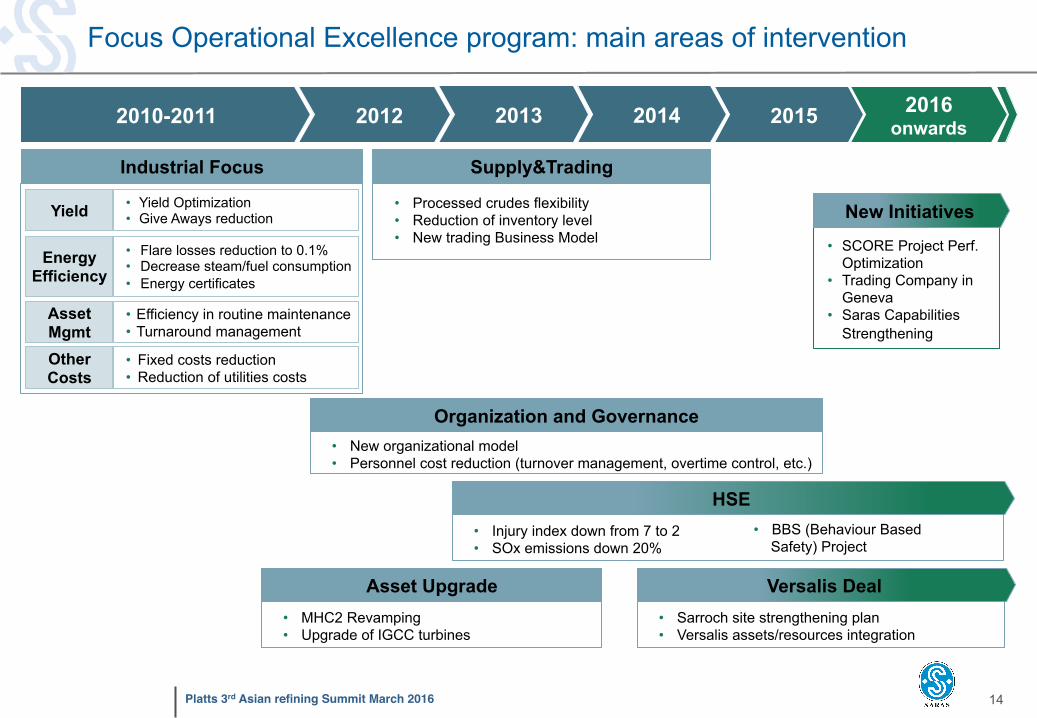
Focus Operational Excellence program: main areas of intervention
Industrial Focus Supply&Trading
Organization and Governance
• Processed crudes flexibility • Reduction of inventory level • New trading Business Model
• New organizational model • Personnel cost reduction (turnover management, overtime control, etc.)
Versalis Deal Asset Upgrade • Sarroch site strengthening plan • Versalis assets/resources integration
• MHC2 Revamping • Upgrade of IGCC turbines
• Injury index down from 7 to 2 • SOx emissions down 20%
Yield
Asset Mgmt
Energy Efficiency
• Yield Optimization • Give Aways reduction
• Efficiency in routine maintenance • Turnaround management
• Flare losses reduction to 0.1% • Decrease steam/fuel consumption • Energy certificates
Other Costs
• Fixed costs reduction • Reduction of utilities costs
HSE
• SCORE Project Perf. Optimization
• Trading Company in Geneva
• Saras Capabilities Strengthening
• BBS (Behaviour Based Safety) Project
2010-2011 2012 2013 2014 2016 onwards
New Initiatives
2015

Platts 3rd Asian refining Summit March 2016 15
Strengthening of Saras resources' competences and capabilities at all levels
Internal capability building program
• Managerial and technical training • Internal training center set-up • State-of-art training tools
(e.g. simulation games)
World-class consulting
• Best practices within Oil & Gas industry and cross industries from top-tier technical and managerial consultants
External talent sourcing for Senior/ Middle Management
• Several industry hires sourced from major and super major IOCs to cover key managerial positions
The skills and the commitment of the resources are key factors in establishing competitive performance levels
Competences &
Capabilities
Platts 3rd Asian refining Summit March 2016 16
Financing
advantages
Economic Value
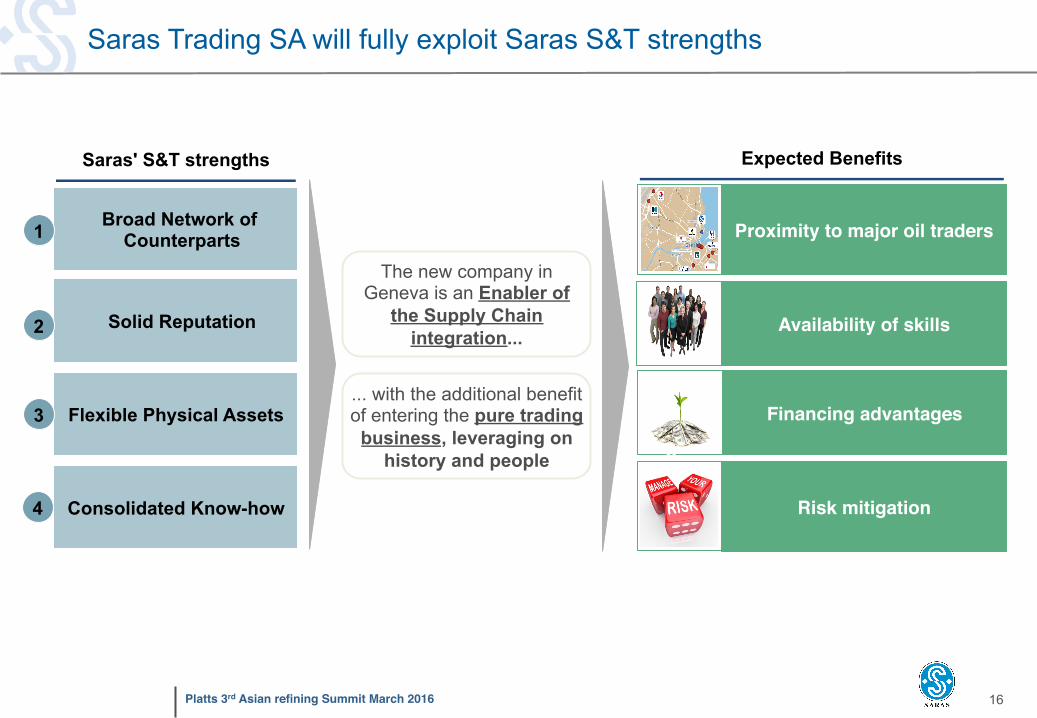
Saras Trading SA will fully exploit Saras S&T strengths
Saras' S&T strengths Expected Benefits
The new company in Geneva is an Enabler of
the Supply Chain integration...
Broad Network of Counterparts
Consolidated Know-how
Solid Reputation
Flexible Physical Assets
1
2
3
4
Availability of skills
Risk mitigation
Location advantagesProximity to major oil traders
Financing
advantages
Financing advantages... with the additional benefit of entering the pure trading
business, leveraging on history and people