Platoro Outlet Pipe Vibration Test - usbr.gov
15
U.S. Department of the Interior Bureau of Reclamation Technical Service Center Hydraulic Investigations and Laboratory Services Group Denver, Colorado TR-2019-05 Platoro Outlet Pipe Vibration Test Date(s) of Travel: August 14 -16, 2019
Transcript of Platoro Outlet Pipe Vibration Test - usbr.gov
U.S. Department of the InteriorBureau of ReclamationTechnical Service CenterHydraulic Investigations and Laboratory Services GroupDenver, Colorado
TR-2019-05
Platoro Outlet Pipe Vibration Test
Date(s) of Travel: August 14 -16, 2019
BUREAU OF RECLAMATION Technical Service Center Denver, Colorado TRAVEL REPORT Code: 86-68560 Date: September 12, 2019 To: Manager, Hydraulic Investigations and Laboratory Services Group From: Josh Mortensen and Jacob Carter-Gibb, Hydraulic Engineers Subject: Platoro Outlet Pipe Vibration Test 1. Travel period: 14 – 16 August 2019 2. Places or offices visited: Platoro Dam 3. Purpose of trip: The main purpose of this trip was to evaluate vibrations observed for the 56-inch steel outlet pipe. Pipe vibrations accompanied by loud pinging and banging noises were reported by the operator in July 2019. This occurred while operating at higher than normal reservoir elevations (approximately 10,020 ft) due to the large amount of snow melt. Previous vibration testing, conducted in 1985 and 1990, determined the cause was attributed to cavitation and shifts in flow control which occurred for large butterfly valve openings (see references [1], [2], and [3]). In 2010, the butterfly valves were replaced with jet flow gates. Since that time no reports of cavitation or vibration were made until July 2019. 4. Synopsis of trip: On August 14th Josh Mortensen and Jacob Carter-Gibb drove to Platoro Dam in a government vehicle and stayed overnight in a rented cabin. The morning of August 15th we met with Nathan Coombs, the dam operator from Conejos Water Conservancy District. First, an initial assessment of the pipe was made during operation with equal jet flow gate openings of 75% to determine where instrumentation should be installed. The rest of the day was spent installing instrumentation and test equipment (Figure 1Figure 2). Installation was completed the morning of August 16th and the field test was conducted immediately after. Personnel from Reclamation’s Albuquerque Area Office and Colorado Department of Water Resources arrived to witness the test. Testing was made at an average Reservoir Water Surface Elevation of 10,013.1 ft with equal gate positions of 20, 40, 50, 60, 65, 70, 75, 80, 85, 90, 95, and 100 percent open. At the end of the test equipment was packed up and we returned to Denver arriving late in the evening of August 16th. Discharge Measurements and Rating Curve Adjustments The field test included discharge measurements from an externally-mounted acoustic flowmeter as well as pressure measurements from a single tap located in the right leg of the bifurcation. Discharge measurements from the pipe flowmeter were compared with a river gaging station just downstream of the dam. Results agreed very well for discharges up to about 625 ft3/s (Figure 3).
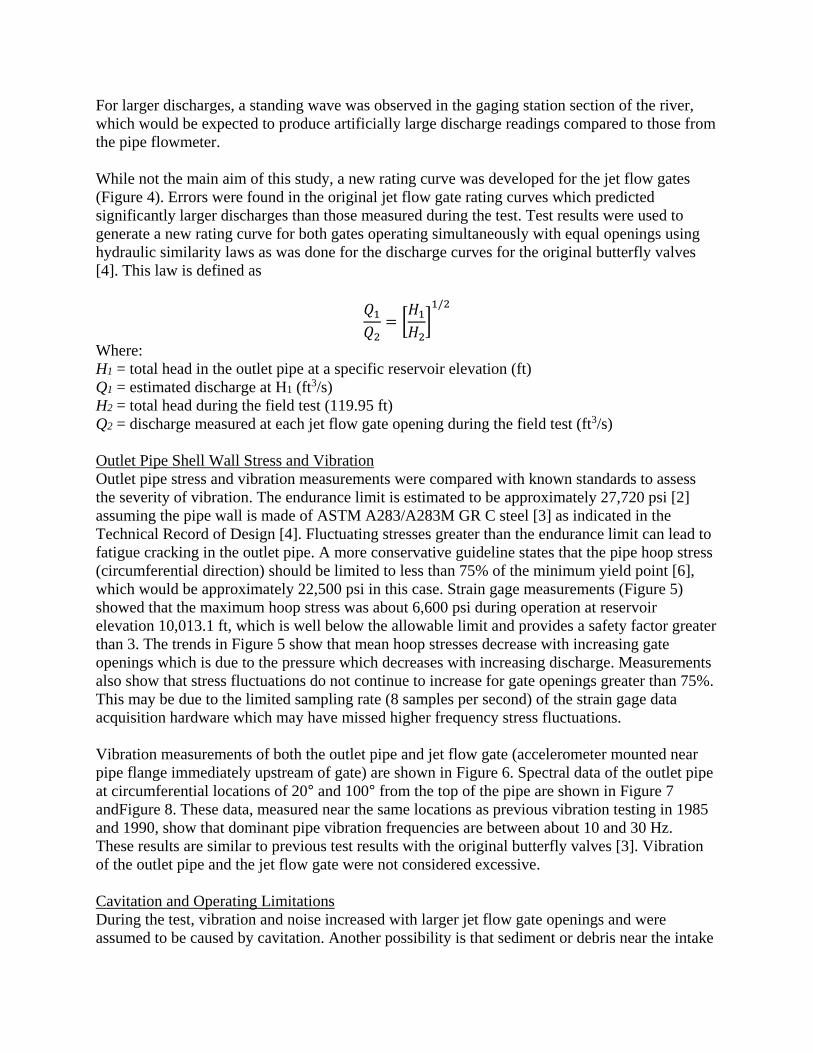
For larger discharges, a standing wave was observed in the gaging station section of the river, which would be expected to produce artificially large discharge readings compared to those from the pipe flowmeter. While not the main aim of this study, a new rating curve was developed for the jet flow gates (Figure 4). Errors were found in the original jet flow gate rating curves which predicted significantly larger discharges than those measured during the test. Test results were used to generate a new rating curve for both gates operating simultaneously with equal openings using hydraulic similarity laws as was done for the discharge curves for the original butterfly valves [4]. This law is defined as
𝑄𝑄1𝑄𝑄2
= �𝐻𝐻1𝐻𝐻2�1/2
Where: H1 = total head in the outlet pipe at a specific reservoir elevation (ft) Q1 = estimated discharge at H1 (ft3/s) H2 = total head during the field test (119.95 ft) Q2 = discharge measured at each jet flow gate opening during the field test (ft3/s) Outlet Pipe Shell Wall Stress and Vibration Outlet pipe stress and vibration measurements were compared with known standards to assess the severity of vibration. The endurance limit is estimated to be approximately 27,720 psi [2] assuming the pipe wall is made of ASTM A283/A283M GR C steel [3] as indicated in the Technical Record of Design [4]. Fluctuating stresses greater than the endurance limit can lead to fatigue cracking in the outlet pipe. A more conservative guideline states that the pipe hoop stress (circumferential direction) should be limited to less than 75% of the minimum yield point [6], which would be approximately 22,500 psi in this case. Strain gage measurements (Figure 5) showed that the maximum hoop stress was about 6,600 psi during operation at reservoir elevation 10,013.1 ft, which is well below the allowable limit and provides a safety factor greater than 3. The trends in Figure 5 show that mean hoop stresses decrease with increasing gate openings which is due to the pressure which decreases with increasing discharge. Measurements also show that stress fluctuations do not continue to increase for gate openings greater than 75%. This may be due to the limited sampling rate (8 samples per second) of the strain gage data acquisition hardware which may have missed higher frequency stress fluctuations. Vibration measurements of both the outlet pipe and jet flow gate (accelerometer mounted near pipe flange immediately upstream of gate) are shown in Figure 6. Spectral data of the outlet pipe at circumferential locations of 20° and 100° from the top of the pipe are shown in Figure 7 andFigure 8. These data, measured near the same locations as previous vibration testing in 1985 and 1990, show that dominant pipe vibration frequencies are between about 10 and 30 Hz. These results are similar to previous test results with the original butterfly valves [3]. Vibration of the outlet pipe and the jet flow gate were not considered excessive. Cavitation and Operating Limitations During the test, vibration and noise increased with larger jet flow gate openings and were assumed to be caused by cavitation. Another possibility is that sediment or debris near the intake
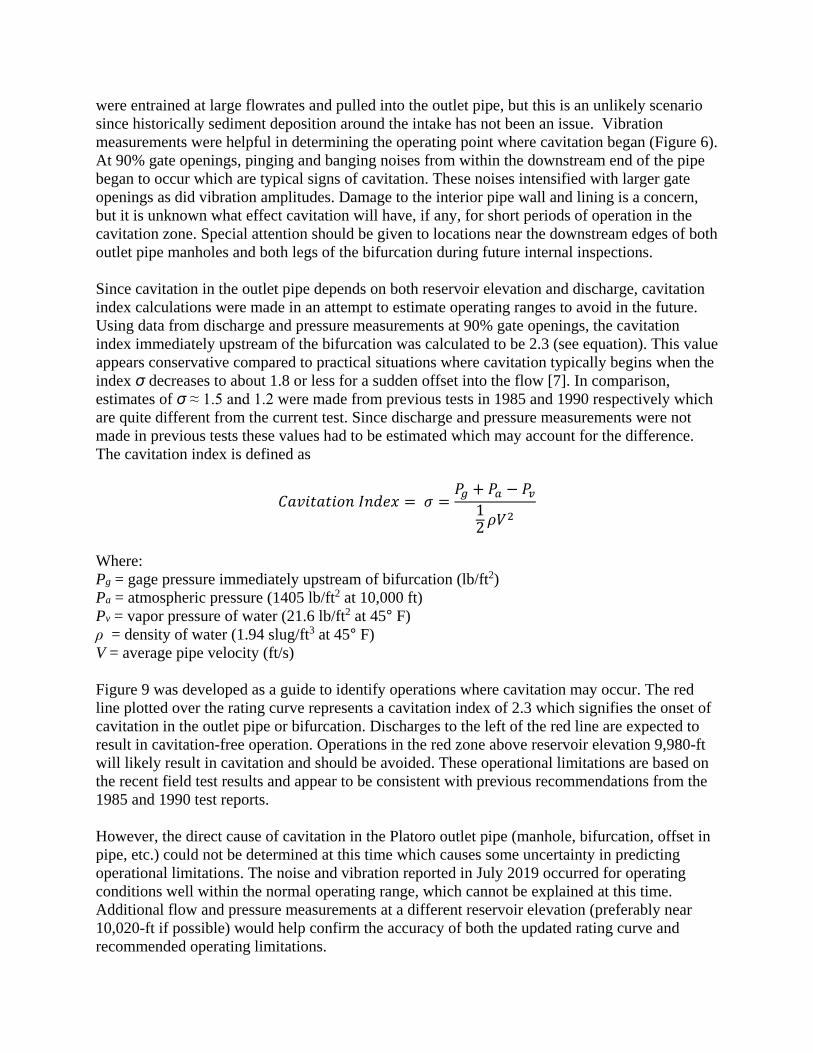
were entrained at large flowrates and pulled into the outlet pipe, but this is an unlikely scenario since historically sediment deposition around the intake has not been an issue. Vibration measurements were helpful in determining the operating point where cavitation began (Figure 6). At 90% gate openings, pinging and banging noises from within the downstream end of the pipe began to occur which are typical signs of cavitation. These noises intensified with larger gate openings as did vibration amplitudes. Damage to the interior pipe wall and lining is a concern, but it is unknown what effect cavitation will have, if any, for short periods of operation in the cavitation zone. Special attention should be given to locations near the downstream edges of both outlet pipe manholes and both legs of the bifurcation during future internal inspections. Since cavitation in the outlet pipe depends on both reservoir elevation and discharge, cavitation index calculations were made in an attempt to estimate operating ranges to avoid in the future. Using data from discharge and pressure measurements at 90% gate openings, the cavitation index immediately upstream of the bifurcation was calculated to be 2.3 (see equation). This value appears conservative compared to practical situations where cavitation typically begins when the index σ decreases to about 1.8 or less for a sudden offset into the flow [7]. In comparison, estimates of σ ≈ 1.5 and 1.2 were made from previous tests in 1985 and 1990 respectively which are quite different from the current test. Since discharge and pressure measurements were not made in previous tests these values had to be estimated which may account for the difference. The cavitation index is defined as
𝐶𝐶𝐶𝐶𝐶𝐶𝐶𝐶𝐶𝐶𝐶𝐶𝐶𝐶𝐶𝐶𝐶𝐶𝐶𝐶 𝐼𝐼𝐶𝐶𝐼𝐼𝐼𝐼𝐼𝐼 = 𝜎𝜎 =𝑃𝑃𝑔𝑔 + 𝑃𝑃𝑎𝑎 − 𝑃𝑃𝑣𝑣
12𝜌𝜌𝑉𝑉
2
Where: Pg = gage pressure immediately upstream of bifurcation (lb/ft2) Pa = atmospheric pressure (1405 lb/ft2 at 10,000 ft) Pv = vapor pressure of water (21.6 lb/ft2 at 45° F) ρ = density of water (1.94 slug/ft3 at 45° F) V = average pipe velocity (ft/s) Figure 9 was developed as a guide to identify operations where cavitation may occur. The red line plotted over the rating curve represents a cavitation index of 2.3 which signifies the onset of cavitation in the outlet pipe or bifurcation. Discharges to the left of the red line are expected to result in cavitation-free operation. Operations in the red zone above reservoir elevation 9,980-ft will likely result in cavitation and should be avoided. These operational limitations are based on the recent field test results and appear to be consistent with previous recommendations from the 1985 and 1990 test reports. However, the direct cause of cavitation in the Platoro outlet pipe (manhole, bifurcation, offset in pipe, etc.) could not be determined at this time which causes some uncertainty in predicting operational limitations. The noise and vibration reported in July 2019 occurred for operating conditions well within the normal operating range, which cannot be explained at this time. Additional flow and pressure measurements at a different reservoir elevation (preferably near 10,020-ft if possible) would help confirm the accuracy of both the updated rating curve and recommended operating limitations.
5. Conclusions and Recommendations:• An updated rating curve for both Jet Flow Gates at equal positions was developed based
on measurements from the August 16th test (Figure 4). This curve should be used in place of the original rating curves (drawing 253-D-421).
• Pipe wall stress and vibration measurements indicate that pipe shell vibrations are well within the acceptable range and no modifications or operational limitations are required due to pipe shell vibrations.
• Cavitation is likely the cause of vibration and noise of the 56-inch outlet pipe. While the specific locations could not be determined, cavitation may form near the manholes, bifurcation, or some other offset in the pipe.
• Figure 9 should be referenced for operational limitations to avoid potential cavitation in the outlet pipe and bifurcation. In the future, any observed excessive vibration or noise that occurs for any operating conditions should be reported.
• The interior of the outlet pipe and bifurcation should be inspected, particularly immediately downstream of both manholes and the bifurcation. Any apparent damage should be assessed to determine both the extent and the cause to help inform future maintenance, repair, or operational decisions. Personnel from Reclamation’s Technical Services Center can help with inspections or damage assessments if needed.
• Due to the uncertainty in the recommended operational limitations, an additional field test at a different reservoir elevation would be worthwhile to confirm both the updated rating curve and the proposed operational limitations. While a test near reservoir elevation 10,020 ft or higher would be preferred, testing at a lower reservoir elevation near 9,980 ft would also be beneficial. This could be an abbreviated version of the recent test, where strain gage measurements and draining the pipe would not be necessary. Discharge, pressure, and acceleration measurements could be acquired at jet flow gate openings near the point where cavitation is expected to occur.
6. Action correspondence initiated or required: N/A
7. Client feedback received: N/A
8. REFERENCES
[1] Bureau of Reclamation, "TR-85-17," United States Department of Interior, Denver, CO, 1985.
[2] Bureau of Reclamation, "TR-85-38," United States Department of Interior, Denver, CO, 1985.
[3] Bureau of Reclamation, "TR-90-10," United States Department of Interior, Denver, CO, 1990.
[4] Bureau of Reclamation, "Technical Record of Design and Construction," United States Department of Interior, Denver, CO, 1954.
[5] J. E. Shigley, C. R. Mischke and R. G. Budynas, Mechanical Engineering Design, New York, NY: McGraw - Hill, 2004, 7th edition.
[6] American Water Works Association, Steel Water Pipe - A Guide for Design and Installation- M11, American Water Works Association, Fourth Edition.
[7] H. T. Falvey, "Cavitation in Chutes and Spillways - Engineering Monograph No. 42," United States Department of Interior, Denver, CO, 1990.
[8] Bureau of Reclamation, "Travel Report - Platoro Conduit Inspection 2010 BW," TSC Hydraulic Equipment Group, United States Department of Interior, Denver, CO, 2011.
cc:
Anthony Vigil (ALB-629) Ken Rice (ALB-104) Nathan Coombes ([email protected]) Andres Quiniones (86-68420) Lucas Adams (86-68420)
SIGNATURES AND SURNAMES FOR:
Travel to: Platoro Dam
Dates of Travel: 14— 16 August 2019
Names and Codes of Travelers: Josh Mortensen 86-68560 and Jacob Carter-Gibb 86-68560
Author:
t:1-ph Mortensen, PJ.‘F{ydrau1ic Investigations and Laboratory Services Group
Reviewed:
Noted and Dated by:
2dtDate
Robert F. Einhellig, P.E., Manager ‘
Hydraulic Investigations and Laboratory Services GroupDate
Hydraulic Investigations and Laboratory Services Group
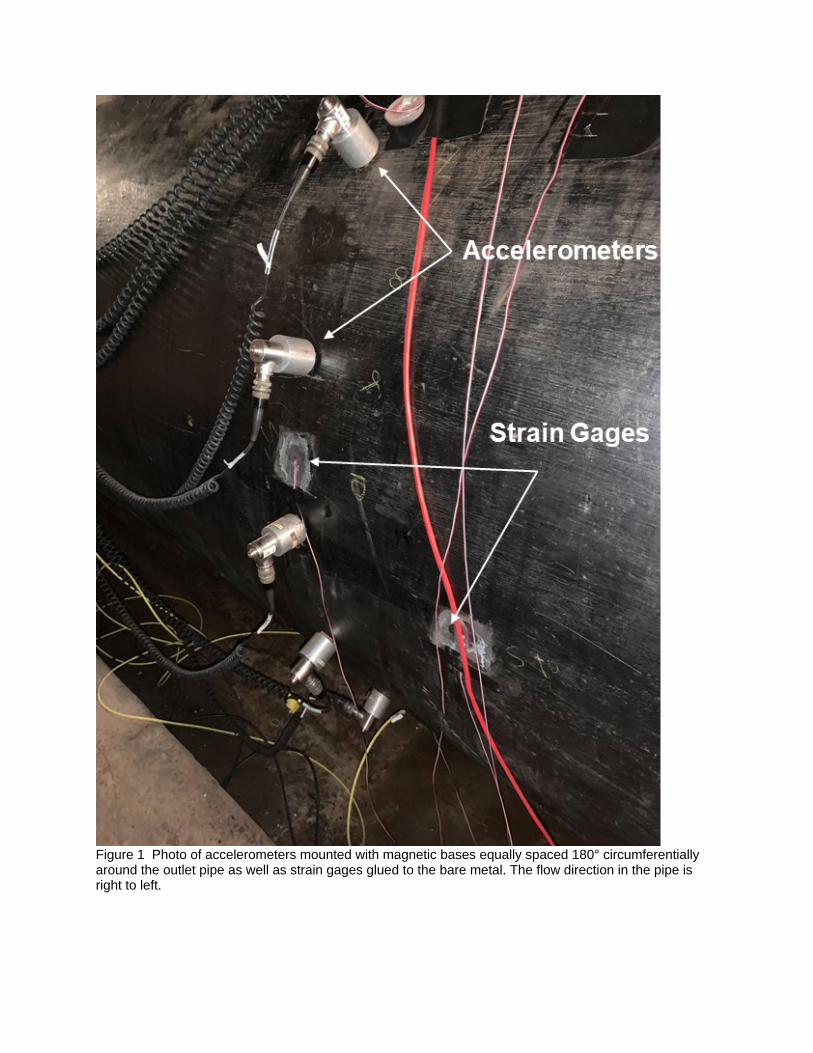
Figure 1 Photo of accelerometers mounted with magnetic bases equally spaced 180° circumferentially around the outlet pipe as well as strain gages glued to the bare metal. The flow direction in the pipe is right to left.
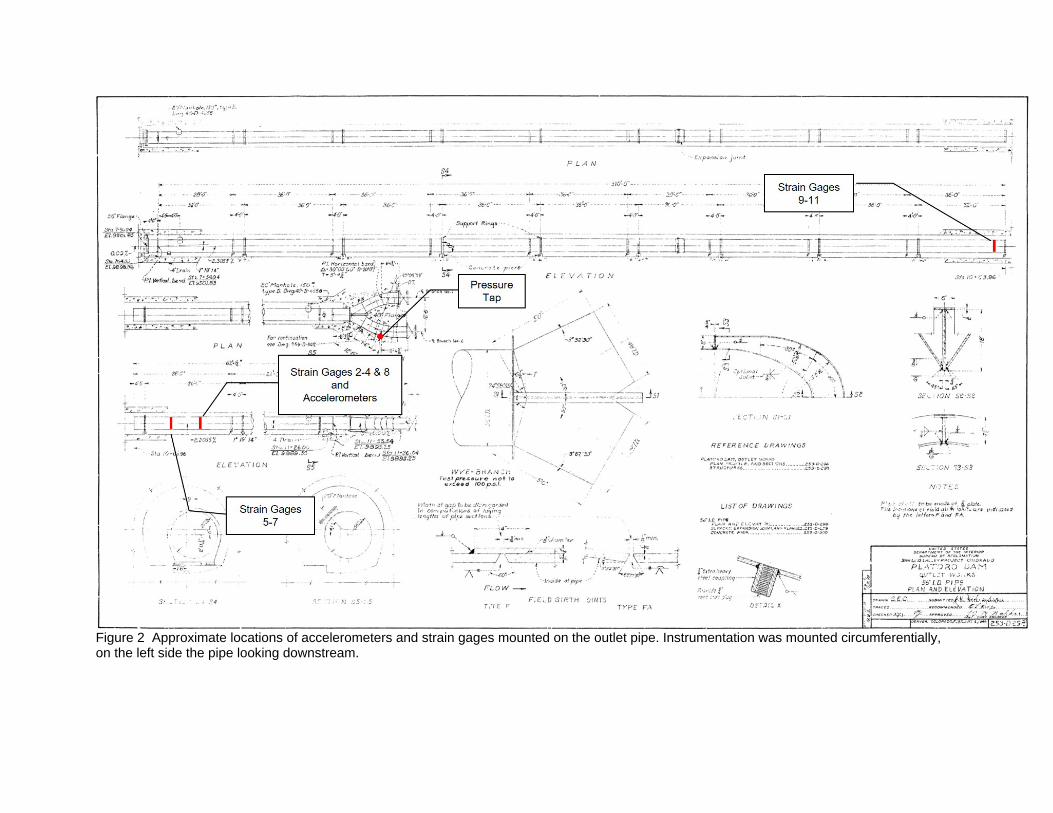
Figure 2 Approximate locations of accelerometers and strain gages mounted on the outlet pipe. Instrumentation was mounted circumferentially, on the left side the pipe looking downstream.
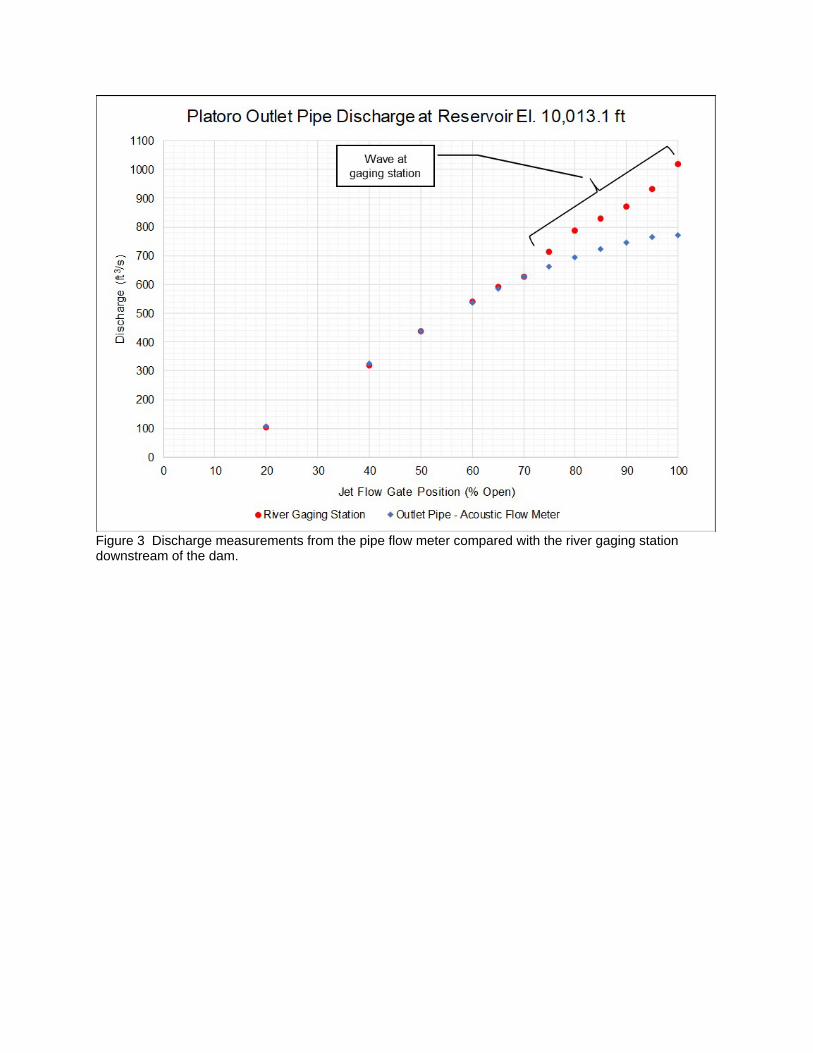
Figure 3 Discharge measurements from the pipe flow meter compared with the river gaging station downstream of the dam.
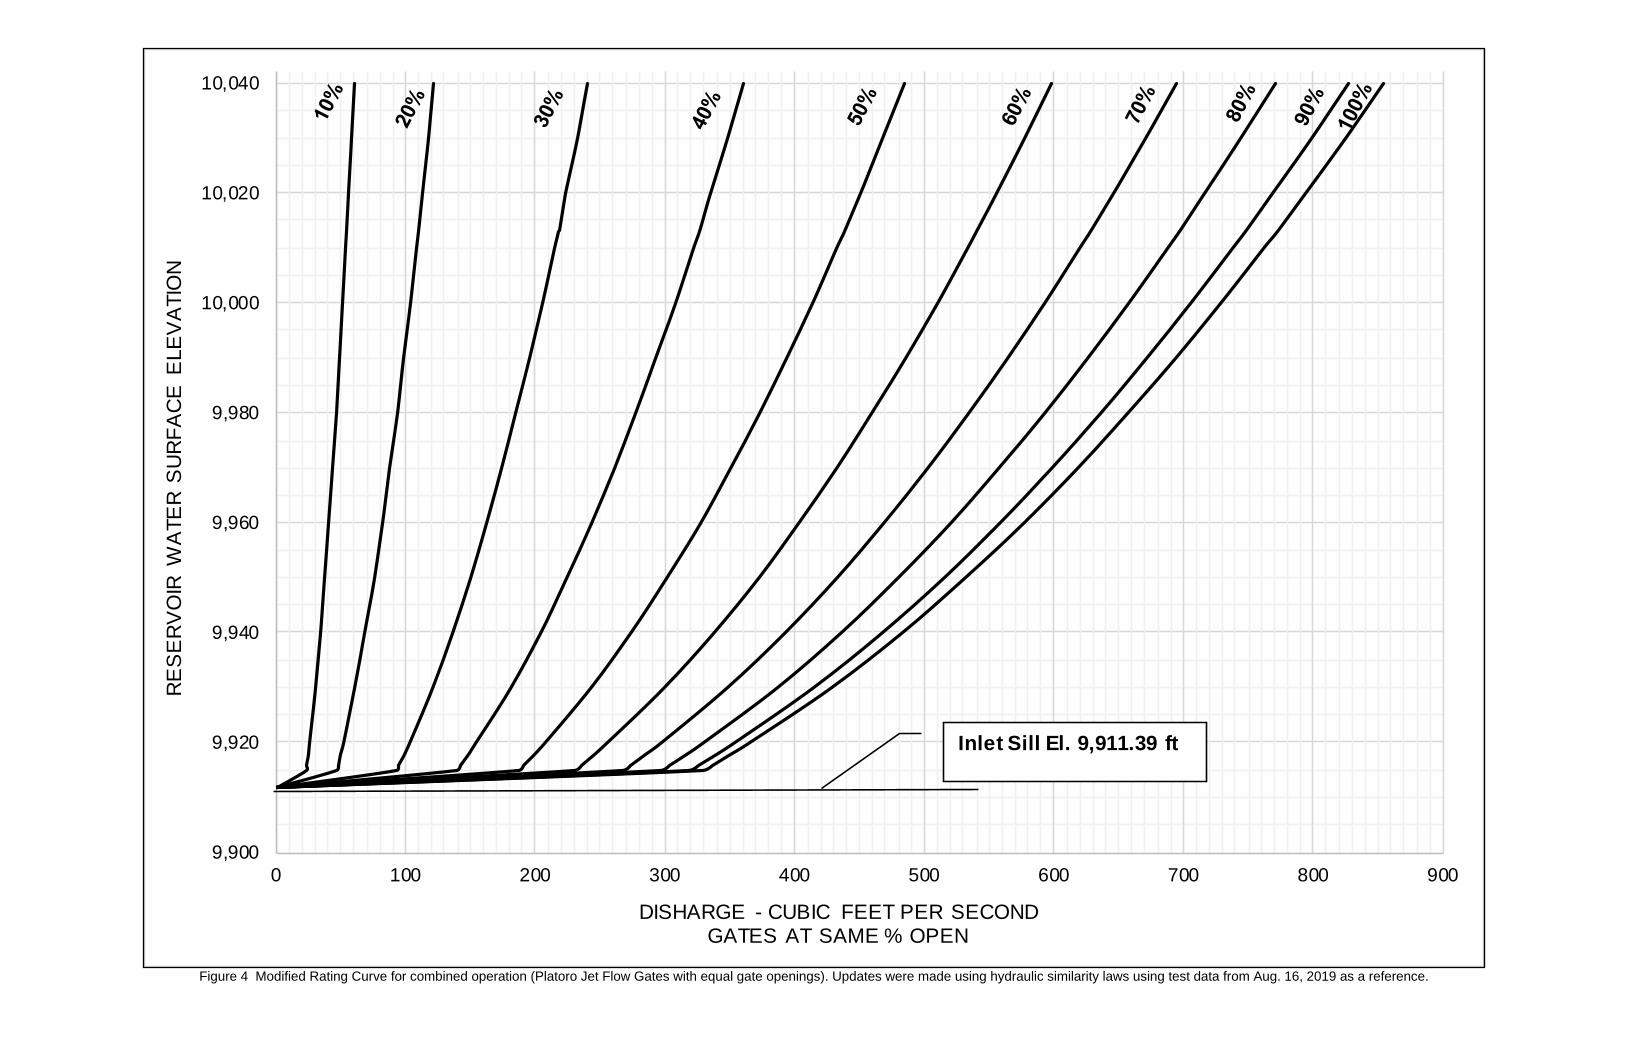
Figure 4 Modified Rating Curve for combined operation (Platoro Jet Flow Gates with equal gate openings). Updates were made using hydraulic similarity laws using test data from Aug. 16, 2019 as a reference.
9,900
9,920
9,940
9,960
9,980
10,000
10,020
10,040
0 100 200 300 400 500 600 700 800 900
RE
SE
RV
OIR
WA
TER
SU
RFA
CE
ELE
VA
TIO
N
DISHARGE - CUBIC FEET PER SECONDGATES AT SAME % OPEN
Inlet Sill El. 9,911.39 ft
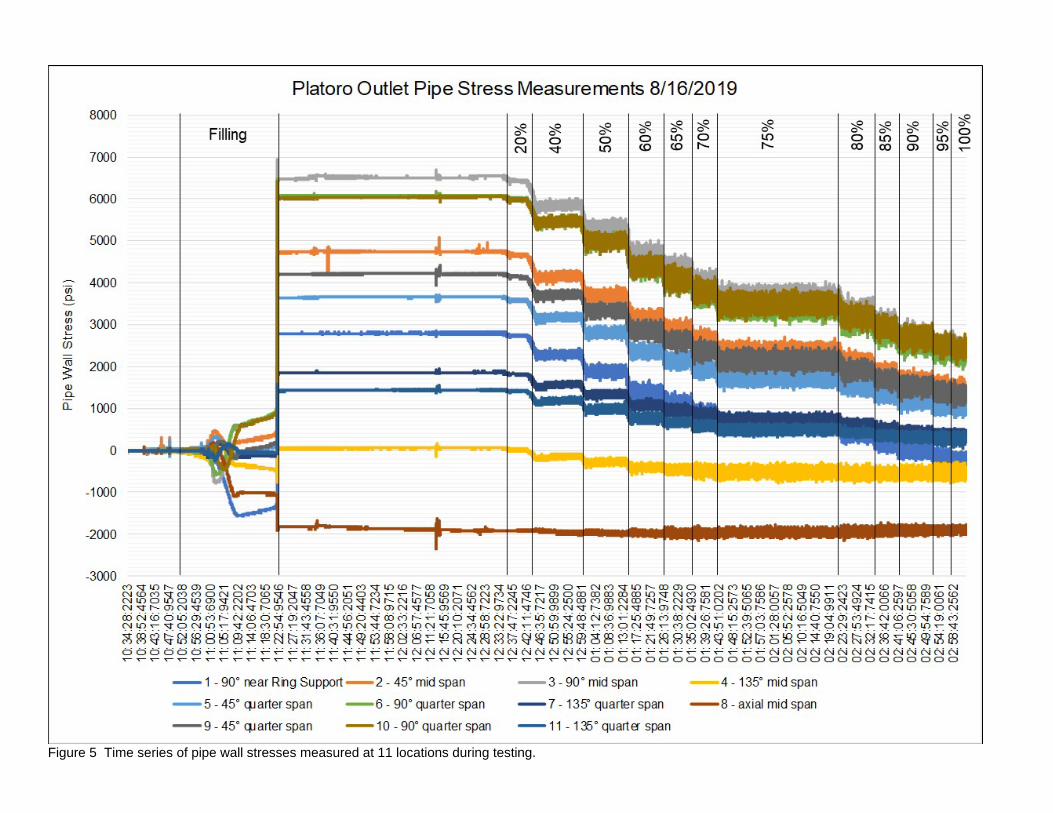
Figure 5 Time series of pipe wall stresses measured at 11 locations during testing.
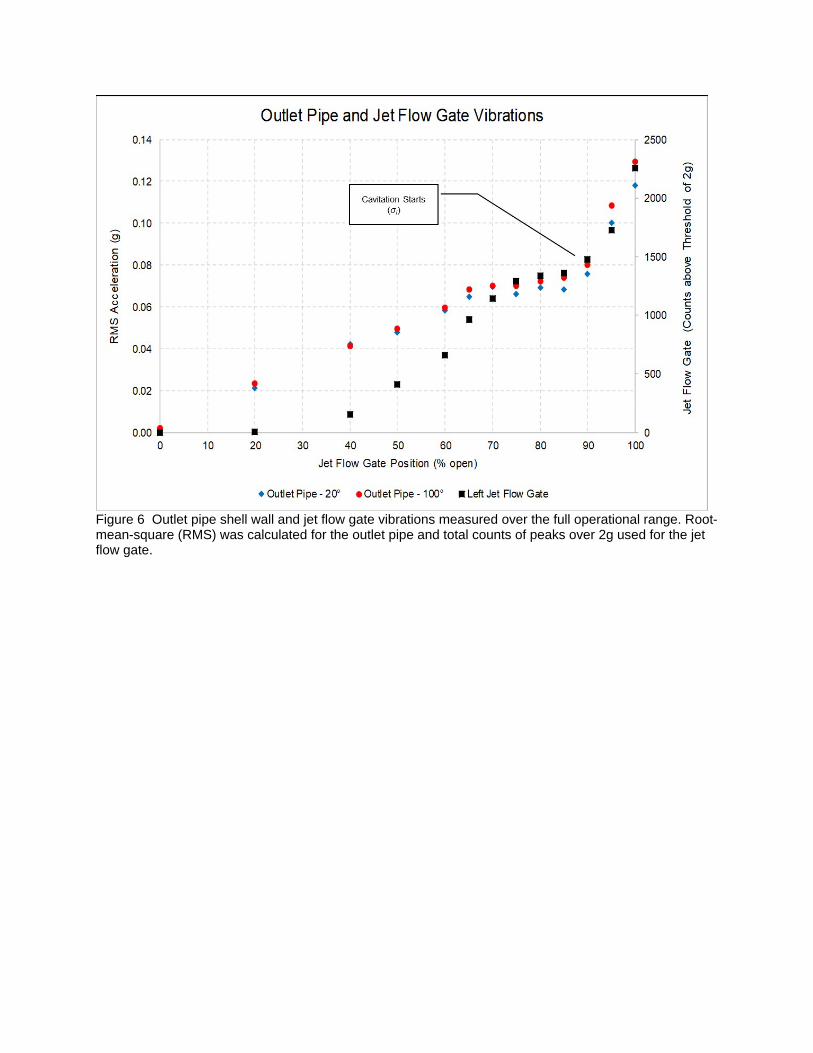
Figure 6 Outlet pipe shell wall and jet flow gate vibrations measured over the full operational range. Root-mean-square (RMS) was calculated for the outlet pipe and total counts of peaks over 2g used for the jet flow gate.
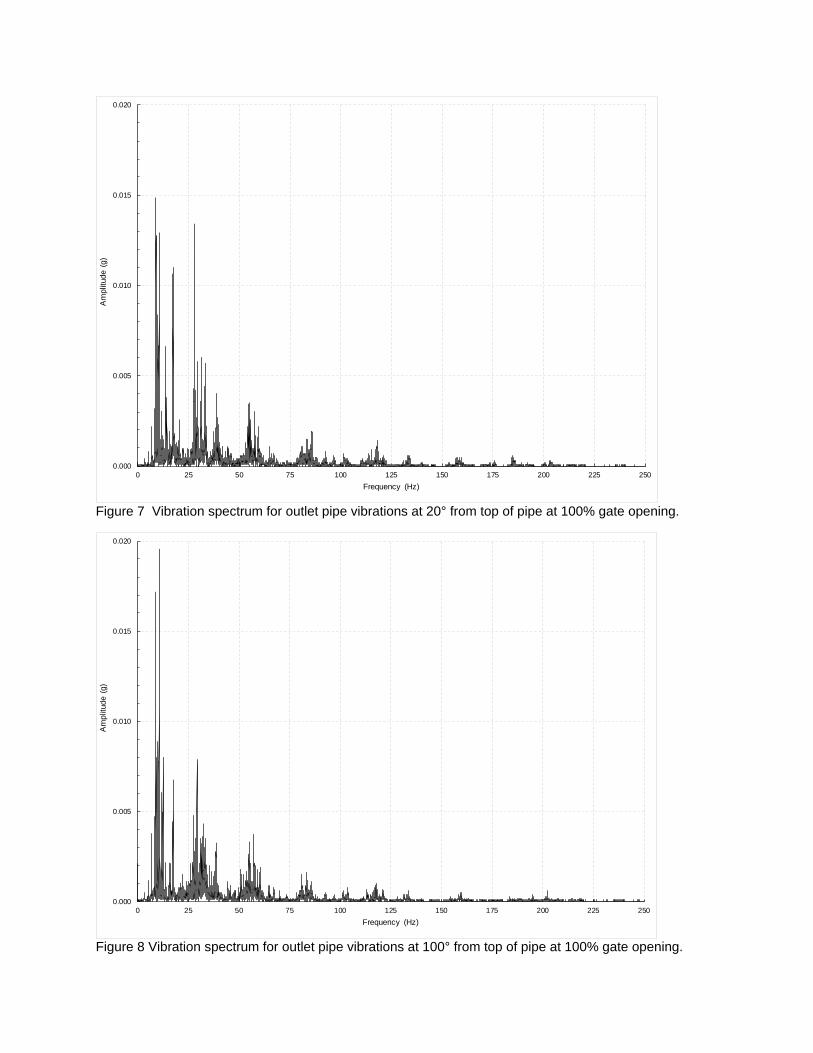
Figure 7 Vibration spectrum for outlet pipe vibrations at 20° from top of pipe at 100% gate opening.
Figure 8 Vibration spectrum for outlet pipe vibrations at 100° from top of pipe at 100% gate opening.
0.000
0.005
0.010
0.015
0.020
0 25 50 75 100 125 150 175 200 225 250
Am
plitu
de (
g)
Frequency (Hz)
0.000
0.005
0.010
0.015
0.020
0 25 50 75 100 125 150 175 200 225 250
Am
plitu
de (
g)
Frequency (Hz)
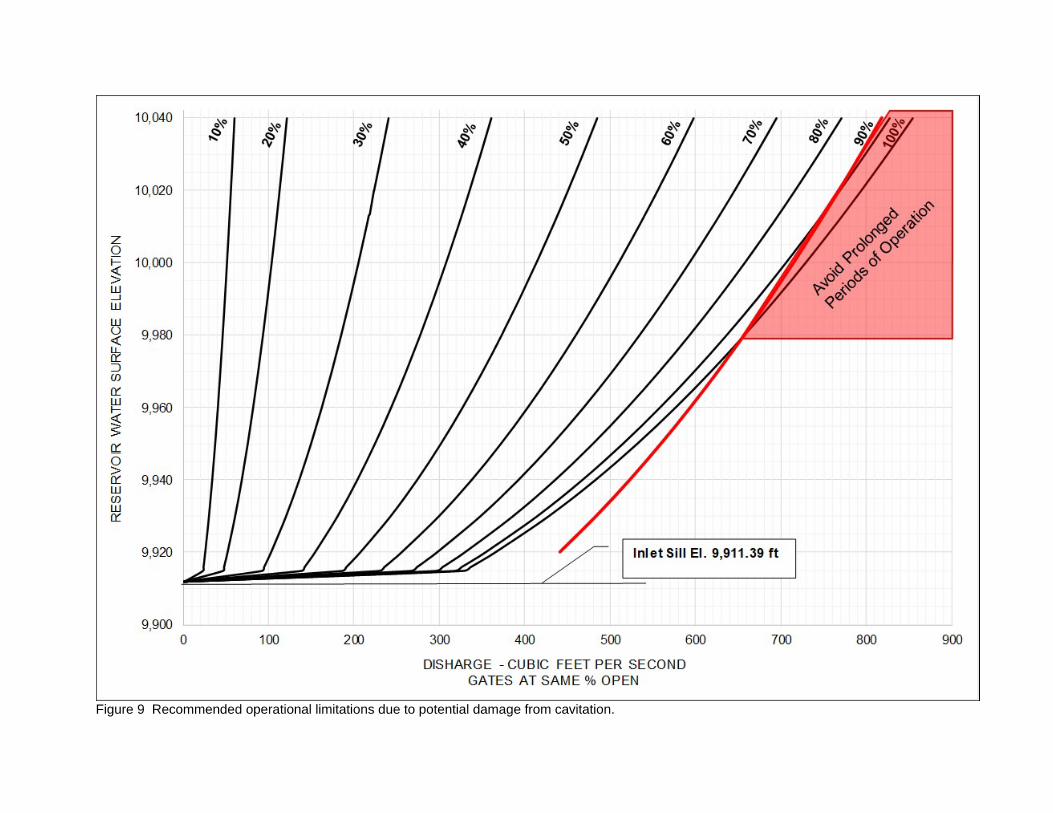
Figure 9 Recommended operational limitations due to potential damage from cavitation.