Platinum (Pt), Chromium (Cr), Vanadium (V), and Nickel (Ni ... · range and to enhance the...
32
57 Chapter 3 Combinatorial Doping of TiO 2 with Platinum (Pt), Chromium (Cr), Vanadium (V), and Nickel (Ni) to Achieve Enhanced Photocatalytic Activity with Visible Light Irradiation The text of this chapter has been accepted for publication in Journal of Materials Research Choi, J.; Park, H.; Hoffmann, M.R. July 2009.
Transcript of Platinum (Pt), Chromium (Cr), Vanadium (V), and Nickel (Ni ... · range and to enhance the...

57
Chapter 3
Combinatorial Doping of TiO2 with
Platinum (Pt), Chromium (Cr), Vanadium
(V), and Nickel (Ni) to Achieve Enhanced
Photocatalytic Activity with Visible Light
Irradiation
The text of this chapter has been accepted for publication in Journal of Materials Research Choi, J.; Park, H.; Hoffmann, M.R. July 2009.

58
Abstract
Titanium dioxide (TiO2) was doped with the combination of several metal ions
including platinum (Pt), chromium (Cr), vanadium (V), and nickel (Ni). The doped TiO2
materials were synthesized by standard sol-gel methods with the doping levels of 0.1 to
0.5 atom-%. The resulting materials were characterized by the X-ray diffraction (XRD),
BET surface-area measurement, Scanning Electron Microscopy (SEM), and UV-Vis
diffuse reflectance spectroscopy (DRS). The visible-light photocatalytic activity of the
co-doped samples was quantified by measuring the rate of the oxidation of iodide, the
rate of degradation of methylene blue (MB), and the rate of oxidation of phenol in
aqueous solutions at > 400 nm. 0.3 atom-% Pt-Cr-TiO2 and 0.3 atom-% Cr-V-TiO2
showed the highest visible-light photocatalytic activity with respect to MB degradation
and iodide oxidation, respectively. However, none of the co-doped TiO2 samples were
found to have enhanced photocatalytic activity for phenol degradation when compared to
their single-doped TiO2 counterparts.

59
Introduction
Titania (TiO2) is the most widely used photocatalyst for the purification of water, air,
and other environmental application because of its high photocatalytic activity, excellent
chemical stability, relatively low price, and its lack of any known toxicity. Redox
reactions of environmental interest are initiated on the TiO2 surface with trapped
electrons and holes after band-gap excitation. However, because of its wide band gap
energy of ~3.2 eV, TiO2 is active only in the ultraviolet portion of the solar spectrum. As
a consequence, significant efforts have been made to develop modified forms of TiO2 that
are active under visible-light ( > 400 nm) irradiation. Several different strategies have
been employed to extend photoactivity into the visible region. They include (i) doping
with anions (e.g., nitrogen,1-3 sulfur,4 iodine,5-7 and fluorine8), (ii) doping with metal
ions,9-18 and (iii) functionalizing TiO2 with photo-sensitizers that absorb visible-light.19,20
The most actively pursued strategy has been to increase the photoactive wavelength
range and to enhance the photocatalytic activity under UV irradiation by metal ion-
doping of TiO2.21-23 Numerous metal ions have been investigated as potential dopants
while several metal ions such as iron,9-11 vanadium,12-14 chromium,15,16 nickel,17 and
platinum18 have been reported to show visible-light photocatalytic activity.
In addition, efforts have been made to improve the visible-light photocatalytic activity
of TiO2 by co-doping with two metal ions.24-28 Ahmad et al. reported that Sc and Nb co-
doped TiO2 nanoparticles are relatively more photoactive for 2-chlorophenol degradation
under visible-light than the particles doped with Sc or Nb alone.25 Kato and Kudo showed
that TiO2 co-doped with Sb5+ and Cr3+ ions showed higher activity than TiO2 doped only
with Cr3+ ions alone for O2 evolution because of the charge compensation achieved with

60
Sb5+ doping.26 Furthermore, TiO2 co-doped with Ni2+ and Ta5+ (or Ni2+and Nb5+) and
TiO2 co-doped with Rh3+and Sb5+ were also shown to improve photocatalytic activity for
O2 evolution under visible-light irradiation.27,28 However, there have been relatively few
studies reported for double metal ion co-doping of TiO2, while TiO2 co-doped with two
nonmetallic elements (e.g., N and F co-doping,29,30 N and S co-doping31,32) or with metal
ions and nonmetallic elements33-39 (e.g., Cr and N co-doping35 Pt and N co-doping,36 V
and N co-doping,37 and Bi and S co-doping38) have been widely investigated.
In order to examine the efficacy of double-doping with metal ions, we have prepared
co-doped TiO2 with Pt4+ (or Pt2+), Cr3+, V3+, and Ni2+ ions and characterized their
physicochemical properties and photocatalytic activities for the bleaching and
degradation of methylene blue (MB), the oxidation of iodide to tri-iodide, and the
oxidative degradation of phenol in aqueous solution under visible-light irradiation ( >
400 nm).
Experimental
Sample Preparation
TiO2 nanoparticles were prepared by standard sol-gel methods. 5.0 mL of titanium
tetraisopropoxide (TTIP, Aldrich) was dissolved in 50 mL of absolute ethanol
(Mallinckrodt) and then added dropwise to 50 mL of distilled water adjusted to pH 1.5
with nitric acid under vigorous stirring at room temperature. After 24 hours, the resulting
transparent colloidal suspensions were evaporated using a rotary evaporator at 45 oC and
dried in the oven (70 oC) overnight. The resulting powders were calcined at 400 oC for 1
hour under air. Single or double-doped TiO2 samples (M-TiO2 or MM-TiO2) were

61
prepared by adding one or two metal precursors to the distilled water prior to the
hydrolysis of TTIP to give a doping level from 0.1 to 0.5 atomic % (at.%). Platinum
(Pt4+ and Pt2+), chromium (Cr3+), vanadium (V3+), and nickel (Ni2+) were selected as
metal-ion dopants in this study. PtCl4 (Aldrich), Pt(NH3)4(NO3)2 (Alfar Aesar), Cr(NO3)
3·9H2O (Aldrich), VCl3 (Aldrich), and Ni(NO3) 2·6H2O (Alfar Aesar) were used as
precursor reagents. Six different TiO2 samples were synthesized and co-doped with (i)
Pt4+ and Cr3+ ions (Pt(IV)-Cr-TiO2), (ii) Pt2+ and Cr3+ ions (Pt(II)-Cr-TiO2), (iii) Cr3+ and
V3+ ions (Cr-V-TiO2), (iv) Pt2+ and V3+ ions (Pt(II)-V-TiO2), (v) Pt2+ and Ni2+ ions (Pt(II)-
Ni-TiO2), and (vi) Cr3+ and Ni2+ ions (Cr-Ni-TiO2). In addition, a control sample without
doping was prepared along with singly-doped TiO2 (i.e., Pt(IV)-TiO2, Pt(II)-TiO2, Cr-
TiO2, V-TiO2, and Ni-TiO2) for comparison with co-doped TiO2.
Characterization
We used X-ray diffraction (XRD) to examine the crystal structures of synthesized
TiO2 particles by using a Philips diffractometer (X’pert Pro) with Cu-K radiation.
Brunauer-Emmett-Teller (BET) surface area measurement was carried out by using N2 as
the adsorptive gas (Micromeritics Gemini series). Scanning electron microscopic images
(SEM, LEO 1550VP model) were taken to investigate the morphology of TiO2 particles
and analysis of elemental composition was also performed with EDS (Energy Dispersive
X-ray Spectroscopy). Diffuse reflectance UV-Vis absorption spectra (DRS) of powder
samples were obtained using UV-Vis spectrometer (Shimadzu UV-2101PC) equipped
with a diffuse reflectance accessory.

62
Photocatalytic Activity Measurements
Photocatalytic activities of the synthesized TiO2 samples were quantified with respect
to rates of photo-bleaching and degradation of Methylene Blue (MB), the rates of
oxidation of iodide (I), and the rates of oxidative degradation of phenol (PhOH). The
individual photocatalyst powders were dispersed in distilled water to give a mass
concentration of 1 g L-1. An aliquot of the target substrate stock solution was then added
to the catalyst suspension to give the specific substrate concentration (e.g., [MB]0 = 10
M, [I]0 = 50 mM, and [PhOH]0 = 50 M). The reaction suspension pH was circum-
neutral. Before irradiation, the suspension was stirred in the dark for 30 min to obtain a
state of sorption equilibrium of the specific substrate on TiO2.
A high-pressure Hg(Xe) Arc lamp (500 W) was used as the light source. The light
beam emitted from the arc lamp was passed through an IR water filter and a UV cut-off
filter ( > 400 nm) before being focused onto a cylindrical Pyrex reactor through a quartz
window. The reactor was open to ambient air during most experiments. Time-sequenced
sample aliquots were collected from the reactor during the illumination for analysis and
filtered through a 0.45 m PTFE syringe filter to remove the TiO2 particles. Multiple
photolysis (and photocatalysis) experiments were performed under identical reaction
conditions to determine reproducibility.
The degradation rates and rate constants for MB loss during photocatalysis were
determined by measuring the absorbance of MB at 665 nm with a spectrophotometer
(Shimadzu UV-2101PC). For the photocatalytic oxidation of I, tri-iodide (I3), which is
the principal product of I oxidation in the presence of excess iodide ion, was
spectrophotometrically determined by measuring the absorbance at 352 nm. The

63
degradation of phenol in aqueous solution was measured using high performance liquid
chromatography (HPLC, HP 1100 series with C18 column).
Results and Discussion
Characterization of Single Metal Doped TiO2 (M-TiO2)
Singly-doped TiO2 (M-TiO2) samples were prepared by sol-gel synthesis where M =
Pt4+, Cr3+, V3+, and Ni2+. In order to compare the effect of oxidation state of Pt dopant,
TiO2 doped with Pt2+ ions was also prepared. Figure 3.1 shows the XRD patterns of the
singly-doped M-TiO2 samples at the doping level of 0.3 at.%. The XRD patterns were
consistent with the standard crystal structure of TiO2 (i.e., a mixture of anatase and rutile
phases) with no diffraction peaks associated with any of doped metals elements in the M-
TiO2 samples. This indicates that the doping process did not induce the formation of
separate impurity phases and that the specific dopant could be considered to be fully
incorporated into TiO2 lattice. Pt4+, Cr3+, and V3+ ions may be substituted into Ti site of
TiO2 because the ionic radii of dopants (Pt4+: 0.765 Å, Cr3+: 0.755 Å, and V3+: 0.78 Å)40
are similar to that of Ti4+ (0.745 Å).40 However, Ni2+ and Pt2+ ions are possibly located in
the interstitial position of the lattice rather than Ti site because of relatively large size
difference between dopant ions (Ni2+: 0.83 Å and Pt2+: 0.94 Å)40 and Ti4+ ions. Undoped
TiO2 samples prepared by sol-gel synthesis and calcined at 400 oC (TiO2-SG) showed
only the pure anatase phase. However, the rutile phase was apparent in some M-TiO2
samples prepared and treated at the same temperature. This result suggests that metal-ion
doping lowered relative temperature of the anatase-to-rutile phase transformation (A-R
phase transformation). 0.3 at.% Cr-TiO2 and 0.3 at.% Pt-TiO2 (both Pt(IV)-TiO2 and

64
Pt(II)-TiO2) exhibited a characteristic rutile peak whereas 0.3 at.% V-TiO2 appeared to
have a smaller fraction of the rutile phase. 0.3 at.% Ni-TiO2, by contrast, showed pure
anatase phase, as in the case of undoped TiO2. Therefore, we conclude that doping TiO2
with Cr, Pt, and V ions modifies the temperature dependence of the A-R phase
transformation.
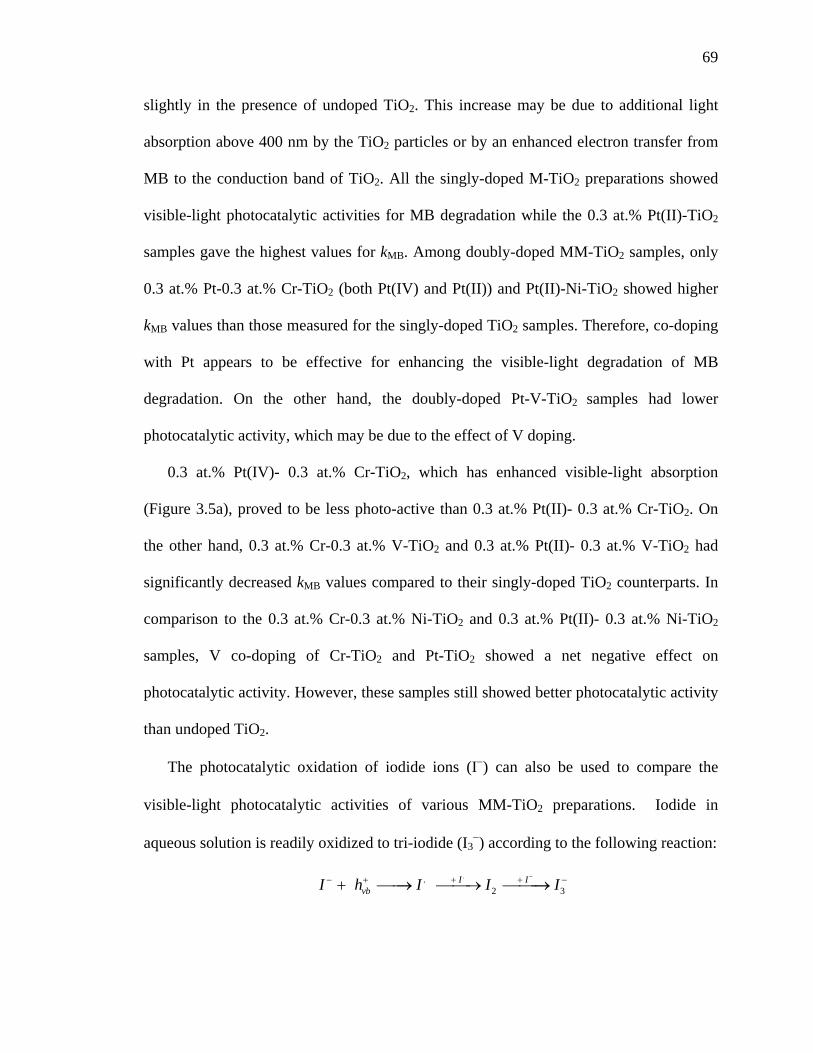
Figure 3.2 shows the UV/vis diffuse-reflectance spectra for the various M-TiO2
samples. Undoped TiO2 exhibited a sharp absorption edge at about 400 nm (Ebg ~ 3.1
eV). However, the M-TiO2 samples showed absorption spectra extended into the visible
region over the range of 400 ~ 700 nm. Thus, visible-light activation and photocatalytic
activity could be expected from these M-TiO2 samples. As shown in Figure 3.2a, 0.3 at.%
Ni-TiO2 gave a relatively small absorption between 400 and 500 nm while 0.3 at.% V-
TiO2 exhibited a more substantial and broader absorption shoulder up to 700 nm. 0.3 at.%
Cr-TiO2 also showed extended absorption spectra over the 400~500 nm range with an
additional absorption peak near 650 nm; this may be due to the d-d transitions of Cr3+
ions.26,41 Figure 3.2b shows the difference between the absorption spectra of 0.3 at.%
Pt(IV)-TiO2 and 0.3 at.% Pt(II)-TiO2. Pt(II)-TiO2 gave a broad absorption over most of
the visible region similar to 0.3 at.% V-TiO2. In contrast, 0.3 at.% Pt(IV)-TiO2 gave a
smaller absorption peak between 400 and 550 nm; this indicates that the origins of the
absorption spectra were different in the two different Pt-TiO2 samples. The extended
absorption of the M-TiO2 into the visible region has been explained in terms of the
excitation of electrons of dopant ion to TiO2 conduction band (i.e., a metal to conduction
band charge-transfer) according to their respective energy levels.12,13,42,43 However,
recent proposals suggest that the absorption spectra of modified TiO2 in the visible region

65
most likely originate from defects associated with oxygen vacancies that give rise to
colored centers.44,45 Kuznetsov and Serpone pointed out the similarities of the spectra in
the range of 400~600 nm shown among different types of visible-light-active TiO2
samples.44 It was also reported that similar absorption spectra in the visible region was
found in reduced TiO2 samples with observed absorption spectra being the sum of
overlapping absorption bands with the maxima at 2.81 eV and 2.55 eV, which correlate
with oxygen vacancies.46,47 The metal-ion dopants used in this study have different
valence states than Ti4+, and as a consequence, may induce the generation of oxygen
vacancies during synthesis. In addition, some of the M-TiO2 samples (e.g., Ni-TiO2, V-
TiO2, Pt(II)-TiO2) exhibited similar absorption in the range of 400~600 nm, even though
the absorption intensities were different. Therefore, both the generation of new energy
levels due to the injection of impurities within the bandgap energies range and the
generation of oxygen vacancies by metal doping may contribute to the observed visible
light absorption of M-TiO2 samples.
Characterization of metal co-doped TiO2 (MM-TiO2)
The properties of 0.3 at.% MM-TiO2 samples are summarized in Table 3.1. The
doubly-doped MM-TiO2 samples exhibited a variety of colors; TiO2 samples doped with
Cr or Ni are green; Pt doped samples are brown; and V doped samples are orange. The
BET surface area of the sol-gel synthesized, undoped TiO2, which was calcined at 400 oC,
was determined to be 104 cm2/g, whereas surface area of Degussa P25 TiO2 was
measured at 50 cm2/g, indicating that the TiO2 particles synthesized by sol-gel methods
have substantially higher surfaces areas and adsorption capacities per unit weight than

66
Degussa P25. The surface areas of 0.3 at.% M-TiO2 samples were found to be slightly
larger than the undoped TiO2 (106 ~ 132 cm2/g). However, there were no significant
increases in the surface areas of doubly-doped samples (~110 cm2/g).
XRD patterns of 0.3 at.% Pt(IV)- 0.3 at.% Cr-TiO2 and 0.3 at.% Cr-0.3 at.% Ni-TiO2
are shown in Figure 3.3 with XRD patterns of each singly-doped TiO2. Crystal structures
of all MM-TiO2 samples are also listed in Table 3.1 along with the BET surface areas.
Figure 3.3a shows that a rutile phase of Cr or Pt singly-doped TiO2 was well maintained
in doubly-doped Pt(IV)-Cr-TiO2 samples. In Figure 3.3b, however, 0.3 at.% Cr-0.3 at.%
Ni-TiO2 sample appeared to lack evidence for a rutile phase that was clearly shown in
singly-doped 0.3 at.% Cr-TiO2. Similarly, 0.3 at.% Pt(II)- 0.3 at.% Ni-TiO2 appeared to
be a pure anatase phase material in spite of 0.3 at.% Pt(II) doping. Therefore, we suggest
that co-doping with Ni ions may inhibit the A-R phase transformation in Cr-TiO2 or Pt-
TiO2.
For comparison, the fraction of rutile, XR, was calculated from the respective peak
intensities using the following equation:48
XR (%) = {1- (1 + 1.26IR/IA)-1} 100 (3.1)
where IR and IA are the X-ray intensities of the rutile (101) and anatase (110) peaks,
respectively. These relative rutile fractions are listed in Table 3.1. These results show
that the fraction of rutile (XR) in MM-TiO2 was not higher than that for each of M-TiO2
samples. For example, XR of 0.3 at.% Pt(IV)-Cr-TiO2 was estimated to be 32% while XR
of 0.3 at.% Pt(IV)-TiO2 and 0.3 at.% Cr-TiO2 were estimated as 26% and 34%,
respectively. Furthermore, 0.3 at.% Pt(II)- 0.3 at.% V-TiO2 and 0.3 at.% Cr-0.3 at.% V-

67
TiO2 had similar or lesser XR values than those of 0.3 at.% Pt(II)-TiO2, 0.3 at.% V-TiO2,
or 0.3 at.% Cr-TiO2.
Figure 3.4 shows SEM images of 0.3 at.% Pt-0.3 at.% Cr-TiO2. In Figure 3.4a, 0.3
at.% Pt(IV)- 0.3 at.% Cr-TiO2 particles were aggregated together and showed rough
morphologies. 0.3 at.% Pt(II)- 0.3 at.% Cr-TiO2 (Figure 3.4b) and other MM-TiO2
(images were not shown here) also showed SEM images similar to 0.3 at.% Pt(IV)- 0.3
at.% Cr-TiO2. Niishiro et al. reported that doping with Sb3+ ions in TiO2 suppressed
sintering due to the difference in size between Sb3+ (0.90 Å) and Ti4+, which resulted in
the formation of finer and smoother crystalline particles.28 However, in our case, the
doping of 0.3 at.% Pt2+ (0.94 Å) did not significantly change either the size of particle or
their morphologies (Figure 3.4b). This may be due to relatively low doping level (0.3 %
vs. 0.5~2 %) and a lower calcination temperature (400 oC vs. 1150 oC). In addition, the
EDS spectrum of 0.3 at.% Pt(II)- 0.3 at.% Ni-TiO2 (Figure 3.4c) shows that no apparent
signals for Pt and Ni; only those of Ti and O were observed. This indicates that metal
ions with larger ionic radii than Ti4+ such as Pt2+ or Ni2+ ions are well incorporated into
the TiO2 lattice and not located in the surface region; these results are consistent with
XRD results.
There were no significant differences between 0.3 at.% Pt(IV)- 0.3 at.% Cr-TiO2 and
0.3 at.% Pt(II)- 0.3 at.% Cr-TiO2 in terms of the XRD pattern, BET surface areas,
morphology, or element analysis as determined by EDS. However, UV/vis DRS results
clearly show the difference between two samples, as shown in Figure 3.5. 0.3 at.%
Pt(IV)- 0.3 at.% Cr-TiO2 shows an enhanced absorption compared to 0.3 at.% Pt-TiO2 or
0.3 at.% Cr-TiO2. The spectral response of 0.3 at.% Pt(IV)- 0.3 at.% Cr-TiO2 appears to
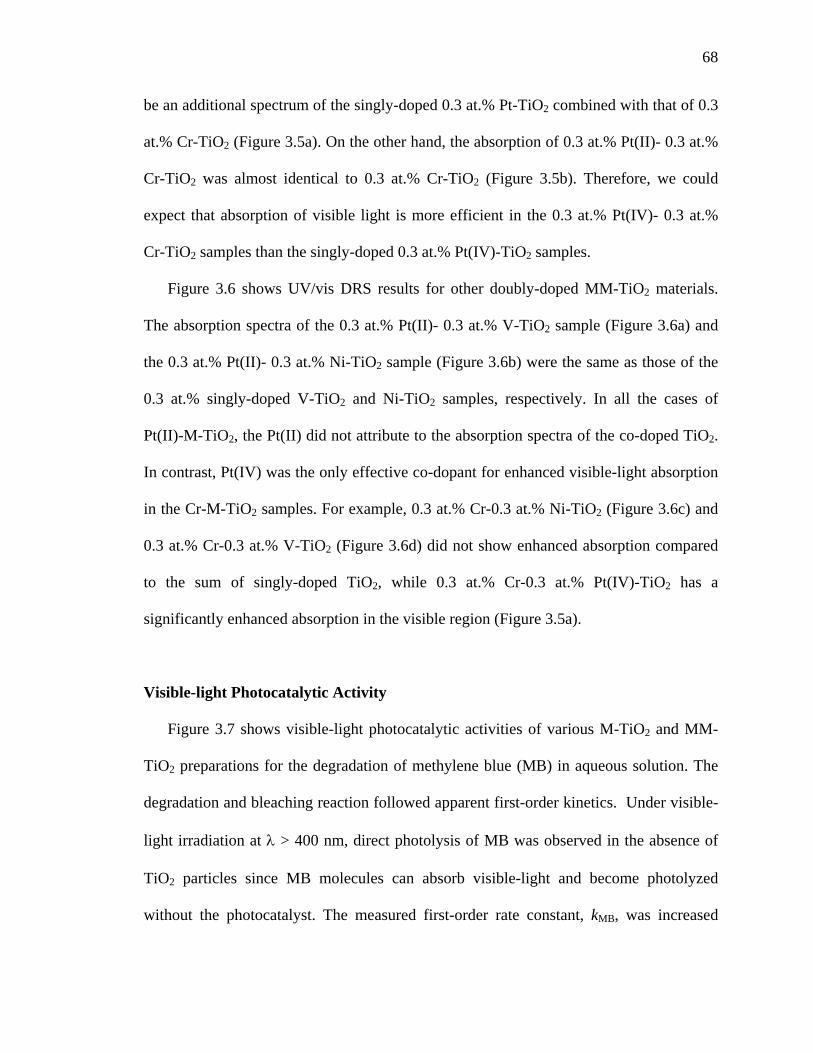
68
be an additional spectrum of the singly-doped 0.3 at.% Pt-TiO2 combined with that of 0.3
at.% Cr-TiO2 (Figure 3.5a). On the other hand, the absorption of 0.3 at.% Pt(II)- 0.3 at.%
Cr-TiO2 was almost identical to 0.3 at.% Cr-TiO2 (Figure 3.5b). Therefore, we could
expect that absorption of visible light is more efficient in the 0.3 at.% Pt(IV)- 0.3 at.%
Cr-TiO2 samples than the singly-doped 0.3 at.% Pt(IV)-TiO2 samples.
Figure 3.6 shows UV/vis DRS results for other doubly-doped MM-TiO2 materials.
The absorption spectra of the 0.3 at.% Pt(II)- 0.3 at.% V-TiO2 sample (Figure 3.6a) and
the 0.3 at.% Pt(II)- 0.3 at.% Ni-TiO2 sample (Figure 3.6b) were the same as those of the
0.3 at.% singly-doped V-TiO2 and Ni-TiO2 samples, respectively. In all the cases of
Pt(II)-M-TiO2, the Pt(II) did not attribute to the absorption spectra of the co-doped TiO2.
In contrast, Pt(IV) was the only effective co-dopant for enhanced visible-light absorption
in the Cr-M-TiO2 samples. For example, 0.3 at.% Cr-0.3 at.% Ni-TiO2 (Figure 3.6c) and
0.3 at.% Cr-0.3 at.% V-TiO2 (Figure 3.6d) did not show enhanced absorption compared
to the sum of singly-doped TiO2, while 0.3 at.% Cr-0.3 at.% Pt(IV)-TiO2 has a
significantly enhanced absorption in the visible region (Figure 3.5a).
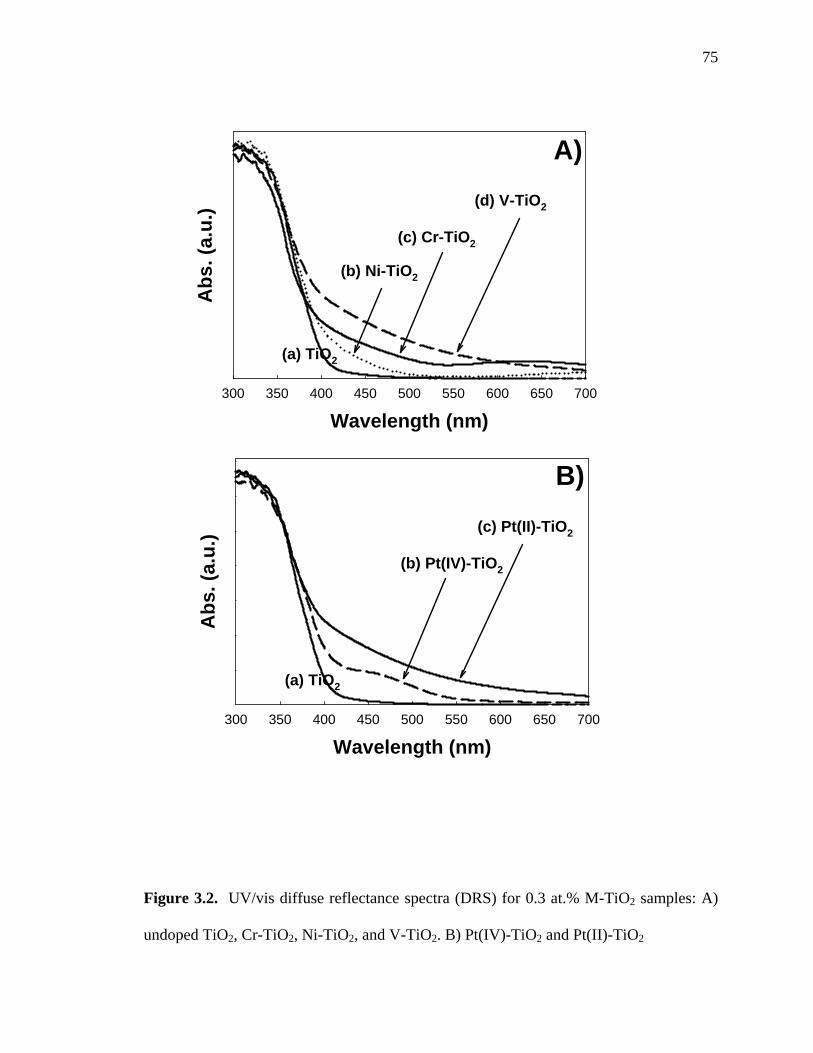
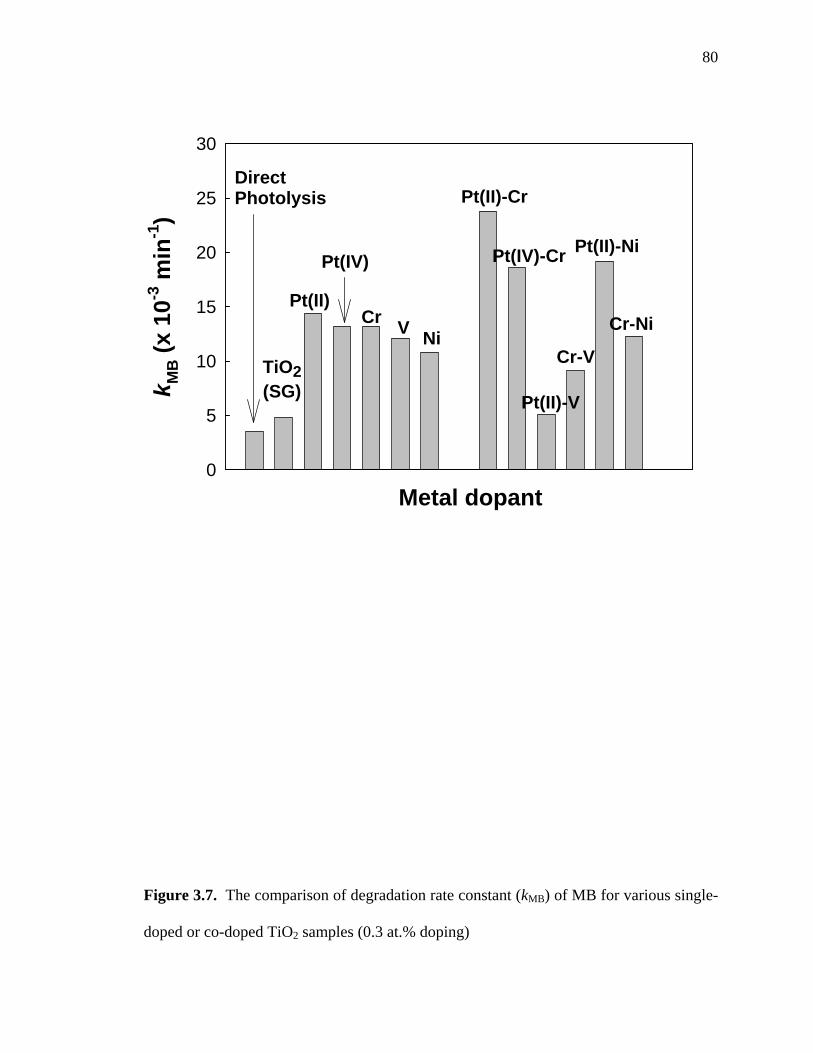
Visible-light Photocatalytic Activity
Figure 3.7 shows visible-light photocatalytic activities of various M-TiO2 and MM-
TiO2 preparations for the degradation of methylene blue (MB) in aqueous solution. The
degradation and bleaching reaction followed apparent first-order kinetics. Under visible-
light irradiation at > 400 nm, direct photolysis of MB was observed in the absence of
TiO2 particles since MB molecules can absorb visible-light and become photolyzed
without the photocatalyst. The measured first-order rate constant, kMB, was increased
69
slightly in the presence of undoped TiO2. This increase may be due to additional light
absorption above 400 nm by the TiO2 particles or by an enhanced electron transfer from
MB to the conduction band of TiO2. All the singly-doped M-TiO2 preparations showed
visible-light photocatalytic activities for MB degradation while the 0.3 at.% Pt(II)-TiO2
samples gave the highest values for kMB. Among doubly-doped MM-TiO2 samples, only
0.3 at.% Pt-0.3 at.% Cr-TiO2 (both Pt(IV) and Pt(II)) and Pt(II)-Ni-TiO2 showed higher
kMB values than those measured for the singly-doped TiO2 samples. Therefore, co-doping
with Pt appears to be effective for enhancing the visible-light degradation of MB
degradation. On the other hand, the doubly-doped Pt-V-TiO2 samples had lower
photocatalytic activity, which may be due to the effect of V doping.
0.3 at.% Pt(IV)- 0.3 at.% Cr-TiO2, which has enhanced visible-light absorption
(Figure 3.5a), proved to be less photo-active than 0.3 at.% Pt(II)- 0.3 at.% Cr-TiO2. On
the other hand, 0.3 at.% Cr-0.3 at.% V-TiO2 and 0.3 at.% Pt(II)- 0.3 at.% V-TiO2 had
significantly decreased kMB values compared to their singly-doped TiO2 counterparts. In
comparison to the 0.3 at.% Cr-0.3 at.% Ni-TiO2 and 0.3 at.% Pt(II)- 0.3 at.% Ni-TiO2
samples, V co-doping of Cr-TiO2 and Pt-TiO2 showed a net negative effect on
photocatalytic activity. However, these samples still showed better photocatalytic activity
than undoped TiO2.
The photocatalytic oxidation of iodide ions (I) can also be used to compare the
visible-light photocatalytic activities of various MM-TiO2 preparations. Iodide in
aqueous solution is readily oxidized to tri-iodide (I3) according to the following reaction:
..2 3
I IvbI h I I I

70
Figure 3.8 shows the production of I3 ions from I oxidation under visible-light
irradiation in the presence of doubly-doped MM-TiO2 materials. As a control
measurement, no I3 was produced in the absence of TiO2 particles at > 400 nm.
Undoped TiO2, 0.3 at.% V-TiO2, and 0.3 at.% Pt(II)-TiO2 showed little photo-catalytic
activity with respect to the net photooxidation of I to I3-. However, 0.3 at.% V-0.3 at.%
Cr-TiO2 and 0.3 at.% Pt(II)- 0.3 at.% Cr-TiO2 had higher photoactivities. Therefore, Cr
is clearly an effective co-dopant with respect to I photo-oxidation in the visible. I3
production is very fast during the initial phases of the reaction, but it slows noticeably as
irradiation continues. This is due to the back photo-reaction of I3 with conduction band
electrons to reform I ions. The back reaction effectively competes with the forward
reaction of iodide with valence-band holes or surface hydroxyl radicals as the
concentration of I3 increases with time.
In Figure 3.9, the photo-catalytic activities of the singly-doped M-TiO2 samples and
the doubly-doped MM-TiO2 samples are compared in terms of total amount of I3 ions
produced during 15 min of irradiation. Similar to MB degradation, all the M-TiO2
samples improved the Ioxidation rates; 0.3 at.% Pt(IV)-TiO2 and 0.3 at.% Cr-TiO2
showed the highest activity. However, 0.3 at.% Pt(II)-TiO2, 0.3 at.% V-TiO2, and 0.3
at.% Ni-TiO2, which had comparable activities to 0.3 at.% Pt(IV)-TiO2 or 0.3 at.% Cr-
TiO2 in terms of MB degradation, showed only slightly enhanced I oxidation rates. Most
of MM-TiO2 samples also showed some enhanced photocatalytic activity. 0.3 at.% Pt(II)-
0.3 at.% V-TiO2 had the least visible-light activity among the doubly-doped MM-TiO2
samples.

71
The doping level of each dopant in Pt(II)-Cr-TiO2 was also optimized. Table 3.2
shows photocatalytic activities of Pt(II)-Cr-TiO2 with different concentration of Pt and Cr
over the range of 0.1~0.5 atom-%. The optimal concentration for increased photocatalytic
activity was found to be 0.3 at.% Pt(II) and 0.3 at.% Cr, respectively. It was also
observed that photocatalytic activity with respect to I oxidation strongly depended on Cr
concentration.
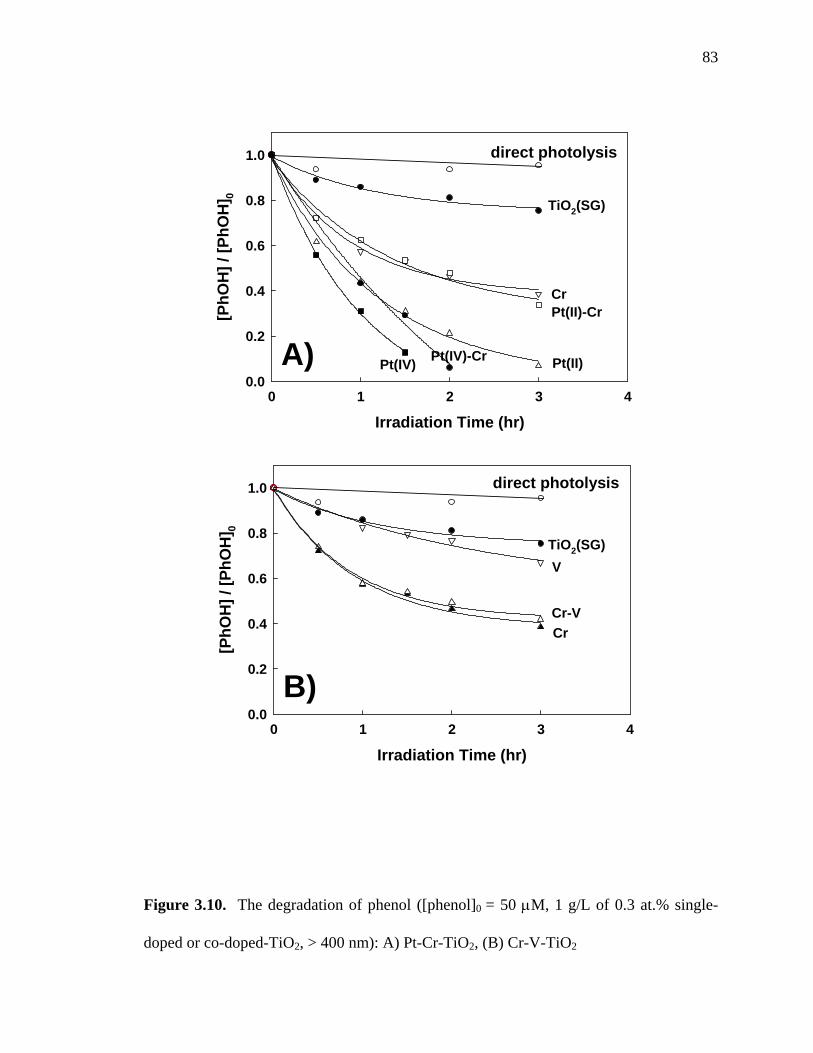
The photocatalytic degradation of phenol under visible-light irradiation is shown in
Figure 3.10. Phenol was degraded effectively with Pt-TiO2 (both Pt(IV)-TiO2 and Pt(II)-
TiO2) and totally degraded within 2 hr with 0.3 at.% Pt(IV)-TiO2. However, 0.3 at.% Pt-
0.3 at.% Cr-TiO2 did not exhibit any enhancement in the photo-degradation of phenol
(Figure 3.10a). Phenol degradation with 0.3 at.% Pt(IV)-TiO2 was slightly decreased by
Cr co-doping. Moreover, the resultant photocatalytic activity of 0.3 at.% Pt(II)- 0.3 at.%
Cr-TiO2 proved to be much less than 0.3 at.% Pt(II)-TiO2. Similarly, there was no
advantage shown by the doubly-doped Cr-V-TiO2 samples (Figure 3.10b). The other
doubly-doped MM-TiO2 samples, which are not shown here, also had negative co-doping
effects with respect to phenol degradation. These results clearly indicate that the co-
doping effects on TiO2 photo-catalytic activity are substrate-dependent. Several doubly-
doped MM-TiO2 samples showed enhanced photocatalytic activities for MB degradation
or I oxidation. For example, 0.3 at.% Pt(II)- 0.3 at.% Cr-TiO2 and 0.3 at.% Cr-0.3 at.%
V-TiO2 showed the highest visible-light photocatalytic activities for MB degradation and
I oxidation, respectively. However, there was no apparent enhancement observed for
doubly-doped TiO2 materials for phenol photo-degradation.

72
It is worth mentioning that photocatalytic activities of MM-TiO2 were observed
substrate-dependent and were not correlated with any physicochemical property of MM-
TiO2. Neither absorption spectra in the visible region nor the crystal structures (anatase
and rutile) of MM-TiO2 appeared to play an important role in the visible-light induced
photocatalytic reactions. For example, Pt(IV)-Cr-TiO2, which was expected more
efficient absorption of visible-light than Pt(II)-Cr-TiO2, showed less photocatalytic
activities than Pt(II)-Cr-TiO2 for both MB degradation and I oxidation. However, Pt(IV)-
Cr-TiO2 showed higher photocatalytic activity than Pt(II)-Cr-TiO2 for phenol degradation.
In addition, Pt(II)-V-TiO2 that has larger visible-light absorption than Pt(II)-Ni-TiO2
were less photo-active for MB degradation and I oxidation, as well. Similarly, structure
(i.e., the fraction of rutile) in MM-TiO2 did not affect to visible-light photocatalytic
activities of MM-TiO2. Pt(IV)-Cr-TiO2 with a high relative rutile content and Pt(II)-Ni-
TiO2 with no rutile at all showed comparable photocatalytic activities for MB
degradation. For I oxidation, Pt(II)-Ni-TiO2 and Cr-Ni-TiO2 also showed comparable
photocatalytic activities to Pt(II)-Cr-TiO2.
Conclusions
Two metal ions co-doped TiO2 was prepared by adding Pt (Pt4+ and Pt2+), Cr3+, V3+,
and Ni2+ ions during sol-gel synthesis. The metal-ion dopants used in this study were
effectively incorporated into TiO2 lattice either in Ti(IV) sites or in interstitial sites.
Single and double-ion doping changed some of the physicochemical properties such as
the reactive surface area and photophysical response of pristine TiO2. 0.3 at.% Pt-0.3
at.% Cr-TiO2 (both Pt4+ and Pt2+), 0.3 at.% Cr-0.3 at.% V-TiO2, and 0.3 at.% Pt-0.3 at.%

73
V-TiO2 samples lowered A-R phase transformation temperature, since the individual
dopant used for co-doping also had enhancing effect on A-R phase transformation.
However, 0.3 at.% Pt-0.3 at.% Ni-TiO2 and 0.3 at.% Cr-0.3 at.% Ni-TiO2 remained
strictly in the anatase phase due to Ni co-doping although doping with Pt and Cr alone
accelerated A-R phase transformation. All co-doped TiO2 materials gave extended UV-
vis absorption between 400 and 700 nm, but only 0.3 at.% Pt(IV)- 0.3 at.% Cr-TiO2
enhanced visible-light absorption compared to singly-doped TiO2. Visible-light
photocatalytic activities were evaluated for the degradation of MB, phenol and the
oxidation of I in aqueous solution. The photocatalytic activities of co-doped TiO2
strongly depended on the nature of the electron-donating substrate and were not
correlated with any physicochemical property of the co-doped TiO2. Pt-Cr-TiO2 and Pt-
Ni-TiO2 enhanced the rate of MB degradation while Pt-Cr-TiO2, Cr-V-TiO2, Pt-Ni-TiO2,
and Cr-Ni-TiO2 showed enhanced activity for I oxidation. However, none of the co-
doped samples showed enhanced photocatalytic activity for phenol degradation compared
to their singly-doped TiO2 counterparts. All co-doped TiO2 samples exhibited some
enhancement in photo-catalytic activity for all three reactions compared to undoped
nano-particulate TiO2.
Acknowledgement
We are grateful to the Hydrogen Energy Research & Development Center and 21st
Century Frontier Research and Development Program of the Ministry of Science and
Technology of Korea for research support.

74
o2Theta
25 30 35 40 45 50 55 60
Inte
nsi
ty (
a.u
.)
TiO2 (SG)
Pt-TiO2
Cr-TiO2
V-TiO2 RR
A
A AA
Ni-TiO2
Figure 3.1. X-ray diffraction (XRD) pattern measured for 0.3 at.% M-TiO2 prepared at
400 oC. (A: anatase phase, R: rutile phase)
75
Wavelength (nm)
300 350 400 450 500 550 600 650 700
Ab
s. (
a.u
.)
(b) Ni-TiO2
(a) TiO2
(c) Cr-TiO2
(d) V-TiO2
Wavelength (nm)
300 350 400 450 500 550 600 650 700
Ab
s. (
a.u
.)
(a) TiO2
(b) Pt(IV)-TiO2
(c) Pt(II)-TiO2
A)
B)
Figure 3.2. UV/vis diffuse reflectance spectra (DRS) for 0.3 at.% M-TiO2 samples: A)
undoped TiO2, Cr-TiO2, Ni-TiO2, and V-TiO2. B) Pt(IV)-TiO2 and Pt(II)-TiO2

76
o2Theta
25 30 35 40 45 50 55 60
Inte
nsi
ty (
a.u
.)
TiO2 (SG)
Pt-TiO2
Cr-TiO2
Pt-Cr-TiO2
R R
A
AA
A
o2Theta
20 30 40 50 60
Inte
nsi
ty (
a.u
.)
R
TiO2 (SG)
Cr-TiO2
Ni-TiO2
Cr-Ni-TiO2
A AA
A
R
Figure 3.3. X-ray diffraction (XRD) pattern measured for 0.3 at.% Pt-Cr-TiO2 and Cr-
Ni-TiO2. (A: anatase phase, R: rutile phase)

F
E
ot
Figure 3.4. S
EDS spectra
ther than Ti
SEM images
of Pt(II)-N
and O signa
s of (a) 0.3 a
i-TiO2 (c) t
als were not
at.% Pt(IV)-
that clearly
observed.
-Cr-TiO2, (b)
shows dopa
) 0.3 at.% Pt
ants signals
t(II)-Cr-TiO
(i.e., Pt and
77
O2 and
d Ni)

78
Wavelength (nm)
300 350 400 450 500 550 600 650 700
Ab
s. (
a.u
.)
a b cd
(a) TiO2 (SG)
(b) Pt(IV)-TiO2
(c) Cr-TiO2
(d) Pt(IV)-Cr-TiO2
A)
Wavelength (nm)
300 350 400 450 500 550 600 650 700
Ab
s. (
a.u
.)
ac,d
b
(a) TiO2 (SG)
(b) Pt(II)-TiO2
(c) Cr-TiO2
(d) Pt(II)-Cr-TiO2
B)
Figure 3.5. UV/vis diffuse reflectance spectra (DRS) for 0.3 at.% Pt-Cr-TiO2: A) Pt(IV)-
Cr-TiO2, B) Pt(II)-Cr-TiO2 samples

79
Wavelength (nm)
300 350 400 450 500 550 600 650 700
Ab
s. (
a.u
.)
abc,d
(a) TiO2 (SG)
(b) Pt(II)-TiO2
(c) V-TiO2
(d) Pt(II)-V-TiO2
A)
Wavelength (nm)
300 350 400 450 500 550 600 650 700
Ab
s. (
a.u
.)
abc,d
(a) TiO2 (SG)
(b) Pt(II)-TiO2
(c) Ni-TiO2
(d) Pt(II)-Ni-TiO2
B)
Wavelength (nm)
300 350 400 450 500 550 600 650 700
Ab
s. (
a.u
.)
a b
cd
(a) TiO2 (SG)
(b) Ni-TiO2
(c) Cr-TiO2
(d) Cr-Ni-TiO2
C)
Wavelength (nm)
300 350 400 450 500 550 600 650 700
Ab
s. (
a.u
.)
ab
c
d
(a) TiO2 (SG)
(b) Cr-TiO2
(c) V-TiO2
(d) Cr-V-TiO2
D)
Figure 3.6. UV/vis diffuse reflectance spectra (DRS) for A) 0.3 at.% Pt(II)-V-TiO2, B)
0.3 at.% Pt(II)-Ni-TiO2, C) 0.3 at.% Cr-Ni-TiO2, D) 0.3 at.% Cr-V-TiO2
80
Metal dopant
kM
B (
x 10
-3 m
in-1
)
0
5
10
15
20
25
30
TiO2(SG)
Pt(II)
VNi
Pt(II)-Cr
Cr
DirectPhotolysis
Cr-V
Pt(II)-V
Pt(II)-Ni
Cr-Ni
Pt(IV) Pt(IV)-Cr
Figure 3.7. The comparison of degradation rate constant (kMB) of MB for various single-
doped or co-doped TiO2 samples (0.3 at.% doping)

81
Irradiation Time (min)
0 4 8 12 16 20
[tri
-io
did
e ]
( M
)
0
10
20
30
40V-Cr-TiO2
TiO2 (SG)
Pt(II)-Cr-TiO2
Cr-TiO2
V-TiO2
Pt(II)-TiO2
Figure 3.8. The production of tri-iodide by iodide oxidation ([I-]0 = 50 mM, total volume
= 30 mL) with selected MM-TiO2 (0.3 at.% doping level, 1 g/L) under visible-light
irradiation (500 W, > 400 nm)

82
Metal Dopant
[tri
-io
did
e] a
fter
15
m (M
)
0
10
20
30
40
TiO2(SG)
Pt(II) V Ni
Pt(II)-Cr
Cr
Cr-V
Pt(II)-V
Pt(II)-Ni
Cr-Ni
Pt(IV) Pt(IV)-Cr
Figure 3.9. The comparison of various single-doped or co-doped TiO2 samples (0.3 at.%
doping) for I oxidation
83
Irradiation Time (hr)
0 1 2 3 4
[Ph
OH
] /
[Ph
OH
] 0
0.0
0.2
0.4
0.6
0.8
1.0 direct photolysis
Pt(IV)
Pt(II)-Cr
TiO2(SG)
Cr
Irradiation Time (hr)
0 1 2 3 4
[Ph
OH
] /
[Ph
OH
] 0
0.0
0.2
0.4
0.6
0.8
1.0 direct photolysis
Cr
V
TiO2(SG)
Cr-V
Pt(II)Pt(IV)-CrA)
B)
Figure 3.10. The degradation of phenol ([phenol]0 = 50 M, 1 g/L of 0.3 at.% single-
doped or co-doped-TiO2, > 400 nm): A) Pt-Cr-TiO2, (B) Cr-V-TiO2

84
TABLE 3.1. Characterization of MM-TiO2 photocatalysts at 0.3 at.% doping level
Sample Color Surface Area
(m2g-1)
Crystal structure
(XR %)
TiO2 (SG) White 104 Anatase (0)
Pt(II)-TiO2 Light brown 111 Anatase/Rutile (22)
Pt(IV)-TiO2 Light brown 106 Anatase/Rutile (26)
Cr-TiO2 Green 115 Anatase/Rutile (34)
V-TiO2 Orange 132 Anatase/Rutile (13)
Ni-TiO2 Green 112 Anatase (0)
Pt(II)-Cr-TiO2 Dark green 112 Anatase/Rutile (30)
Pt(IV)-Cr-TiO2 Dark green 108 Anatase/Rutile (32)
Cr-V-TiO2 Brown 115 Anatase/Rutile (28)
Pt(II)-V-TiO2 Brown 118 Anatase/Rutile (24)
Pt(II)-Ni-TiO2 Light green 110 Anatase (0)
Cr-Ni-TiO2 Green 115 Anatase (0)

85
TABLE 3.2. Photocatalytic activities of Pt(II)-Cr-TiO2 with different doping level for I- oxidation under visible-light irradiation (> 400 nm)
Sample [I3-]prod. (M) after 15 min
0.3 % Pt(II) with
0 % Cr
16
0.1 % Cr 19
0.2 % Cr 21
0.3 % Cr 36
0.5 % Cr 32
0.3 % Cr with
0 % Pt
29
0.1 % Pt 31
0.2 % Pt 28
0.3 % Pt 36
0.5 % Pt 32

86
References
(1) Asahi, R.; Morikawa, T.; Ohwaki, T.; Aoki, K.; Taga, Y. Science 2001, 293, 269.
(2) Mrowetz, M.; Balcerski, W.; Colussi, A. J.; Hoffman, M. R. J. Phys. Chem. B
2004, 108, 17269.
(3) Sauthier, G.; Gyorgy, E.; Figueras, A. J. Mater. Res. 2008, 23, 2340.
(4) Umebayashi, T.; Yamaki, T.; Tanaka, S.; Asai, K. Chem. Lett. 2003, 32, 330.
(5) Su, W. Y.; Zhang, Y. F.; Li, Z. H.; Wu, L.; Wang, X. X.; Li, J. Q.; Fu, X. Z.
Langmuir 2008, 24, 3422.
(6) Liu, G.; Chen, Z. G.; Dong, C. L.; Zhao, Y. N.; Li, F.; Lu, G. Q.; Cheng, H. M. J.
Phys. Chem. B 2006, 110, 20823.
(7) Hong, X. T.; Wang, Z. P.; Cai, W. M.; Lu, F.; Zhang, J.; Yang, Y. Z.; Ma, N.;
Liu, Y. J. Chem. Mater. 2005, 17, 1548.
(8) Zhou, J. K.; Lv, L.; Yu, J. Q.; Li, H. L.; Guo, P. Z.; Sun, H.; Zhao, X. S. J. Phys.
Chem. C 2008, 112, 5316.
(9) Zhang, X. W.; Lei, L. C. Mater. Lett. 2008, 62, 895.
(10) Zhang, X. W.; Zhou, M. H.; Lei, L. C. Catal. Commun. 2006, 7, 427.
(11) Teoh, W. Y.; Amal, R.; Madler, L.; Pratsinis, S. E. Catal. Today 2007, 120, 203.
(12) Iketani, K.; Sun, R. D.; Toki, M.; Hirota, K.; Yamaguchi, O. Mater. Sci. Eng., B
2004, 108, 187.
(13) Klosek, S.; Raftery, D. J. Phys. Chem. B 2001, 105, 2815.
(14) Wu, J. C. S.; Chen, C. H. J. Photochem. Photobiol., A 2004, 163, 509.
(15) Borgarello, E.; Kiwi, J.; Gratzel, M.; Pelizzetti, E.; Visca, M. J. Am. Chem. Soc.
1982, 104, 2996.

87
(16) Anpo, M.; Ichihashi, Y.; Takeuchi, M.; Yamashita, H. Sci. Technol. Catal. 1999,
121, 305.
(17) Kim, D. H.; Lee, K. S.; Kim, Y. S.; Chung, Y. C.; Kim, S. J. J. Am. Ceram. Soc.
2006, 89, 515.
(18) Kim, S.; Hwang, S. J.; Choi, W. Y. J. Phys. Chem. B 2005, 109, 24260.
(19) Park, H.; Choi, W.; Hoffmann, M. R. J. Mater. Chem. 2008, 18, 2379.
(20) Bae, E.; Choi, W. Environ. Sci. Technol 2003, 37, 147.
(21) Choi, W. Y.; Termin, A.; Hoffmann, M. R. J. Phys. Chem. 1994, 98, 13669.
(22) Chen, J. H.; Yao, M. S.; Wang, X. L. J. Nano. Res. 2008, 10, 163.
(23) Di Paola, A.; Garcia-Lopez, E.; Ikeda, S.; Marci, G.; Ohtani, B.; Palmisano, L.
Catal. Today 2002, 75, 87.
(24) Srinivasan, S. S.; Wade, J.; Stefanakos, E. K.; Goswami, Y. J. Alloys Compd.
2006, 424, 322.
(25) Ahmad, A.; Shah, J. A.; Buzby, S.; Shah, S. I. Eur. J. Inorg. Chem. 2008, 948.
(26) Kato, H.; Kudo, A. J. Phys. Chem. B 2002, 106, 5029.
(27) Niishiro, R.; Kato, H.; Kudo, A. Phys. Chem. Chem. Phys. 2005, 7, 2241.
(28) Niishiro, R.; Konta, R.; Kato, H.; Chun, W. J.; Asakura, K.; Kudo, A. J. Phys.
Chem. C 2007, 111, 17420.
(29) Huang, D. E.; Liao, S. J.; Quan, S. Q.; Liu, L.; He, Z. J.; Wan, J. B.; Zhou, W. B.
J. Mater. Res. 2007, 22, 2389.
(30) Li, D.; Haneda, H.; Hishita, S.; Ohashi, N. Chem. Mater. 2005, 17, 2588.
(31) Yu, J. G.; Zhou, M. H.; Cheng, B.; Zhao, X. J. J. Mol. Cat. A: Chem. 2006, 246,
176.

88
(32) Liu, H. Y.; Gao, L. J. Am. Ceram. Soc. 2004, 87, 1582.
(33) Sakatani, Y.; Ando, H.; Okusako, K.; Koike, H.; Nunoshige, J.; Takata, T.;
Kondo, J. N.; Hara, M.; Domen, K. J. Mater. Res. 2004, 19, 2100.
(34) Sakatani, Y.; Nunoshige, J.; Ando, H.; Okusako, K.; Koike, H.; Takata, T.;
Kondo, J. N.; Hara, M.; Domen, K. Chem. Lett. 2003, 32, 1156.
(35) Pan, C. C.; Wu, J. C. S. Mater. Chem. Phys. 2006, 100, 102.
(36) Kim, S.; Lee, S.-K. J. Photochem. Photobiol. A-Chem. 2009, 203, 145.
(37) Zhao, Z. Y.; Liu, Q. J. Catal. Lett. 2008, 124, 111.
(38) Wang, Y.; Meng, Y. L.; Ding, H. M.; Shan, Y. K.; Zhao, X.; Tang, X. Z. J. Phys.
Chem. C 2008, 112, 6620.
(39) He, Z. Q.; Xu, X.; Song, S.; Xie, L.; Tu, J. J.; Chen, J. M.; Yan, B. J. Phys. Chem.
C 2008, 112, 16431.
(40) Shannon, R. D. Acta Crystallogr., Sec. A 1976, 32, 751.
(41) Serpone, N.; Lawless, D.; Disdier, J.; Herrmann, J. M. Langmuir 1994, 10, 643.
(42) Umebayashi, T.; Yamaki, T.; Itoh, H.; Asai, K. J. Phys. Chem. Solids 2002, 63,
1909.
(43) Kudo, A.; Niishiro, R.; Iwase, A.; Kato, H. Chem. Phys. 2007, 339, 104.
(44) Kuznetsov, V. N.; Serpone, N. J. Phys. Chem. B 2006, 110, 25203.
(45) Serpone, N. J. Phys. Chem. B 2006, 110, 24287.
(46) Lisachenko, A. A.; Kuznetsov, V. N.; Zakharov, M. N.; Mikhailov, R. V. Kinet.
Catal. 2004, 45, 189.
(47) Kuznetsov, V. N.; Krutitskaya, T. K. Kinet. Catal. 1996, 37, 446.
(48) Spurr, R. A.; Myers, H. Anal. Chem. 1957, 29, 760.