PLASMA VOLUME DURING HEAT STRESS AND … · Plasma volume during heat stress and exercise in women...
30
AD-A174 W16 PLASMA VOLUME DURING HEAT STRESS AND EXERCISE IN o t (U) ARMY RESEARCH INST OF ENVIRONMENTAL MEDICINE NATICK MA L A STEPHENSON ET AL NOV 86 USARIER-M-i-87 U NLLASSIFE F/G 614 II
Transcript of PLASMA VOLUME DURING HEAT STRESS AND … · Plasma volume during heat stress and exercise in women...
AD-A174 W16 PLASMA VOLUME DURING HEAT STRESS AND EXERCISE IN o t(U) ARMY RESEARCH INST OF ENVIRONMENTAL MEDICINE NATICKMA L A STEPHENSON ET AL NOV 86 USARIER-M-i-87
U NLLASSIFE F/G 614
II
11110 2 2
IlUll Im .. : llILIII.a ILO
1ffl.2.5 au*
iICROCOPY RESOLUTION TEST CHARTNATIONAL BUREAU OF STANDARDS- 963-A
.%

Plasma volume during heat stress and exercise in women
Lou A. Stephenson and Margaret A. Kolka
U.S. Army Research Institute of Environmental Medicine
Natick, Massachusetts 01760-5007
Running title: Menstrual cycle effects on plasma volume D T ICELECTIDEC 5 198 3
Please address correspondence to:~Lou A. Stephenson
C; U.S. Army Research Institute of Environmental Medicine
Kansas Street
I.. Natick, Massachusetts 01760-5007
(617)STIUTION STATEMENT
Approved for public release;Distribution Unlrnmjrd
\ 86 12 05 039

UNCLASSIFIEDSECURITY CLASSIFICATION OF THIS PAGE
Form ApprovedREPORT DOCUMENTATION PAGE OMB No 0704-0186
I Exp Date Jun 30. 1986Ia. REPORT SECURITY CLASSIFICATION lb. RESTRICTIVE MARKINGS
2a. SECURITY CLASSIFICATION AUTHORITY 3. DISTRIBUTION /AVAILABILITY OF REPORT
.2b. DECLASSIFICATION/DOWNGRADING SCHEDULE Approved for public release; distributionis unlimited
4. PERFORMING ORGANIZATION REPORT NUMBER(S) S. MONITORING ORGANIZATION REPORT NUMBER(S)
/"/0- 86.. NAME OF PERFORMING ORGANIZATION 6b. OFFICE SYMBOL 7a. NAME OF MONITORING ORGANIZATIONU.S. Army Res Inst of Env Med (if aplicable) U.S. Army Research Institute of
GRD-U- Environmental Medicine
6c. ADDRESS (City, State, and ZIP Code) 7b. ADDRESS (City, State, and ZIP Code)Kansas Street Kansas StreetNatick, Massachusetts 01760-5007 Natick, Massachusetts 01760-5007
Ba. NAME OF FUNDING/SPONSORING 1b. OFFICE SYMBOL 9. PROCUREMENT INSTRUMENT IDENTIFICATION NUMBERORGANIZATION (If applicable)
Same as 6.a.
8c. ADDRESS (City, State, and ZIP Code) 10. SOURCE OF FUNDING NUMBERSPROGRAM PROJECT TASK WORK UNITELEMENT NO. NO. NO. ACCESSION NO
3E162777 1AR7Q 879/BD 127
11. TITLE (Include Security Classification)(U) Plasma volume during heat stress and exercise in women
12. PERSONAL AUTHOR(S)Lou A. Stephenson and Margaret A. Kolka
13a. TYPE OF REPORT 13b. TIME COVERED 14. DATE OF REPORT (Year, Month, Day) 15. PAGE COUNTManuscript FROM TO November 1986 23
16. SUPPLEMENTARY NOTATION
!N
1 . COSATI CODES 44 SUBJECT TERMS (Continue on reverse if necessary and identify by block number)FIELD GROUP SUB-GROUP Severe exercise, 44..ra.-cyete Follicular phase,
I Luteal phase, <
* ABSTRACT (Continue on reverse if necessary and identify by block number)To determine whether PV was affected by the menstrual yfle, we studied five women duringexercise and passive heating. The exercise bout (80% VO2 peak) on a modified cycle ergo-meter and the passive heat stress were done in a hot environment (T -16o)during the follicular and luteal phase. Esophageal temperature (Tes) was measured continu-ously,&- VOb was measured immediately after each blood sample, which was drawn after each0.2*C increase in Tes. Initial PV was estimated at rest during the follicular phase.PV changes from rest were calculated at each Tes from Hb and Hct. During passive heating,PV decreased by a mean volume of 156 (±80) ml to 2.83 (±0.09 ain the follicular phase.During the luteal phase, there was a larger volume reduction (300±lO0ml) during passiveheating, and the final PV was lower (2.47.± 0.18 ) than in the follicular phase. Duringexercise, PV decreased 463 (+90) ml to 2.50 ± 0.ll..in the follicular and 381(±70) ml to2.50 (±0.23)-in the luteal phase. These data indicate that there is a menstrual cycleeffect on PV during passive beating such that final PV is lower during the luteal phase.
(Cont'd on reverse)
20. DISTRIBUTION /AVAILABILITY OF ABSTRACT 21 ABSTRACT SECURITY CLASSIFICATION
XM UNCLASSIFIED/UNLIMITED n SAME AS RPT. 0 DTIC USERS UNCLAS A
22a. NAME OF RESPONSIBLE INDIVIDUAL 22b TELEPHONE (Include Area Code) 22c OFFICE SYMBOLLou Ann Stephenson, Ph.D. 617-651-5142 SGRD-UE-MEP
DD FORM 1473. 84 MAR 83 APR edition may be used until exhausted. SECURITY CLASSIFICATION OF THIS PAGEAll other editions are obsolete. UNCLASSIFIED
t, - - ,- .. ,, - " , -.,. .,- , .- , - , . . ,e . , , -.*.*% , ,,. _- -.. , . . . . , .
Block 19. (cont'd)
During severe exercise there is a greater PV loss during the follicular phase, yet thefinal PV is not different between phases.
-4e
A-0
2
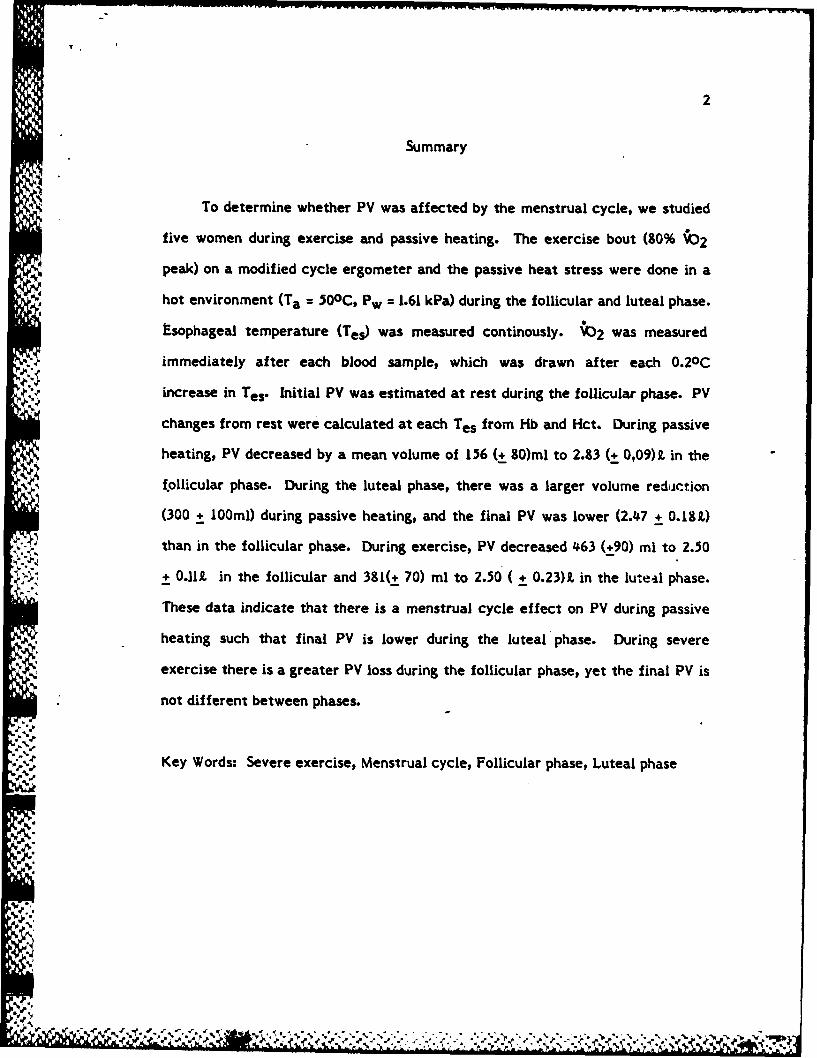
Summary
To determine whether PV was affected by the menstrual cycle, we studied
five women during exercise and passive heating. The exercise bout (80% bO2
peak) on a modified cycle ergometer and the passive heat stress were done in a
hot environment (Ta = 500C, Pw = 1.61 kPa) during the follicular and luteal phase.
Esophageal temperature (Tes) was measured continously. 02 was measured
immediately after each blood sample, which was drawn after each 0.20Cincrease in Tes. Initial PV was estimated at rest during the follicular phase. PV
changes from rest were calculated at each Tes from Hb and Hct. During passive
heating, PV decreased by a mean volume of 156 (+ 80)ml to 2.83 (+ 0,09)t. in the
follicular phase. During the luteal phase, there was a larger volume reduction
(300 + 100ml) during passive heating, and the final PV was lower (2.47 + 0.18.)
than in the follicular phase. During exercise, PV decreased 463 (+90) ml to 2.50
+ 0.11L in the follicular and 381(+ 70) ml to 2.50( + 0.23)A. in the luteal phase.
These data indicate that there is a menstrual cycle effect on PV during passive
- heating such that final PV is lower during the luteal phase. During severe
exercise there is a greater PV loss during the follicular phase, yet the final PV is
not different between phases.
Vol Key Words: Severe exercise, Menstrual cycle, Follicular phase, Luteal phase
.
p-p
.'5*.
-p% " . " '' % " .% " " " " " " " " ' " ° ! % '' " l

3
There are conflicting descriotions of the plasma volume response to heat
stress and exercise in women, even when the phase of the menstrual cycle has
been controlled (6,9,10,21,27,28). Wells and Horvath (27) reported that women
hemodiluted while resting in a hot environment (480C, 10% relative humidity),
and this response was unaffected by phase of the menstrual cycle. In a study
which had similar environmental conditions to that of Wells and Horvath, but
longer duration of heat stress, Senay (21) observed a hemoconcentration during
both the pre-ovulatory and post-ovulatory phases of the menstrual cycle.
During moderate exercise in a hot environment (48oC, 10% relative
humidity), no hemoconcentration was observed (28) during the follicular, pre-
ovulatory and luteal phases of the menstrual cycle. In a later report from the
same laboratory (6), both heat acclimated and non-acclimated women
hemoconcentrated after walking in a hot environment. Others have verified that
nemoconcentration occurred during cycle ergometer exercise in a hot
environment (9,10,23), although there are conflicting reports of whether the
phase of the menstrual cycle affects the degree of hemoconcentration. Fortney
and Senay (9) reported no menstrual cycle effects on the hemoconcentration
during exercise. Gaebelein and Senay (10) suggested that hemoconcentration
occurred less rapidly in the luteal phase than in the follicular phase during
moderate exercise. Previously (23), we observed a similar degree of
hemoconcentration based on pre- and post-exercise blood samples after women
exercised in a moderately hot environment in both the follicular and luteal
phase, but noted that absolute plasma volume based on pre- and post-exercise
blood samples after exercise was less during the luteal phase, which reflected
the lower initial plasma volume during the luteal phase.
Recently, there have been a number of preliminary reports describing
plasma volume fluctuations during the menstrual cycle (23,25,30). All three
4 -

4
laboratories reported lower plasma volume ;- rest during the mid-luteal phase,
than during the mid-follicular phase. Although there have been many
investigations studying the menstrual cycle effects on plasma volume loss during
exercise or heat stress (6,9,10,21,23,27,28), almost all (6,9,23,27,28) have
measured indices of plasma volume before and after the stress, rather than
during the stress, when the fluid exchange occurs.
The primary purpose of this study was to examine how the menstrual cycle
affected the dynamic plasma volume loss resulting from both exercise and
passive heat stress. Therefore, blood samples were drawn periodically
throughout the time of exercise or heat stress. A secondary intent of this study
was to determine whether hemoconcentration occurred in women subjected to a
passive heat stress after previous equilibration in a subjectively determined
"thermoneutral" environment.
Methods
Five healthy women (Table 1), who were not using oral contraceptive
agents, volunteered to serve as subjects for the protocol, which was previously
approved by an institutional review board. Each reported having a normal
menstrual cycle as defined by regular periodicity, and verified by a normal luteal
elevation in basal body temperature. All subjects were familiarized to the
experimental techniques prior to the study.
Four experiments were conducted during the winter on each subject. Two
experiments were conducted in which the subject was passively heated (Tg
50.40 C, P, = 1.61 kPa), one during the follicular phase (days 4-6) and one during
the luteal phase (days 19-22) of the menstrual cycle. In the other two
experiments, the subjects exercised at approximately 80% of the W02 peak
during both the follicular and luteal phase in the same environment as described
above. All experiments were in the morning, although the passive heating
/~~

5
experiments averaged three hours (178 min) long, while the exercise was
approximately 9 min. The subjects did not eat or consume caffeine for at least
8 h prior to the experiments, and were normally hydrated.
The subjects were dressed in shorts, singlet, socks and shoes during the
experiments. A separate room from the environmental chamber was used for
equilibration and instrumentation. The ambient temperature of this room was
adjusted so that each subject felt comfortable, and averaged 28.8oC, Pw =
0.8 kPa. The subject placed a catheter containing a thermocouple in her
esophagus at the level of the heart for the measurement of core temperature
(Tes). She drank approximately 170 ml of water while swallowing the Tes
thermocouple. She was weighed before sitting in a wheelchair. Skin
thermocouples were attached at 8 sites for skin temperature measurement.
Mean skin temperature (Tsk) was calculated by area weighting of each regional
skin temperature (11,19). A venous catheter was inserted into an arm vein.
After 30 min of equilibration, a blood sample was drawn (16 ml).
The subject was then transported in the wheelchair to the environmental
chamber. Resting Tes was measured before she entered the chamber. The
subject was wheeled directly next to the chair of a modified cycle ergometer
(3). She was instructed to closely maintain the seated position as she moved
between the two chairs.
During the passive heating experiments, blood samples were drawn each
time that Tes increased 0.2 0 C. The experiment was terminated after Tes had
increased 0.8oC or the subject complained of heat syncope. The average time of
the last blood sample taken from all subjects for the passive heating experiments
was 116 (+ 41) min during the follicular phase and 169 (+ 66) min in the luteal
phase.

6
During the exercise experiments, the subject began to cycle at
approximately 80% V02 peak within two minutes after entering the
environmental chamber. Blood samples were drawn each time that Tes increased
by 0.2 0 C (2.5 min intervals), until the Tes had increased by 0.80C. The average
time of the exercise experiment was 9 (+ 2) min, with no difference between
phases.
Blood volume was estimated by the method of Allen et al (1) using the
weight of the subject measured during the follicular phase in the passive heating
experiment. Plasma volume (PV) was calculated from the estimated blood
volume and hematocrit. In each blood sample, hemoglobin concentration (Hb) and
hematocrit (Hct) were measured. Relative changes in plasma volume during the
experiments were calculated from -lb and Hct (24). The pre-stress lb and Hct
were used to calculate the baseline plasma volume for the other three
experiments. Hemoglobin was measured using a hemoglobinometer (Coulter
Electronics). Plasma protein concentration (Pp) was measured by refractometry.
Plasma sodium (Na + ) and potassium (K+ ) concentrations were measured by ion-
selective analysis (Nova Biomedical) and total circulating protein (TCP) was
calculated from changes in Pp and PV.
Linear regression equations were calculated to describe the plasma volume
loss over time for each experiment. The slopes of the regression equations were
compared by a two-way analysis of variance across menstrual cycle phase and
method of heating. A one-way analysis of variance (16) with repeated measures
was used to compare resting PV and TCP during the follicular and luteal phases.
A three-way analysis of variance (Tes x menstrual cycle phase x time) with
repeated measures was used to compare PV, Pp, TCP and Osm (16). Tukey's test
of critical difference was used where appropriate. All differences are reported
at p < 0.05, unless otherwise noted.

7
Results
Table I shows the individual characteristics of the subjects. The normal
increase in core temperature (res) at rest during the luteal phase was observed
and averaged 37.25 + 0.230C, while Tes averaged 36.97 + 0.210C in the follicular
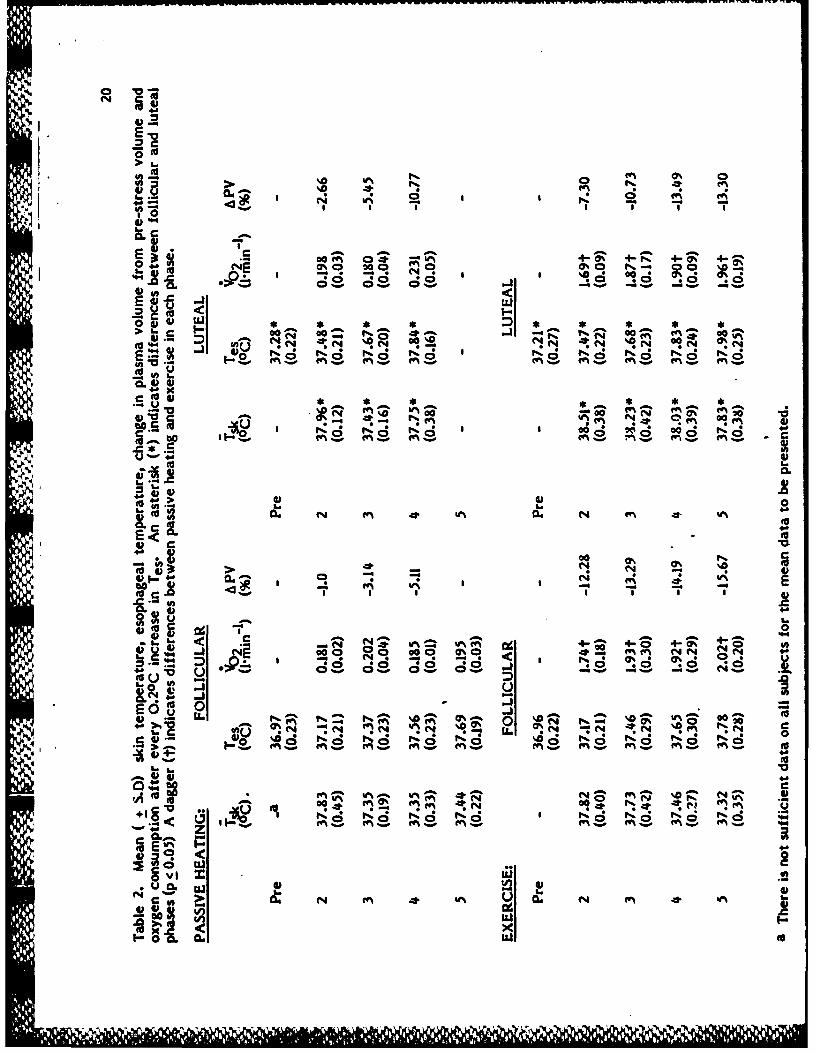
phase (Table 2).
None of the subjects was able to remain in the hot environment long
enough for the Tes to increase 0.80C during the luteal phase, even though the
exposure time was 46% longer in the luteal than in the follicular phase.
However, a final blood sample was drawn from two subjects after the core
temperature increased approximately 0.70C. The other three subjects were
unable to complete the experiment during the luteal phase. During the follicular
phase, the Tes increased 0.8 0 C in only three subjects, although the last blood
sample was drawn on a fourth subject when her Tes had increased approximately
0.7 0 c.
Mean resting plasma volume (Table 3) was lower during the luteal phase
(2.83 + 0.22 1) than the follicular phase (2.97 + 0.3 ). Plasma volume
decreased and plasma Na+ concentration increased with time of exposure to
either stress (Fig. I and 2, Table 3 and 4). Plasma K+ concentration increased
during exercise (Table 4) but did not change significantly during the passive
heating (Table 3). The passive heating stress resulted in a lower final PV during
the luteal phase (2.47 + 0.18 9.) than in the follicular phase (2.83 + 0.09 ).
Plasma volume fell rapidly during the first few minutes of exercise in both
phases (Fig. 3 and 4). Approximately 70% of the volume lost during exercise
occurred by the first blood sample. Plasma volume was weakly correlated with
TCP during exercise (r = 0.733). The final exercise plasma volume was not
different between menstrual cycle phases. However, the absolute volume lost
during exercise was 90 ml greater during the follicular phase. Although exercise
2Z, -ell %hz~eI

resulted in a more rapid loss in PV than during passive heating, the final PV
(2.5 2.) was not different from exercise in the luteal phase. On the other hand,
the final PV (2.83 ) during passive heating in the follicular phase was clearly
much higher than in the other three experiments (Table 3, Fig. 1).
The average time of the last blood sample taken from all subjects for the
passive heating experiments was 116 (+ 41) min during the follicular phase and
169 (+ 66) min in the luteal phase.The average time of the exercise experiment
was 9 (+ 2) min, with no difference between the phases.
There were no differences in sweating rate (calculated from change in body
weight) between menstrual cycle phases during passive heating and exercise.
The mean sweating rate during passive heating was 7.4 (+ 1.3) and 6.5 (+ 1.2)
gmin "1 in the follicular and luteal phase respectively. During exercise, sweating
rate was 16.9 (+ 3.6) and 17.2 (+ 2.8) g-min - 1 in the follicular and luteal phases
respectively.
Discussion
These experiments were designed to investigate whether the menstrual
cycle does affect plasma volume loss during an exercise or passive heating
stress. From indirect evidence, we hypothesized that there would be differences
during the menstrual cycle in the maintenance of PV during exercise or heat
4 stress. First, resting PV fluctuates during the menstrual cycle (23,25,30) and the
mechanism by which PV is regulated at these various volumes might also
influence PV dynamics during stress. Secondly, there are differences between
menstrual cycle phases in the fluid volume regulatory hormones (2,7,12,15,22).
Specifically, aldosterone concentration (12,15) and plasma renin activity (15) are
increased during the luteal phase, and plasma vasopression concentration has
been reported to fluctuate throughout the menstrual cycle (7), although others
(22) have failed to detect significant differences in plasma vasopressin. The
* . . N

9
luteal elevation in plasma aldosterone concentration and plasma renin activity
persists during exercise (unpublished observations) and might influence plasma
volume dynamics. Furthermore, both basal plasma osmolality and the plasma
osmolality at the onset of thirst is lower in luteal phase of the menstrual cycle
(2,22). There is also a decreased osmotic threshold for release of vasopressin and
a lower sensitivity of the plasma vasopressin (pAVP) : plasma osmolality (pOsm)
relationship during the luteal phase (2,22). The change in the sensitivity of the
pAVP : pOsm relationship during the luteal phase could also change fluid volume
dynamics during exercise.
Resting plasma volume was larger during the mid-follicular phase than in
the mid-luteal phase (Figs. I and 2, Tables 3 and 4). A lower basal plasma
osmolality has been reported during the luteal phase (2,22) however, the subtle
changes in the osmoregulation of vasopressin during the luteal phase may not be
adequate to explain the lower plasma volume that was observed in this study.
We have observed previously (unpublished observations) that both plasma
aldosterone and plasma renin activity are elevated at rest (350C) during the
luteal phase, which may be a consequence of the lower plasma volume during the* luteal phase. Increased plasma aldosterone (12,15) and plasma renin activity (15)
during the luteal phase may be another part of the fluid volume homeostatic
mechanism. Although plasma protein concentration was not different between
the two phases in the present study, the total circulating protein in the plasma
was significantly lower in the luteal phase (Tables 3 and 4) which is a further
indication that the lower plasma volume during the luteal phase is the result of
fluid volume homeostasis.
During passive heating, there are conflicting reports about blood volume
responses in women. Senay (21) reported that females hemoconcentrated during
a 10 hour exposure to a hot environment, while Wells and Horvath described a
hemodilution after a shorter duration exposure to a similar environment (27).
..",

10
It has been suggested recently (13) that postural effects may have
confounded Wells and Horvath's interpretation of hemodilution during heat
exposure in women (27). In the current investigation, the initial blood sample
was drawn after the subject had equilibrated in a wheel chair at a comfortable
amDient temperature. As described in METHODS, precautions were taken to
minimize postural disturbances after the initial blood sample was drawn. Our
observation that women hemoconentrate during passive heating after
equilibration in a subjectively determined "thermoneutral" room, lends credence
to Harrison's suggestion (13) and confirms the work of Senay (21).
During these passive heating experiments the PV dynamics appear to be
different between phases. Although initial PV was lower during the luteal phase,
there was a more rapid decrease in PV per incremental change in Tes than
occurred in the follicular phase (Fig. 1, Table 3). In other woris, the normal
increase in resting Tes during the luteal phase, (approximately 0.30C) was
associated with a greater PV loss during passive heating. The disproportionately
large decrease in PV in the time that Tes increased from 37.6 to 37.8 0 C (Fig. 1)
indicates that more fluid was lost from the vasculature during that time than
during any previous 0.20C increase in Tes. Increased sweating rate or
respiratory water loss might explain the greater volume of plasma lost at that
time since evaporative heat loss would be the only avenue of heat dissipation in
this environment. Figure 2 demonstrates that this apparent difference in PV
4dynamics between phases is not seen when PV is presented as a function of time.
Although the slopes of the individual PV : time relationships were not
statistically different between menstrual cycle phases, there was a greater
(1.65x) mean PV loss per unit time during the luteal phase. The final PV (0.60C
increase in Tes) during passive heating was lower in the luteal than in the
follicular phase. However, the heat exposure lasted 53 min longer in order to
. _,

i.1
increase Tes 0.6C in the luteal phase. Plasma volume may be maintained at a
higher level during the follicular phase even if the time of heat exposure is
similar. For example, Fig 2 shows that at the time of the last blood sample
during the follicular phase, plasma volume is considerably greater than during
the luteal phase. It must be assumed that the forces opposing the fluid
exchange from the vasculature are consistent during passive heating. Thus, the
same homeostatic mechanism which results in a lower plasma volume at rest
during the luteal phase is also operating during passive heating. One contributing
factor could be the lower sensitivity of pAVP : pOsm (2,22) during the luteal
phase.
The lower absolute PV after passive heating may simply be a consequence
of a greater degree of venous pooling. However, it is also possible that there are
hormonal as well as temperature influences. Estradiol has been reported to
block the release of NE at the neuron, preventing the catecholamine from
reaching the 0-adrenoreceptor in vascular tissue (26). The higher circulating
estradiol after ovulation may be effectively attenuating the release of
norepinephrine at the post-junctional receptors. Consequently, the vascular
smooth muscle may be less contractile during the luteal phase which might
explain the greater net filtration during passive heating and lower initial PV, as
well as increased venous pooling.
The menstrual cycle effects on PV dynamics are somewhat different
between exercise and passive heating. During exercise there is a rapid decrease
in PV in women which is dynamically similar to men (8). PV declines slightly
faster in the follicular phase (Figs. 3 and 4) but PV loss per unit time was not
statistically different from the luteal phase. Gaebelein and Senay (10) reported
a more rapid decrease in PV during low intensity cycle ergometer exercise in the

12
follicular phase. The high exercise intensity used in the current study may have
obscured this effect on vascular dynamics which occurs during low intensity
exercise. The much greater stress in this study would be expected to greatly
elevate plasma catecholamines in comparison to moderate exercise (5). Higher
concentrations of circulating catecholamines during severe exercise would be
associated with a greater capillary filtration pressure and consequently increase
the amount of fluid lost from the vascular compartment (29). The higher
concentration of circulating catecholamines also could alter distribution of the
blood volume such that perfusion of various organ beds, including the liver, gut,
muscle and skin, would be different from that during moderate exercise (20). An
explanation of the trend for more rapid hemoconcentration and the larger
absolute volume lost during exercise during the follicular phase might be that
there was a larger initial plasma volume. There is a relative hypovolemia during
the luteal phase, and PV has been shown to decrease more rapidly in
normovolemic men that in hypovolemic men (8), although the difference in PV
between phases of the menstrual cycle (-150 ml) is much less than between
normo- and hypovolemia (-400 ml). It should be noted that PV had decreased to
the same absolute volume in the two phases by approximately 3 min of exercise
(Table 3), so there was a larger decrease in PV at the beginning of exercise
during the follicular phase (Figs. 3 and 4).
In three of the four experiments, the final plasma volume was not different
(Figs. I and 3) even though there was a lower intial PV and higher Tes during the
luteal phase. During exercise, plasma volume decreased fairly rapidly; then it
was maintained at that lower volume for the rest of the exercise bout (Table 2).
During passive heating the plasma volume loss was generally steadily decreasing
throughout the period (Fig. 2). During the luteal phase, three of five subjects
could not complete the passive heating exposure due to heat syncope. It is likely

13
that the low plasma volume was responsible for the dizziness and headache.
These observations suggest that the lower critical level of central blood volume
which must be maintained for circulatory integrity was surpassed during the
passive heating experiments during the luteal phase, at least in those individuals
who experienced syncope.
During the follicular phase, passive heating did not result in as great a
plasma volume loss nor in such a low.absolute plasma volume at the time of the
last blood sample as occurred in the other three experiments. Plasma renin
activity is higher at rest (15) and during exercise in the luteal phase (unpublished
observations) and increased angiotensin II (Ang II) may have contributed to
greater filtration as a consequence of a higher arteriolar and capillary pressure.
AnQther partial explanation of the differing volume of fluid lost during passive
heat exposure between phases of the menstrual cycle could be that there is a
higher catecholamine concentration in the luteal than in the follicular phase (17).
Increased catecholamine concentration would also increase arterial pressure and
likely increase venous pressure as well (14,20,26), thus having the effect of
increasing capillary filtration pressure as well as decreasing absorption of fluid
from the postcapillary venules. Exercise could well obscure this increased net
filtration during the luteal phase since there is approximately a 5 fold increase in
plasma norepinephrine during exercise (5,17) indicating a much greater
sympathetic nervous activity (4). The higher circulating catecholamines during
exercise would result in a much greater arterial pressure and would be expected
to act differentially at the various organ capillary beds to vasodilate or
vasoconstrict, thus leading to the entirely different vascular volume dynamics
between exercise and passive heating (13).!'

14
The observation from the present study that women hemoconcentrate less
during passive heating during the follicular than the luteal phase is new and the
explanation for such a phenomenon is incomplete. It has been suggested that
there is a lower limit to hemoconcentration in response to passive heating or
exercise, as measured by actual plasma volume reduction (13) or by reduced
central venous pressure (20). Mohsenin and Gonzalez (18) have extended that
hypothesis by showing increased transvascular colloid osmotic pressure and
increased interstitial fluid pressure opposed unchecked fluid loss from the
vasculature during maximum exercise. If the passive heat exposure during the
follicular phase continued during the present investigation, the PV may have
been reduced to the same volume as observed in the luteal phase, and in both
phases during exercise. This plasma volume, which averaged 2.5 Z in these
women, may be the lower limit for vascular fluid loss with adequate reg,,lation
of blood pressure.
i. "

15
ACKNOWLEDGEMENTS
Wle thank K. Speckman, L. Levine, and D. Katz for technical assistance, T.
Doherty for statistical assistance and S. MacKinnon, D. Longley, D. Leader and
L. Powers for manuscript preparation. We are grateful to Dr. R.R. Gonzalez for
suggestions and technical assistance, and thank Dr. M.N. Sawka for reviewing
the manuscript.
The views, opinions, and/or findings contained in this report are those of
the authors and should not be construed as official Department of the Army
position, policy or decision, unless so designated by other official documentation.
AHuman subjects participated in these studies after giving their informed
voluntary consent. Investigators adhered to AR 70-25 and USAMRDC Regulation
70-25 on Use of Volunteers in kesearch.
4
9.%'
9

16
References
1. Allen TH, Peng MT, Chen KP, Huang TF, Chen C, Fang HS (1956)
Prediction of blood volume and adiposity in man from body weight and cube of
height. Metab 5: 328-345
2. Bayliss, P.H., B.A. Spruce, 3. Burd (1985) Osmoregulation of vasopressin
secretion during the menstrual cycle. -In: Schrier, R.W. (ed) Vasopressin, Raven
Press, New York pp 241-247
3. Bigland-Ritchie B, Graichen H, Woods 33 (1973) A variable-speed
motorized bicycle ergometer for positive and negative work exercise. 3 Appl
Physiol 35: 739-740
4. Christensen N3 (1979) The role of catecholamines in clinical medicine.
Acta Med Scand Suppl 624:9-18
5. Christensen N3, Galbo H (1983) Sympathetic nervous activity during
exercise. Ann Rev Physiol 45:139-153
6. Drinkwater BL, Denton JE, Kupprat LC, Talag TS, Horvath SM (1976)
Aerobic power as a factor in women's response to work in hot environments. 3
Appl Physiol 41:815-821
7. Forsling ML, Stromberg P, Akerlund M (1982) Effect of ovarian steroids on
vasopressin secretion. 3 Endocrinol 95:147-151
S. Fortney SM, Nadel ER, Wenger CB, Bove JR (1981) Effect of blood volume
on sweating rate and body fluids in exercising humans. 3 Appl Pnysiol 51:1594-
1600
9. Fortney SM, Senay LC (1979) Effect of training and heat acclimation on
exercise responses of sedentary females. 3 Appi Physiol 47:978-984
10. Gaebelein C3, Senay LC (1982) Vascular volume dynamics during
ergometer exercise at different menstrual phases. Eur 3 Appl Physiol 50:1-11

17
11. Gonzalez RR, Pandolf KB, Gagge AP (1974) Heat acclimation and decline
in sweating during humidity transients. 3 Appl Physiol 36:419-425
12. Gray M3, Strausfeld KS, Watanabe M, Sims EAH, Solomon S (1968)
Aldosterone secretory rates in the normal menstrual cycle. 3 Clin Endocrinol
28:1269-1275
13. Harrison MH (1985) Effects of thermal stress and exercise on blood volume
in humans. Physiol Rev 65:149-209
14. Henry 3P, Gauer OH (1950) The influence of temperature upon venous
pressure in the foot. 3 Clin Invest 29:55-861
15. Kaulhausen H, Leyendecker G, Benker G, Breuer H (1978) The relationship
of the renin-angiotensin-aldosterone system to plasma gonadotropin, prolactin
and ovarian steroid patterns during the menstrual cycle. Arch Gynakol 225:179-
200
16. Keppel G (1973) Design and Analysis. Prentice Hill, Englewood Cliffs, N.3.
17. Kolka MA, Stephenson LA (1985) Thermoregulation during active and
passive heating during the menstrual cycle (Abstract). Physiologist 28:368
18. Mohsenin, V., R.R. Gonzalez (1984) Tissue pressure and plasma oncotic
pressure during exercise. 3 AppI Physiol 56:102-108
19. Nishi Y, Gagge AP (1970) Direct evaluation of convective heat transfer
coefficients by naphthalene sublimation. 3 AppI Physiol 29:830-838
20. Rowell LB (1983) Cardiovascular adjustments to thermal stress. In:
Shepherd 3T, Abboud FM (ed) Handbook of physiology - the cardiovascular
system III Waverly Press, Baltimore, pp 967-1023
21. Senay LC 3r (1973) Body fluids and temperature responses of heat-exposed
women before and after ovulation with and without rehydration. 3 Physiol
(London) 232: 209-219
... ..... -

22. Spruce, B.A., P.H. Bayliss, 3. Burd, M.3. Watson (1985) Variation in
osmoregulation of arginine vasopressin during the human menstrual cycle. Clin
Endocrinol 22: 37-42
23. Stephenson LA, Kolka MA, Gonzalez RR (1984) Circadian and menstrual
cycle variation in blood parameters (Abstract). The Physiologist 27:230.
24. Strauss M8, Davis RK, Rosenbaum 3D, Rossmeisl EC (1951) Water diuresis
produced during recumbency by the intravenous infusion of isotonic saline
solution. 3 Clin Invest 30: 862-868
25. Turner C, Fortney 5 (1984) Plasma volume changes during the menstrual
cycle (Abstract). Fed Proc 43:718
26. Vanhoutte PM, Verbeuren T3, Webb RC (1981) Local modulation of
adrenergic neuroeffector interaction in the blood vessel wall. Physiol Rev 61:
151-247
27. Wells CL, Horvath SM (1973) Heat stress responses related to the
menstrual cycle. 3 Appl Physiol 35: 1-5
28. Wells CL, Horvath SM (1974) Responses to exercise in a hot environment
as related to the menstrual cycle. 3 Appi Physiol 36:299-302
29. Wilkerson, 3E, Gutin B, Horvath SM (1977) Exercise-induced changes in
blood, red cell, and plasma volumes in man. Med Sci Sports 9:155-158
30. Wilkerson 3E, Leeds EM, Gordon GD (1985) Hematological differences in
regularly cycling females with normal and low luteal progesterone (Abstract).
Fed Proc 44: 8461%

19
Table I. Individual Subject Characteristics
ExerciseAge Height Weight AD V02 peak Workload Workload
(yr) (cm) (kg) (m2) (1Fmin 1) (% V02 peak) (w-m2)
1 32 173.0 64.2 1.77 2.41 83 415
2 26 162.0 60.9 1.65 2.20 78 363
3 27 165.1 64.0 1.71 2.30 72 366
4 30 170.0 59.0 1.68 2.55 84 388
5 21 162.6 68.0 1.73 2.64 75 375
R 27.2 166.5 63.2 1.71 2.42 78 381
S.D. 4.2 4.8 3.4 0.05 0.18 (6.6) 36
'Sl
00
S 4)4
40 0Xf
b I I ~o
tof 00-% 4-~40
0%0 ~~ 00 Ch 0 ~-dV~d 44 - . -' -,
616~
'A~ 4 9
VI =
C4~ %.w ~ ~Fc) > ~ m. W.N C4 mN~
o ~ N NdXio S .

21
Table 3. Mean ( S.D.) blood constituents pre-stress and after each O.20C increase in Tesduring passive heating . An asterisk (*) indicates differences between the follicular andluteal phases (P< 0.05) A dagger (t) indicates differences from pre-stress blood samples(P < 0.05). The symbol, psi,(*) indicates differences between passive heating and exercise(P < 0.05).
PASSIVE KEATING
FOLLICULAR
Kct Hb I PV P I TCP Na + K+
(M) (g.100ml- () (g.loml-) (g) (mEq.t - 1) (mEq.L- 1)
Pre 36.62 12.30 2.98 6.96 207.7 143.0 4.1(1.6) (0.4) (0.15) (0.1) (11.4) (0.9) (0.3)
2 36.44 12.46 2.95t* 6.98 206.2 143.7 4.0t"*(1.7) (0.4) (0.11) (0.2) (11.6) (1.2) (0.1)
3 36.92 12.64 2.89th 7.12 205.8 145.Ot 4.0t*i(1.5) (0.3) (0.11) (0.2) (12.9) (1.4) (.2)
4 37.28 12.83 2.83t* 7.34 206.0 146.8t 3.9t*(1.5) (0.4) (0.09) (0.3) (12.4) (2.6) (.2)
LUTEAL Hct Hb PV P TCP Na + K+M% (g"100 m l - l ) M (g"108 m l -l ) (g) (mEq"&l- ) (mEq"- l0 )
Pre 38.30 12.90 2.77* 7.02 194.6* 142.4 4.0(1.3) (0.4) (0.21) (0.2) (13.3) (1.5) (0.2)
2 38.46 13.22 2.70t* , 7.14 192.7 143.0 4.141(1.3) (0.4) (0.21) (0.2) (15.1) (1.2) (0.3)
3 38.96 13.50 2.62*t", 7.40 194.0 144.7t 4.0*(1.5) (0.5) (0.22) (0.3) (15.5) (1.5) (0.1)
4 400.o 14.04 2.47*t 7.80 193.5 146.4t 4.0,(1.3) (0.3) (0.18) (0.5) (12.7) (2.) (0.2)
a There is not sufficient data on all subjects for the mean data to be presented.

22
Table 4. Mean (.+ S.D.) blood constituents pre-stress and after each 0.20C increase in Tsduring exercise. An asterix (*) indicates differences between the follicular phases (P < 0.05).A dagger () differences from pre-stress blood sample (P<0.05). The symbol; psi (4),indicates differences between passive heating and exercise (P < 0.05).
EXERCISE
FOLLICULAR
Hct Hb PV Pp TCP Na+ K+
(%) (g-100m1-1) (I.) (g.100m1- 1 ) (g) (mEq--) (mEq-l)
Pre 36.48 12.36 2.97 6.9 204.7 142.7 4.1(1.5) (0.3) (0.13) (0.2) (13.8) (1.3) (0.2)
2 39.06 13.52 2.60"i* 7.5 195.5 144.2t 4.8t
(1.7) (0.3) (0.11) (0.4) (11.6) (3.0) (0.3)
3 39.34 13.62 2.57t 7.6 196.3 145.4t 5.2t4)(1.6) (0.3) (0.11) (0.3) (11.7) (1.7) (0.2)
4 39.52 13.72 (2.54)t) 7.8 198.9 145.Ot 5.3#(1.3) (0.2) (0.11) (0.3) (12.9) (2.5) (0.2)
5 40.16 13.80 2.50t 7.9 197.2(1.7) (0.3) (0.11) (0.3) (12.6)
LUTEAL
Hct Hb PV P TCP Na+ K +M% ( "lO0m I'l) 00, ( "lO8m l'1) (g) (mEq - '0 ) (mF-q"-.-I)
Pre 37.2 12.6 2.88* 6.9 198.5* 142.8 4.0(1.4) (0.3) (0.23) (0.2) (17.5) (0.9) (0.2)
2 39.32 13.32 2.64t* 7.4 195.7 144.2t 4.7t(1.6) (0.6) (0.28) (0.4) (18.0) (1.2) (0.4)
3 39.78 13.54 2.62t*4 7.5 193.9 144.7t 4.9t*(1.3) (0.4) (0.18) (0.4) (15.5) (1.7) (0.2)
4 40.06 13.92 2.50t* 7.7 191.5 145.1t 5.0t*(1.8) (0.6) (0.28) (0.3) (16.1) (1.3) (0.2)
5 40.04 13.88 2.50t 7.8 193.6 - -(1.5) (0.3) (0.23) (0.3) (16.1)

23
Figure Legends
Fig. 1.
Mean (+ S.D.) plasma volume at each esophageal temperature (mean) for
both the follicular and luteal phases during passive heating. An asterick (*)
indicates differences between phases (P < 0.05). A dagger (t) indicates
differences from pre-stress blood samples (P < 0.05).
Fig. 2.
Mean (+ S.D.) plasma volume as a function of time for both the follicular
and luteal phases during passive heating. An asterick (*) indicates
differences between phases (P < 0.05). A dagger Mt indicates differences
from pre-stress blood samples (P < 0.05).
Fig. 3.
Mean (+ S.D.) plasma volume at each esophageal temperature (mean) for
both the follicular and luteal phases during exercise. An asterick (*)
indicates differences between phases (P < 0.05). A dagger (t) indicates the
differences from pre-stress blood samples (P < 0.05).
Fig. 4.
Mean (+ S.D.) plasma volume as a function of time for both the follicular
and luteal phases during exercise. An asterick (*) indicates differences
between phases (P <0.05). A dagger (t) indicates differences from pre-
stress blood samples (P < 0.05).
4, m

REST3.2
3.0 .6 *t
. FOLLICULAR j.*
. 2.8 -
LUTEAL " ±
2.6
t
2.4-
2.2 , I I I I I I
, 36.90 37.12 37.34 37.56 37.78 38.00T*s ('C)
FI W-E 1
REST3.2-
3.0 -*
* *tFOLUCULA*t T
52.6 - -= LUTEAL
2.4-
2.2 I a
-10 28 66 104 142 180TIME (min)
FIC-LRE 2

JW W W W 1
EXERCISE
* ( 3.2
.0
US
52.6 ±FOLLICULAR
2.4
2.2- 375 77U8036.90 37.12 37.343753.7380
To (0c)
FI ELRE 3
K EXERCISE3.2
3.0 *
'V FOLLICULAROLICLA
12.8 LUTEA
52.6 - *
2.4
2.2--0.1 1.7 3.4 5.2 6.9 8.7
TIME (min)
FI CIRE 4

dra,
S7
D T / L
II I ! lip ilill 1: 1 11 1 1 1 j m I I