
Mass Spectrometry and Proteomics: Principle, Workflow, Challenges ...
The world leader in serving science
Plasma Proteomics – Next Generation
Workflow Tools for Precision Medicine
ResearchScott Peterman Ph.D.
Special Edition Metabolomics and Proteomics Seminar
December 7, 2017

2 Proprietary & Confidential
• Whole blood is the most common bio-specimen
• LDT have been developed for disease diagnosis or confirmation, risk
prediction, prognosis monitoring, and evaluating treatment
• Readily available from clinical trials and epidemiological studies
• There are over 100 FDA-cleared or FDA-approved clinical plasma or
serum tests
• Ca 70 proteins in top 300 protein ranking, another 47 in next 1200
• Excellent source of cfDNA, exosomes, metabolomics, and proteomics
• Three primary classes of proteins in plasma used for specific tests
• Excellent source for additional assays used for biological status
• Changes in plasma proteome can be used determine phenotypes
• Whole blood is an excellent source for exosomes, Buffy coat (PBMCs),
platelets, Ig’s, and RBCs used for additional tests
Renewed Interest in Plasma Proteomics

3 Proprietary & Confidential
Global Proteome Profiling – Generating Routine Phenotyping Capabilities
Although DNA provides the blueprint,
bodily house is built of and maintained
by proteins
Desire to map person protein makeup
(phenotyping) based on health,
environment, genetics
Utilize proteome phenotyping to perform
longitudinal (personal) and/or
populational analysis
Requires “industrialized” plasma
proteome profiling pipeline

4 Proprietary & Confidential
• What is the number of proteins routinely quantified per sample
• Desired – 1000
• Settled for – 500
• Current levels – ca. 250-300 (for non-depleted plasma samples)
• Why the drive for global proteome profiling?
• More interested in identifying protein patterns (panels) between biological cohorts
• Translating highly-multiplexed panels to routine quantitative methods
• Perform targeted data extraction to potential screen for multiple diseases with one study
• Avoid depletion if possible
• Cost per sample is significantly increased $27/sample is high end
• Additional levels of sample handling
• Introduction of variance
Voice of Customer for What is Requested/Expected for Assays

5 Proprietary & Confidential
Biological Challenges in Plasma Analysis
• Large dynamic range of plasma protein abundance
• Few proteins constitute the majority of the protein
mass
• Performing tryptic digestion transfers large dynamic
range issue from protein to peptide
• Co-elution of high and low abundant peptides
reduces intra-scan dynamic range
• 1000’s of Ig proteins each with different sequences
can hinder sequence matching routines
1. Dynamic range2. Ig’s contribution - sequences
3. composition

6 Proprietary & Confidential
Developing a Highly Robust Workflow at BRIMS – Collaborator Support
Sample
preparationSample Loading
Chromatographic
separationData acquisition Data Interpretation
• Lipids and salts
• Protein aggregation
• Incomplete and
unpredictable
digestion
• Large dynamic protein
expression
• The bulk of the protein
weight is taken by few
proteins
• Creates many issues
with loading
• UHPLC support
• Heated solvents
• Stable temperature
control
• Additional divert
valves
• Co-elution of
peptides
originating from
top 20 proteins
reduce intra-scan
dynamic range
• Co-elution of Ig
peptides can
hamper data
searching
• DDA only searched
using sequence
matching
• Global spectral libraries
omit realistic
proteins/peptides and
relative abundance
• Selectivity using DIA is
reducedBRIMS digestion
protocols utilizing
different buffers afforded
by introduction of the
trapping column and
divert valves
• Leverages
Vanquish UHPLC
system and
slightly wider
bore columns in
modular format
• Introduction of
trapping column
• Significantly
increase peak
capacity despite
shorter gradients
• Options for
alternative solvent
blends
• System suitability
implemented
- Robust, reproducible workflow designed to maximize proteome coverage while maintaining high-throughput
• Increased peak
capacity reduces
co-elution
• HRAM MS and
MS/MS possible
with DDA concepts
• In-depth sample-specific
spectral libraries provide
greates confidence
• FDR routines
• Protein expression orders
• Increased confidence in
PTM analysis

7 Proprietary & Confidential
Leveraging High Resolution Analysis for Global Profiling
For research use only. Not for use in diagnostic procedures.
• Chromatographic resolution properties as defined by peak capacities
• Maximizing throughput for large-scale pilot and clinical studies
0 10 20 30 40 50 60 70 80 90 100 110 120 130 140 150 160 170 180Time (min)
0
10
20
30
40
50
60
70
80
90
100
10
20
30
40
50
60
70
80
90
100
Rela
tive
Ab
un
da
nce
Rela
tive
Ab
un
da
nce
Nanoflow
100
200
300
400
500
600
700
800
900
1000
100
200
300
400
500
600
700
800
900
1000
Flo
w R
ate
Flo
w R
ate
Analytical flow
• Maximum backpressure is
1500 bar enabling greater
peak capacities (narrower
peak widths across shorter
gradients)
• Performs solvent heating to
help loading rates
• Extra divert valve in the
heated column chamber
• Reservoir for trapping
column cleaning solvents

8 Proprietary & Confidential
Understanding Plasma Complexity – Dynamic Range
Injecting 1 µg on column using nanospray
850 ng attributed to a few proteins
150 ng for all other proteins
Example of 1 ng for a 30kDa protein = 33
fmol on column
Extend that down for 1000-fold for 33
amol on column for detection
Injecting 100 µg on column using analytical
flow
85 µg attributed to a few proteins
15 µg for all other proteins
Example of 1 µg for a 30kDa protein = 33
pmol on column
Extend that down for 1000-fold for 33 fmol
on column for detection
9 Proprietary & Confidential
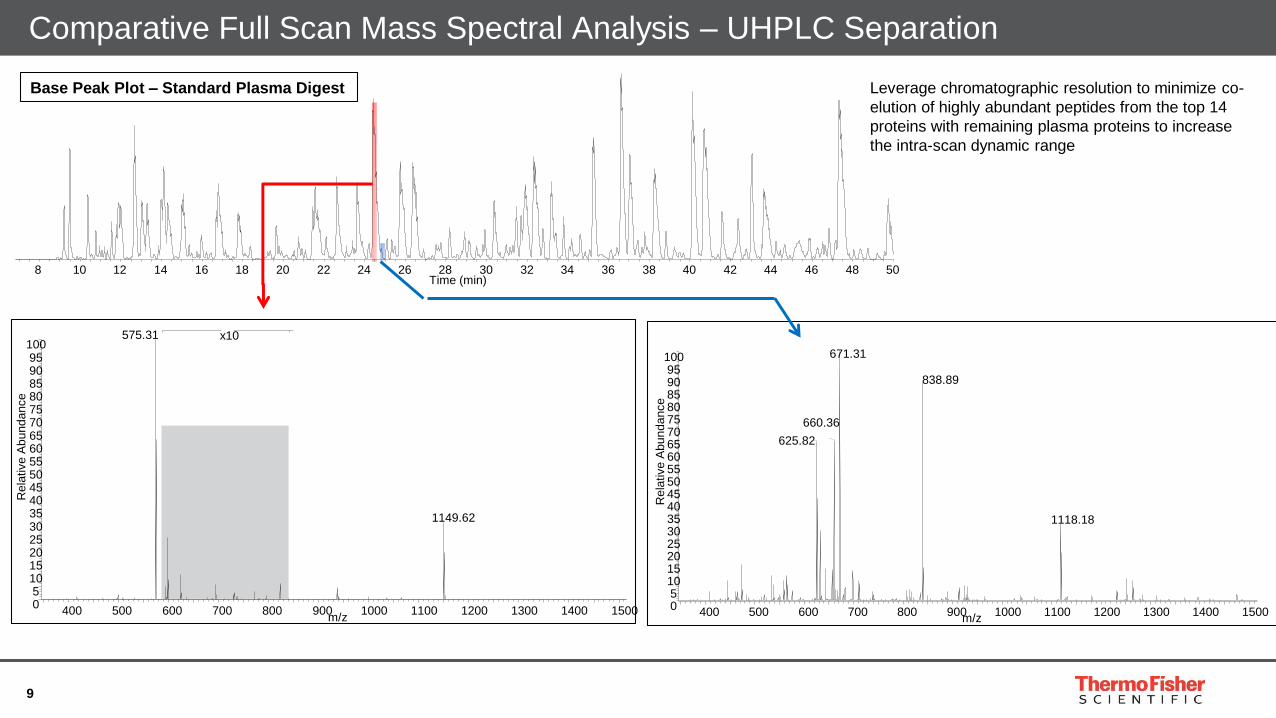
Comparative Full Scan Mass Spectral Analysis – UHPLC Separation
8 10 12 14 16 18 20 22 24 26 28 30 32 34 36 38 40 42 44 46 48 50Time (min)
400 500 600 700 800 900 1000 1100 1200 1300 1400 1500m/z
05101520253035404550556065707580859095100
Rela
tive A
bundance
575.31
1149.62
x10
400 500 600 700 800 900 1000 1100 1200 1300 1400 1500m/z
05101520253035404550556065707580859095100
Rela
tive A
bundance
671.31
838.89
660.36
625.82
1118.18
Base Peak Plot – Standard Plasma Digest Leverage chromatographic resolution to minimize co-
elution of highly abundant peptides from the top 14
proteins with remaining plasma proteins to increase
the intra-scan dynamic range

10 Proprietary & Confidential
Increasing the Analytical Stability and Robustness of Sample Loading
Chromatogram
Time
Time
Low sample loading
peptides stack up close to head of
column
High sample loading
Hydrophilic compounds severely shifted
forward on column causing them to elute
early
Pump Detector
PumpDetector
Low sample loading
High sample loading
Single column (or 2 columns, trap and analytical, with the same chemistry). Displacement chromatography occurs
• Pairing columns with minimal k’ values
(C8 or C18 based packing chemistries)
reduces benefits of trapping
• Increased loading amounts can result in
wider chromatographic peaks
• To reduce RT shifting as a function of
loading amounts, must increase column
lengths
• Reduced RT reproducibility requires
wider windows for automated data
processing and/or scheduled windows
• Reduces column lifetime requiring
switching during study – data interruption

11 Proprietary & Confidential
Increasing Loading Capacity While Maintaining Robustness
Waste
Pump Trap
Analytical Column
Detector
Chromatogram
Chromatogram
High sample loading
Waste
Analytical Column
Detector
Low sample loading trap
• Maximizing k’ differences between trapping and analytical columns
• Utilization of two different divert valves to increase robustness and column lifetimes
Pump• Trapping columns comprised of
PRLP-S packing material
• Large k’ difference resulted in
increased peak shapes and
capacity – refocusing at the
analytical column head
• Matching trapping column
dimensions to fit expected load
amounts
• Added extra divert valve on
Vanquish and utilized divert
valve on instrument
• Both trapping and analytical
columns maintained at high
temperature
• Added solvent heater
• Column and pump
configuration enabled flow
switching at the beginning and
end of methods to wash salts,
small molecules, and non-
digested proteins to waste

12 Proprietary & Confidential
Examples – With and Without Optimal Trapping Columns
2x
1x
4x
12x
2x
1x
4x
120x
40x
80x
10x
20x
10 sec
15 sec
12 sec
12 sec
Also effects peak capacity and routine and comprehensive data
acquisition
9 sec
9 sec
ω = 145
ω = 111
ω = 111
ω = 88
ω = 147
Additional experiments have extended the
loading amounts to 220 µg
Without Trapping Column With Trapping Column
Incre
ased
Lo
ad
ing
Am
ou
nts

13 Proprietary & Confidential
Retention Time Difference as a Function of Load Amount
Amount Loaded
on Column (µg)
Retention Time Difference (%min) [relative to 10 µg load]
14 Proprietary & Confidential
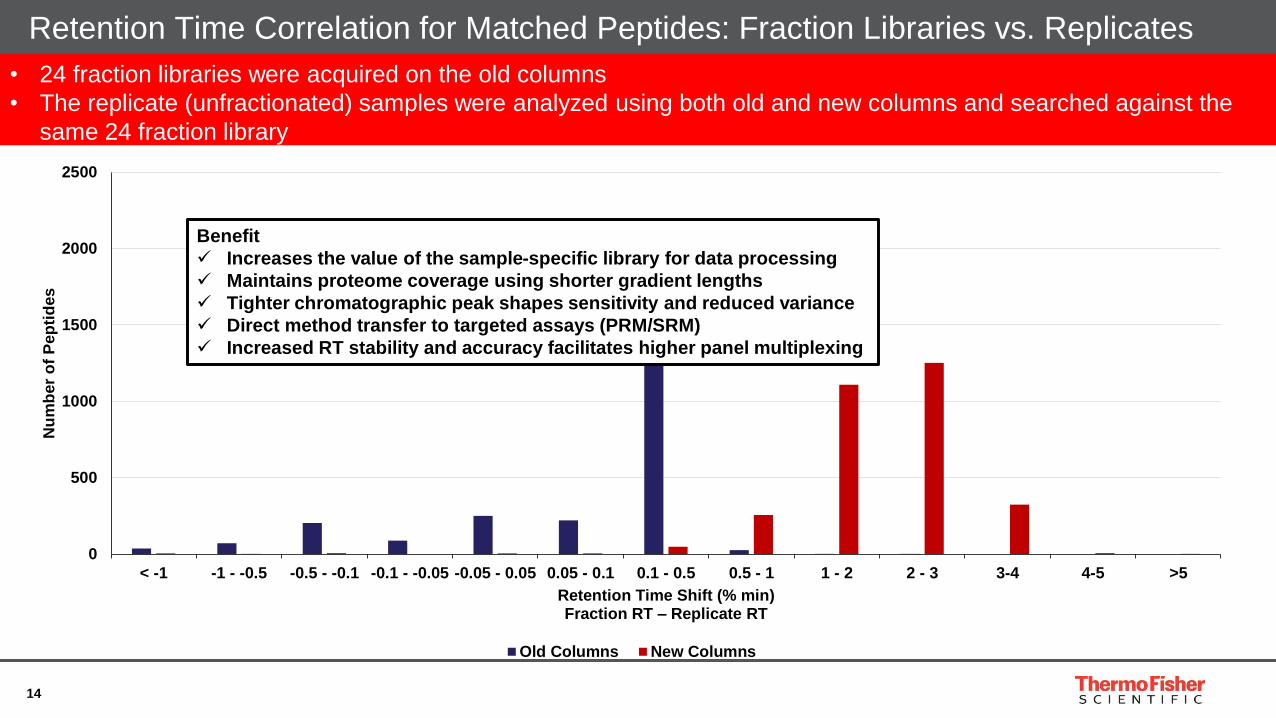
Retention Time Correlation for Matched Peptides: Fraction Libraries vs. Replicates
0
500
1000
1500
2000
2500
< -1 -1 - -0.5 -0.5 - -0.1 -0.1 - -0.05 -0.05 - 0.05 0.05 - 0.1 0.1 - 0.5 0.5 - 1 1 - 2 2 - 3 3-4 4-5 >5
Nu
mb
er
of
Pep
tid
es
Retention Time Shift (% min)Fraction RT – Replicate RT
Old Columns New Columns
• 24 fraction libraries were acquired on the old columns
• The replicate (unfractionated) samples were analyzed using both old and new columns and searched against the
same 24 fraction library
Benefit
Increases the value of the sample-specific library for data processing
Maintains proteome coverage using shorter gradient lengths
Tighter chromatographic peak shapes sensitivity and reduced variance
Direct method transfer to targeted assays (PRM/SRM)
Increased RT stability and accuracy facilitates higher panel multiplexing

15 Proprietary & Confidential
Tandem Spectral Acquisition Approaches
HRAM MS
DDA
Acquisition
Cycle
Spectral Matching
630 631 632 633 634 635 636 637 638 639 640 641 642m/z
0
5
10
15
20
25
30
35
40
45
50
55
60
65
70
75
80
85
90
95
100
Rela
tive A
bunda
nce
634.7426
634.9430
635.1436635.3193634.5418
636.5841
636.8347635.8211
639.3100639.6445
637.0849632.3452 639.9784633.6747629.8788 639.0129 642.3200631.1409 632.8464 637.3363 641.3578631.6623 640.3121
634.3429
637.6744630.3803638.3253 640.6475
7 Da
Sample-Specific
Spectral Library
8 sec
16 Proprietary & Confidential
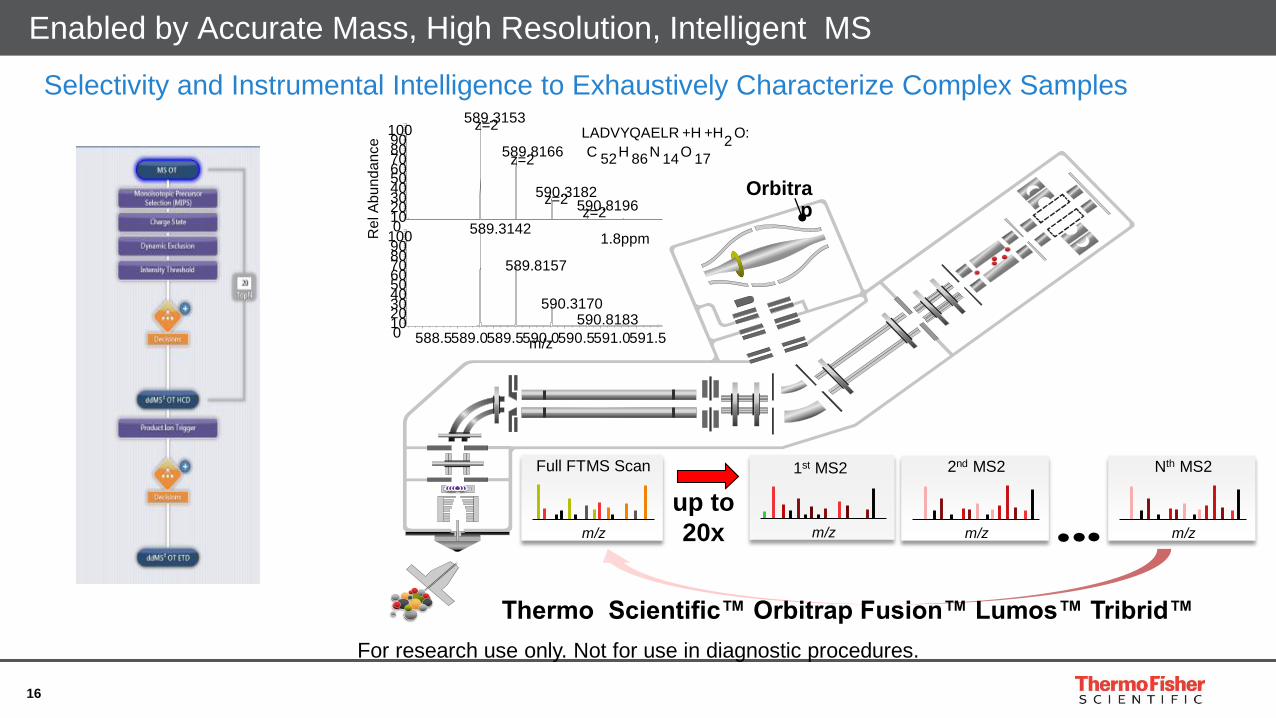
Enabled by Accurate Mass, High Resolution, Intelligent MS
m/z
Full FTMS Scan
m/z
2nd MS2
Orbitrap
m/z
up to
20x
Thermo Scientific™ Orbitrap Fusion™ Lumos™ Tribrid™
1st MS2
m/z
Nth MS2
For research use only. Not for use in diagnostic procedures.
Selectivity and Instrumental Intelligence to Exhaustively Characterize Complex Samples
588.5589.0589.5590.0590.5591.0591.5m/z01020304050607080901000102030405060708090100
Re
l A
bu
nd
an
ce
589.3153z=2
589.8166z=2
590.3182z=2 590.8196z=2
589.3142
589.8157
590.3170590.8183
LADVYQAELR +H +H2
O:
C52
H86
N14
O17
1.8ppm

17 Proprietary & Confidential
Spectral Library Building Approach
Stock solution
Load study
Peptide Fractions
Hydrophilic Hydrophobic1 2 3 4 5 6 7 8 24
15 µg
30 µg
45 µg
DDA Technical Replicates
Consolidate
d DDA
LibraryIndividual
DDA Load
Library
Consolidated
Fraction Library

18 Proprietary & Confidential
Sample Specific Spectral Library Information
Sample-Specific
Spectral Library
24 Fractions generated
from reverse-phase high pH
separation
0
50
100
150
200
250
300
350
400
450
500
e4 e5 e6 e7 e8 e9 e10 e11
Nu
mb
er
of
Pro
tein
s
AUC Range
Fractions
Replicate
Total # of Proteins
Fractions - 1130
Replicates - 1047
0
500
1000
1500
2000
2500
e4 e5 e6 e7 e8 e9 e10 e11
Nu
mb
er
of
Pep
tid
es
AUC Range
Fractions
Replicate
Total # of Peptides
Fractions - 5459
Replicates - 5030

19 Proprietary & Confidential
• Standard plasma samples from a single healthy donor
• Plasma load study (29, 58, 110, and 220 µg) to evaluate loading capacity and replicate stability
• Stock plasma at different concentrations through dilution factors
• Two different sets of analytical columns (>1500 injections prior to study) and brand new columns
• Large-scale sample analysis
• 15 different draws and 3 different aliquots per tube
• Each aliquot analyzed by 8 technical replicates for a total of 360 injections
• 24 injections out of a single well containing a pooled sample acquired at the end of each row of wells
• Set of pooled plasma samples from six different donor groups (Cedars Sinai Medical Center and
Uni. of Louisville Medical Center)
• Each pool of plasma was sent following centrifugation at Louisville
• Digestion was performed following the same protocols as that for the plasma standards above
• Technical replicates were performed on each of the 6 pooled samples
Testing the BRIMS Workflow – Three Different Scenarios

20 Proprietary & Confidential
Evaluation of the Loading Study

21 Proprietary & Confidential
Supporting Peptide Information – Qualitative and Quantitative Analysis
Incre
ased
Lo
ad
ing
Am
ou
nts
X
2X
4X

22 Proprietary & Confidential
Protein Loading Amounts (ug on column)
0
500
1000
1500
2000
2500
29 58 110 220
Nu
mb
er
of
Pro
tein
s
Plasma Protein Loading Amount (µg on column)
Medium Confidence
High Confidence
0
1000
2000
3000
4000
5000
6000
7000
8000
29 58 110 220
Nu
mb
er
of
Pep
tid
es
Plasma Protein Loading Amount (µg on column)
Medium Confidence
High Confidence
58:29
110:29
220:29
58:29
110:29
220:29
Pro
tein
AU
C R
ati
o
Pep
tid
e A
UC
Rati
o

23 Proprietary & Confidential
Robustness Evaluation -
Sample Collection Sample Preparation
• 1 hr delay
• Centrifugation (2000
RCF for 30 min)• Extract 3 different
100 uL aliquots
16 bioloigcal samples 48 biological and
technical replicates
• Extract 7 different 10 uL
aliquots
• Spike with β-Gal (QC)
• Digest
• Spike digested samples with
PRTC kit
• Analyze
336 biological and
technical replicates

24 Proprietary & Confidential
Global Analysis of 2.5 Plates of Plasma Replicates
0
50
100
150
200
250
300
0-5 6-10 11-15 16-20 21-25 26-30 31-35 >35
Nu
mb
er
of
Pro
tein
s
AUC Variance Across Groups

25 Proprietary & Confidential
Large-scale reproducibility – Apo A1
• 221 sample analyzed (of 384)
• Continuous data acquisition (12 days
and counting)
• Columns had ca. 1000 plasma
injections prior to this data set

26 Proprietary & Confidential
Retention Time Stability Analysis for All Peptides
0
200
400
600
800
1000
1200
1400
0.1 0.2 0.3 0.4 0.5 0.6 0.7 0.8 0.9 1 1.1 1.2 1.3 1.4 1.5 1.6 1.7 1.8 1.9 2 2.1 2.2 2.3 2.4 2.5 2.6 2.7 2.8 2.9 3 >3.0
Nu
mb
er
of
Pep
tid
es
Retention Time Variance (%min)
~ 2 weeks of continuous
data acquisition

27 Proprietary & Confidential
• Goals of the demonstration
• Evaluate the degree of plasma proteome coverage based on
quantifiable proteins
• Evaluate the reproducibility (%CV) for the LC-MS method
• Determine the overlap of targeted peptides quantified using HRAM MS
and the targeted protein list previously done by SRM
• Instrumentation
• UHPLC separations using analytical flow rates and 2.1 mm ID columns
• Maintain HRAM quality data using (OT-OT)
• Data Processing
• Sample spectral library generation (24 fractions)
• Qualitative and quantitative assessment of peptides and proteins
• Quality control and normalization strategies
• Evaluate coverage of targeted protein panels (72) routinely analyzed
using SRM experiments
Evaluating the Cedars Pooled Samples to Assess the Experimental Workflow
28 Proprietary & Confidential
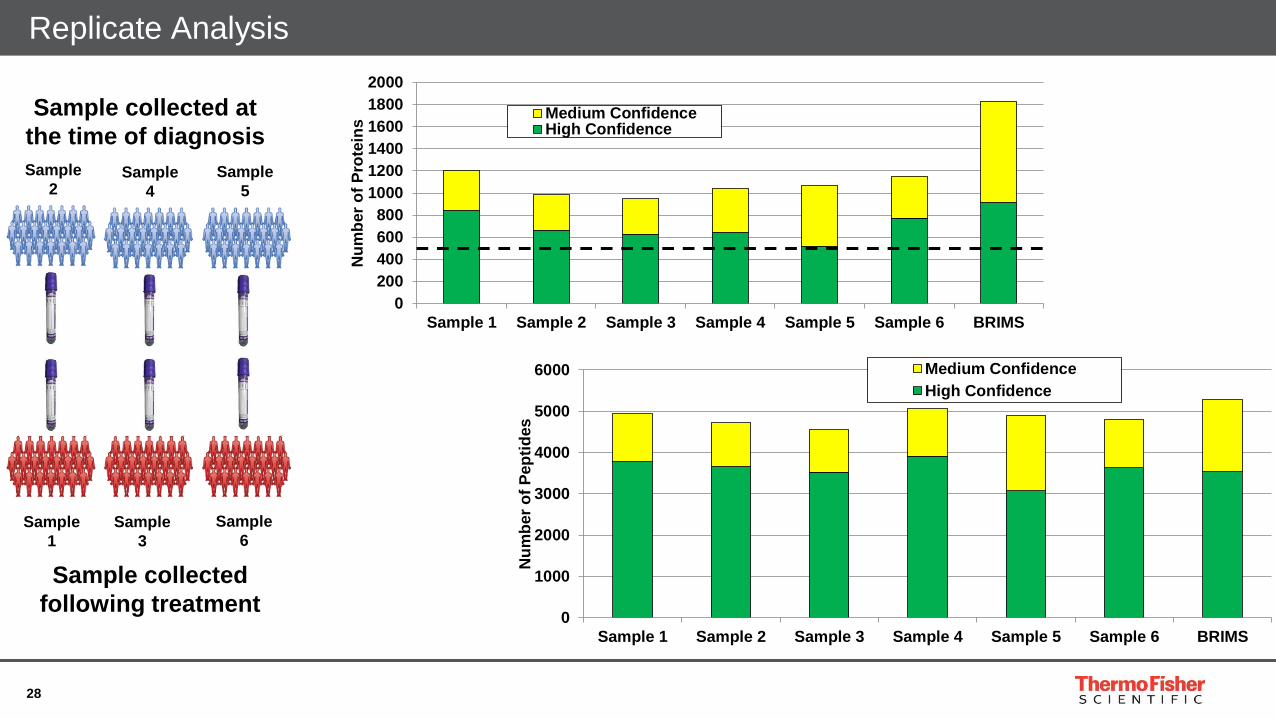
Replicate Analysis
0
200
400
600
800
1000
1200
1400
1600
1800
2000
Sample 1 Sample 2 Sample 3 Sample 4 Sample 5 Sample 6 BRIMS
Nu
mb
er
of
Pro
tein
s
Medium ConfidenceHigh Confidence
0
1000
2000
3000
4000
5000
6000
Sample 1 Sample 2 Sample 3 Sample 4 Sample 5 Sample 6 BRIMS
Nu
mb
er
of
Pep
tid
es
Medium Confidence
High Confidence
Sample
2
Sample
1
Sample
4
Sample
5
Sample
3
Sample
6
Sample collected at
the time of diagnosis
Sample collected
following treatment
29 Proprietary & Confidential
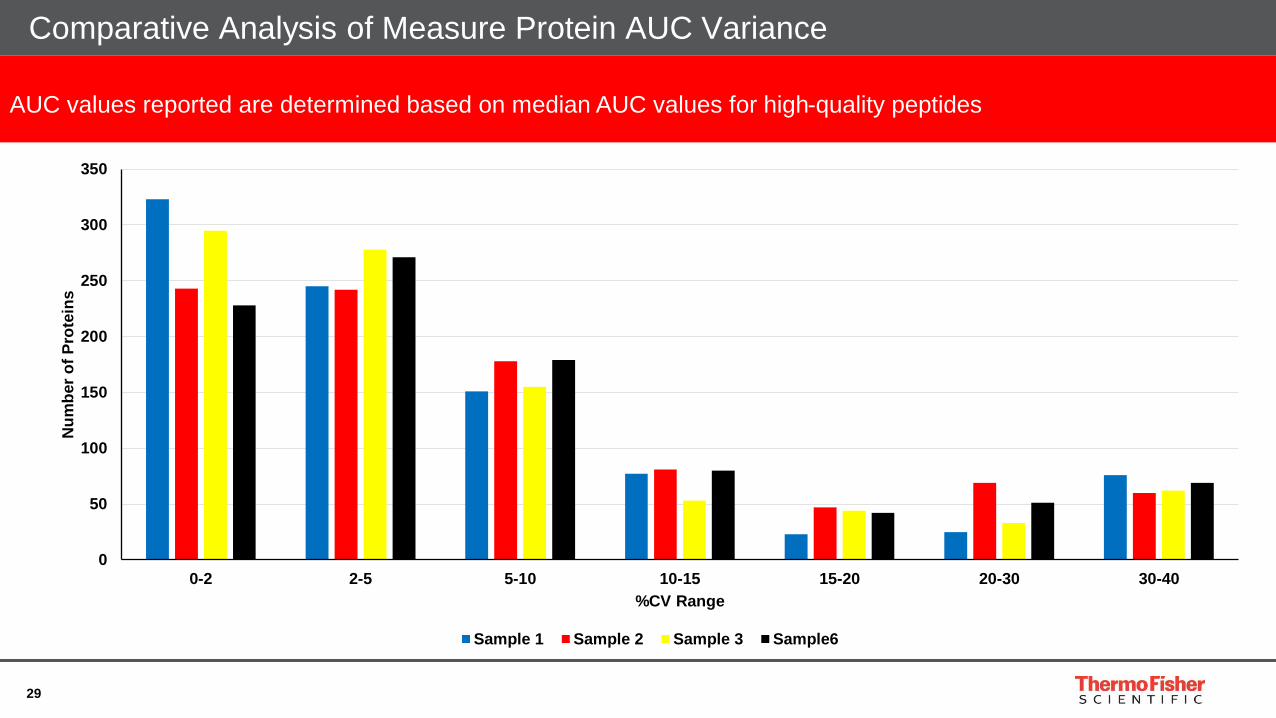
Comparative Analysis of Measure Protein AUC Variance
0
50
100
150
200
250
300
350
0-2 2-5 5-10 10-15 15-20 20-30 30-40
Nu
mb
er
of
Pro
tein
s
%CV Range
Sample 1 Sample 2 Sample 3 Sample6
AUC values reported are determined based on median AUC values for high-quality peptides

30 Proprietary & Confidential
Determination of Retention Time Stability (3 Days of Continuous Data Acquisition)
0
50
100
150
200
250
300
350
400
450
500
0.01 0.02 0.03 0.04 0.05 0.06 0.07 0.08 0.09 0.1 0.11 0.12 0.13 0.14 0.15 0.16 0.17 0.18 0.19 0.2 0.21 0.22 0.23 0.24 0.25 0.26 0.27 0.28 0.29 0.3 0.3 -0.5
0.5 -1.0
>1.0
Nu
mb
er
of
Pep
tid
es
Retention Time Variance (%min)
0
1
2
3
4
5
6
7
8
0 10 20 30 40 50 60
Rete
nti
on
Tim
e V
ari
an
ce
(seco
nd
s)
Measured Retention Time (min)
Converting % RT Variance to seconds
31 Proprietary & Confidential
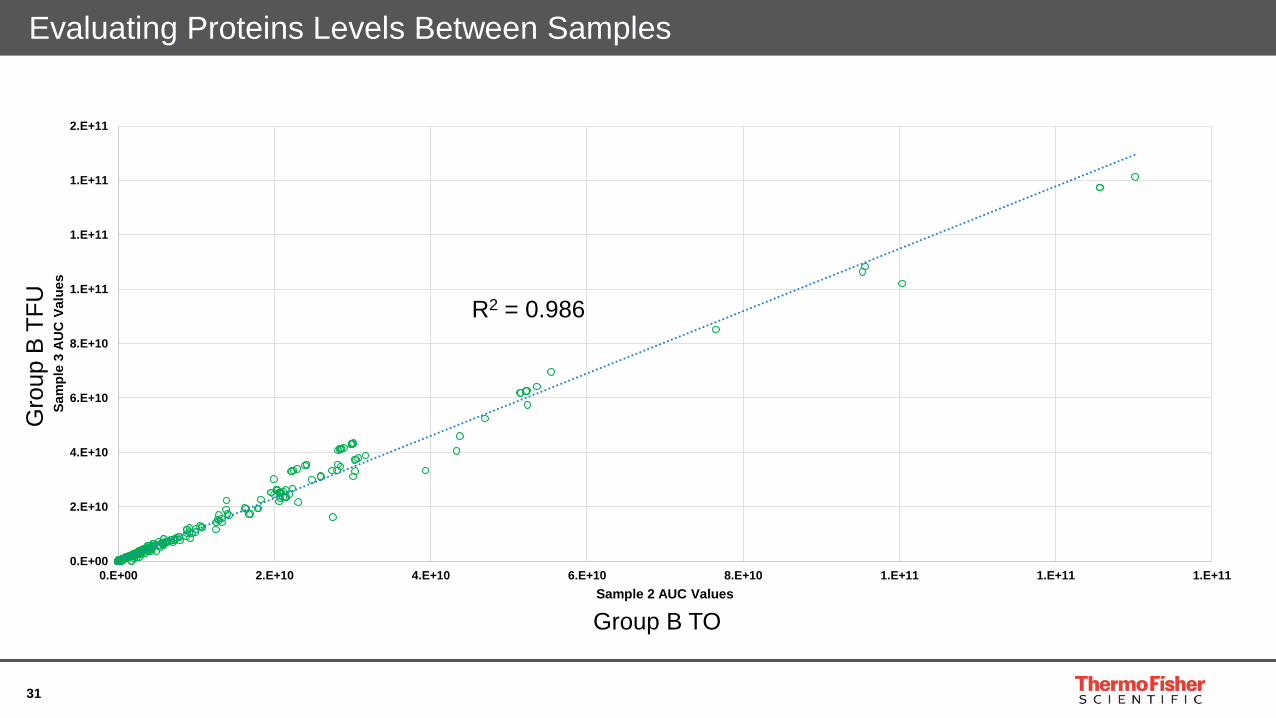
Evaluating Proteins Levels Between Samples
0.E+00
2.E+10
4.E+10
6.E+10
8.E+10
1.E+11
1.E+11
1.E+11
2.E+11
0.E+00 2.E+10 4.E+10 6.E+10 8.E+10 1.E+11 1.E+11 1.E+11
Sa
mp
le 3
AU
C V
alu
es
Sample 2 AUC Values
Gro
up B
TF
U
Group B TO
R2 = 0.986

32 Proprietary & Confidential
Increasing the Graphical Value through Volcano Plots
0
0.5
1
1.5
2
2.5
-4 -3 -2 -1 0 1 2 3
Chart Title
Log2 AUC Ratio [Sample2:Sample3]
-Lo
g p
-Valu
e
p-Value = 0.05
AUC Ratio = 1.5AUC Ratio = 0.7

33 Proprietary & Confidential
0.0
0.2
0.4
0.6
0.8
1.0
1.2
1.4
1.6
1.8
1 2 3 4 5 6 7 8 9 10 11 12 13 14 15 16
AU
C R
ati
o
Proteins of Interest
Acute:Treated
Treated:Treated
Comparative AUC Ratio Analysis for a Portion of the Cedars Targeted Panel
0.0
5.0
10.0
15.0
20.0
25.0
30.0
35.0
40.0
Acute:Treated Treated:Treated
AU
C R
ati
os
CRP AUC Ratio

34 Proprietary & Confidential
• Required over 500 proteins routinely detected and quantified
• Averaged ca. 678 highly confident proteins (as well as an additional 388 proteins identified) and ca.
3600 peptides in a 52 minute gradient
• Maintain a 1 hour injection cycle
• Experimental method utilzies 52 minute gradient and 10 minutes of QC/column re-equilibration
routien
• Evaluate the detection capabilities for Cedars targeted proteins used for disease profiling – 72
medium- to high-level proteins currently being routinely quantified using Sciex QQQ on a 52
minutes gradient
• Was able to detect, verify, and quantify 73 proteins as well as detect the specific set of peptides
targeted in the Cedars QQQ method
• Data processing workflow is automated, exhaustive and requires little manual data interrogation
• Combination of sample-specific spectral libraries, wide DDA methods, and Pinnacle software
enabled accurate data processing and interpretation as well as automate method reports
Summary from Cedars Data

35 Proprietary & Confidential
Additional Conclusions – Overlap with Quantified Proteins and FDA Target Lists
• Identified and quantified peptides
attributed to 48 proteins identified as
FDA-cleared or approved
• Keep in mind the disease plasma
evaluated was from donors suffering
from cardiovascular disease and not
cancer
• Efforts are underway to obtain
plasma samples from cancer donors
to generate a comprehensive
spectral-library to complement the
CVD spectral library

36 Proprietary & Confidential
Expanding Biomarker Potential in Whole Blood
• Primary biological fluid for clinical research
• Research focused on routine measurements
of defined proteome
• Whole blood is still challenging for proteome
coverage due to dynamic range and
complexity
• Depletion strategies still face question and
differing opinions on utility
• Leverage constituents of blood for more
targeted analysis
• Other targeted extraction procedures
• HDL/LDL
• Exosomes
• Targeted cellular extraction
• Peptidome
• Platelets
• PBMCs

37 Proprietary & Confidential
Conclusions and Projections
• Sample Preparation
• Alternative buffers and denaturants increase digestion efficiency
• Spinning plasma samples at 2000 RCF for 30 minutes reduces post-collection perturbation
• Introduction of the Trapping and Analytical Column Configuration
• Handles increased loading amounts
• Maximizes throughput
• Facilitates harsh cleaning solvents to significantly reduce carry-over
• Stabilizes retention times for direct method transfer to targeted studies
• Data Acquisition Strategies
• Maintains quantitative accuracy
• Exhaustive data extraction and reproducibility
• Data Processing using Spectral Libraries

38 Proprietary & Confidential
Acknowledgements
• BRIMS Center
• David Sarracino, Ph.D
• Cedars Sinai Medical Center
• Jennifer Van Eyk, Ph. D.
• Irina Tschernyshyov, Ph. D.
• Qin Fu, Ph.D.
• Optys Technologies
• Amol Prakash, Ph. D.

The world leader in serving science
Appendix
40 Proprietary & Confidential
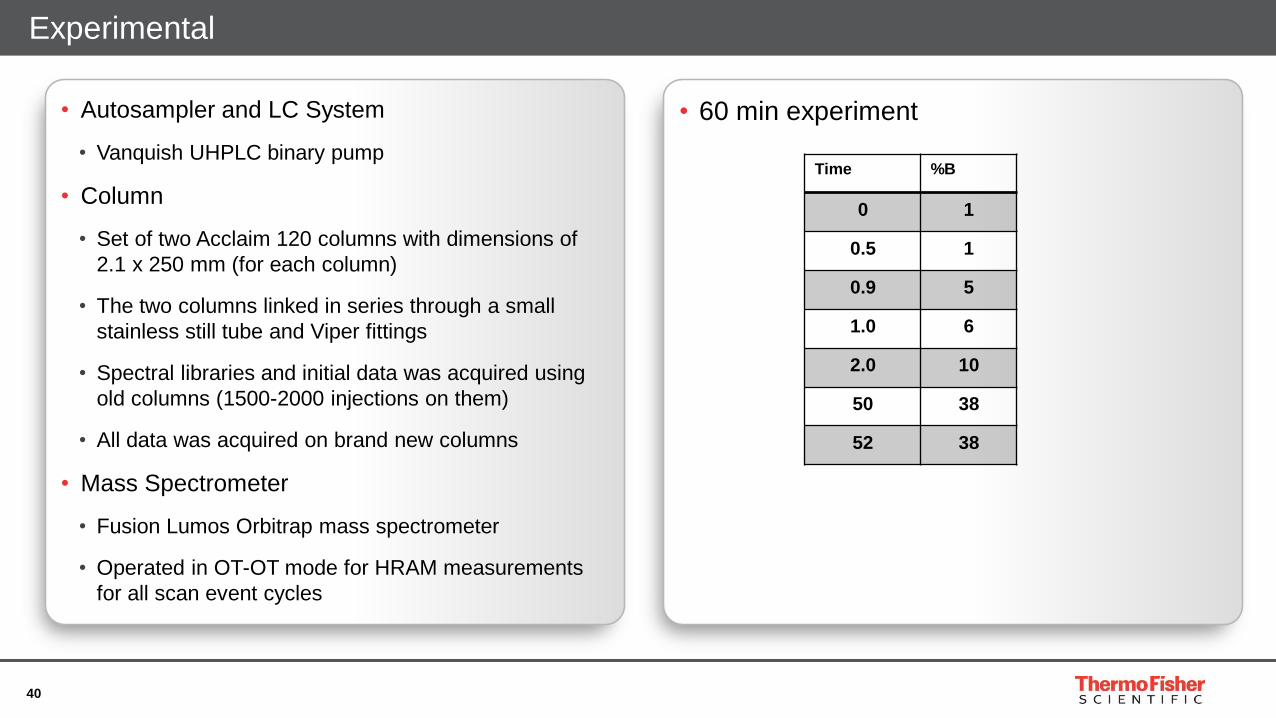
• Autosampler and LC System
• Vanquish UHPLC binary pump
• Column
• Set of two Acclaim 120 columns with dimensions of
2.1 x 250 mm (for each column)
• The two columns linked in series through a small
stainless still tube and Viper fittings
• Spectral libraries and initial data was acquired using
old columns (1500-2000 injections on them)
• All data was acquired on brand new columns
• Mass Spectrometer
• Fusion Lumos Orbitrap mass spectrometer
• Operated in OT-OT mode for HRAM measurements
for all scan event cycles
Experimental
• 60 min experiment
Time %B
0 1
0.5 1
0.9 5
1.0 6
2.0 10
50 38
52 38

41 Proprietary & Confidential
• HRAM MS2
• Resolution = 15k
• AGC = 5e4
• Max ion fill time = 75 msec
• Acquisition Cycle time = 1 sec
• Precursor isolation = 2.5 Da
• Stepped CE starting at 30% and increasing 5%
• Charge state (2-6) and isotope exclusion = On
• Dynamic Exclusion
• Repeat count = 1
• Exclusion duration = 6 sec
DDA/DE Settings for Fraction Library Acquisition
• HRAM MS
• Resolution = 60k
• AGC = 3e6
• Max ion fill time = 50 msec
• Mass Range = 350-1500 Da

42 Proprietary & Confidential
• HRAM MS2
• Resolution = 15k
• AGC = 1e5
• Max ion fill time = 100 msec
• Acquisition Cycle time = 1 sec
• Precursor isolation = 8 Da
• Stepped CE starting at 30% and increasing 5%
• Charge state (2-6) and isotope exclusion = On
• Dynamic Exclusion
• Repeat count = 1
• Width = 4 Da
• Exclusion duration = 6 sec
DDA/DE Settings for Routine Data Acquisition
• HRAM MS
• Resolution = 60k
• AGC = 3e6
• Max ion fill time = 50 msec
• Mass Range = 350-1500 Da

43 Proprietary & Confidential
• Sample Preparation
• 90 ug of pooled digest was collected across 6 samples sent
• 24 fractions collected from RP high pH fractionation
• Each fraction was loaded and analyzed using both 60 and 120 min experimental methods
• LC-MS settings for fraction analysis (DDA/DE) shown in Slides 7 and 8
• LC-MS Data Acquisition
• LC-MS settings for fraction analysis (DDA/DE) shown in Slides 7 and 8
• Unbiased Database searching
• PD 2.1 using Uniprot human database
• Mods incorporated into searching routines include: deamidation and oxidation
• Spectral Matching for Replicate Analysis
• All replicate analysis performed in Pinnacle
Spectral Library Generation


![[ 4th InternatIonal SympoSIum ] · 2008-04-25 · Analysis & Quantification of Diagnostic Plasma Markers ... Metabolic Profiling [ proGram ] New IMS-MS Technologies for Proteomics](https://static.fdocuments.in/doc/165x107/5f8d7d5eeaebff027b23dc42/-4th-international-symposium-2008-04-25-analysis-quantification-of-diagnostic.jpg)