Plasma phospholipid fatty acid composition in ischemic stroke: Importance of docosahexaenoic acid...
7
Plasma phospholipid fatty acid composition in ischemic stroke: Importance of docosahexaenoic acid in the risk for intracranial atherosclerotic stenosis Yong-Jae Kim a,1 , Oh Yoen Kim b,1 , Yoonsu Cho c , Ji Hyung Chung d , Young-Sang Jung e , Geum-Sook Hwang e , Min-Jeong Shin c, * a Department of Neurology, Ewha Womans University, Seoul, Republic of Korea b Department of Food Science and Nutrition, Dong-A University, Busan, Republic of Korea c Department of Food and Nutrition and Institute of Health Sciences, Korea University, Seoul 136-703, Republic of Korea d Yonsei Cardiovascular Hospital and Cardiovascular Research Institute, Yonsei University College of Medicine, Seoul, Republic of Korea e Korea Basic Science Institute, Seoul, Republic of Korea article info Article history: Received 31 May 2012 Received in revised form 23 August 2012 Accepted 6 September 2012 Available online 20 September 2012 Keywords: Intracranial atherosclerotic stenosis Ischemic stroke Fatty acid Docosahexaenoic acid abstract Objective: While data on the relationship between fatty acid (FA) composition and the risk for total stroke have accumulated, the association between FA composition and the risk for intracranial atherosclerotic stenosis (ICAS) has never been studied. We compared plasma phospholipid FA composition between non-stroke control and ischemic stroke in Korean population, to discern the FA that distinguishes ICAS from total ischemic stroke patients. Methods: Non-stroke controls (n ¼ 215) and stroke patients (no cerebral atherosclerotic stenosis, NCAS: n ¼ 144 and ICAS: n ¼ 104) were finally included in the analysis. Plasma phospholipid FA compositions were analyzed. Results: Age, coexistence of hypertension/diabetes were significantly different among the groups. Phospholipid FA compositions were significantly different between non-stroke control and ischemic stroke patients, and interestingly, between NCAS and ICAS in stroke patients. Pattern analysis showed that docosahexaenoic acid (DHA) and eicosapentaenoic acid (EPA), the u3-polyunsaturated FAs were important FAs in distinguishing NCAS and ICAS in strokes. Particularly, the risk of ICAS was inversely associated with levels of DHA contents in phospholipids (OR: 0.590, 95% CI: 0.350e0.993, p < 0.05), indicating that the risk may be increased at lower levels of DHA contents. Conclusion: DHA and EPA are important FAs for distinguishing NCAS and ICAS in strokes. Additionally, the risk of ICAS was inversely associated with the levels of phospholipid DHA, which indicates that sufficient amounts of DHA in plasma or in diet may reduce the risk of ICAS. Ó 2012 Elsevier Ireland Ltd. All rights reserved. 1. Introduction Fatty acids (FAs) play important and diverse roles in cellular and organelle membrane structure and function, tissue metabolism, and genetic regulation [1e3]. It has been demonstrated that alter- ations of blood and tissue FA composition could be involved in the pathogenic processes in several health conditions [1e3]. Data from observational, caseecontrol, and prospective studies [4e8] have indicated the associations between blood and red blood cell FA compositions and the risk and occurrence for cardiovascular disease (CVD). Among the FAs, cardioprotective effects of omega (u) 3 polyunsaturated FAs (u3-PUFA) have been extensively reported. It was postulated that u3-PUFA could reduce the risk for CVD by modulating established risk factors including dyslipidemia, high blood pressure, central obesity and inflammation by influ- encing multiple relevant molecular pathways [1]. Alterations in blood FA composition have also been implicated in the pathogenesis of ischemic stroke [9e11]. Stroke was generally classified as extracranial atherosclerotic, intracranial atherosclerotic stenosis (ICAS), small vessel (i.e. lacunar stroke), cardioembolic, cryptogenic or others [12]. Among them, ICAS is a narrowing of intracranial artery, which is a common etiology for ischemic stroke [13] and has been implicated as a major factor in recurrent stroke and vascular mortality [14]. While data on the relationship between blood and tissue FA composition and the risk for total stroke have * Corresponding author. Tel.: þ82 2 940 2857; fax: þ82 2 940 2850. E-mail address: [email protected] (M.-J. Shin). 1 These authors contributed equally to this work. Contents lists available at SciVerse ScienceDirect Atherosclerosis journal homepage: www.elsevier.com/locate/atherosclerosis 0021-9150/$ e see front matter Ó 2012 Elsevier Ireland Ltd. All rights reserved. http://dx.doi.org/10.1016/j.atherosclerosis.2012.09.007 Atherosclerosis 225 (2012) 418e424
Transcript of Plasma phospholipid fatty acid composition in ischemic stroke: Importance of docosahexaenoic acid...
at SciVerse ScienceDirect
Atherosclerosis 225 (2012) 418e424
Contents lists available
Atherosclerosis
journal homepage: www.elsevier .com/locate/atherosclerosis
Plasma phospholipid fatty acid composition in ischemic stroke: Importanceof docosahexaenoic acid in the risk for intracranial atherosclerotic stenosis
Yong-Jae Kim a,1, Oh Yoen Kimb,1, Yoonsu Cho c, Ji Hyung Chung d, Young-Sang Jung e,Geum-Sook Hwang e, Min-Jeong Shin c,*
aDepartment of Neurology, Ewha Womans University, Seoul, Republic of KoreabDepartment of Food Science and Nutrition, Dong-A University, Busan, Republic of KoreacDepartment of Food and Nutrition and Institute of Health Sciences, Korea University, Seoul 136-703, Republic of KoreadYonsei Cardiovascular Hospital and Cardiovascular Research Institute, Yonsei University College of Medicine, Seoul, Republic of KoreaeKorea Basic Science Institute, Seoul, Republic of Korea
a r t i c l e i n f o
Article history:Received 31 May 2012Received in revised form23 August 2012Accepted 6 September 2012Available online 20 September 2012
Keywords:Intracranial atherosclerotic stenosisIschemic strokeFatty acidDocosahexaenoic acid
* Corresponding author. Tel.: þ82 2 940 2857; fax:E-mail address: [email protected] (M.-J. Shin).
1 These authors contributed equally to this work.
0021-9150/$ e see front matter � 2012 Elsevier Irelahttp://dx.doi.org/10.1016/j.atherosclerosis.2012.09.007
a b s t r a c t
Objective:While data on the relationship between fatty acid (FA) composition and the risk for total strokehave accumulated, the association between FA composition and the risk for intracranial atheroscleroticstenosis (ICAS) has never been studied. We compared plasma phospholipid FA composition betweennon-stroke control and ischemic stroke in Korean population, to discern the FA that distinguishes ICASfrom total ischemic stroke patients.Methods: Non-stroke controls (n ¼ 215) and stroke patients (no cerebral atherosclerotic stenosis, NCAS:n ¼ 144 and ICAS: n ¼ 104) were finally included in the analysis. Plasma phospholipid FA compositionswere analyzed.Results: Age, coexistence of hypertension/diabetes were significantly different among the groups.Phospholipid FA compositions were significantly different between non-stroke control and ischemicstroke patients, and interestingly, between NCAS and ICAS in stroke patients. Pattern analysis showedthat docosahexaenoic acid (DHA) and eicosapentaenoic acid (EPA), the u3-polyunsaturated FAs wereimportant FAs in distinguishing NCAS and ICAS in strokes. Particularly, the risk of ICAS was inverselyassociated with levels of DHA contents in phospholipids (OR: 0.590, 95% CI: 0.350e0.993, p < 0.05),indicating that the risk may be increased at lower levels of DHA contents.Conclusion: DHA and EPA are important FAs for distinguishing NCAS and ICAS in strokes. Additionally, therisk of ICAS was inversely associated with the levels of phospholipid DHA, which indicates that sufficientamounts of DHA in plasma or in diet may reduce the risk of ICAS.
� 2012 Elsevier Ireland Ltd. All rights reserved.
1. Introduction
Fatty acids (FAs) play important and diverse roles in cellular andorganelle membrane structure and function, tissue metabolism,and genetic regulation [1e3]. It has been demonstrated that alter-ations of blood and tissue FA composition could be involved in thepathogenic processes in several health conditions [1e3]. Data fromobservational, caseecontrol, and prospective studies [4e8] haveindicated the associations between blood and red blood cell FAcompositions and the risk and occurrence for cardiovascular
þ82 2 940 2850.
nd Ltd. All rights reserved.
disease (CVD). Among the FAs, cardioprotective effects of omega(u) 3 polyunsaturated FAs (u3-PUFA) have been extensivelyreported. It was postulated that u3-PUFA could reduce the risk forCVD by modulating established risk factors including dyslipidemia,high blood pressure, central obesity and inflammation by influ-encing multiple relevant molecular pathways [1].
Alterations in blood FA composition have also been implicated inthe pathogenesis of ischemic stroke [9e11]. Stroke was generallyclassified as extracranial atherosclerotic, intracranial atheroscleroticstenosis (ICAS), small vessel (i.e. lacunar stroke), cardioembolic,cryptogenic or others [12]. Among them, ICAS is a narrowing ofintracranial artery, which is a common etiology for ischemic stroke[13] and has been implicated as a major factor in recurrent strokeand vascular mortality [14].While data on the relationship betweenblood and tissue FA composition and the risk for total stroke have
Y.-J. Kim et al. / Atherosclerosis 225 (2012) 418e424 419
accumulated, the association between FA composition and the riskfor ICAS has not been studied. Considering the high prevalence andlong-term clinical significance of ICAS, revealing the differences inFA composition may provide important information on the under-lying pathogenesis in the large artery atherosclerotic diseases.
In the present study, we compared plasma phospholipid FAcomposition between non-stroke control and ischemic stroke inKorean population. We further attempted to reveal the FAs dis-tinguishing ICAS from total ischemic stroke patients.
2. Materials and methods
2.1. Study population
Study subjects were recruited among patients admitted toEwha Womans University Mokdong Hospital (Seoul, Korea) forthe evaluation of suspected acute ischemic stroke (within 7 daysof onset). All patients underwent systemic investigationsincluding assessment of medication history, magnetic resonanceimaging (MRI) with MR angiography, carotid duplex ultrasonog-raphy, transthoracic echocardiography, 24-h holter monitoring,and other routine admission laboratory tests. We collecteddemographic data, prior medication history, and the presence ofvascular risk factors including hypertension, diabetes mellitus,heart disease, and previous stroke of the patients. The 3-dimensional time-of-flight technique was used for evaluatingintracranial vessels, and 3-dimensional contrast-enhanced MRangiography was used for extracranial vessels. Irrespective ofindex stroke mechanisms, patients were classified into 3 groupsbased on their vascular imaging and other clinical data as follows:the intracranial atherosclerotic stenosis (ICAS) group had morethan 50% stenosis (symptomatic or asymptomatic) in the proximalportion of the middle, anterior, or posterior cerebral artery; thebasilar artery; or the intracranial portion of the internal carotidartery or vertebral artery; the extracranial atherosclerotic stenosis(ECAS) group had more than 50% stenosis in the extracranialportion of the internal carotid artery or vertebral artery; and thepatients with no cerebral atherosclerotic stenosis (NCAS) grouphad no or less than 50% stenosis in the intracranial or extracranialarteries. NCAS and ICAS were used for analysis in the presentstudy. If the patients had both ICAS and ECAS, it was categorizedinto the ICAS group (n ¼ 12 in the present study). The arterieswith cardioembolic occlusion or with decreased signals due toproximal steno-occlusive lesions were not regarded as havinga true stenosis. Excluded patients were those who underwentincomplete vascular imaging and laboratory tests, those who hadstrokes of other determined etiologies such as venous thrombosis,arterial dissection, or moyamoya disease, and those who hadtransient ischemic attacks with negative diffusion-weightedimages. Individuals taking u3 FA supplementations were alsoexcluded. Non-stroke control subjects were individuals withouthistory of stroke. Exclusion criteria for non-stroke control subjectswere orthopedic limitations, about 10% of weight loss/gain overthe previous 6 months, or any diagnosis of vascular disease,cancer (clinically or by anamnesis), renal disease, liver disease,thyroid disease, and acute or chronic inflammatory disease. Indi-viduals taking u3 FA supplementations were also excluded. Allparticipants were provided with detailed information of the studyand provided written informed consent. The study protocol wasapproved by the Institutional Review Board of Ewha WomansUniversity and carried out in accordance with the HelsinkiDeclaration. Finally, 215 non-stroke controls and 248 strokepatients (NCAS n ¼ 144, ICAS n ¼ 104) were included in this studyfor the analysis.
2.2. Anthropometric parameters, blood pressure and bloodcollection
Body weight and height were measured unclothed and withoutshoes in the morning. Body mass index (BMI) was calculated asbody weight in kilograms divided by height in square meters (kg/m2). Waist circumference was measured at the umbilical level withthe subjects standing after normal expiration. Blood samples werecollected at fasting state within 3 days of admission. After a 12-hfasting period, venous blood specimens were collected in EDTA-treated and plain tubes and centrifuged into plasma or serumthen stored at �70 �C until analysis.
2.3. Serum lipid profile and glucose concentrations
Serum cholesterol, low density lipoprotein (LDL)-cholesterol,and high density lipoprotein (HDL)-cholesterol were measuredwith commercially available kits (Choongwae, Seoul, Korea) usingenzymatic methods. Serum triglyceride (TG) was analyzed usinga total glycerol test kit (Roche, Basel, Switzerland). All measure-ments were performed on a Hitachi 747 autoanalyzer (Hitachi,Tokyo, Japan). Fasting plasma glucose levels were analyzed by theglucose oxidase method using a Beckman Glucose Analyzer (Irvine,CA). Each sample was measured in duplicate. If there was a largevariation between the two values, the samples were remeasured.
2.4. Analysis of plasma phospholipid FA composition
Plasma total lipids were extracted according to the Folchmethod [15] and the phospholipid fraction was isolated by thin-layer chromatography using a development solvent composed ofhexane, diethyl ether, and acetic acid (80:20:2). The phospholipidfractions were then methylated to FA methyl esters (FAMEs) by theLepage and Roy method [16]. The FAMEs of individual FAs ofphospholipids were separated by gas chromatography usinga model 6890 apparatus (Agilent Technologies, Palo Alto, CA, USA),using a 30 m Omegawaz TM 250 capillary column (Supelco, Bel-lefonte, PA, USA), as previously described [17,18]. Peak retentiontimes were obtained by comparison with known standards (37component FAME mix and PUFA-2, Supelco; GLC37, NuCheck Prep,Elysian, MN, USA) and analyzed with ChemStation software (Agi-lent Technologies). Plasma phospholipid FAs were expressed as thepercentage of total FAs.
2.5. Statistical analysis
Multivariate data analysis, principal component analysis (PCA)and partial least squares-discriminant analysis (PLS-DA) wereperformed using SIMCA-P (version 12, Umetrics, Umea, Sweden).PCA, unsupervised pattern recognition (PR) method, was per-formed to examine the intrinsic variation of each subgroup, andthen outliers (p< 0.05) were removed based on Hotelling’s T2 fromeach subgroup. After removing outliers from the subgroups, PLS-DA, supervised PR method, was employed to investigate thedifferences between groups. The quality of the models wasdescribed by R2 and Q2 values. R2 is defined as the proportion ofvariance in the data explained by the models and indicates good-ness of fit, and Q2 is defined as the proportion of variance in thedata predictable by the model and indicates predictability. Toidentify the metabolites that contributed most to clustering,a loading plot was examined.
Statistical analyses including the significance tests were per-formed using SPSS version 11.0 for Windows (SPSS, Chicago, IL,USA). The KolmogoroveSmirnov test was used to test the normalityof distribution, and skewed variables were logarithmically

Y.-J. Kim et al. / Atherosclerosis 225 (2012) 418e424420
transformed for statistical analysis. For descriptive purposes, meanvalues were presented using untransformed values. Differences incontinuous variables between the two groups were tested byindependent t-test (Student t-test) or analysis of variance (ANOVA)and general linear model (GLM), and non-continuous variableswere tested by chi-square test. Logistic regression analysis wasfurther performed to test the association of plasma phospholipid FAcomposition with ICAS, being the occurrence of ICAS as a depen-dent variable and FA content as an independent variable. Themodelwas adjusted for age, gender, BMI, blood lipid measures, coexistingconditions andmedications, and the results were presented as oddsratio (ORs) and 95% confidence intervals (CIs). A two-tailed value ofp < 0.05 was considered statistically significant.
3. Results
3.1. Clinical and biochemical characteristics of the study subjects
This study consisted of three groups: non-stroke control group(n ¼ 215), stroke patients with no cerebral atherosclerotic stenosisgroup (NCAS, n ¼ 144) and ICAS group (n ¼ 104). Table 1 comparesgeneral and biochemical characteristics among the groups. Age,coexistence of hypertension (HTN) and diabetes mellitus (DM)were significantly different among the groups. There were nosignificant differences in mean values of BMI, the proportion ofgender and medication among the groups. No significant differ-ences in fasting levels of total cholesterol, LDL-cholesterol andglucose were observed among the groups (Table 1). In contrast,plasma levels of TG and HDL-cholesterol were significantlydifferent among the groups. Since average age and coexistence ofHTN and DM were significantly different among the groups, asearlier described, we compared BMI, glucose and the lipidmeasures after adjusting for age and coexistence of HTN and DM.Plasma levels of HDL-cholesterol were significantly lower in thestroke group (NCAS þ ICAS group) after the adjustment. On theother hand, BMI, glucose and lipid measurewere similar among thegroups after the adjustment.
3.2. Pattern analysis for FA composition in plasma phospholipids
PCA was performed on each group to examine the intrinsicvariation of each group, and outliers located outside of the 95%confidence interval curve of Hotelling’s T2 on the PCA scores plot(the data are not shown here) were removed. After removingoutliers from the subgroups, PLS-DA was performed on the two
Table 1Baseline characteristics of study subjects.
Non-stroke (n ¼ 215) NCAS (n
Age (yrs) 54.4 � 10.5b 62.5 � 1Males: FemalesA 118:97 89:53Coexisting conditionA
HTN (%) 54.9 45.7DM (%) 13.2 26.6
Body mass index (kg/m2) 24.3 � 4.5 23.9 � 2Total cholesterol (mg/dL) 188.5 � 35.4 180.0 �Triglyceride (mg/dL) 139.6 � 63.2a 121.6 �HDL-cholesterol (mg/dL) 50.6 � 11.1a 45.5 � 1LDL-cholesterol (mg/dL) 115.1 � 30.4 111.9 �Fasting glucose (mg/dL) 103.2 � 28.9 104.3 �
Values are Mean � SD.P1: unadjusted p-value, tested by analysis of variance (ANOVA) with boferrnoi method;General Linear Model (GLM).Alphabet ‘a’ indicates that the value is significantly higher than that indicated by alphabSharing the same alphabet indicates no significant differences between the two values i
A Tested by chi-squared test.
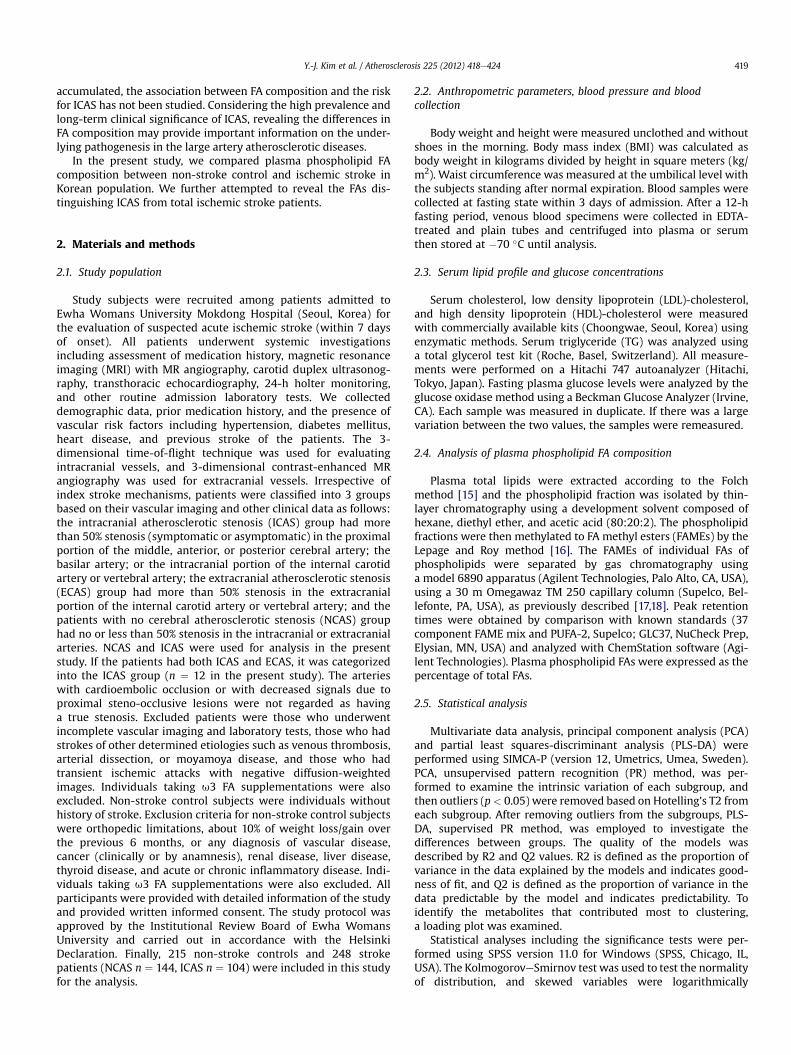
groups (non-stroke control vs stroke including NCAS and ICAS) tomaximize a separation between groups. As shown in Fig. 1, a PLS-DA scores plot showed a clear separation between the non-strokecontrol group and the stroke group. The cumulative R2 and Q2
values, up to two latent variables (LV1 and LV2), were 25% and 36%,respectively. A PLS-DA score plot showed a clear discriminationbetween the non-stroke control group and the stroke group alonglatent variable-1 (LV1) and �2 (LV2); the cumulative R2 and Q2
values, up to two latent variables (LV1 and LV2), were 25% and 67%,respectively (Fig. 1A). Next, PLS-DAwas further performed on NCASgroup and ICAS group to check the difference between two groups.The results showed that NCAS group was not very well separatedfrom the ICAS group in general (Fig. 2A). However, the loading plot(Fig. 2B) revealed that docosahexaenoic acid (DHA) and eicosa-pentaenoic acid (EPA) were important FAs for distinguishing thetwo groups (NCAS group vs ICAS group).
3.3. Comparisons of plasma phospholipid fatty acid compositionbetween non-stroke controls and ischemic stroke patients
To further investigate the significance of the interesting FAs, wecompared the proportions of FAs in plasma phospholipids betweennon-stroke controls and ischemic stroke patients. Since averageage, HDL-cholesterol and coexistence of HTN and DM were signif-icantly different among the groups, we compared plasma phos-pholipid FA compositions after adjusting for age, HDL-cholesteroland coexistence of HTN and DM using GLM analysis. As shown inTable 2, the proportions of palmitic acid, g-linolenic acid andarachidonic acid were significantly higher in stroke patientscompared to those in non-stroke controls (Table 2). In contrast, theproportions of linolenic acid, a-linolenic acid, cis-11,14-eicosadienoic acid, 5-8-11-eicosatrienoic acid and EPA weresignificantly lower in stroke patients compared to those in non-stroke controls. In addition, sum of saturated FAs and u6 FAs inplasma phospholipid were significantly higher in stroke patientscompared to those in non-stroke controls. On the other hand, sumof u3 FAs in plasma phospholipid was significantly lower in strokepatients than those in non-stroke controls.
3.4. FA contents distinguishing ICAS
We further compared FA compositions in plasma phospholipidsamong the three groups (non-stroke control, NCAS and ICAS group)using the GLM model with the same adjustment (Fig. 3 andSupplement). As shown in Fig. 3, the proportions of palmitic acid
¼ 144) ICAS (n ¼ 104) P1 P2
2.3a 66.1 � 12.5a <0.001 e
58:45 NS e
39.7 <0.01 e
25.0 <0.005 e
.7 23.4 � 3.0 NS NS34.2 185.4 � 4.5 NS NS62.1b 110.6 � 58.9b <0.001 NS2.5b 45.8 � 12.1b <0.001 <0.0132.4 118.7 � 32.9 NS NS32.9 107.5 � 36.5 NS NS
P2: p-value adjusted for age, gender, BMI and coexistence of HTN and DM tested by
et ‘b’.n the same row.
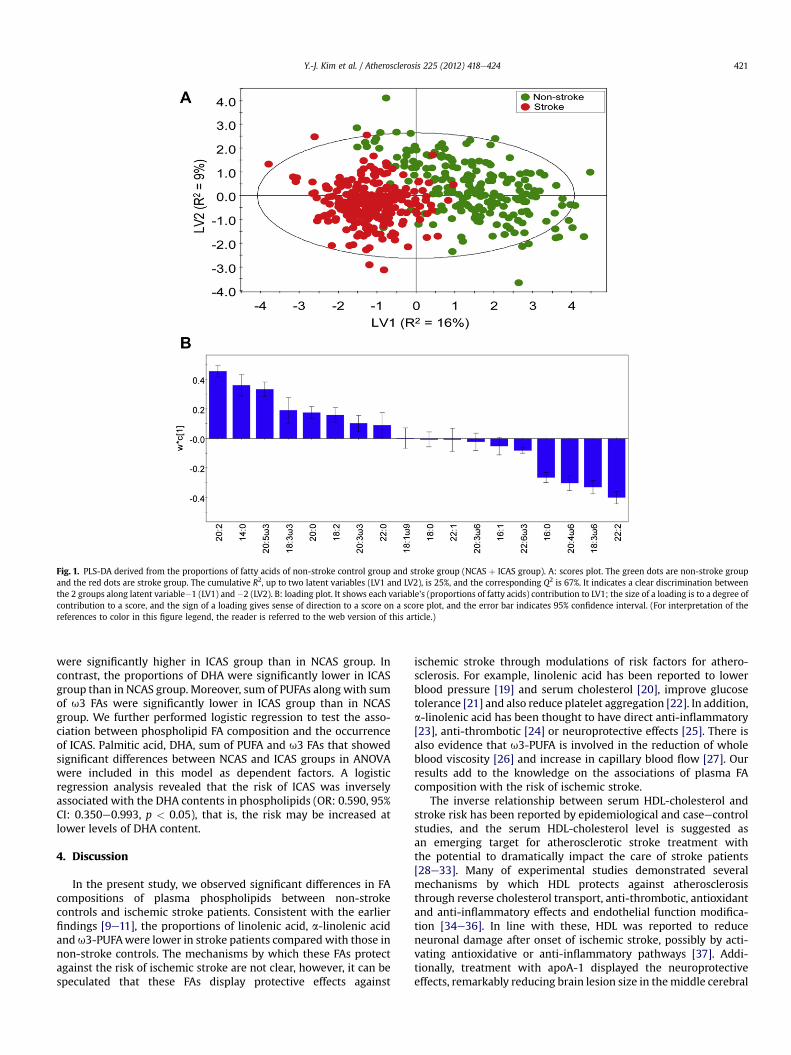
Fig. 1. PLS-DA derived from the proportions of fatty acids of non-stroke control group and stroke group (NCAS þ ICAS group). A: scores plot. The green dots are non-stroke groupand the red dots are stroke group. The cumulative R2, up to two latent variables (LV1 and LV2), is 25%, and the corresponding Q2 is 67%. It indicates a clear discrimination betweenthe 2 groups along latent variable�1 (LV1) and �2 (LV2). B: loading plot. It shows each variable’s (proportions of fatty acids) contribution to LV1; the size of a loading is to a degree ofcontribution to a score, and the sign of a loading gives sense of direction to a score on a score plot, and the error bar indicates 95% confidence interval. (For interpretation of thereferences to color in this figure legend, the reader is referred to the web version of this article.)
Y.-J. Kim et al. / Atherosclerosis 225 (2012) 418e424 421
were significantly higher in ICAS group than in NCAS group. Incontrast, the proportions of DHA were significantly lower in ICASgroup than in NCAS group. Moreover, sum of PUFAs along with sumof u3 FAs were significantly lower in ICAS group than in NCASgroup. We further performed logistic regression to test the asso-ciation between phospholipid FA composition and the occurrenceof ICAS. Palmitic acid, DHA, sum of PUFA and u3 FAs that showedsignificant differences between NCAS and ICAS groups in ANOVAwere included in this model as dependent factors. A logisticregression analysis revealed that the risk of ICAS was inverselyassociated with the DHA contents in phospholipids (OR: 0.590, 95%CI: 0.350e0.993, p < 0.05), that is, the risk may be increased atlower levels of DHA content.
4. Discussion
In the present study, we observed significant differences in FAcompositions of plasma phospholipids between non-strokecontrols and ischemic stroke patients. Consistent with the earlierfindings [9e11], the proportions of linolenic acid, a-linolenic acidandu3-PUFAwere lower in stroke patients compared with those innon-stroke controls. The mechanisms by which these FAs protectagainst the risk of ischemic stroke are not clear, however, it can bespeculated that these FAs display protective effects against
ischemic stroke through modulations of risk factors for athero-sclerosis. For example, linolenic acid has been reported to lowerblood pressure [19] and serum cholesterol [20], improve glucosetolerance [21] and also reduce platelet aggregation [22]. In addition,a-linolenic acid has been thought to have direct anti-inflammatory[23], anti-thrombotic [24] or neuroprotective effects [25]. There isalso evidence that u3-PUFA is involved in the reduction of wholeblood viscosity [26] and increase in capillary blood flow [27]. Ourresults add to the knowledge on the associations of plasma FAcomposition with the risk of ischemic stroke.
The inverse relationship between serum HDL-cholesterol andstroke risk has been reported by epidemiological and caseecontrolstudies, and the serum HDL-cholesterol level is suggested asan emerging target for atherosclerotic stroke treatment withthe potential to dramatically impact the care of stroke patients[28e33]. Many of experimental studies demonstrated severalmechanisms by which HDL protects against atherosclerosisthrough reverse cholesterol transport, anti-thrombotic, antioxidantand anti-inflammatory effects and endothelial function modifica-tion [34e36]. In line with these, HDL was reported to reduceneuronal damage after onset of ischemic stroke, possibly by acti-vating antioxidative or anti-inflammatory pathways [37]. Addi-tionally, treatment with apoA-1 displayed the neuroprotectiveeffects, remarkably reducing brain lesion size in themiddle cerebral
Fig. 2. PLS-DA derived from the proportions of fatty acids of NCAS group and ICAS group. A: scores plot. The blue dots are NCAS group and the green dots are ICAS group. Thecumulative R2, up to two latent variables (LV1 and LV2), is 30%, and the corresponding Q2 is 17%. The low Q2 value indicates that NCAS group was not significantly different from ICASgroup. B: loading plot. It shows each variable’s (proportions of fatty acids) contribution to LV1; the size of a loading is to a degree of contribution to a score, and the sign of a loadinggives sense of direction to a score on a score plot, and the error bar indicates 95% confidence interval. (For interpretation of the references to color in this figure legend, the reader isreferred to the web version of this article.)
Y.-J. Kim et al. / Atherosclerosis 225 (2012) 418e424422
artery occlusion model [38]. In the present study, we observed thatserum HDL-cholesterol levels were significantly lower in strokepatients than in non-stroke control, supporting that low bloodHDL-cholesterol levels reflect a greater risk for atheroscleroticstroke.
The main objective of this study was to identify FAs dis-tinguishing ICAS from total ischemic stroke. Of interest is thefindingthat u3-PUFA, especially DHA and EPA in phospholipids, wereimportant FAs for distinguishing ICAS in stroke in this study.Particularly, a logistic regression analysis revealed that the risk ofICAS was inversely associated with the levels of DHA contents inphospholipids, which indicates that DHA may have a protectiveeffect against ICAS. The exact mechanism explaining the associationof DHA with ICAS is not known, however, there may be severalplausiblemechanisms. Omega 3-PUFA, which have unique chemicalstructures and three-dimensional configurations, may influencemultiple relevant molecular pathways, which might contribute tothe effects on physiological risk factors and clinical events [1,2]. Incell culture and animal studies, the incorporation of u3-PUFA intomembrane phospholipids alters the physicochemical properties ofmembrane rafts and caveolae, thereby favoring membrane associ-ated protein localization and function [1]. Thus, it is possible that theprotective aspect of DHA in the pathogenesis of ICAS could beattributable to its biological function. Alternatively, DHA is thought
to be the most likely neuroactive component within fish oils.Accumulation of DHA in the brain has been associated with reduc-tion of neuroinflammation [39,40] and activation of anti-apoptoticpathways [41]. Lalancette-Hè et al [42] reported that diet-inducedaccumulation of DHA in the brain protected against post-ischemicinflammation and injury and suggested that increased DHA intakemay provide protection against acute immune response and braindamage in ischemic stroke. Taken together, it can be speculated thatDHA may confer a protective effect on the pathogenesis of ICAS ofwhich the intracranial arterial cell layers and membranes are rela-tively thin, narrow and weak highly susceptible to damage fromhigh blood pressure, inflammation and oxidative stress [43]. Furtherstudies are needed to elucidate the mechanism explaining theserelationships of this study.
So far, clinical effects of u3-PUFA on the risk and outcome forstroke have been inconsistently reported. Fish consumption hasbeen suggested to reduce the risk of ischemic stroke [6], on theother hand, the incidence of stroke was not significantly influencedby fish oil [7,8]. Nevertheless, established effects on several riskfactors for CVD such as blood lipid profile, platelet aggregation andinflammation [44e46] may provide biological plausibility that u3-PUFA could reduce the incidence or risk of stroke. This can besupported by a Swedish mammography cohort study which foundthat intake of long-chain u3-PUFA among dietary fats were

Table 2Proportions of fatty acid composition in plasma phospholipids between non-strokecontrol and stroke groups by general linear model analysis.
Non-stroke(n ¼ 215)
Stroke(n ¼ 248)
P
16:0 palmitic acid 27.3 � 0.2 28.5 � 0.2 <0.00116:1 palmitoleic acid 0.78 � 0.02 0.83 � 0.02 NS18:0 stearic acid 14.8 � 0.2 14.9 � 0.1 NS18:1 u9 oleic acid 7.8 � 0.1 7.7 � 0.1 NS18:2 u6 linolenic acid 13.9 � 0.2 13.0 � 0.2 <0.0118:3 u6 g-linolenic acid 0.25 � 0.01 0.38 � 0.01 <0.00118:3 u3 a-linolenic acid 0.57 � 0.02 0.48 � 0.02 <0.0120:0 arachidic acid 1.05 � 0.02 0.96 � 0.03 <0.0520:2 cis-11,14-eicosadienoic
acid1.36 � 0.03 0.79 � 0.04 <0.001
20:3 u6 dihimo-g-linolenicacid
2.72 � 0.05 2.68 � 0.05 NS
20:3 u3 5-8-11-eicosatrienoicacid
0.51 � 0.02 0.44 � 0.32 <0.05
20:4 u6 arachidonic acid 6.6 � 0.2 8.1 � 0.1 <0.00120:5 u3 eicosapentaenoic
acid (EPA)2.9 � 0.1 2.2 � 0.1 <0.001
22:0 behenic acid 1.97 � 0.03 1.88 � 0.05 NS22:1 erucic acid 0.82 � 0.07 0.79 � 0.04 NS22:2 docosadienoic acid 0.28 � 0.02 0.60 � 0.02 <0.00122:6 u3 docosahexaenoic
acid (DHA)8.8 � 0.1 8.9 � 0.1 NS
S Saturated fat 47.9 � 023 50.2 � 0.2 <0.001S Monounsaturated fat 9.7 � 0.1 9.9 � 0.1 NSS Polyunsaturated fat 37.7 � 0.4 37.5 � 0.3 NSS u6 PUFA 23.4 � 0.2 24.1 � 0.3 <0.05S u3-PUFA 12.7 � 0.2 11.9 � 0.2 <0.001
Mean � S.E. expressed as percentage of total fatty acids.P: p-value adjusted for age, gender, BMI, HDL-cholesterol and coexistence of HTNand DM, tested by General Linear Model.
Fig. 3. Proportions of fatty acid composition in plasma phospholipids among thegroups by general linear model analysis Mean � S.E., expressed as percentage of totalfatty acids, p: p-value adjusted for age, gender, BMI, HDL-cholesterol and coexistenceof HTN and DM, tested by General Linear Model. Alphabet ‘a’ indicates that the value issignificantly higher than that indicated by alphabet ‘b’. Sharing the same alphabetindicates no significant differences between the two values.
Y.-J. Kim et al. / Atherosclerosis 225 (2012) 418e424 423
inversely associated with the risk of total stroke when adjusted forother stroke risk factors [4]. Our results further provide the infor-mation on the contribution of u3-PUFA, especially EPA and DHA inphospholipid to reduce risks for ICAS.
In summary, this study showed that FA compositions in phos-pholipids were significantly different between non-stroke controland ischemic stroke patients and especially between NCAS andICAS among stroke patients. The u3-PUFA, especially DHA and EPAin phospholipids are important FAs for distinguishing betweenNCAS and ICAS in stroke. Additionally, the risk of ICASwas inverselyassociated with the levels of DHA contents in phospholipids.Considering plasma phospholipid DHA reflects dietary intake, ourresults indicate a potential benefit of sufficient amounts of DHA inplasma or in the diet could reduce the risk of ICAS.
Source of funding
This research was supported by Basic Science Research Programthrough the National research Foundation of Korea (NRF) funded bythe Ministry of Education, Science and Technology (2012-0002119)and the Creative Allied Project (CAP) grant funded by the KoreaResearch Council of Fundamental Science and Technology (KRCF).
Disclosure summary
There are no potential conflicts of interest.
Acknowledgment
All the authors were involved in the development of the studyprotocol and the experimental design. All the authors read, com-mented on, and contributed to the submitted manuscript. Samplecollection and experiments were performed by OYK, YJK, YC andJHC. Data were analyzed by YJK, SYC, GSH and MJS. The manuscriptwas written and revised by OYK, and MJS. MJS provided theresearch funding. None of the authors have any conflicts of interestin relation to the materials presented in this paper.
Appendix A. Supplementary data
Supplementary data related to this article can be found online athttp://dx.doi.org/10.1016/j.atherosclerosis.2012.09.007.
References
[1] Mozaffarian D, Wu JH. Omega-3 fatty acids and cardiovascular disease affectson risk factors, molecular pathways, and clinical events. J Am Coll Cardiol2011;58:2047e67.
[2] Tsuda K, Tsuda S, Minatogawa Y, Iwahashi H, Kido R, Masuyama Y. Decreasedmembrane fluidity of erythrocytes and cultured vascular smooth muscle cellsin spontaneously hypertensive rats: an electron spin resonance study. Clin Sci(Lond) 1988;75:477e80.
[3] Singer P, Wirth M, Gerike U, Godicke W, Moritz V. Age dependent alterationsof linolenic, arachidonic and eicosapentaenoic acids in renal and medulla ofspontaneously hypertensive rats. Prostaglandins 1984;27:375e90.
[4] Larssona SC, Virtamo J, Wolk A. Dietary fats and dietary cholesterol and risk ofstroke in women. Atherosclerosis 2012;221:282e6.
[5] Montonen J, Järvinen R, Reunanen A, Knekt P. Fish consumption and theincidence of cerebrovascular disease. Br J Nutr 2009;102:750e6.
[6] He K, Song Y, Daviglus ML, et al. Fish consumption and incidence of stroke:a meta-analysis of cohort studies. Stroke 2004;35:1538e42.
[7] Hooper L, Thompson RL, Harrison RA, et al. Omega 3 fatty acids for preventionand treatment of cardiovascular disease. Cochrane Database Syst Rev 2004:CD003177.
[8] Tanaka K, Ishikawa Y, Yokoyama M, et al. Reduction in the recurrence ofstroke by eicosa pentaenoic acid for hypercholesterolemic patients: sub-analysis of the JELIS trial. Stroke 2008;39:2052e8.
[9] Park S, Park S, Yi H, et al. Low level of n-3 polyunsaturated fatty acids inerythrocytes is a risk factor for both acute ischemic and hemorrhagic stroke inKoreans. Nutr Res 2009;29:825e30.
Y.-J. Kim et al. / Atherosclerosis 225 (2012) 418e424424
[10] Iso H, Sato S, Umemura U, et al. Linolenic acid, other fatty acids, and the risk ofstroke. Stroke 2002;33:2086e93.
[11] Tilvis RS, Erkinjuntti T, Sulkava R, Farkkila M, Miettinen TA. Serum lipids andfatty acids in ischemic strokes. Am Heart J 1987;113:615e9.
[12] Leung SY, Ng TH, Yuen ST, Lauder IJ, Ho FC. Pattern of cerebral atherosclerosisin Hong Kong Chinese. Severity in intracranial and extracranial vessels. Stroke1993;24:779e86.
[13] Gorelick PB, Wong KS, Bae HJ, Pandey DK. Large artery intracranial occlusivedisease: a large worldwide burden but a relatively neglected frontier. Stroke2008;39:2396e9.
[14] Kasner SE, Chimowitz MI, Lynn MJ, , et alWarfarin Aspirin SymptomaticIntracranial Disease Trial Investigators. Predictors of ischemic stroke in theterritory of a symptomatic intracranial arterial stenosis. Circulation 2006;113:555e63.
[15] Folch J, Lees M, Sloane Stanley GH. A simple method for the isolation andpurification of total lipids from animal tissues. J Biol Chem 1957;226:497e509.
[16] Lepage G, Roy CC. Direct transesterification of all classes of lipids in a one-stepreaction. J Lipid Res 1986;27:114e20.
[17] Lemaitre RN, King IB, Mozaffarian D, et al. Plasma phospholipid trans fattyacids, fatal ischemic heart disease, and sudden cardiac death in older adults.Circulation 2006;114:209e15.
[18] Do HJ, Chung HK, Moon J, Shin MJ. Relationship between the estimates ofdesaturase activities and cardiometabolic phenotypes in Koreans. J Clin Bio-chem Nutr 2011;49:135e41.
[19] Iacono JM, Puska P, Dougherty RM, et al. Effects of dietary fat on bloodpressure in a rural Finish population. Am J Clin Nutr 1983;38:860e9.
[20] Keys A, Parlin RW. Serum cholesterol response to changes in dietary lipids.Am J Clin Nutr 1966;19:175e81.
[21] Salomma V, Ahola I, Tumileho J, et al. Fatty acid composition of serumcholesterol esters in different degrees of glucose intolerance: a population-based study. Metabolism 1990;39:1285e91.
[22] Renald S. Linolenic acid, platelet aggregation and myocardial infarction.Atherosclerosis 1990;80:255e6.
[23] Stark AH, Crawford MA, Reifen R. Update on alpha-linolenic acid. Nutr Rev2008;66:326e32.
[24] Campos H, Baylin A, Willett WC. Alpha-linolenic acid and risk of nonfatalacute myocardial infarction. Circulation 2008;118:339e45.
[25] Nguemeni C, Delplanque B, Rovere C, et al. Dietary supplementation of alpha-linolenic acid in an enriched rapeseed oil diet protects from stroke. PharmacolRes 2010;61:226e33.
[26] Terano T, Hirai A, Hamazaki T, et al. Effect of oral administration of highlypurified eicosapentaenoic acid on platelet function, blood viscosity andred cell deformability in healthy human subjects. Atherosclerosis 1983;46:321e31.
[27] Bruckner G, Webb P, Greenwell L, Chow C, Richardson D. Fish oil increasesperipheral capillary blood cell velocity in humans. Atherosclerosis 1987;66:237e45.
[28] Soyama Y, Miura K, Morikawa Y, et al. High-density lipoprotein cholesteroland risk of stroke in Japanese men and women: the OYABE study. Stroke2003;34:863e8.
[29] Lindenstrom E, Boysen G, Nyboe J. Influence of total cholesterol, high densitylipoprotein cholesterol, and triglycerides on risk of cerebrovascular disease:the Copenhagen city heart study. BMJ 1994;309:11e5.
[30] Tanne D, Yaari S, Goldbourt U. High-density lipoprotein cholesterol and risk ofischemic stroke mortality: a 21-year follow-up of 8586 men from the Israeliischemic heart disease study. Stroke 1997;28:83e7.
[31] Sacco RL, Benson RT, Kargman DE, et al. High-density lipoprotein cholesteroland ischemic stroke in the elderly: the Northern Manhattan stroke study.JAMA 2001;285:2729e35.
[32] Bowman TS, Sesso HD, Ma J, et al. Cholesterol and the risk of ischemic stroke.Stroke 2003;34:2930e4.
[33] Sanossina N, Saver JL, Navad M, Ovbiagele B. High-density lipoproteincholesterol: an emerging target for stroke treatment. Stroke 2007;38:1104e9.
[34] Brewer Jr HB. Increasing HDL cholesterol levels. N Engl J Med 2004;350:1491e4.
[35] Berliner JA, Watson AD. A role for oxidized phospholipids in atherosclerosis.N Engl J Med 2005;353:9e11.
[36] NavabM,HamaSY,HoughGP, SubbanagounderG,ReddyST, FogelmanAM.Acell-free assay for detectingHDL that is dysfunctional in preventing the formationof orinactivating oxidized phospholipids. J Lipid Res 2001;42:1308e17.
[37] Paterno RRA, Postiglione A, Hubsch A, Andresen I, Lang MG. Reconstitutedhigh-density lipoprotein exhibits neuroprotection in two rat models of stroke.Cerebrovasc Dis 2004;17:204e11.
[38] Paterno R, Ruocco A, Cicale M, et al. Acute neuroprotective effect of high-density lipoprotein in experimental models of cerebral stroke (ABS). Stroke2006;37:729.
[39] Laye S. Polyunsaturated fatty acids, neuroinflammation and well being.Prostaglandins Leukot Essent Fatty Acids 2010;82:295e303.
[40] Orr SK, Bazinet RP. The emerging role of docosahexaenoic acid in neuro-inflammation. Curr Opin Investig Drugs 2008;9:735e43.
[41] AkbarM, Calderon F,WenZ, KimHY. Docosahexaenoic acid: a positivemodulatorofakt signaling inneuronal survival. ProcNatlAcadSciUSA2005;102:10858e63.
[42] Lalancette-Hèbert M, Julien C, Cordeau P, et al. Accumulation of dietarydocosahexaenoic acid in the brain attenuates acute immune response anddevelopment of postischemic neuronal damage. Stroke 2011;42:2903e9.
[43] Mulè G, Cusimano P, Cerasola G. The metabolic syndromeearterial stiffnessrelationship in patients with ischaemic stroke: role of inflammation. Eur JNeurol 2008;15:759e61.
[44] Eslick GD, Howe PR, Smith C, Priest R, Bensoussan A. Benefits of fish oilsupplementation in hyperlipidemia: a systematic review and meta-analysis.Int J Cardiol 2009;136:4e16.
[45] Knapp HR. Dietary fatty acids in human thrombosis and hemostasis. Am J ClinNutr 1997;65:1687Se98S.
[46] Calder PC. Polyunsaturated fatty acids, inflammation, and immunity. Lipids2001;36:1007e24.