Plasma metabolomics for the diagnosis and prognosis of ...
15
RESEARCH Open Access Plasma metabolomics for the diagnosis and prognosis of H1N1 influenza pneumonia Mohammad M. Banoei 1 , Hans J. Vogel 2 , Aalim M. Weljie 2,3 , Anand Kumar 4 , Sachin Yende 5,6 , Derek C. Angus 5,6 , Brent W. Winston 1,7,8* and the Canadian Critical Care Translational Biology Group (CCCTBG) Abstract Background: Metabolomics is a tool that has been used for the diagnosis and prognosis of specific diseases. The purpose of this study was to examine if metabolomics could be used as a potential diagnostic and prognostic tool for H1N1 pneumonia. Our hypothesis was that metabolomics can potentially be used early for the diagnosis and prognosis of H1N1 influenza pneumonia. Methods: 1 H nuclear magnetic resonance spectroscopy and gas chromatography-mass spectrometry were used to profile the metabolome in 42 patients with H1N1 pneumonia, 31 ventilated control subjects in the intensive care unit (ICU), and 30 culture-positive plasma samples from patients with bacterial community-acquired pneumonia drawn within the first 24 h of hospital admission for diagnosis and prognosis of disease. Results: We found that plasma-based metabolomics from samples taken within 24 h of hospital admission can be used to discriminate H1N1 pneumonia from bacterial pneumonia and nonsurvivors from survivors of H1N1 pneumonia. Moreover, metabolomics is a highly sensitive and specific tool for the 90-day prognosis of mortality in H1N1 pneumonia. Conclusions: This study demonstrates that H1N1 pneumonia can create a quite different plasma metabolic profile from bacterial culture-positive pneumonia and ventilated control subjects in the ICU on the basis of plasma samples taken within 24 h of hospital/ICU admission, early in the course of disease. Keywords: H1N1 pneumonia, Metabolomics, NMR, GC-MS, Biomarkers Background H1N1 influenza infection is a major health burden that can be life-threatening, particularly among the elderly and pa- tients with comorbid diseases [1, 2]. In adults, influenza re- mains the predominant viral cause of community-acquired pneumonia (CAP) and has a relatively high mortality [3, 4]. The case fatality rate of influenza pneumonia in adults can reach up to 30% in the intensive care unit (ICU). Approxi- mately 5% to 9% of patients with influenza in the United States, and 11% in Canada, require hospitalization. Further- more, 13% to 45.3% of hospitalized patients with influenza pneumonia are admitted to the ICU [5]. It is noteworthy that from 12 April 2009 to 10 April 2010, there were approximately 60.8 million cases of H1N1 (range 43.3 million–89.3 million) resulting in 274,304 hospitaliza- tions (range 195,086–402,719) and 12,469 deaths (range 8868–18,306) in the United States [6]. Early identification of patients with H1N1 influenza pneumonia can play a critical role in disease management by improving the early administration of antiviral drugs. Delay in therapy for H1N1 influenza pneumonia has been associated with increased ICU admission and mortality [7]. Biomarkers may facilitate early diagnosis and progno- sis, as well as help determine response to treatment and develop new insights into ongoing pathophysiologic pro- cesses in viral pneumonia. One promising approach for identifying biomarkers of disease is the use metabolomic profiling. The application of metabolomics in the investi- gation of various diseases has rapidly evolved and pro- vides researchers with a powerful approach to gain new * Correspondence: [email protected] 1 Department of Critical Care Medicine, University of Calgary, Calgary, AB, Canada 7 Department of Medicine, University of Calgary, Health Research Innovation Center (HRIC), Room 4C64, 3280 Hospital Drive N.W., Calgary, AB T2N 4Z6, Canada Full list of author information is available at the end of the article © The Author(s). 2017 Open Access This article is distributed under the terms of the Creative Commons Attribution 4.0 International License (http://creativecommons.org/licenses/by/4.0/), which permits unrestricted use, distribution, and reproduction in any medium, provided you give appropriate credit to the original author(s) and the source, provide a link to the Creative Commons license, and indicate if changes were made. The Creative Commons Public Domain Dedication waiver (http://creativecommons.org/publicdomain/zero/1.0/) applies to the data made available in this article, unless otherwise stated. Banoei et al. Critical Care (2017) 21:97 DOI 10.1186/s13054-017-1672-7
Transcript of Plasma metabolomics for the diagnosis and prognosis of ...

RESEARCH Open Access
Plasma metabolomics for the diagnosis andprognosis of H1N1 influenza pneumoniaMohammad M. Banoei1, Hans J. Vogel2, Aalim M. Weljie2,3, Anand Kumar4, Sachin Yende5,6, Derek C. Angus5,6,Brent W. Winston1,7,8* and the Canadian Critical Care Translational Biology Group (CCCTBG)
Abstract
Background: Metabolomics is a tool that has been used for the diagnosis and prognosis of specific diseases. Thepurpose of this study was to examine if metabolomics could be used as a potential diagnostic and prognostic toolfor H1N1 pneumonia. Our hypothesis was that metabolomics can potentially be used early for the diagnosis andprognosis of H1N1 influenza pneumonia.
Methods: 1H nuclear magnetic resonance spectroscopy and gas chromatography-mass spectrometry were used toprofile the metabolome in 42 patients with H1N1 pneumonia, 31 ventilated control subjects in the intensive careunit (ICU), and 30 culture-positive plasma samples from patients with bacterial community-acquired pneumoniadrawn within the first 24 h of hospital admission for diagnosis and prognosis of disease.
Results: We found that plasma-based metabolomics from samples taken within 24 h of hospital admission can beused to discriminate H1N1 pneumonia from bacterial pneumonia and nonsurvivors from survivors of H1N1pneumonia. Moreover, metabolomics is a highly sensitive and specific tool for the 90-day prognosis of mortality inH1N1 pneumonia.
Conclusions: This study demonstrates that H1N1 pneumonia can create a quite different plasma metabolic profilefrom bacterial culture-positive pneumonia and ventilated control subjects in the ICU on the basis of plasmasamples taken within 24 h of hospital/ICU admission, early in the course of disease.
Keywords: H1N1 pneumonia, Metabolomics, NMR, GC-MS, Biomarkers
BackgroundH1N1 influenza infection is a major health burden that canbe life-threatening, particularly among the elderly and pa-tients with comorbid diseases [1, 2]. In adults, influenza re-mains the predominant viral cause of community-acquiredpneumonia (CAP) and has a relatively high mortality [3, 4].The case fatality rate of influenza pneumonia in adults canreach up to 30% in the intensive care unit (ICU). Approxi-mately 5% to 9% of patients with influenza in the UnitedStates, and 11% in Canada, require hospitalization. Further-more, 13% to 45.3% of hospitalized patients with influenzapneumonia are admitted to the ICU [5]. It is noteworthy
that from 12 April 2009 to 10 April 2010, there wereapproximately 60.8 million cases of H1N1 (range 43.3million–89.3 million) resulting in 274,304 hospitaliza-tions (range 195,086–402,719) and 12,469 deaths(range 8868–18,306) in the United States [6].Early identification of patients with H1N1 influenza
pneumonia can play a critical role in disease managementby improving the early administration of antiviral drugs.Delay in therapy for H1N1 influenza pneumonia has beenassociated with increased ICU admission and mortality [7].Biomarkers may facilitate early diagnosis and progno-
sis, as well as help determine response to treatment anddevelop new insights into ongoing pathophysiologic pro-cesses in viral pneumonia. One promising approach foridentifying biomarkers of disease is the use metabolomicprofiling. The application of metabolomics in the investi-gation of various diseases has rapidly evolved and pro-vides researchers with a powerful approach to gain new
* Correspondence: [email protected] of Critical Care Medicine, University of Calgary, Calgary, AB,Canada7Department of Medicine, University of Calgary, Health Research InnovationCenter (HRIC), Room 4C64, 3280 Hospital Drive N.W., Calgary, AB T2N 4Z6,CanadaFull list of author information is available at the end of the article
© The Author(s). 2017 Open Access This article is distributed under the terms of the Creative Commons Attribution 4.0International License (http://creativecommons.org/licenses/by/4.0/), which permits unrestricted use, distribution, andreproduction in any medium, provided you give appropriate credit to the original author(s) and the source, provide a link tothe Creative Commons license, and indicate if changes were made. The Creative Commons Public Domain Dedication waiver(http://creativecommons.org/publicdomain/zero/1.0/) applies to the data made available in this article, unless otherwise stated.
Banoei et al. Critical Care (2017) 21:97 DOI 10.1186/s13054-017-1672-7

insights into the pathophysiologic mechanisms of diseaseand enhance diagnostic and prognostic tools [8].Targeted and nontargeted metabolomic methods such as
proton nuclear magnetic resonance (1H-NMR) spectros-copy, gas chromatography-mass spectrometry (GC-MS),and liquid chromatography-mass spectrometry allow forthe identification of more than 4000 metabolites in humanbiofluids [9]. 1H-NMR and GC-MS analyses of biofluidsare widely used as potential tools with highly reproducibleresults for the identification of metabolites [10].Using nontargeted 1H-NMR and GC-MS approaches,
we tested the hypothesis that metabolomic profiling canbe applied to plasma samples drawn within 24 h of ad-mission to the hospital to diagnose patients with H1N1pneumonia vs. patients with bacterial CAP and venti-lated ICU control subjects. In addition, we further hy-pothesized that plasma metabolomics could be used forthe prognosis of mortality through separation of H1N1nonsurvivors from survivors using samples drawn within24 h of hospital admission.
MethodsStudy subjectsForty-two patients with confirmed influenza virus A(H1N1) pneumonia were included in this study frommultiple Canadian centers by the University of
Manitoba. Only patients ≥18 years of age were includedin the study.To diagnose H1N1, 31 noninfected ventilated control
ICU patients were selected on the basis of age- and sex-matching to the patients with H1N1 (Table 1). Venti-lated ICU control subjects were patients admitted to theICU postoperatively after an elective procedure (e.g.,posterior cranial fossa or spinal surgery) if there was nosuspicion of infection and plasma was collected on day 1of ICU admission while these patients were ventilated inthe ICU. Moreover, 29 culture-positive samples from pa-tients with bacterial CAP were selected from a multicen-ter study at the University of Pittsburgh for diagnosticcomparison of bacterial pneumonia with the patient co-hort with H1N1 virus (Table 1). Bacterial CAP sampleswere identified on the basis of clinical and radiologic cri-teria as described previously [11]. The bacterial sourcesof infection included different species, such as Strepto-coccus pneumoniae, Staphylococcus aureus, Pseudo-monas aeruginosa, and Escherichia coli.Of 42 patients with H1N1, 21 patients consisting of 7
nonsurvivors and 14 survivors were used for the mortalityprognosis training set in H1N1 pneumonia. Table 2 showsthe demographics of the nonsurvivors and survivors usedfor the training set for the mortality prognosis portion ofthe study.
Table 1 Clinical and demographic characteristics of H1N1 patients vs. positive bacterial culture patients and ICU ventilated controls
Variable H1N1 patients (n = 29) Positive bacterial culture (n = 29)
Age yrs. (mean ± SD) 51.1 ± 13.2 70.4 ± 20.7
Male/Female 13/16 13/16
APACHE II/APACHE IIIa 23.5 ± 7.4 72.8 ± 24.4
ICU LOS* 20.1 ± 14.5 1.7 ± 3.2
Hospital LOS* 32 ± 23.8 10.4 ± 10.3
Smoker 13 17
Altered LOC 2 5
Renal Failure 2 1
CHF 3 6
Alcohol 3 4
Cerebrovascular Disease 3 4
Variable H1N1 patients (n = 42) ICU ventilated controls (n = 31)
Age yrs. (mean ± SD) 45.7 ± 14.6 50.6 ± 13.8
Male/Female 13/29 14/17
BMI (mean ± SD)* 35.2 ± 12.6 30.7 ± 7.6
APACHE II 22 ± 7.7 19.1 ± 5.7
ICU LOS* 20.6 ± 15.6 4 ± 4.9
Hospital LOS 31.5 ± 23.5 24.7 ± 33.9
SD standard deviation, (%) of subjects, unless otherwise indicated, LOS Length of Stay, DBA Days before admission, APACHE II Acute Physiology and Chronic HealthEvaluation II ICU scoring system, CHF congestive heart disease. aThe APACHE II score is for H1N1 and APACHE III is for positive bacterial culture, *reflectsstatistically significant difference in groups p < 0.05
Banoei et al. Critical Care (2017) 21:97 Page 2 of 15

Study designThis case-control study was nested within three cohortsenrolled at the universities of Calgary, Manitoba, andPittsburgh. To determine whether metabolomics can beused to diagnose H1N1 pneumonia, we compared 42 pa-tients with H1N1 pneumonia with 31 age- and sex-matched ICU patients who required mechanical ventila-tion and 29 patients with H1N1 pneumonia with 29 sex-matched patients with bacterial CAP. To determinewhether metabolomics could be used to predict mortalityamong 42 patients with H1N1, we compared 14 survivorsand 7 age- and sex-matched nonsurvivors (ratio 2:1) at 90days as a training set. A total of 42 patient samples wereexamined, with 21 patient samples used as a “discovery”cohort for the mortality study. The other 21 patient sam-ples were used as a validation cohort; however, all of thesewere survivors. All tested patients with H1N1 infectionhad no initial detected bacterial coinfection.
1H-NMR spectroscopic analysis and metaboliteconcentration profiling1H-NMR spectroscopic analysis was performed in one-dimensional mode for all samples using a 600-MHzBruker Ultrashield Plus NMR spectrometer (BrukerBioSpin Ltd., Milton, ON, Canada). Details of the pulsesequence can be found in the data acquisition section ofthe supplement (see Additional file 1). Chenomx NMRSuite 7.1 software (Chenomx Inc., Edmonton, AB,Canada) was used to profile the 1H-NMR spectra for me-tabolite identification and quantification using a nontar-geted profiling approach in the profiler module [12]. Weused 4,4-dimethyl-4-silapentane-1-sulfonic acid as an in-ternal standard for metabolite quantification [13].
GC-MSGC-MS analysis was also performed on all samples usingan Agilent chromatograph 7890A (Agilent Technologies,Santa Clara, CA, USA) coupled with a Waters GCT massspectrometer (Waters Corp., Milford, MA, USA), using agas chromatography time-of-flight mass spectrometrytechnique. The mass spectrometer was programmed in therange of 50–800 mass-to-charge ratio. Using MetaboliteDetector software (version 2.06; Institut für Biochemie &Biotechnologie, Technische Universität Carolo-Wilhelminazu Braunschweig, Braunschweig, Germany), mass spectrawere processed and analyzed to detect compounds. TheGolm Metabolome Database [14] and National Institute ofStandards and Technology 2008 library [15] were used toidentify compounds. For sample preparation information,please see the online supplement (see Additional file 1).
Multivariate data analysesUnsupervised multivariate principal component analysis(PCA) was performed to assess the data acquired onplasma 1H-NMR metabolites and GC-MS features frompatients with H1N1 (n = 42) vs. ventilated ICU controlsubjects (n = 31) and from patients with H1N1 (n = 29) vs.patients with CAP with positive bacterial cultures (n = 29).PCA was also performed as an exploratory model on allidentified plasma 1H-NMR and GC-MS data from thetraining set of H1N1 samples (14 H1N1 survivors vs. 7nonsurvivors matched by age and sex). The PCA modelwas used to identify data grouping and outliers and toexamine the intrinsic differences between the two cohortsfor each analytical technique. The number of quantifiedmetabolites/features for PCA analysis of each study aredepicted in Additional file 2: Table S14.
Table 2 Clinical and demographic characteristics of H1N1 patients with laboratory-confirmed influenza H1N1 infection
Variables Non-survivor H1N1 patients (n = 7) Survivor H1N1 patients (n = 14)
Age yrs. (mean ± SD) 51.4 ± 18.3 50.2 ± 13.2
Male/Female 2/5 4/10
BMI (mean ± SD) 32.8 ± 11.7 35.2 ± 12.8
Race
CaucasianFirst nation
42
113
APACHE II 23.2 ± 9.1 20.8 ± 8.3
ICU LOS 18.4 ± 7.8 18.5 ± 16.6
Symptoms DBA 5.2 ± 3.3 5.9 ± 3.2
Smoker 2 (28) 5 (35)
Alcoholism 2 (28) 2 (14)
Pregnancy 0 (0) 2 (14)
SD standard deviation, (%) of subjects, unless otherwise indicated, LOS Length of Stay, DBA Days before admission, APACHE II Acute Physiology and Chronic HealthEvaluation II ICU scoring system, CHF congestive heart disease. aThe APACHE II score is for H1N1 and APACHE III is for positive bacterial culture, *reflectsstatistically significant difference in groups p < 0.05
Banoei et al. Critical Care (2017) 21:97 Page 3 of 15

Orthogonal partial least-squares discriminant analysis(OPLS-DA) was then performed to build predictionmodels of H1N1 diagnosis and mortality. OPLS-DA wasused to maximize covariance between the measured var-iables and the response variables (predictive classifica-tions). The quality of the OPLS-DA model was verifiedusing three performance indicators: cross-validation ana-lysis of variance (CV-ANOVA), R2Y, and Q2Y (see Add-itional file 1 for more details). Additionally, the otherparameters used to describe the predictive models weresensitivity, specificity, and AUROC. Potential con-founders (e.g., age, sex, body mass index [BMI]) and co-morbidities (e.g., asthma, chronic obstructive pulmonarydisease [COPD]) were examined for their importanceusing orthogonal 2 partial least squares (O2PLS) model-ing of mortality of H1N1 pneumonia.Pathway analysis of potential biomarkers was
performed using MetaboAnalyst software (http://www.metaboanalyst.ca). We also used Ingenuity PathwayAnalysis (IPA) software (version 3.1; Ingenuity SystemsInc., Qiagen Bioinformatics, Redwood City, CA, USA) todiscover the most important biological networks usingsignificantly altered metabolites between cohorts. Thesignificantly changed metabolites were obtained throughmultivariate data analysis; OPLS-DA was used to discrim-inate metabolomic profiles between two groups.
Prediction set modelingTo obtain sensitivity, specificity, and AUROC data, weperformed a prediction test to create a misclassificationtable for all discriminant analysis models for diagnosisand prognosis studies. We repeated the process threetimes to create randomly the prediction test and to aver-age sensitivity and specificity. Moreover, for the progno-sis of mortality study, the prediction sets were createdfrom current active models (work sets) by taking sevenrandom samples (two nonsurvivors and five survivors)out of the OPLS-DA models three times and averagingsensitivity, specificity, and AUROC. In addition, anotherprediction model (validation) was tested using the co-hort of 21 survivors who were not used in the formerprediction (test) set and 2 randomly selected nonsurvi-vors. Misclassification tests showed 100% sensitivity and100% specificity for this prediction group.
Univariate data analysisUnivariate analysis was performed as a complementarymethod to multivariate statistical analysis for enhancingthe amount of information from the study and to serve asa less complex way to understand the cohort differences.We used MetaboAnalyst software for the univariate ana-lysis and Student’s t test for evaluation of each variable in-dividually to determine whether the means of two groupswere distinct for the diagnosis and prognosis studies. To
perform univariate analysis, both NMR and GC-MS data-sets were normalized, followed by log transformation andautoscaling. The important features in each dataset wereselected by t test with a threshold of 0.05.
ResultsDiagnosis of H1N1 pneumonia based on a ventilated ICUcontrol population and patients with culture-positivebacterial CAPTo assess the value of plasma metabolomics for the diag-nosis of H1N1 pneumonia, patients with H1N1 pneumo-nia, ventilated ICU control subjects, and patients withCAP with positive bacterial cultures were used to exploreand create prediction models based on 29 patients withH1N1 pneumonia vs. 29 sex-matched patients with CAPwith positive bacterial cultures and based on 42 patientswith H1N1 pneumonia vs. 31 age- and sex-matchedventilated ICU control subjects (Table 1).
Metabolomic pattern of diagnostic cohortsA PCA scatterplot of the entire 1H-NMR and GC-MSdatasets demonstrated that the H1N1 cohort could be dis-tinguished from patients with CAP with positive bacterialcultures (see Additional file 2: Figure S1a and b) and theventilated ICU control subjects (see Additional file 2:Figure S2a and b). OPLS-DA models showed a clear dis-crimination of metabolomic profiles of patients withH1N1 from profiles of patients with CAP with positivebacterial cultures (Fig. 1a and b) and ICU control subjects(Fig. 2a and b).Table 3 shows the prediction models using OPLS-DA to
discriminate plasma H1N1 samples from ICU control sub-ject and positive bacterial culture CAP samples on thebasis of NMR and GC-MS datasets and number of metab-olites that contributed in the separation between groups.Q2 indicates an excellent separation between the plasmametabolic profile of H1N1 and ICU control subjects,whereas the prediction model for the NMR dataset is notas high as the GC-MS dataset to separate H1N1 from posi-tive bacterial culture CAP cohort data. There are a largenumber of metabolites contributing to the separation ofpatients with H1N1 from patients with CAP with positivebacterial cultures and ventilated ICU control subjects, sug-gesting that H1N1 pneumonia could create a disease-specific metabolic profile quite distinct from the two othercohorts (Table 4). These data show that plasma metabolo-mics using 1H-NMR and GC-MS analytical platformscould be applied as a diagnostic tool with high predictabil-ity, sensitivity, and specificity for identification of H1N1 in-fluenza pneumonia. The data show that H1N1 pneumoniais accompanied by metabolomic changes in the concentra-tion of some common metabolites (amino acids and ke-tone bodies) and some specific metabolites compared withpatients with CAP with positive bacterial cultures and
Banoei et al. Critical Care (2017) 21:97 Page 4 of 15
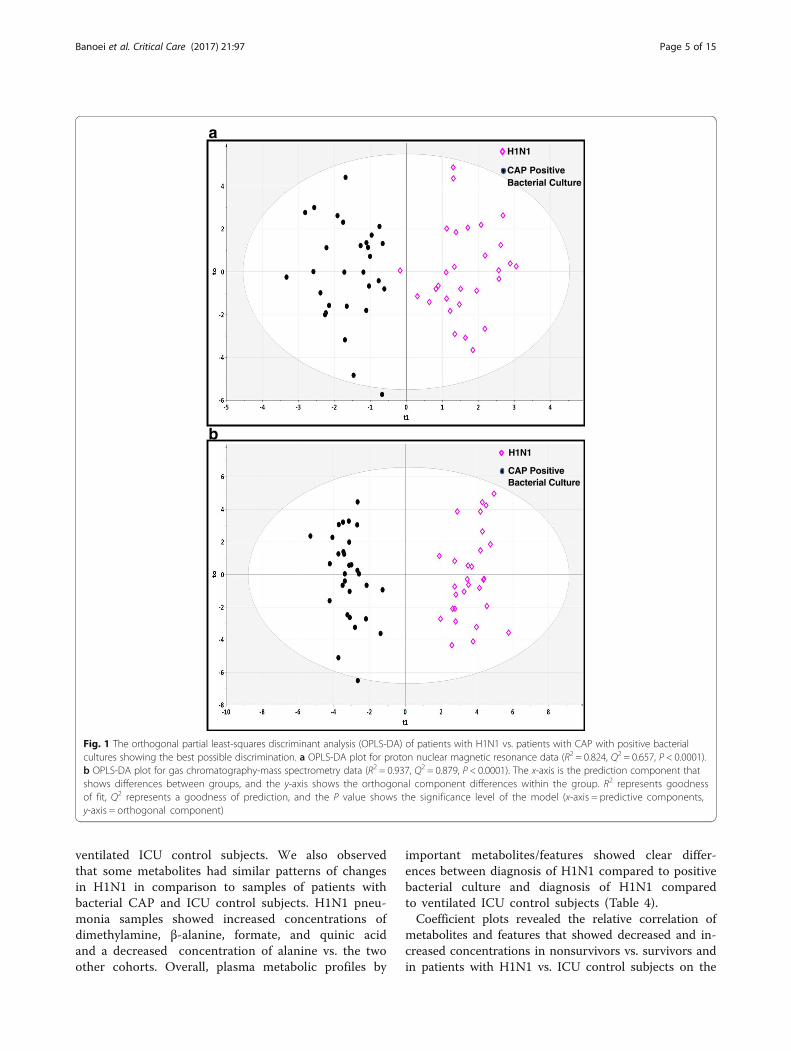
ventilated ICU control subjects. We also observedthat some metabolites had similar patterns of changesin H1N1 in comparison to samples of patients withbacterial CAP and ICU control subjects. H1N1 pneu-monia samples showed increased concentrations ofdimethylamine, β-alanine, formate, and quinic acidand a decreased concentration of alanine vs. the twoother cohorts. Overall, plasma metabolic profiles by
important metabolites/features showed clear differ-ences between diagnosis of H1N1 compared to positivebacterial culture and diagnosis of H1N1 comparedto ventilated ICU control subjects (Table 4).Coefficient plots revealed the relative correlation of
metabolites and features that showed decreased and in-creased concentrations in nonsurvivors vs. survivors andin patients with H1N1 vs. ICU control subjects on the
CAP Positive Bacterial Culture
H1N1
a
b
CAP Positive Bacterial Culture
H1N1
Fig. 1 The orthogonal partial least-squares discriminant analysis (OPLS-DA) of patients with H1N1 vs. patients with CAP with positive bacterialcultures showing the best possible discrimination. a OPLS-DA plot for proton nuclear magnetic resonance data (R2 = 0.824, Q2 = 0.657, P < 0.0001).b OPLS-DA plot for gas chromatography-mass spectrometry data (R2 = 0.937, Q2 = 0.879, P < 0.0001). The x-axis is the prediction component thatshows differences between groups, and the y-axis shows the orthogonal component differences within the group. R2 represents goodnessof fit, Q2 represents a goodness of prediction, and the P value shows the significance level of the model (x-axis = predictive components,y-axis = orthogonal component)
Banoei et al. Critical Care (2017) 21:97 Page 5 of 15

basis of NMR and GC-MS datasets. Table 5 shows themost important biological pathways for diagnosis andprognosis based on multivariate data analysis using coef-ficient plot and S-plot analysis. S-Plot analysis was usedto identify putative biomarkers on the basis of relatedOPLS-DA models to choose metabolites/features withhigh magnitude and high reliability (see Additional file 2:Figures S6, S8 and S10).
Metabolic profile by univariate analysis (diagnosis study)Univariate analysis was performed to show the mean,SD, and P values of metabolites/features obtained byNMR and GC-MS. Additional file 2: Tables S1 andS2 show the significantly different metabolites (P < 0.05)between H1N1 pneumonia and positive bacterial culturepneumonia samples for NMR (n = 13) and GC-MS (n =98). Additional file 2: Tables S3 and S4 also show the
ICU Controls
H1N1
ICU Controls
H
a
b
1N1
Fig. 2 The orthogonal partial least-squares discriminant analysis (OPLS-DA) of patients with H1N1 vs. ventilated ICU control subjects shows the bestpossible discrimination. a OPLS-DA plot for proton nuclear magnetic resonance data (R2 = 0.889, Q2 = 0.789, and P < 0.0001). b OPLS-DA plot for gaschromatography-mass spectrometry data (R2 = 0.963, Q2 = 0.946, P < 0.0001). The x-axis represents the prediction component that shows differencesbetween groups, and the y-axis represents the orthogonal component differences within the group. R2 represents goodness of fit, Q2 representsgoodness of prediction, and P value shows the significance level of the model (x-axis = predictive components, y-axis = orthogonal component)
Banoei et al. Critical Care (2017) 21:97 Page 6 of 15

significantly different metabolites (P < 0.05) between pa-tients with H1N1 pneumonia and ventilated ICU controlsubjects for NMR (n = 27) and GC-MS (n = 57). Multi-variate data analysis revealed more metabolites that weresignificantly changed between the H1N1 pneumonia co-horts and the two other cohorts on the basis of NMRdata, but the GC-MS findings did not show a largedifference in the number of metabolites between multi-variate and univariate data analyses. Although the multi-variate and univariate methods revealed high numbers ofoverlapping metabolites/features, we found a differentpattern for more significant metabolites/features be-tween multivariate and univariate methods in the diag-nosis of H1N1 (Figs. 3 and 4).
Prognosis of mortality of H1N1For the prognosis of 90-day mortality, prediction modelswere built on the basis of the training set. There were no sta-tistically significant differences (P< 0.05) on tested demo-graphic variables between the survivor and the nonsurvivorcohorts, except for the presence of fever, which was higher inthe survivor cohort (see Additional file 2: Table S15).
Metabolomic pattern of the prognostic cohortsA PCA score plot of the entire 1H-NMR dataset based onthe first and second principal components demonstratedthat the 90-day nonsurvivor group could be distinguishedfrom the survivor group; that is, there was data clustering)(see Additional file 2: Figure S3a). The PCA score plot of
Table 3 Summary of discrimination (OPLS-DA) modeling statistics for the diagnostic and prognosis of H1N1
Analytical tool R2Y Q2Y P value Sensitivity Specificity AUROC Metabolites/features
Discrimination (OPLS-DA) models for differentiation of H1N1 (n = 29) from sex-matched positive bacterial culture CAP samples (n = 29)
NMR 0.825 0.589 <0.0001 87 100 0.908 50
GC-MS 0.937 0.879 <0.0001 100 100 0.942 70 (known)
Discrimination (OPLS-DA) models for differentiation of H1N1 (n = 42) from age- and sex-matched ICU controls (n = 31)
NMR 0.889 0.789 <0.0001 100 100 0.921 55
GC-MS 0.981 0.971 <0.0001 100 100 0.959 68 (37 known)
Discrimination (OPLS-DA) models for prognosis of 90-day mortality in H1N1 (non-survivors (n = 7) vs. age- and sex-matched survivors (n = 14)
NMR 0.831 0.597 0.004 100 100 0.865 20
GC-MS 0.909 0.829 0.0001 100 100 0.909 63 (32 known)
Table 4 Most significant metabolites/ features changed between two cohorts for diagnosis and prognosis studies
Diagnosis of H1N1 pneumonia frompositive bacterial culture pneumonia
Diagnosis of H1N1 pneumoniafrom ventilated ICU controls
Prognosis of mortality of H1N1 pneumonia(non-survivors vs. survivors)
Decreased in H1N1 Increased in H1N1 Decreased in H1N1 Increased in H1N1 Decreased in H1N1nonsurvivors
Increased in H1N1nonsurvivors
NMR CitrateFumarate3-Methyl,2-IsovalerateAlanineTyrosineMethionineHistidine4-Hydroxybutyrate
AcetoacetateBeta-alanineFormateDimethylamineCarnitineGlycine
IsopropanolCitrateTaurineGlycine2-OxoglutarateGlutamineAlanineSerine
DimethylamineBeta-alanineAspartatePhenylalanineFormate3-HydroxyisovalerateFumarateO-PhosphocholineAdipateCholine2-HydroxyisovalerateProlineOrnithine
2-OxoglutarateDimethylamineIsopropanolCarnitine2-HydroxisovalerateLactatePhenylalanineAcetateTyrosine
2-AminobutyrateAcetoacetate2-HydroxybutyrateArginine3-Hydroxybutyrate
GC-MSa Uric acidTyrosineCitric acidAsparagineMyoinositolLysineArabinonic acidThreonineAspartic acidThreonic acid
Gulonic acidPentadecane2-amino ButanoicacidAlkaneQuinic acidBenzoic acid
GalactoseLactic acidGlucosePyroglutamic acidGalactopyranosideGlyceric acidFructoseBeta alanineGlycerolGlycine3-hydroxyl Butanoic acidPhenylalanine
Heptadecanoic acidPhosphoric acidHexadecanoic acidOctadecenoic acidOctadecaneQuinic acid
Threonic acidDodecaneDecanoic acid2-Amino, Butanoic acidValineGlycerol
MethioninePentadecane4, Amino, Benzoic acidHydroxylamine
aThe unknown’s features have not been listed
Banoei et al. Critical Care (2017) 21:97 Page 7 of 15

the features detected by GC-MS revealed similarly sepa-rated clusters for H1N1 nonsurvivors and survivors (seeAdditional file 2: Figure S3b).Once data clustering was revealed, we analyzed the
metabolomic profiling data using supervised OPLS-DA
for modeling. Of the NMR data (Fig. 5a), 27 different me-tabolites were used as potential variables (metabolites) toseparate nonsurvivors from survivors with a R2Y = 0.831and a Q2Y = 0.597, indicating very good separation be-tween the two cohorts at the plasma metabolomic level
3
2
1
0
-1
0
CA
P
H1N
1
Citrate3
2
1
0
-1
CA
P
H1N
1
3-Methyl-2-oxovalerate
2
1
0
-1
-2
CA
P
H1N
1
Formate3
2
1
0
-1
-2
CA
P
H1N
1
Histidine2
1
0
1-
-2
Beta-Alanine
CA
P
H1N
1
1.5
1.0
0.5
0.0
- 0.5
- 1.0
- 1.5
- 2.0
CA
P
H1N
1
Lactic acid2
1
0
-1
-2
CA
P
H1N
1
Myo-inositol
2
1
0
-1
-2
CA
P
H1N
1
Serine
1
0
-1
-2
CA
P
H1N
1
Phenylalanine
1.0
0.5
0.0
-0.5
- 2.0
-1.0
-1.5
CA
P
H1N
1
Urea
Fig. 3 Univariate analysis showing important metabolites/features between samples of patients with H1N1 pneumonia and bacterial pneumoniasamples. The top ten metabolites detected by proton nuclear magnetic resonance (first line) and gas chromatography-mass spectrometry (secondline) that have significantly changed in plasma between samples of patients with H1N1 pneumonia and culture-positive bacterial pneumoniasamples (units in normalized and scaled concentrations). The x-axis shows the specific metabolite, and the y-axis is the relative concentrationwhen samples of patients with community-acquired pneumonia are compared with the samples of patients with H1N1. The box-and-whiskerplots show the mean and SD of the metabolite
Table 5 Top biological pathways based on identified metabolites involved for diagnosis of and prognosis of H1N1
MetaboAnalystPathway analysis
NMR GC-MSa
Diagnosis of H1N1 Pneumonia fromPositive Bacterial Culture Pneumonia
- Synthesis and degradation of ketone bodies- Beta-alanine metabolism- Glycine, serine and threonine metabolism- Methane metabolism- Glyoxylate and dicarboxylate metabolism- Histidine metabolism
- Lysine degradation- Inositol phosphate metabolism
Diagnosis of H1N1 Pneumonia fromVentilated ICU Controls
- Taurine and hypotaurine metabolism- Glycine, serine and threonine- Beta-Alanine metabolism- Citrate cycle (TCA cycle)- Glyoxylate and dicarboxylate metabolism- Phenylalanine metabolism
- Galactose metabolism- Glycine, serine and threonine metabolism- Pyruvate metabolism- Phenylalanine metabolism
Prognosis of mortality of H1N1 pneumonia(separation nonsurvivors from survivors)
- Synthesis and degradation of ketone bodies- Arginine and Ornithine metabolism- Arginine and Proline metabolism- Phenylalanine metabolism- Citrate cycle (TCA cycle)
- Beta-Alanine metabolism- Galactose metabolism- Alanine, Aspartate and glutamate metabolism- Glycerolipid metabolism- Pyruvate metabolism and glycolysis or glycogenesis
aTop biological pathways obtained using the knowns features
Banoei et al. Critical Care (2017) 21:97 Page 8 of 15

for H1N1 mortality (Table 3). We used a statistical ap-proach based on variable importance in the projection ≥1to determine the number of analytes for the best predict-ive model using SIMCA-P Version 13.0, Umetrics AB,Umea, Sweden) [16].As shown in Fig. 5b, the GC-MS OPLS-DA model
showed samples from the survivor and nonsurvivorcohorts were well separated on the basis of 63 features(32 known and 31 unknown). The model characteristicswere numerically significant, with a R2Y = 0.909 and aQ2Y = 0.829, indicating an excellent model. To assessthe reliability of the OPLS-DA models for the NMR andGC-MS data, CV-ANOVA was performed. The P valuesfor both models were 0.004 and 0.0001 for the NMRand GC-MS models, respectively.Using O2PLS discriminant analysis [17], we tested the
role of confounding factors in separation of nonsurvi-vors from survivors, including patient characteristics andcomorbidities, but these did not affect the observed dis-crimination to prognosticate the mortality for bothNMR and GC-MS analyses. This suggests that the differ-entiation between the survivor and nonsurvivor groupsis based on disease metabolite changes rather than onthe roles of age, sex, and BMI in this study (see
Additional file 2: Figure S4a–c). Given these results, itcan be concluded that 1H-NMR and GC-MS are appro-priate analytical tools to apply a metabolomic approachfor prognosis of 90-day mortality of patients with H1N1influenza pneumonia on the basis of samples takenwithin 24 h of hospitalization.
Metabolic profile by univariate analysis (prognosis study)Univariate analysis showed that normalized concentra-tions of 7 metabolites detected by 1H-NMR and the rela-tive intensities of 19 features detected by GC-MS variedsignificantly among nonsurvivors and survivors. The sum-mary of all significant metabolites/features (P < 0.1) fromNMR and GC-MS are listed in Additional file 2: Tables S6and S7 with their P values and mean (±SD) values ofvariables in each group. A comparison of multivariate andunivariate approaches shows the differences in type andnumber of metabolites for both NMR and GC-MSdatasets to separate nonsurvivors from survivors (seeAdditional file 2: Tables S5 and S6). It was interesting tonote that using the multivariate statistical technique, weobserved more potential metabolites/features than in uni-variate analysis to distinguish H1N1 nonsurvivor fromsurvivor cohorts, with these two analytical methods
2
1
0
-1
-2
ICU
H1N
1Dimethylamine
2
1
0
-1
-2
ICU
H1N
1
Asparate
2
1
0
-1
-2
ICU
H1N
1
3-Hydroxyisovalerate
2
1
0
-1
ICU
H1N
1
Isopropanol2
1
0
-1
ICU
H1N
1
Phenylalanine
-2
1
0
-1
-2
ICU
H1N
1
Isoleucine
2
1
0
-1
-2
ICU
Fructose
H1N
1
1.0
0.5
0.0
-0.5
-1.0
-1.5
H1N
1
Lactic acid
1
0
-1
-2
ICU
H1N
1
Urea
-3
-4
ICU
1.0
0.5
0.0
ICU
H1N
1
Erythronic acid
-0.5
-1.0
Fig. 4 Univariate analysis showing important features of metabolites between H1N1 pneumonia samples and ventilated ICU control samples. Thetop ten metabolites/features detected by proton nuclear magnetic resonance (first line) and gas chromatography-mass spectrometry (second line)that have significantly changed in the plasma between H1N1 pneumonia samples and ventilated ICU control samples (units in normalized andscaled concentrations). The x-axis shows the specific metabolite, and the y-axis is the relative concentration when samples of patients with H1N1are compared with the ventilated ICU control patient samples. The box-and-whisker plots show the mean and SD of the metabolite
Banoei et al. Critical Care (2017) 21:97 Page 9 of 15

showing a very different metabolic profile pattern. Univar-iate methods are used to simplify the interpretation of dis-criminating metabolites individually. Interestingly, thisstudy showed that the univariate analysis could reject po-tential metabolites with only small changes that failed tohave significant differences by t test, whereas they couldbe more important when they were analyzed simultan-eously with the other metabolites; that is, the metabolitesmay not act independently on the outcome. Figure 6
shows all metabolites/features that are significantly differ-ent between nonsurvivors and survivors detected by NMRand GC-MS platforms using univariate analysis.
Metabolic pathway and function analysisThe important potential targets of metabolic pathwayanalysis obtained using MetaboAnalyst for NMR andGC-MS data showed an impact value ≥0.10. More de-tailed analysis of the most relevant pathways is listed in
Survivors
a
b
Non-Survivors
Survivors
Non-Survivors
Fig. 5 The supervised orthogonal partial least-squares discriminant analysis (OPLS-DA) shows the best possible discrimination between nonsurvivorsand survivors of H1N1 infection. a OPLS-DA plot for proton nuclear magnetic resonance data (R2 = 0.831, Q2 = 0.597, P = 0.004). b OPLS-DA plot for gaschromatography-mass spectrometry data (R2 = 0.909, Q2 = 0.829, P = 0.0001). The x-axis represents the prediction component that shows differencesbetween groups, and the y-axis represents the orthogonal component differences within the group. R2 represents goodness of fit, Q2 representsgoodness of prediction, and P value shows the significance level of the model (x-axis = predictive components, y-axis = orthogonal component)
Banoei et al. Critical Care (2017) 21:97 Page 10 of 15

1.5
1.0
0.5
0.0
- 0.5
- 1.0
- 1.5
D S
2-Oxoglutarate1.5
1.0
0.5
0.0
- 0.5
- 1.0
- 1.5D S
Acetoacetate
2
1
0
-1
2-Hyrdoxyisovalerate
D S
1.0
0.5
0.0
D S
Arginine
-0.5
-1.0
-1.5
1.5
1.0
0.5
0.0
- 0.5
- 1.0
- 1.5
D S
Isopropanol
1.5
1.0
0.5
0.0
- 0.5
- 1.0
- 1.5
D S
2-Hydroxybutyrate
- 2.0
2.0
1.5
1.0
0.5
0.0
- 0.5
- 1.0
D SIsobutyrate
- 1.5
1
0
-1
-2
Isoleucine
D S
1
0
-1
-2
Valine
D S
1.5
1.0
0.5
0.0
- 0.5
D S
Pyruvic acid1.0
0.5
0.0
- 0.5
- 1.0
- 1.5
Galactose
- 2.0
- 2.5
SD1.0
0.5
-1
D S
Hydroxylamine
-2
-3
- 4
Fig. 6 Univariate analysis showing all metabolites/features between H1N1 pneumonia nonsurvivors and H1N1 pneumonia survivors. All significantmetabolites/features detected by proton nuclear magnetic resonance (first and second lines) and gas chromatography-mass spectrometry (third line) thathave significantly changed in the plasma between H1N1 pneumonia nonsurvivors (D) and H1N1 pneumonia survivors (S) (units in normalized and scaledconcentrations). The x-axis shows the specific metabolite, and the y-axis is the relative concentration when samples from surviving patients with H1N1are compared with the samples of nonsurviving patients with H1N1. The box-and-whisker plots show the mean and SD of the metabolite
Table 6 Top network of biological pathways for diagnosis and prognosis studies based on the NMR and GC-MS datasets
Diagnosis of H1N1 pneumonia frompositive bacterial culture pneumonia
Diagnosis of H1N1 pneumoniafrom ventilated ICU controls
Prognosis of mortality of H1N1 pneumonia(nonsurvivors vs. survivors)
NMR 1. Amino Acid Metabolism, MolecularTransport, Small Molecule Biochemistry
2. Drug Metabolism, Molecular Transport,Small Molecule Biochemistry
1. Cell Cycle, Hepatic System Development andFunction, Cell-To-Cell Signaling and Interaction
2. Molecular Transport, Nucleic Acid Metabolism,Small Molecule Biochemistry
3. Drug Metabolism, Molecular Transport,Small Molecule Biochemistry
1. Increased levels of albumin.2. Cell to cell signaling and interaction.3. Cellular growth and proliferationmechanisms.
GC-MSa 1. Amino Acid Metabolism, MolecularTransport, Small Molecule Biochemistry
1. Cellular Compromise, Lipid Metabolism,Small Molecule Biochemistry
2. Lipid Metabolism, Molecular Transport,Small Molecule Biochemistry
3. Lipid Metabolism, Small MoleculeBiochemistry, Cellular Assembly andOrganization
4. Molecular Transport, Nucleic AcidMetabolism, Small Molecule Biochemistry.
1. Lipid metabolism.2. Amino acid metabolism
aThe generated networks obtained using known features
Banoei et al. Critical Care (2017) 21:97 Page 11 of 15

Addtitional file 2: Tables S7-S12 and Figures S11–S13.Table 5 shows the identified biological pathways in-volved, based on the most important metabolites foundby NMR and GC-MS analyses, in the diagnosis ofH1N1 pneumonia based on culture-positive bacterialpneumonia and ventilated ICU control subjects andprognosis of mortality in H1N1 pneumonia. The path-ways have been ordered by their impact values fromhigh to low in Table 5. Table 5 shows more differenti-ated biological pathways involved in the diagnosis ofH1N1 from ICU control subjects compared with patientswith culture-positive bacterial CAP. This evidence sug-gests that the difference in metabolomic profile betweenpatients with H1N1 pneumonia and ICU control subjectsis greater than that of patients with H1N1 pneumonia andculture-positive bacterial pneumonia, based on the OPLS-DA models (Table 4) as well as on the biological pathways.It is interesting that a variety of biological pathways werefound in separation of H1N1 nonsurvivors from survivorson the basis of metabolite changes. More potential net-works of biological pathways were generated through theuse of IPA software in the diagnosis and prognosis ofmortality studies for both NMR and GC-MS datasets(Table 6).
DiscussionA number of studies show the feasibility of using meta-bolomics for the diagnosis and prognosis of noninfec-tious and infectious pulmonary diseases in humans,including asthma [18], COPD [19], tuberculosis [20],hepatitis [21], sepsis [22–24], and pneumonia [25, 26].We have profiled the plasma metabolite response topneumonia caused by infection with the H1N1 influenzavirus, infection with bacteria, and noninfected, ventilatedICU control subjects, and we found that the metabolo-mic profiles strongly predict a difference between pa-tients with H1N1 pneumonia vs. culture-positivepatients with bacterial CAP and between patients withH1N1 pneumonia vs. ventilated ICU control subjects.Moreover, for H1N1 pneumonia prognosis, plasmametabolic profiles were highly specific and predictive toseparate the two cohorts of H1N1 pneumonia 90-daynonsurvivors and survivors, using plasma samples takenon the first day of admission to the hospital. This studyshows that plasma metabolomics can be a diagnosticallyand prognostically useful tool to diagnose H1N1 pneu-monia and predict mortality among a ventilated ICUpopulation early in the course of the disease.It is important to note that although the H1N1
pneumonia and culture-positive bacterial CAP cohortswere collected using two different anticoagulants—ethy-lenediaminetetraacetic acid, and sodium heparin—formetabolomic profiling, there is strong evidence showingcomparability [27, 28]; however, this remains a potential
problem for this analysis. Pathway analysis showed thatsome specific biological pathways were significantlyenriched in the diagnosis of H1N1 compared withculture-positive bacterial CAP samples, when comparingthe diagnosis of H1N1 from ventilated ICU control sub-jects, and when examining the prognosis of mortality.Lysine degradation could be related to the role of lysinein various mechanisms of fatty acid metabolism. Unpub-lished data by the authors suggest a role of lipid-derivedmetabolites in the prognosis of mortality in patients withbacterial CAP. Lysine is known as an essential aminoacid that is not synthesized in humans, whereas lysine isthe product of meso-2,6-diaminopimelate/lysine biosyn-thesis pathways for protein synthesis in gram-negativeand gram-positive bacteria [29], likely made availablefrom bacteria in the gastrointestinal tract.Bacterial infections have been shown to be associated
with the elevation of a number of metabolites. For ex-ample, systemic bacterial infection is accompanied byelevation of histidine uptake in the human jejunum [30].Moreover, histidine biosynthesis appears to occur in cer-tain bacterial infections when compared with viral infec-tion; in particular, pneumonia caused by chlamydia andAcinetobacter infections increase histidine biosynthesis[31]. Of note, histamine is a product of L-histidine me-tabolism, and this is a major metabolite present in in-flammation and potentially in bacterial pneumonia [32].Another lung pathogen, P. aeruginosa, also causes eleva-tion of histidine catabolism [33]. In addition, elevated in-ositol phosphate metabolism has been observed withPneumocystis pneumonia [34] and S. aureus infection intype II alveolar epithelial cells [35]. Methane metabolismpathways have been shown to be elevated in bacterialmeningitis caused by pathogenesis of different species,such as S. pneumoniae, N. meningitis, Haemophilusinfluenzae, and S. aureus [36].H1N1 infection does have effects on metabolism. In
terms of differentiation of H1N1 from ventilated controlsubjects, taurine and hypotaurine metabolism showedhigh pathway impact in pathway analysis. Taurine is animportant compound in bile acid conjugation in theliver, suggesting some involvement of the liver duringH1N1 infection. Moreover, taurine is an important intra-cellular free amino acid that is known as an antioxidantand a neuromodulator and is also involved in regulationof osmolarity in the neural retina and brain. Patientswith H1N1 showed lower concentration of taurine thanventilated ICU control subjects [37–39].Glycine, serine, and threonine metabolism is a com-
mon pathway to differentiate patients with H1N1 frompatients with bacterial CAP and ventilated ICU controlsubjects (Tables 3 and 4). For example, protein kinase Ris an active protein in the H5N1 infection against theantiviral effects of a serine-threonine protein [40]. The
Banoei et al. Critical Care (2017) 21:97 Page 12 of 15

decreased concentration of glycine, serine, and threoninein patients with H1N1 compared with ventilated ICUcontrol subjects as well as culture-positive patients withbacterial CAP might implicate consumption of theseamino acids through viral metabolism.In the mortality evaluation, 1H-NMR and GC-MS path-
way analyses revealed involvement of pathways associatedwith metabolism of glutamate, aspartate, and related com-pounds. When we examined these pathways in the con-text of acute H1N1 pneumonia deaths, they pointed toimportant clues in energy metabolism, glucose availability,and protein synthesis. Not surprisingly, one couldhypothesize that interfering with any of these pathwayswould result in a worse prognosis, as appears to be thecase. Pathway analysis points to the importance of energymetabolism with the involvement of glutamate, pyruvate,and alanine. On the basis of the findings of this study, itwould appear that disruption of amino acid metabolismand gluconeogenesis pathways may be key factors in regu-lating the difference between nonsurvivor and survivor re-sponses to H1N1 infection. Pathogenically, despite theprimary involvement of the respiratory system, the liverand kidneys are also targets for viral infection, which canhave significant effects on metabolism [41]; this ishighlighted in the online supplement.Chong and Street [42] observed that clinical presenta-
tions in elderly patients did not appear to be useful forprognosis of mortality, and our data support this finding.Metabolomic profiling revealed that the pathophysio-logic pathways initiated or affected by H1N1 infectionhave a greater influence on the metabolic responsesleading to mortality than the other observed factors,such as clinical demographics and serious comorbidities.Overall, the metabolic response to H1N1 infection cre-
ates a very distinct metabolic signature compared withthat related to bacterial infection and ventilated ICU con-trol subjects, which may be exploited for diagnostic pur-poses and, potentially, to follow response to therapy(Table 3). As expected, a large number and variety of topnetworks of biological pathways are different between pa-tients with H1N1 and ventilated ICU control subjects(Table 6).Few studies have evaluated the diagnostic ability of meta-
bolomics biomarkers in CAP [43]. Slupsky et al. [26] per-formed an NMR-based study of urine in CAP. They foundthat the urinary metabolic profile for pneumococcal pneu-monia significantly differs from the profiles of viral andother bacterial causes of pneumonia. The same group usedurine metabolic profiles for the successful diagnosis of twoimportant causes of CAP (S. pneumoniae and S. aureus) inhuman and animal model studies [25, 44]. Furthermore,Laiakis et al. [32] showed that the application of serum andplasma metabolomic analysis can successfully distinguishpatients with severe pneumonia from community control
subjects. Thus, metabolomics is being used successfully ona research basis for CAP diagnosis in humans, although ithas not been used for H1N1 pneumonia diagnosis andprognosis. The diagnosis of H1N1 pneumonia requires thepresence of specific symptoms, a chest x-ray consistentwith an atypical pneumonia pattern, and a diagnostic poly-merase chain reaction test. This paper provides evidencefor the potential use of plasma metabolomics as a furtherdiagnostic test for H1N1 pneumonia if future validationstudies confirm our findings.While the Acute Physiology and Chronic Health Evalu-
ation II (APACHE II) has been used to compare mortalitybetween health care systems in the ICU, it is not a goodpredictor of mortality in non-ICU patients [45]. APACHEII cannot accurately predict mortality in H1N1 cohorts(see Tables 1 and 2 and Additional file 2: S15). However,we show that 1H-NMR and GC-MS analysis can provide ahighly predictive statistical model to predict nonsurvivorsfrom survivors of H1N1 pneumonia and that theseanalytical tools have high sensitivity and specificity. Fur-thermore, the usefulness of metabolomics for mortalityprediction in H1N1 is shown using ROC curves as well asby linear regression (R2 score) when compared with APA-CHE II scores of the patients (see Additonal file 2:Table S13).There is no single, best choice of metabolomic analytical
techniques, because each of these methods carries its ownadvantages and disadvantages [46]. Although GC-MS is amore sensitive method with high separation efficiency, highspectral resolution, and high resolution to detect com-pounds, NMR is more quantifiable and reproducible [46].Examining a single time point in the pathologic
process is a potential limitation of this study, like inmost metabolomics studies performed to date. This canbe overcome only if sequential time points are examined.For this study, only single-time-point material was avail-able for metabolomic evaluation. Despite this limitation,the data presented are compelling.Other potential limitations of this study include the
relative small sample size and the fact that there was noprospective validation. W used as many samples as wereavailable in Canada for this study from that time period.We do wish more samples were available but they werenot. The samples size, though small, is still of sufficientsize to yield significant and compelling results. A repeatstudy with more patients in the future would be of valueto validate our finding. Validation was done here in acase-control format and not using a separate prospectivesample collection. This type of validation is acceptablebut not as powerful as a separate independent validationstudy. These limitations are very difficult to overcomegiven the limited samples available for analysis in thistime period. Certainly an independent validation studywould add tremendous validity to these initial findings.
Banoei et al. Critical Care (2017) 21:97 Page 13 of 15

Like all metabolomics studies, there are technologic lim-itations with the chosen techniques as the NMR studycomponent lacks sensitivity but it is quantitative andspecific: the GC-MS study component, though is moresensitive, lacks in quantitative ability and in specificitybecause of the limitations of the available GC-MS librar-ies. Despite these limitations, because the two tech-niques show similar findings, this adds to the validity ofthe study and helps overcome some of the limitations.
ConclusionsThis study demonstrates that plasma metabolomics reflectsa specific profile in patients with H1N1, an approach thatcould importantly be applied to the diagnosis and progno-sis of mortality in patients with H1N1 pneumonia. Weconclude that nontargeted metabolomics using 1H-NMRand GC-MS is highly predictive with sufficient sensitivityand specificity to prognosticate mortality by discriminationof nonsurvivors from survivors of H1N1 influenza pneu-monia. Also, analysis of the metabolome can accurately beapplied to identify H1N1 pneumonia cases from those withculture-positive bacterial CAP and ventilated ICU controlsubjects on the first day of admission to the hospital/ICU.We speculate that metabolomic studies can be used as pre-diction tools for timely administration of antiviral therapyand other supportive treatments that could result in betteroutcomes.
Additional files
Additional file 1: Supplementary material. (DOCX 64.6 kb)
Additional file 2: Supplementary material, figures, and tables.(DOCX 1.79 mb)
AbbreviationsAPACHE II: Acute Physiology and Chronic Health Evaluation II; BMI: Bodymass index; CAP: Community-acquired pneumonia; CCCTBG: CanadianCritical Care Translational Biology Group; COPD: Chronic obstructivepulmonary disease; CV-ANOVA: Cross-validation analysis of variance; GC-MS: Gas chromatography-mass spectrometry; 1H-NMR: Proton nuclearmagnetic resonance; ICU: Intensive care unit; IPA: Ingenuity Pathway Analysis;O2PLS: Orthogonal 2 partial least squares; OPLS-DA: Orthogonal partial least-squares discriminant analysis; PCA: Principal component analysis
AcknowledgementsWe acknowledge the help of Josee Wong and Dr. Beata Mickiewicz. Wealso acknowledge the help of Dr. Christopher Doig with statistical analysisand valuable comments by Dr. Kathleen Stringer. We thank the CriticalCare Epidemiologic and Biologic Tissue Resource (CCEPTR), the Randomized,Double-Blinded Controlled Trial Comparing High vs Standard Dose Oseltamivirin Severe, Influenza Infection in ICU (ROSII) study group, the Genetic andInflammatory Markers of Sepsis (GenIMS) study group, and the H1N1translational study group for plasma samples used in this study. Weacknowledge the help of the many nurses and physicians, as well as, mostimportant, the patients, involved in this study. We also acknowledge the inputby critique of the data presented to the Canadian Critical Care TranslationalBiology Group, especially the following members: Jamie Hutchison, Universityof Toronto; Patricia Liaw, McMaster University; Jane Batt, University of Toronto;Alison Fox-Robichard, McMaster University; Emmanuel Charbonney, Universityof Montreal; and Jean-Francois Cailhier, University of Montreal; as well asothers.
FundingThis work was supported by an emerging team grant from the Faculty ofMedicine, University of Calgary, Alberta Health Services, and Alberta’s HealthResearch and Innovations Strategy (to BWW and HJV).
Availability of data and materialsData are available on request.
Authors’ contributionsMMB contributed to metabolomic profiling analysis, data collection, statisticalanalysis, and interpretation. HJV contributed by providing facilities anddrafting the manuscript. AK contributed to H1N1 sample collection anddrafting of the manuscript. AMW contributed to manuscript revision andinterpretation. SY contributed to bacterial CAP sample collection anddrafting of the manuscript. DCA contributed to bacterial CAP samplecollection and drafting of the manuscript. BWW had full access to all thedata in the study; contributed to the study concept and design, interpretation,drafting of the manuscript; and approved the final manuscript. The CCCTBGcommittee contributed to input critique of data presentation and revision ofthe manuscript. All authors read and approved the final manuscript.
Competing interestsThe authors declare that they have no competing interests.
Consent for publicationNot applicable.
Ethics approval and consent to participateThe study protocol was approved by the Health Research Ethics Board of theUniversity of Manitoba (Winnipeg, MB, Canada), the University of Pittsburgh(Pittsburgh, PA, USA), and the Conjoint Health Research Ethics Board at theUniversity of Calgary(Calgary, AB, Canada). Written informed consent wasobtained from all patients or their surrogates.
Publisher’s NoteSpringer Nature remains neutral with regard to jurisdictional claims inpublished maps and institutional affiliations.
Author details1Department of Critical Care Medicine, University of Calgary, Calgary, AB,Canada. 2Bio-NMR Centre, Centre for Advanced Technologies, Department ofBiochemistry and Molecular Biology, University of Calgary, Calgary, AB,Canada. 3Department of Pharmacology, University of Pennsylvania,Philadelphia, PA, USA. 4Section of Critical Care Medicine, Winnipeg HealthSciences Centre, St. Boniface Hospital, University of Manitoba, Winnipeg, MB,Canada. 5Clinical Research, Investigation, and Systems Modeling of AcuteIllness (CRISMA) Center, Department of Critical Care Medicine, University ofPittsburgh, Pittsburgh, PA, USA. 6Department of Critical Care Medicine,University of Pittsburgh, Pittsburgh, PA, USA. 7Department of Medicine,University of Calgary, Health Research Innovation Center (HRIC), Room 4C64,3280 Hospital Drive N.W., Calgary, AB T2N 4Z6, Canada. 8Department ofBiochemistry and Molecular Biology, University of Calgary, Health ResearchInnovation Center (HRIC), Room 4C64, 3280 Hospital Drive N.W., Calgary, ABT2N 4Z6, Canada.
Received: 17 October 2016 Accepted: 17 March 2017
References1. Perez-Padilla R, de la Rosa-Zamboni D, Ponce de Leon S, Hernandez M,
Quiñones-Falconi F, Bautista E, et al. Pneumonia and respiratory failure fromswine-origin influenza A (H1N1) in Mexico. N Engl J Med. 2009;361(7):680–9.
2. Ramsey C, Kumar A. H1N1: viral pneumonia as a cause of acute respiratorydistress syndrome. Curr Opin Crit Care. 2011;17(1):64–71.
3. Ruuskanen O, Lahti E, Jennings LC, Murdoch DR. Viral pneumonia. Lancet.2011;377(9773):1264–75.
4. Freed DH, Henzler D, White CW, Fowler R, Zarychanski R, Hutchison J, et al.Extracorporeal lung support for patients who had severe respiratory failuresecondary to influenza A (H1N1) 2009 infection in Canada. Can J Anaesth.2010;57(3):240–7.
Banoei et al. Critical Care (2017) 21:97 Page 14 of 15

5. Sehgal N, Woodhead M. Predicting the unpredictable: is it possible clinicallyto separate H1N1 from non-H1N1 community-acquired pneumonia? Thorax.2011;66(3):187–8.
6. Shrestha SS, Swerdlow DL, Borse RH, Prabhu VS, Finelli L, Atkins CY, et al.Estimating the burden of 2009 pandemic influenza A (H1N1) in the UnitedStates (April 2009–April 2010). Clin Infect Dis. 2011;52 Suppl 1:S75–82.
7. Halasa NB. Update on the 2009 pandemic influenza A H1N1 in children.Curr Opin Pediatr. 2010;22(1):83–7.
8. German JB, Watkins SM, Fay LB. Metabolomics in practice: emergingknowledge to guide future dietetic advice toward individualized health.J Am Diet Assoc. 2005;105(9):1425–32.
9. Psychogios N, Hau DD, Peng J, Guo AC, Mandal R, Bouatra S, et al. Thehuman serum metabolome. PLoS One. 2011;6(2):e16957.
10. Viant MR, Ludwig C, Günther UL. 1D and 2D NMR spectroscopy: frommetabolic fingerprinting to profiling. In: Griffiths WJ, editor. Metabolomics,metabonomics and metabolite profiling. Cambridge: RSC Publishing; 2008.p. 44–67.
11. Kellum JA, Kong L, Fink MP, Weissfeld LA, Yealy DM, Pinsky MR, et al.Understanding the inflammatory cytokine response in pneumonia andsepsis: results of the Genetic and Inflammatory Markers of Sepsis (GenIMS)Study. Arch Intern Med. 2007;167(15):1655–63.
12. Weljie AM, Newton J, Mercier P, Carlson E, Slupsky CM. Targetedprofiling: quantitative analysis of 1H NMR metabolomics data. AnalChem. 2006;78(13):4430–42.
13. Wishart DS, Knox C, Guo AC, Eisner R, Young N, Gautam B, et al. HMDB:a knowledgebase for the human metabolome. Nucleic Acids Res. 2009;37(Database issue):D603–10.
14. Hummel J, Selbig J, Walther D, Kopka J. The Golm Metabolome Database:a database for GC-MS based metabolite profiling. In: Nielsen J, Jewett MC,editors. Metabolomics: a powerful tool in systems biology, vol. 18. Berlin:Springer-Verlag; 2007. p. 75–96.
15. Stein SE. Chemical substructure identification by mass spectral librarysearching. J Am Soc Mass Spectrom. 1995;6(8):644–55.
16. Galindo-Prieto B, Eriksson L, Trygg J. Variable influence on projection(VIP) for orthogonal projections to latent structures (OPLS). J Chemom.2014;28(8):623–32.
17. Trygg J. O2-PLS for qualitative and quantitative analysis in multivariatecalibration. J Chemom. 2002;16(6):283–93.
18. Ho WE, Xu YJ, Xu F, Cheng C, Peh HY, Tannenbaum SR, et al. Metabolomicsreveals altered metabolic pathways in experimental asthma. Am J RespirCell Mol Biol. 2013;48(2):204–11.
19. Ubhi BK, Riley JH, Shaw PA, Lomas DA, Tal-Singer R, MacNee W, et al.Metabolic profiling detects biomarkers of protein degradation in COPDpatients. Eur Respir J. 2012;40(2):345–55.
20. Weiner 3rd J, Parida SK, Maertzdorf J, Black GF, Repsilber D, Telaar A, et al.Biomarkers of inflammation, immunosuppression and stress with activedisease are revealed by metabolomic profiling of tuberculosis patients. PLoSOne. 2012;7(7):e40221.
21. Godoy MM, Lopes EP, Silva RO, Hallwass F, Koury LC, Moura IM, et al.Hepatitis C virus infection diagnosis using metabonomics. J Viral Hepat.2010;17(12):854–8.
22. Mickiewicz B, Vogel HJ, Wong HR, Winston BW. Metabolomics as a novelapproach for early diagnosis of pediatric septic shock and its mortality. AmJ Respir Crit Care Med. 2013;187(9):967–76.
23. Mickiewicz B, Duggan GE, Winston BW, Doig C, Kubes P, Vogel HJ, AlbertaSepsis Network. Metabolic profiling of serum samples by 1H nuclearmagnetic resonance spectroscopy as a potential diagnostic approach forseptic shock. Crit Care Med. 2013;24(5):1140–9.
24. Langley RJ, Tsalik EL, van Velkinburgh JC, Glickman SW, Rice BJ, Wang C, et al.An integrated clinico-metabolomic model improves prediction of death insepsis. Sci Transl Med. 2013;5(195):195ra195.
25. Slupsky CM. Nuclear magnetic resonance-based analysis of urine for therapid etiological diagnosis of pneumonia. Expert Opin Med Diagn.2011;5(1):63–73.
26. Slupsky CM, Rankin KN, Fu H, Chang D, Rowe BH, Charles PGP, et al.Pneumococcal pneumonia: potential for diagnosis through a urinarymetabolic profile. J Proteome Res. 2009;8(12):5550–8.
27. Pinto J, Domingues MRM, Galhano E, Pita C, do Céu Almeida M, Carreira IM,et al. Human plasma stability during handling and storage: impact on NMRmetabolomics. Analyst. 2014;139(5):1168–77.
28. Gonzalez-Covarrubias V, Dane A, Hankemeier T, Vreeken R. The influence ofcitrate, EDTA, and heparin anticoagulants to human plasma LC–MSlipidomic profiling. Metabolomics. 2013;9(2):337–48.
29. Gillner DM, Becker DP, Holz RC. Lysine biosynthesis in bacteria: ametallodesuccinylase as a potential antimicrobial target. J Biol Inorg Chem.2013;18(2):155–63.
30. Cook GC. Effect of systemic bacterial infection on absorption rates of L-histidine and glycylglycine from the human jejunum in vivo. Am J Clin Nutr.1977;30(12):1994–8.
31. Wong SM, Bernui M, Shen H, Akerley BJ. Genome-wide fitness profilingreveals adaptations required by Haemophilus in coinfection with influenza Avirus in the murine lung. Proc Natl Acad Sci U S A. 2013;110(38):15413–8.
32. Laiakis EC, Morris GAJ, Fornace AJ, Howie SRC. Metabolomic analysis insevere childhood pneumonia in The Gambia, West Africa: findings from apilot study. PLoS One. 2010;5(9):e12655.
33. Wilharm G, Heider C. Interrelationship between type three secretion systemand metabolism in pathogenic bacteria. Front Cell Infect Microbiol. 2014;4:150.
34. Porollo A, Sesterhenn TM, Collins MS, Welge JA, Cushion MT. Comparativegenomics of Pneumocystis species suggests the absence of genes for myo-inositol synthesis and reliance on inositol transport and metabolism. MBio.2014;5(6):e01834.
35. Rose F, Dahlem G, Guthmann B, Grimminger F, Maus U, Hanze J, et al.Mediator generation and signaling events in alveolar epithelial cellsattacked by S. aureus α-toxin. Am J Physiol Lung Cell Mol Physiol.2002;282(2):L207–14.
36. Munikumar M, Priyadarshini IV, Pradhan D, Sandeep S, Umamaheswari A,Vengamma B. In silico identification of common putative drug targets amongthe pathogens of bacterial meningitis. Biochem Anal Biochem. 2012;1(8):123.
37. Huxtable RJ. Taurine in the central nervous system and the mammalianactions of taurine. Prog Neurobiol. 1989;32(6):471–533.
38. Wu JY, Chen W, Tang X, Jin H, Foos T, Schloss J, et al. Mode of action oftaurine and regulation dynamics of its synthesis in the CNS. Adv Exp MedBiol. 2002;483:35–44.
39. Rosenthal MD, Glew RH. Medical biochemistry: human metabolism in healthand disease. Hoboken: John Wiley & Sons; 2009.
40. Tumpey TM, Belser JA. Resurrected pandemic influenza viruses. Annu RevMicrobiol. 2009;63:79–98.
41. Michal G, Schomburg D, editors. Biochemical pathways: an atlas ofbiochemistry and molecular biology. 2nd ed. Hoboken: Wiley; 2013.
42. Chong CP, Street PR. Pneumonia in the elderly: a review of severityassessment, prognosis, mortality, prevention, and treatment. South Med J.2008;101(11):1134–40.
43. Torres A, Ramirez P, Montull B, Menendez R. Biomarkers and community-acquired pneumonia: tailoring management with biological data. SeminRespir Crit Care Med. 2012;33(3):266–71.
44. Slupsky CM, Cheypesh A, Chao DV, Fu H, Rankin KN, Marrie TJ, et al.Streptococcus pneumoniae and Staphylococcus aureus pneumonia inducedistinct metabolic responses. J Proteome Res. 2009;8(6):3029–36.
45. Goldhill DR, Withington PS. Mortality predicted by APACHE II: the effect ofchanges in physiological values and post-ICU hospital mortality.Anaesthesia. 1996;51(8):719–23.
46. Banoei MM, Donnelly SJ, Mickiewicz B, Weljie A, Vogel HJ, Winston BW.Metabolomics in critical care medicine: a new approach to biomarkerdiscovery. Clin Invest Med. 2014;37(6):E363–76.
• We accept pre-submission inquiries
• Our selector tool helps you to find the most relevant journal
• We provide round the clock customer support
• Convenient online submission
• Thorough peer review
• Inclusion in PubMed and all major indexing services
• Maximum visibility for your research
Submit your manuscript atwww.biomedcentral.com/submit
Submit your next manuscript to BioMed Central and we will help you at every step:
Banoei et al. Critical Care (2017) 21:97 Page 15 of 15


![Metabolomics Basics[1]](https://static.fdocuments.in/doc/165x107/553de2815503466f378b4864/metabolomics-basics1.jpg)