PlantTriage Project Execution at Ammonia Plantind-pro-opt.com/Published_Articles/PlantTriage Project...
20
PlantTriage Project Execution at Ammonia Plant Page 1 of 20 Contents Background ................................................................................................................................................... 2 Project Initiation ........................................................................................................................................... 2 Project Methodology .................................................................................................................................... 3 Project Results .............................................................................................................................................. 4 Project Results Documentation .................................................................................................................... 5 1. Process Response Testing and Controller Tuning ............................................................................. 5 Example1 Primary Reformer Process Gas Flow Controller: .................................................................. 5 Example2 High Pressure Purge Gas to 104E-04_NH3Recovery Flow Controller: ................................. 8 2. Before and After Tuning and Control Valve Repair & Upgrade Results – Process Variable Trend Displays ................................................................................................................................................... 11 Example1 Primary Reformer Process Gas Flow Controller: ................................................................ 11 Example2 High Pressure Purge Gas to 104E-04_NH3Recovery Flow Controller: ............................... 12 3. Standard and Custom Reports and Displays ................................................................................... 16 Example1 Primary Reformer Process Gas Flow Controller – Custom Dashboard Display:................. 16 Example2 Primary Reformer Process Gas Flow Controller – Before & After Tuning and Control Valve Upgrade Assessment Report:.............................................................................................................. 18 Overall Project Results & Conclusions ........................................................................................................ 20 Business Benefits .................................................................................................................................... 20 Technical Benefits ................................................................................................................................... 20 “Soft” Benefits ........................................................................................................................................ 20 Author ......................................................................................................................................................... 20
-
Upload
nguyenkhanh -
Category
Documents
-
view
222 -
download
0
Transcript of PlantTriage Project Execution at Ammonia Plantind-pro-opt.com/Published_Articles/PlantTriage Project...

PlantTriage Project Execution at Ammonia Plant
Page 1 of 20
Contents Background ................................................................................................................................................... 2
Project Initiation ........................................................................................................................................... 2
Project Methodology .................................................................................................................................... 3
Project Results .............................................................................................................................................. 4
Project Results Documentation .................................................................................................................... 5
1. Process Response Testing and Controller Tuning ............................................................................. 5
Example1 Primary Reformer Process Gas Flow Controller: .................................................................. 5
Example2 High Pressure Purge Gas to 104E-04_NH3Recovery Flow Controller: ................................. 8
2. Before and After Tuning and Control Valve Repair & Upgrade Results – Process Variable Trend Displays ................................................................................................................................................... 11
Example1 Primary Reformer Process Gas Flow Controller: ................................................................ 11
Example2 High Pressure Purge Gas to 104E-04_NH3Recovery Flow Controller: ............................... 12
3. Standard and Custom Reports and Displays ................................................................................... 16
Example1 Primary Reformer Process Gas Flow Controller – Custom Dashboard Display: ................. 16
Example2 Primary Reformer Process Gas Flow Controller – Before & After Tuning and Control Valve Upgrade Assessment Report:.............................................................................................................. 18
Overall Project Results & Conclusions ........................................................................................................ 20
Business Benefits .................................................................................................................................... 20
Technical Benefits ................................................................................................................................... 20
“Soft” Benefits ........................................................................................................................................ 20
Author ......................................................................................................................................................... 20

PlantTriage Project Execution at Ammonia Plant
Page 2 of 20
Background
PlantTriage™ was used to improve the performance of an ammonia plant in a world class ammonia and urea production facility located in the West Indies area of the Caribbean. A
PlantTriage™ system was initially installed in the largest ammonia plant in this facility in November, 2009; then a 2nd PlantTriage™ system was installed the next largest ammonia plant in this facility in June 2010; and a 3rd PlantTriage™ system will be installed in the urea plant in spring 2011. The largest ammonia plant in this facility has a nominal capacity of more than 2000 TPD; and it is controlled using an Invensys Foxboro I/A Series DCS.
Project Initiation
A project was initiated in 1st quarter 2010 to exploit the newly-installed PlantTriage™ system to attempt to optimize controller performance in the largest ammonia plant in this facility. Utilizing standard PlantTriage™ displays and reports, the first major finding was that approximately 40% of the loops configured in this PlantTriage™ installation had been routinely running in a non-Normal (primarily Manual) mode. Another major finding was that there were some key control valves that had stiction and other hardware problems and design limitations (e.g., oversized and undersized trim) that were causing control loop performance problems. To further attempt to identify and find the source of these and other instrumentation problems and also to document the plant’s “baseline” performance at that time, an initial set of standard and custom-built PlantTriage™ displays and reports were created and shared with the appropriate plant operational, technical, and supervisory staff. After a series of discussion meetings with the plant staff it was decided to launch a concerted effort to attempt to get as many loops that were routinely running in a non-normal mode into their normal mode; and to tune high priority controllers as best possible. To undertake this project, a team was formed comprised of selected individuals from the plant operations, technical, and supervisory staff; ExperTune Inc. management and technical support staff; and a process control engineering consultant from Industrial Process Optimization.

PlantTriage Project Execution at Ammonia Plant
Page 3 of 20
This project was initiated by working with the plant technical and operations staff to identify and prioritize the list of controllers that would be evaluated performance-wise and tuned if practicable (i.e., if there were no overriding instrumentation or control strategy design problems). A list comprised of approximately half of the in-service controllers in the plant was developed by the plant operations and technical staff that included prioritization and comments on operational status and known problems. Beginning in the front-end of the process (Process Gas Treatment and Primary Reformer units), the performance of one controller at a time was evaluated and the controller was tuned if possible using the Advanced version of the ExperTune Tuner that is part of the PlantTriage™ system. Note that this work was conducted while the ammonia plant was running at a near-capacity production rate; and that the performance of a total of more than 70 control loops was evaluated and these loops were tuned if practicable. Using proprietary process response testing techniques developed by Industrial Process Optimization, this work was performed without causing a major operational disturbance to the plant; and without curtailing the production rate on a longer term basis. This work was conducted on an interim (“campaign”) basis during the period of Jan. 2010 through early July 2010; and then the plant was shut down for scheduled maintenance and process equipment and instrumentation upgrades in August, 2010. During this shutdown the plant staff repaired selected key (from a process performance standpoint) control valves resulting from an analysis of controller performance data. Also three key control valves in the Primary Reforming unit (steam, process gas flow and pressure) were upgraded with Digital Valve Controllers (DVC’s). All of this work was conducted based on recommendations provided by the project team. The plant was restarted in late August, 2010 and has been running continuously since September, 2010 at near-record production rates.
Project Methodology
The methodology of how this project was conducted including evaluating controller performance and tuning controllers is summarized as follows:
1. Obtained from the plant technical staff key process and control documentation, including the relevant Process Flow Diagrams (PFD’s), Piping and Instrumentation Drawings (P&ID’s), Process Description, and screen copies of the most important DCS Process Graphic Displays.
2. Created and interpreted standard and custom reports and displays built in the PlantTriage™ system to identify controller performance problems and instrumentation problems; and to find the source of control loop oscillations. Examples (refer to Project Results Documentation for selected examples): Interaction Analysis Displays, Valves with Stiction, Valves Oversized, Valves Undersized, Valves with Minimal Movement, Sensor Evaluation, Controllers with Low Service Factor, Control Loop Diagnosis Report, Process Variable Trend Displays, Loop Health Key Performance Indicators, Controller Health Issues, Cascade Loops Performance, Loops Not in Normal Mode Loop Health, Loops Oscillating, and Loop Tuning and Performance Custom Dashboard Display.
3. Summarized the results of interpreting the above displays and reports in a preliminary analysis and recommendations report that was distributed to the team members.
PlantTriage Project Execution at Ammonia Plant
Page 4 of 20
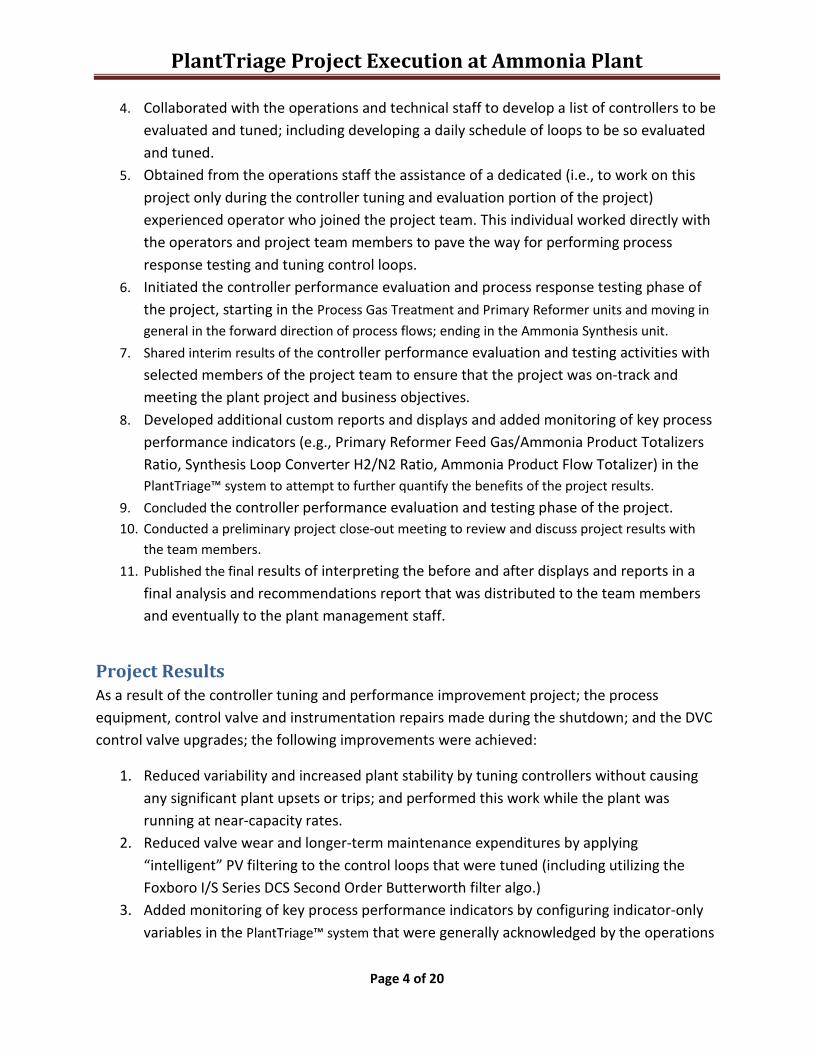
4. Collaborated with the operations and technical staff to develop a list of controllers to be evaluated and tuned; including developing a daily schedule of loops to be so evaluated and tuned.
5. Obtained from the operations staff the assistance of a dedicated (i.e., to work on this project only during the controller tuning and evaluation portion of the project) experienced operator who joined the project team. This individual worked directly with the operators and project team members to pave the way for performing process response testing and tuning control loops.
6. Initiated the controller performance evaluation and process response testing phase of the project, starting in the Process Gas Treatment and Primary Reformer units and moving in
general in the forward direction of process flows; ending in the Ammonia Synthesis unit.
7. Shared interim results of the controller performance evaluation and testing activities with selected members of the project team to ensure that the project was on-track and meeting the plant project and business objectives.
8. Developed additional custom reports and displays and added monitoring of key process performance indicators (e.g., Primary Reformer Feed Gas/Ammonia Product Totalizers Ratio, Synthesis Loop Converter H2/N2 Ratio, Ammonia Product Flow Totalizer) in the PlantTriage™ system to attempt to further quantify the benefits of the project results.
9. Concluded the controller performance evaluation and testing phase of the project. 10. Conducted a preliminary project close-out meeting to review and discuss project results with
the team members.
11. Published the final results of interpreting the before and after displays and reports in a final analysis and recommendations report that was distributed to the team members and eventually to the plant management staff.
Project Results
As a result of the controller tuning and performance improvement project; the process equipment, control valve and instrumentation repairs made during the shutdown; and the DVC control valve upgrades; the following improvements were achieved:
1. Reduced variability and increased plant stability by tuning controllers without causing any significant plant upsets or trips; and performed this work while the plant was running at near-capacity rates.
2. Reduced valve wear and longer-term maintenance expenditures by applying “intelligent” PV filtering to the control loops that were tuned (including utilizing the Foxboro I/S Series DCS Second Order Butterworth filter algo.)
3. Added monitoring of key process performance indicators by configuring indicator-only variables in the PlantTriage™ system that were generally acknowledged by the operations

PlantTriage Project Execution at Ammonia Plant
Page 5 of 20
staff to be important. Example: the efficiency of converting process feed gas to ammonia product.
4. Successfully put a controller in service that affects ammonia product conversion efficiency that had previously been running only in a non-normal mode (primarily Manual).
5. Identified control valves with hardware problems that had a significant impact on process performance by creating and interpreting custom reports and displays built in the PlantTriage™ system; and also by using the PlantTriage™ system’s Interaction Analysis Tools to eliminate “false positives.”
6. Initiated a paradigm shift in the Operators’ prior approach to running the plant as a result of being able to run more controllers in their Normal mode (i.e., either Auto or Cascade). This gave the operations staff more time to focus on optimizing the plant performance.
7. Made recommendations on how to best achieve plant process optimization objectives longer term by implementing supervisory controllers as part of a future plant optimization project. Example: key ratio controllers such as Air to Gas.
At the conclusion of this very successful project the plant operations, supervisory and technical staff was sufficiently convinced by the positive results to authorize approval of another project to install a 2nd PlantTriage™ system in the 2nd highest capacity ammonia plant in the facility.
Project Results Documentation
1. Process Response Testing and Controller Tuning
Example1 Primary Reformer Process Gas Flow Controller: General Note for this section: for tuning the Foxboro I/A Series DCS, the “P” tuning constant is Proportional Band, i.e. 100/Controller Gain. The “I” constant is Minutes/Repeat; the “D” constant is Minutes; and the “F” filter constant is Minutes.
The following screen capture of ExperTune Multi-Loop Archive Tuner shows the results of conducting open loop process response testing (doublet pulse test type) for control loop FIC1001, the Primary Reformer Process Gas Flow controller. This is a critical front-end feed controller that was tuned while the plant was running at near-capacity rates. Note that the Quality of Fit in the ExperTune Loop Summary Table is Excellent, the highest quality level. One of the key challenges in performing online plant process response testing was to properly design the test with pulse magnitude(s) and pulse width(s) [since the doublet pulse can be asymmetrical] such that the Quality of Fit was acceptable; the results were representative of what the controller would actually be encountering in routine operation; and without causing a disturbance that would cause the control loop to operate in an adverse range or result in unduly upsetting the plant operation. In general open loop process response testing (doublet pulse test type) was conducted for most loops in the

PlantTriage Project Execution at Ammonia Plant
Page 6 of 20
plant, except for some critical loops where the controller could not be put into Manual mode; in which case closed loop process response testing (either step, doublet pulse or a combination of the two types) was conducted. As can be noted in the “Current” vs. “New” tuning constant recommendations (refer to the top left of the below screen capture), a “Probable Performance Increase” of -24% would seem to indicate a performance decrease. However it is necessary to keep in mind the process control objective that was determined for each loop prior to tuning; and in some cases the process control objective was to reduce valve wear, and not necessarily to obtain tighter tuning or reduce control error. The importance of obtaining agreement on and documenting the process control objective(s) on a per control loop basis with the operations and technical staff prior to performing any process response testing or tuning cannot be over-emphasized.

PlantTriage Project Execution at Ammonia Plant
Page 7 of 20
The next screen capture of ExperTune Multi-Loop Archive Tuner shows the results of testing a Second Order Butterworth filter value on the process variable (PV) response (the green trend line is the PV before filtering; the red trend line is the PV after filtering). One of the key achievements of this project was reducing control valve wear (and hence reducing longer term maintenance cost) by applying “intelligent” PV filtering to each control loop tuned. This was accomplished by using the ExperTune Advanced Tuner PV filter recommendation and then testing it on the unfiltered PV and making “fine-tuning” adjustments as necessary, as shown in the below screen capture. A project design decision was made in the initial phase to take full advantage of the Foxboro I/A Series Second Order Butterworth filter algo. (a standard feature of this DCS) and utilize it whenever applicable. In

PlantTriage Project Execution at Ammonia Plant
Page 8 of 20
general Second Order Butterworth filtering has been demonstrated to be superior to simple First Order filtering (that may be the only filtering algo. available in other DCS’s) in that it minimizes PV lag.
Example2 High Pressure Purge Gas to 104E-04_NH3Recovery Flow Controller: The following screen capture of ExperTune Multi-Loop Archive Tuner shows the results of conducting open loop process response testing for control loop FIC1013, the High Pressure Purge Gas to 104E-04_NH3Recovery Flow controller. Note in particular the ExperTune Loop Summary

PlantTriage Project Execution at Ammonia Plant
Page 9 of 20
Table (refer to the bottom of the below screen capture). Note that a step test was conducted for process response testing. Even though the Quality of Fit for this part of the test (Archive 003—1st below screen capture) was Questionable and for the next similar test (Archive004—next below screen capture) the Quality of Fit for that part of the test was Very Questionable; the Average (i.e., from these two tests) tuning results were adequate to be used for closed loop control.

PlantTriage Project Execution at Ammonia Plant
Page 10 of 20
The following screen capture shows the entire series of process response tests that were conducted for this loop that reveal control valve stiction, i.e. when the Controller Output (CO) was increased during the test (refer to the middle part of the below process variable trend display), the Process Variable (PV) failed to respond accordingly. It was recommended that this control valve be overhauled and repaired during the next full plant shutdown.

PlantTriage Project Execution at Ammonia Plant
Page 11 of 20
2. Before and After Tuning and Control Valve Repair & Upgrade Results – Process Variable Trend Displays
Example1 Primary Reformer Process Gas Flow Controller: General Note for this section: the representative “Before Tuning, Control Valve Repair & Upgrade” 31-day period selected was Jan. 21, 2010 0700 to Feb. 21, 2010 0700. The representative “After Tuning, Control Valve Repair & Upgrade” 31-day period selected was Nov. 01, 2010 0700 to Dec. 02, 2010 0600 [actually 0700, as the time displayed was adjusted by the PlantTriage™ Historian from 0700 to 0600 because of the spring daylight savings time change (DST)].
The next screen capture shows typical performance of control loop FIC1001, the Primary Reformer Process Gas Flow controller before tuning and control valve upgrade to add a Digital Valve Controller (DVC). Note the process variable (PV) “paintbrushing” with subsequent PV noise being transferred to the control valve.

PlantTriage Project Execution at Ammonia Plant
Page 12 of 20
FIC1001 Before Tuning & DVC Upgrade
The next screen capture shows typical performance of control loop FIC1001, the Primary Reformer Process Gas Flow controller after tuning and control valve upgrade to add a DVC. Note the reduction in control error, PV oscillation, and control valve noise. This is a key control loop in the front-end of the process that has a significant impact on process performance for the entire plant.
FIC1001 After Tuning & DVC Upgrade
Example2 High Pressure Purge Gas to 104E-04_NH3Recovery Flow Controller: The next screen capture shows typical performance of control loop FIC1013, the High Pressure
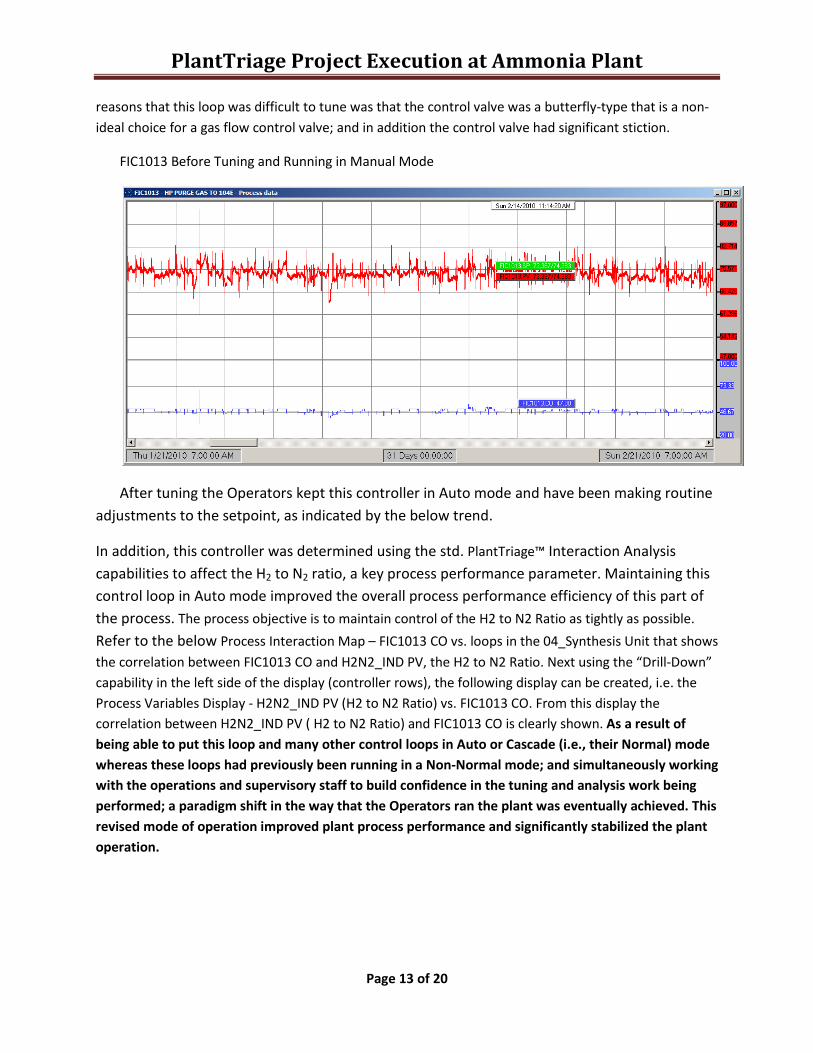
Purge Gas to 104E-04_NH3Recovery Flow controller before tuning. Note that this loop was maintained in Manual mode by the Operators because prior attempts to tune it had been unsuccessful. One of the
PlantTriage Project Execution at Ammonia Plant
Page 13 of 20
reasons that this loop was difficult to tune was that the control valve was a butterfly-type that is a non-ideal choice for a gas flow control valve; and in addition the control valve had significant stiction.
FIC1013 Before Tuning and Running in Manual Mode
After tuning the Operators kept this controller in Auto mode and have been making routine adjustments to the setpoint, as indicated by the below trend.
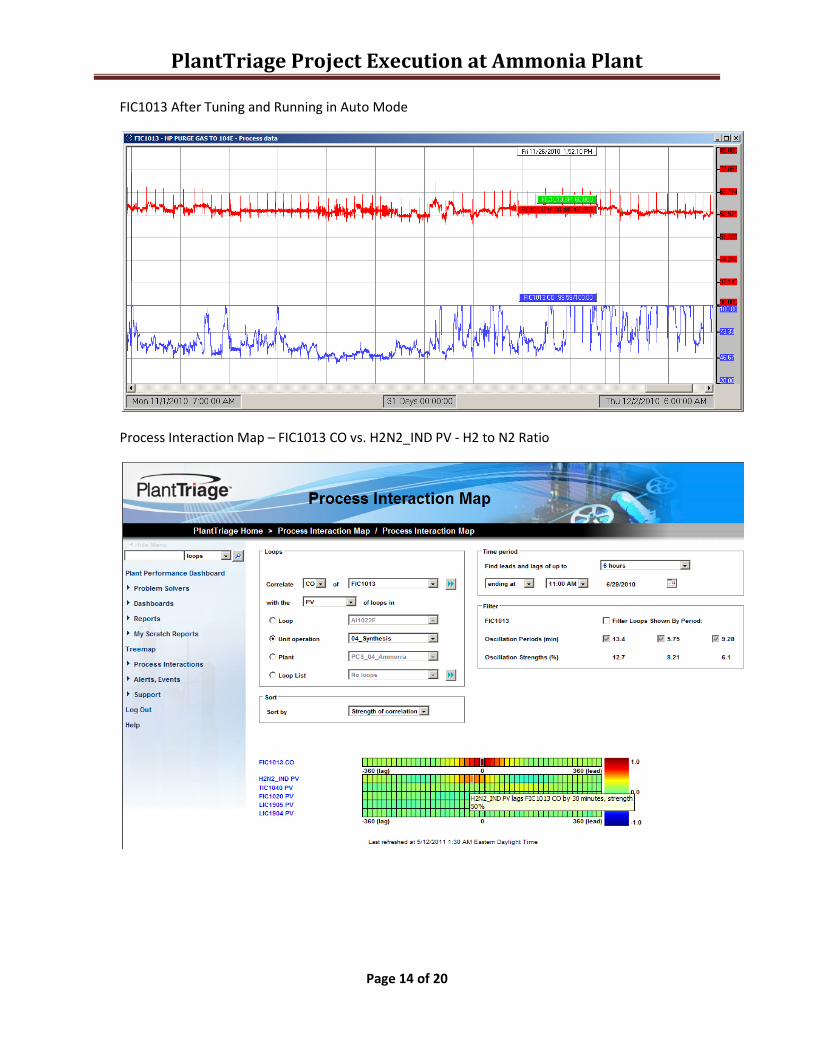
In addition, this controller was determined using the std. PlantTriage™ Interaction Analysis capabilities to affect the H2 to N2 ratio, a key process performance parameter. Maintaining this control loop in Auto mode improved the overall process performance efficiency of this part of the process. The process objective is to maintain control of the H2 to N2 Ratio as tightly as possible.
Refer to the below Process Interaction Map – FIC1013 CO vs. loops in the 04_Synthesis Unit that shows the correlation between FIC1013 CO and H2N2_IND PV, the H2 to N2 Ratio. Next using the “Drill-Down” capability in the left side of the display (controller rows), the following display can be created, i.e. the Process Variables Display - H2N2_IND PV (H2 to N2 Ratio) vs. FIC1013 CO. From this display the correlation between H2N2_IND PV ( H2 to N2 Ratio) and FIC1013 CO is clearly shown. As a result of being able to put this loop and many other control loops in Auto or Cascade (i.e., their Normal) mode whereas these loops had previously been running in a Non-Normal mode; and simultaneously working with the operations and supervisory staff to build confidence in the tuning and analysis work being performed; a paradigm shift in the way that the Operators ran the plant was eventually achieved. This revised mode of operation improved plant process performance and significantly stabilized the plant operation.
PlantTriage Project Execution at Ammonia Plant
Page 14 of 20
FIC1013 After Tuning and Running in Auto Mode
Process Interaction Map – FIC1013 CO vs. H2N2_IND PV - H2 to N2 Ratio

PlantTriage Project Execution at Ammonia Plant
Page 15 of 20
Process Variables Display (Initiated from above Process Interaction Map) H2N2_IND PV (H2 to N2 Ratio) vs. FIC1013 CO
PlantTriage Project Execution at Ammonia Plant
Page 16 of 20
3. Standard and Custom Reports and Displays
Example1 Primary Reformer Process Gas Flow Controller – Custom Dashboard Display: The following screen capture is a PlantTriage™ customized Dashboard Display that includes a Process Variable Trend display and selected PlantTriage™ Assessments of interest that provide background information for a detailed control loop performance assessment. This display is intended to be used by Process Control and Electrical/Instrumentation Engineers to track results after performing control loop tuning. Note that Active Model Capture Technology (AMCT), a unique feature of the PlantTriage™ system, captured one model for this loop with a Quality of Fit =4 (in this case the lowest quality, hence this model was not useable for tuning background analysis and comparison to current tuning constants). The Loop Diagnosis excerpt (refer to the bottom right of display) reported that the loop was oscillating due to load, and that was an accurate performance assessment at that time.

PlantTriage Project Execution at Ammonia Plant
Page 17 of 20

PlantTriage Project Execution at Ammonia Plant
Page 18 of 20
Example2 Primary Reformer Process Gas Flow Controller – Before & After Tuning and Control Valve Upgrade Assessment Report:
General Note for this section: the representative “Before Tuning, Control Valve Repair & Upgrade” 31-day period selected was Jan. 21, 2010 0700 to Feb. 21, 2010 0700. The representative “After Tuning, Control Valve Repair & Upgrade” 31-day period selected was Nov. 01, 2010 0700 to Dec. 02, 2010 0600 [actually 0700, time displayed was adjusted by the PlantTriage™ Historian from 0700 to 0600 because of the spring daylight savings time change (DST)].
The PlantTriage™ system includes many standard reports that can be used as-is to evaluate controller performance and to aid in finding the source of control loop oscillations; and sensor, controller, and control valve problems. These standard reports can be easily customized to add information of interest such as additional Assessments, loop configuration information such as tuning constants, etc. One particularly useful report is the Before-After Loop Health tabular report that is intended to quantify the results of controller performance improvement (that may be due to controller tuning, control valve repair and upgrades, etc.) for control loops of interest. The below data is excerpted from such a customized report that displays Before and After controller performance results for FIC1001, the Primary Reformer Process Gas Flow controller. Note: it is not possible to show all of the values that may be of interest and that were included in this report due to proprietary considerations and document formatting limitations. The following Before and After Assessment results report excerpt clearly shows that the combination of controller tuning, overhauling the control valve and adding a DVC significantly improved controller performance.
The controller performance improvement (or in some cases deterioration due to factors such as control valve hardware problems) was similarly documented using this customized report for the more than 70 control loops in this ammonia plant that were either tuned or evaluated to be tuned.

PlantTriage Project Execution at Ammonia Plant
Page 19 of 20
LoopAvg abs error (%)
Avg abs error (%)
Avg abs error (%) IAE IAE IAE Osc. Sig. Osc. Sig. Osc. Sig.
Variability (%)
Variability (%)
Variability (%)
Before After Change Before After Change Before After Change Before After ChangeFIC1001 0.3926 0.1646 -0.228 33920 14220 -19700 2.515 1.172 -1.343 1.079 0.4573 -0.6221
Loop Variance Variance VarianceValve travel
Valve travel
Valve travel
Valve reversals
Valve reversals
Valve reversals
Before After Change Before After Change Before After ChangeFIC1001 0.2483 0.04741 -0.2009 529.1 24.68 -504.5 2646 112.2 -2533

PlantTriage Project Execution at Ammonia Plant
Page 20 of 20
Overall Project Results & Conclusions
Business Benefits The largest ammonia plant operation was stabilized and the performance efficiency was improved in parts of the process.
Technical Benefits Standard and custom PlantTriage™ reports were created to monitor the ammonia plant and controller performance and aid in troubleshooting instrumentation problems.
“Soft” Benefits Longer term: control valve maintenance costs were reduced through less valve wear.
Author
Mr. David B. Leach, Owner, Industrial Process Optimization (http://www.ind-pro-opt.com/). Industrial Process Optimization is an engineering consulting company that specializes in process control and control systems engineering applications consulting.