Plantation Company” · The information that follows is a presentation of certain information...
31
Management Presentation 30 September 2018 World Class Plantation Company” “To Become A 1
Transcript of Plantation Company” · The information that follows is a presentation of certain information...

Management Presentation 30 September 2018
World Class Plantation Company”
“To Become A
1

Disclaimer NOT FOR PUBLICATION OR DISTRIBUTION, DIRECTLY OR INDIRECTLY, IN OR INTO THE UNITED STATES OR IN ANY OTHER JURISDICTION IN WHICH SUCH PUBLICATION OR DISTRIBUTION WOULD BE PROHIBITED BY APPLICABLE LAW. The information that follows is a presentation of certain information about PT Sawit Sumbermas Sarana Tbk. (“SSMS” ), its parent, PT Citra Borneo Indah (“CBI”, and together with SSMS, the “Parent Guarantors”), and their respective subsidiaries (together, the “Group”) prepared by the Parent Guarantors. The information contained herein (including, among others, the market data, industry data and other industry statistics included in this presentation derived from public or third party sources) has not been independently verified and thus no representation or warranty, express or implied, is made as to the fairness, accuracy, currency, completeness or correctness of the information, opinions and conclusions contained in this presentation by the Parent Guarantors, the Issuer or any of the Subsidiary Guarantors referred to herein (collectively, the “Company Parties”), BNPP Paribas, Citigroup Global Markets Singapore Pte. Ltd., CIMB Bank (L) Limited (collectively, the “Joint Lead Manager”) or any of their respective directors, officers, employees, advisors, affiliates or agents. Accordingly, no reliance should be placed on the fairness, accuracy, currency, completeness or correctness of this presentation, nor any inferences drawn from the manner in which the contents have been compiled and presented. In addition, no person has been authorized to give any information or to make any representation not contained in and not consistent with this material and, if given or made, such information or representation must not be relied upon as having been authorized by or on behalf of the Company Parties or the Joint Lead Managers. This presentation is based on the economic, regulatory, market and other conditions as in effect on the date hereof. It should be understood that subsequent developments may affect the information contained in this presentation, which none of the Company Parties or their advisors or representatives is under an obligation to update, revise or affirm. Past performance information in this document should not be relied upon as an indication (and is not an indicator) of future performance. The information communicated in this presentation contains certain statements that are or may be forward looking. These statements include all statements other than statements of historical facts and typically contain words such as “will”, “expects” and “anticipates” and words of similar import. By their nature forward-looking statements involve risks and uncertainties because they relate to events and depend on circumstances that may or may not occur in the future. Any investment in securities issued by the Issuer will also involve certain risks. There may be additional material risks that are currently not considered to be material or of which the Company Parties and their advisors or representatives are unaware. Against the background of these uncertainties, readers should not rely on these forward-looking statements. None of the Company Parties, the Joint Lead Managers or any of their respective directors, officers, employees, advisors, affiliates or agents assumes any responsibility to update forward-looking statements or to adapt them to future events or developments. This presentation should not be used as the basis for any financial decision to invest in any securities or participation in any transaction. This presentation does not purport to, and does not, contain all of the information that may be required to evaluate factors relevant to a recipient making any investment decisions. Each recipient should make its own independent appraisal of, and investigation into, the financial condition, creditworthiness, affairs, status and nature of the Group as the basis of any investment decision. Opinions expressed in this presentation are subject to change without notice. To the maximum extent permitted by law, none of the Company Parties, the Joint Lead Managers, nor their respective directors, officers, employees, advisors, affiliates or agents accepts any liability whatsoever, including, without limitation, for any loss howsoever arising from or in connection with any use to which this presentation may be put by a recipient or otherwise or as a result of, or arising from anything expressly or implicitly contained in or referred to in this presentation. This presentation has been prepared for information purposes only. Any recipient of this presentation and its directors, officers, employees, agents and affiliates must hold this presentation and any information provided in connection with this presentation in strict confidence and may not communicate, reproduce, distribute or disclose to any other person, or refer to them publicly, in whole or in part at any time. This presentation is not a prospectus or other offering document under any law and does not constitute an offer to sell or the solicitation of an offer to buy any securities in the United States or any other jurisdiction in which such offer, solicitation or sale would be unlawful prior to registration or qualification under the securities laws of any such jurisdiction. This presentation is being presented to you on the basis that you have confirmed you are not located or resident in the United States and, to the extent you purchase the securities described herein, you will be doing so pursuant to Regulation S under the U.S. Securities Act of 1933, as amended (the “Securities Act”). The securities of the Issuer have not been and will not be registered under the U.S. Securities Act of 1933, as amended, and may not be offered, sold or delivered within the United States absent registration under or an applicable exemption from the registration requirements of the United States securities laws. Any public offering of securities to be made in the United States will be made by means of a prospectus. Such prospectus will contain detailed information about the company making the offer and its management and financial statements. No public offering of securities is to be made by the Issuer in the United States. The Securities may not be offered or sold in the manner that constitutes a public offering in Indonesia under Law Number 8 of 1995 regarding Capital Markets. In particular, neither the information contained in this presentation nor any copy hereof may be, directly or indirectly, taken or transmitted into or distributed in the United States or any other jurisdiction which prohibits the same except in compliance with applicable securities laws. Any failure to comply with this restriction may constitute a violation of U.S. or other national securities laws. No money, securities or other consideration is being solicited, and, if sent in response to this presentation or the information contained herein, will not be accepted. By attending this presentation, you acknowledge that you will be solely responsible for your own assessment of the market position of the Group and that you will conduct your own analysis and be solely responsible for forming your own view of the potential future performance of the business of the Group. The information contained in this presentation is provided as of the date of this presentation and is subject to change without notice. By accepting delivery of this presentation, the recipient agrees to accept and be bound by the statements, restrictions and limitations set forth herein.
2

Highlights
Production: 2 new CPO mills under construction
EBITDA increased 3.3% Year-on-Year
Gross Margin increased 13.4% Year-on-Year
Strong production: Nucleus FFB rose 31.1% Year-on-Year
3
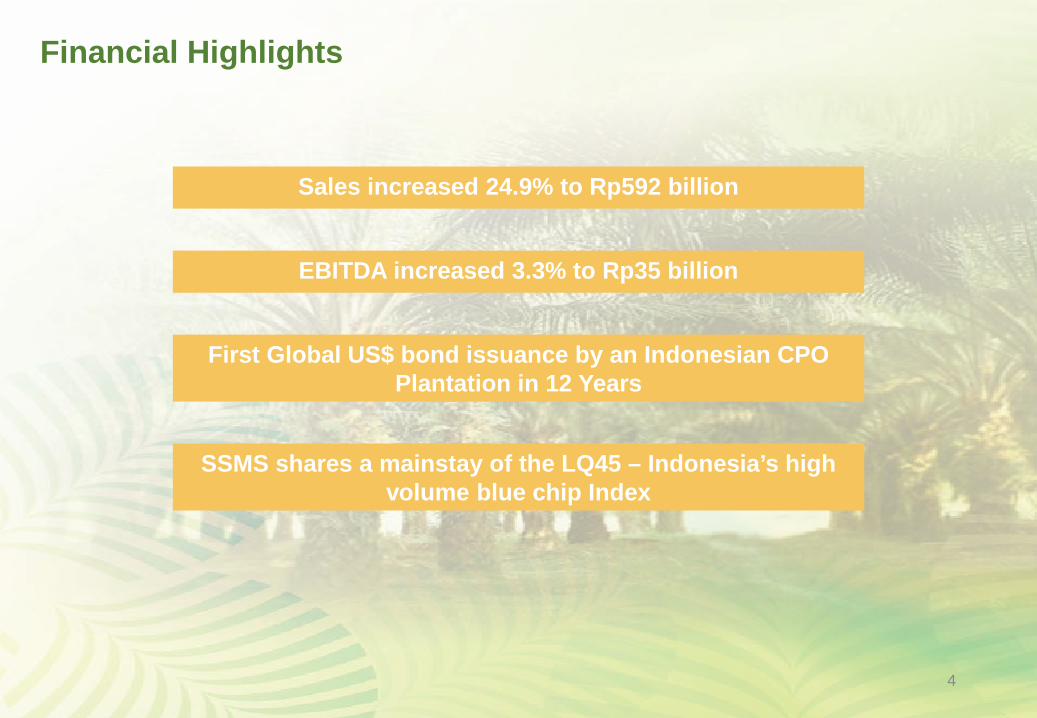
Financial Highlights
SSMS shares a mainstay of the LQ45 – Indonesia’s high volume blue chip Index
First Global US$ bond issuance by an Indonesian CPO Plantation in 12 Years
EBITDA increased 3.3% to Rp35 billion
Sales increased 24.9% to Rp592 billion
4

Key Credit Highlights 03
Introduction 01
Business Overview 02
Other Company Information 06
Operational Analysis 04
Financial Analysis 05
Contents

A High-Growth Indonesian Palm Oil Plantation Company
18.6 MT/ha FFB Yield per
Mature Hectare(4)
9.0 years Average Plant
Maturity(2)
5.1 MT/ha CPO Yield per
Mature Hectare(4)
22.7% Oil Extraction
Rate(3)
71,119 Ha Planted Area(2)
• Founded in 1995, SSMS is a fast growing Central Kalimantan-based palm oil plantation company with young maturity profiles (9 years) and strong yields
• SSMS has 95,770 Ha of prime land under management, with most areas having mineral soil characteristics, flat terrain, as well as land permits / land rights, and are strategically located to key infrastructure
• SSMS owns and operates 19 oil palm estates, covering 71,119 hectares of planted area, which includes six palm oil mills and one kernel crushing plant
• SSMS’s 13,773 Ha of unplanted area serves as base for organic growth
Citra Borneo Group (68.88%)
Public
PT. Mitra Mendawai Sejati
(MMS)
PT. Kalimantan Sawit Abadi
(KSA)
PT. Mirza Pratama Putra
(MPP)
PT. Menteng Kencana Mas
(MKM)
PT. Sawit Multi Utama (SMU)
PT. Tanjung Sawit Abadi
(TSA)
PT. Citra Borneo Utama (CBU)
PT. Surya Borneo Industri
(SBI)
19.0% 19.0% 99.0% 99.0%
99.0% 99.0% 99.0% 99.0%
PT. Citra Borneo Indah
(CBI)
53.75% PT. Putra
Borneo Agro Lestari
10.22% 36.03%
COMPANY OVERVIEW SHAREHOLDING STRUCTURE
Note: 1. Post the reorganization of CBI based on the shareholders register of the Company as of December 31, 2017. 2. As at 30 September 2018. 3. For the period of 9M2018. 4. For the period of 9M2018.
81.0% 81.0%
6

- 0 0 1 3 8
15 18 25
31 36
41 46
50 51 59
66 68 71 71
1995 2000 2001 2002 2003 2004 2005 2006 2007 2008 2009 2010 2011 2012 2013 2014 2015 2016 2017 9M18
Key Company Milestones
Total Planted Area (‘000 Hectares)
1995 PT Sawit Sumbermas Sarana was incorporated in Central Kalimantan
2000 First 103Ha palm oil plantation planted
2006 First production of CPO at Sulung Palm Oil Mill
2009 Planted area surpasses 30,000Ha; Natai Raya Palm Oil Mill commissioned
2010 Annual CPO production surpasses 100,000MT
2011 Third Palm Oil and Kernel Crusher Plant commissioned at Suayap
2012 Annual CPO production surpasses 200,000MT
2013 •Fourth Palm Oil Mill commissioned at Selangkun
•Listing on the Indonesia Stock Exchange with 1.5 billion new shares issued
2015 Total planted area of 66,201Ha post the acquisition of TSA, SMU, MKM and MPP
2014 Annual FFB processing surpasses 1,000,000MT
2016 Total planted area of 68,307Ha
9M18 •Total planted area of 71,119Ha with mill capacity of 375MT/hour
•Targeting to expand plantation by 4,000Ha in 2018
7

2. Business Overview
8

HGU 46,276
Location Permit 36,583
Others 12,911
Sizable Landbank with Potential Upside from Unplanted Area Land Rights Secured for Majority of Landbank
High Yielding Plantations…
(1)
…Despite Young Maturity Profile of Plantations
Business Overview
Immature (1-3 years)
Average Age: 1 year
Young Mature (4-7
years)
Average Age: 5 years
Prime (8-20 years)
Average Age: 12 years
Planted Area,
71,119
Essential Infrastructure
5,074
Conservation Area, 5,804
Other Unplanted
Area, 13,773
• Substantial room for organic growth via unplanted reserves
• Most of the landbank has already obtained location permits and land rights
• High and consistent CPO production and oil extraction rates (“OER”)
• Using high-yielding 2nd generation seeds from major providers including Lonsum, Socfin, Damimas and TopasAsianAgri
Data as at 30 September 2018. Note: 1. Includes Cadastral (have gone through cadastral process but have yet to obtain HGU) and relinquished land area (from previous owners which have not been submitted for cadastral process). 2. The Location Permits for 27,687 hectares have expired and are in the process of being extended.
(2)
23.5% 23.7% 23.4% 23.1% 22.7%
16.0%
18.0%
20.0%
22.0%
24.0%
0
100,000
200,000
300,000
400,000
2014 2015 2016 2017 9M18
CPO Production (MT) OER (%)
65%
10%
25%
9

Plantation Processing Plants High Quality Products
Supported with Group livestock synergy • Integration of cattle
supports plantation operations;
• Reduction of weeding, integrated with breeding and fattening;
• Combined organic fertilizer to improve productivity and cost efficiency.
To support customers for high quality Crude Palm Oil and Crude Palm Kernel Oil, which can be used as feedstock for diverse CPO refinery products: • Cooking Oil
• Specialty Fats
• Functional Products
• Biodiesel
• Palm Wax and Candles
• Oleochemicals
Total 71,119 Ha planted area across Central Kalimantan
• Generating a high Oil Extraction Rate at the CPO mill of 22.7% (CPO); 4.4% (Palm Kernel); and 37.8% (Crude PKO).
• Young and high-yielding plantations with average maturity profile of 9 years
• One of the world’s highest yielding CPO plantations
To support a range of both domestic and overseas customers • 58.0% of FY17 sales to
export; • Remaining 42.0% in
FY17 for domestic usage;
• Supported by a branch office in Jakarta; and
• Operated by 6,398permanent employees (as of 30 Sep., 2018)
Business Overview (Cont’d)
Processing Plant from FFB to CPO with a total current installed capacity of 375MT/hour
• Installed milling capacity utilization set to improve in line with planted area growth
10

Our Commitment to Sustainability
Target 100% RSPO Certification by 2020
2018 2019
100% RSPO Roadmap
SSMS and MMS mills, which produce c.56% of total CPO in 2016 are RSPO certified since 2013 ISPO certification for Kenambui, Sulung, Rangda, Kondang, Pulau, Selangkun, and Rungun Estates since 2013 Aiming for all estates and operations to be RSPO certified by 2020
SSMS has partnered with the Borneo Orangutan Survival Foundation (“BOSF”) to purchase and maintain Salat Island for the conservation of orangutans
SSMS has budgeted for the cost of the orangutan conservation programme
2020
Initiation of RSPO
Certification Process for our Smallholders & Supply Chains
MKM
MPP
TSA
SMU
KSA
Partnership with Borneo Orangutan Survival Foundation (BOSF)
11

• In cooperation with the Borneo Orangutan Survival Foundation (BOSF), BKSDA and Government of Central Kalimantan, PT Sawit Sumbermas Sarana Tbk. established a conservation area for orangutans on the island of Nusa Salat;
• Pulau Badak Besar dan Badak Kecil were selected due to their location around the island of Nusa Salat and suitability for orangutan conservation habitats; and
• We work closely with other stakeholders to encourage responsible ecotourism for orangutan conservation.
Protecting Orangutan Habitats
12

• Comply with certifications; • Study high conservation areas; • No development of peatlands; • Zero burning policy; • Community driven; • Partial self-generated electric power support; • Conservation areas cover 6.2% within the plantation area; • Free medical facilities; • Education/tuition fees; • Scholarships; • Partnership with BOSF; and • Contribution to the GDP of Central Kalimantan
Support the Nation with Environmentally Friendly Actions…
13

Cultural, Social and Community Program
Empowering Education Program
Health Empowerment
Accommodate residents with food and commodity stocks, and treatment plans
Environmental Conservation Program
Infrastructure Program
Program for Community Economic Empowerment
Affordable markets, basic food distribution, development of places of worship
Scholarships for children, free school admission, teacher training, Internships, Learning Media and Equipment
Increase awareness about the importance of healthcare and wellness
Free diagnosis, communal treatment, blood donor programs
Tree replanting and treatment
One million tree plan to be developed, plant maintenance
Dedicated to projects that bring the company and community together
Water supply developments, road and bridges, village electrification
Provide opportunities to increase community self-reliance
Assist in Working Capital loans, Integrated Farming & Fishery and Disability Assistance
Participate in knowledge-sharing about plantations, industry and entrepreneurship
Harmonious Relationships with All Stakeholders Corporate Governance “We do care”: Care for the Company, People, Environment and for the Country, Indonesia
14

3. Key Market & Operating Highlights
15
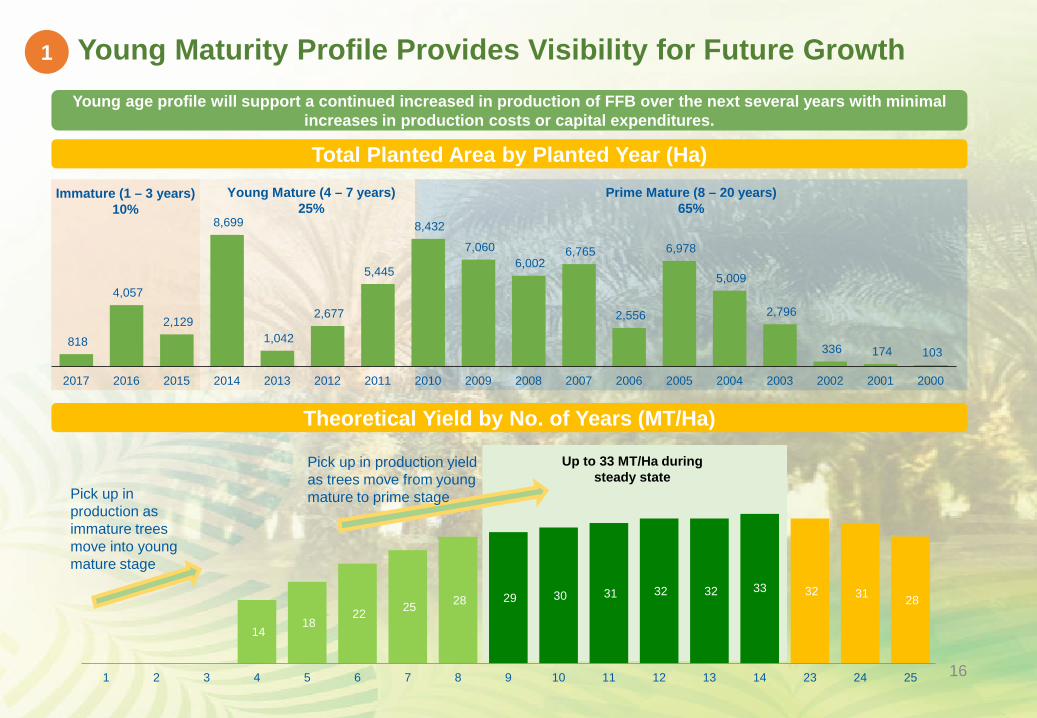
Up to 33 MT/Ha during steady state
Young Maturity Profile Provides Visibility for Future Growth
14 18
22 25 28 29 30 31 32 32 33 32 31 28
1 2 3 4 5 6 7 8 9 10 11 12 13 14 23 24 25 16
Prime Mature (8 – 20 years) 65%
Young Mature (4 – 7 years) 25%
Immature (1 – 3 years) 10%
Total Planted Area by Planted Year (Ha)
103 174 336
2,796
5,009
6,978
2,556
6,765 6,002
7,060
8,432
5,445
2,677
1,042
8,699
2,129
4,057
818
200020012002200320042005200620072008200920102011201220132014201520162017
Theoretical Yield by No. of Years (MT/Ha)
Pick up in production yield as trees move from young mature to prime stage Pick up in
production as immature trees move into young mature stage
Young age profile will support a continued increased in production of FFB over the next several years with minimal increases in production costs or capital expenditures.
1

SMU
MPP
Kabupaten Lamandau
Nanga Bulik
SSMS
Kabupaten Sukamara
Pangkalan Bun
TSA
MMS
KSA
Kabupaten Kotawaringin Barat
Iskandar Airport
Kumai Port Jetty, bulking & downstream facilities
CENTRAL KALIMANTAN
WEST KALIMANTAN
JAVA SEA
MKM
Transportation and infrastructure benefits
All assets are concentrated within a 60km radius;
Covered by a dense network of all-weather roads built to ensure that every part of the plantations is easily accessible at all times;
Proximity to Kumai Port and Iskandar Airport, and located along the Trans-Borneo highway;
Well established infrastructure.
Cost benefits from operational synergies
Optimised logistics for lower transportation and processing costs;
Higher quality FFB and CPO products due to efficient transportation (lower FFA%).
Central Kalimantan’s climate is ideal for CPO production
High rainfall levels of approx. 2,800–3,000mm per year, with at least 4.5–5.0 hours of sunshine daily;
High mineral content soil with negligible proportion of shallow peat soil;
Mean annual temperature of 31°C and high humidity;
Relatively flat and undulating terrain, reducing planting, maintenance and harvesting costs.
Plantation Entities KSA = PT. Kalimantan Sawit
Abadi MKM = PT. Menteng Kencana
Mas MMS = PT. Mitra Mendawai Sejati MPP = PT. Mirza Pratama Putra SMU = PT. Sawit Multi Utama SSMS = PT. Sawit Sumbermas
Sarana TSA = PT. Tanjung Sawit Abadi
Kalimantan
Favorable Location Enhances Efficiency and Cost Control 3
Plantation Estates
Jetty, bulking & downstream facilities
Iskandar Airport
Kumai Port Key city Trans-Borneo Highway CPO
mills Kernel mill
17

23.4% 23.9%
22.5% 22.5% 22.2%
21.0% 20.8%
SSMS DNS First LNS GAR Astra Agro Lestari SGRO
19.4 19.0 18.3 17.4 16.8 14.7
10.0
SSMS GAR Astra Agro Lestari DNS First LNS SGRO
4.5 4.3 4.2 3.9 3.8
3.4
2.1
SSMS DNS GAR Astra Agro Lestari First LNS SGRO
Average 16.5
Average 22.3%
Average 3.7
SSMS - Cash Cost Units 9M 2018 Fertilizer and maintenance Rp bn 284
Labor Rp bn 290
Harvesting Rp bn 73
Overhead Rp bn 147
Total field cost Rp bn 794
FFB production K tons 1,230
Field cost / FFB Rp /kg 645
OER % 22.8%
Field cost / CPO Rp /kg 2,835
Milling cost Rp bn 94
CPO production K tons 335
Milling cost / CPO Rp /kg 281
Total Cash Cost / CPO Rp /kg 3,116
FX Rate (30 Sep., 2018) Rp/USD 14,929
USD/MT 209 Source: The respective companies’ public filings for peer company data
Plant Productivity Cash Cost Breakdown for 9M18
FY16 Peers Comparison – FFB Yield (MT/Ha)
Higher FFB yield, OER and CPO yield compared to average among peers
FY16 Peers Comparison – OER (%)
FY16 Peers Comparison – CPO Yield (MT/Ha)
2 High Yielding, Efficient Plantations Support Low Opex
GAR Agribusiness & Food
London Sumatra
GAR Agribusiness & Food
Sampoerna Agro
Sampoerna Agro London Sumatra
GAR Agribusiness & Food
London Sumatra Sampoerna Agro
18

36.2 37.8
42.6 45.3 46.4
48.8 52.6
57.9 59.5 60.8 62.5
2006 2007 2008 2009 2010 2011 2012 2013 2014 2015 2016
4 Strong CPO Global Outlook and Fundamentals
Strong demand drivers for Global CPO consumption
Growing demand for food primarily in Asia especially China and India
Expansion of oleochemical requirements Increased awareness of health benefits of palm oil compared
to other seed oils Increased use in biodiesel
Significant room for further growth in key palm oil consuming countries
Palm oil is the cheapest and highest yielding edible oil
Soya
Palm
Rapeseed
56.0 54.1
19.2 21.9 20.3 11.8
67.1 64.4
43.1
24.3 26.5 17.5
US EU-28 Indonesia Pakistan China India
2006 2016
Considerable additional demand growth potential
Edible Oil Consumption: Kg per Capita
CPO (MT)
Source: Oilworld
Average: 55.1
Average: 65.8
Average: 27.9
Average: 18.3
Yield: MT/Ha
0
1
2
3
4
5
200 400 600 800 1,000Production Cost: US$/MT
19

While crude palm oil prices have been relatively stable over the last few years, CPO still trades at a discount to other edible oils.
Source: Bloomberg
Strong CPO Global Outlook and Fundamentals (Cont’d)
US$ / MT
4
SSMS’ average cash cost per ton of CPO produced for 9M 2018
US$209
0
200
400
600
800
1,000
1,200
1,400
Jan-13 May-13 Sep-13 Jan-14 May-14 Sep-14 Jan-15 May-15 Sep-15 Jan-16 May-16 Sep-16 Jan-17 May-17 Sep-17 Jan-18 May-18 Sep-18
Soy Oil Premium to CPO Soy Oil CPO
US$622
US$470
20

4. Operational Analysis
21

4 Indonesia Expected to Remain a Significant CPO Player
M tonnes of CPO
(Indonesian % share of total output)
Global Production of CPO, 2006 to 2016 (MT)
(Indonesian % share of total export)
Global Exports of CPO, 2006-2016 (MT)
Significant growth in Indonesia’s market share in world CPO production and exports
Indonesia is also one of the largest consumers of palm oil
Consumption CAGR (10 Year CAGR until 2016)
India 11.6%
Indonesia 9.5%
Europe (EU-28) 5.0%
China -0.6%
Source: Oilworld
M tonnes of CPO
M tonnes of CPO
43% 45% 44% 47% 48% 48% 50% 51% 52% 53% 54%
0%
10%
20%
30%
40%
50%
60%
0
10
20
30
40
50
60
70
2006 2007 2008 2009 2010 2011 2012 2013 2014 2015 2016
Indonesia Malaysia Rest of world Indonesia % share
42% 43% 43%
47% 45% 44% 47% 49%
52% 55% 53%
0%
10%
20%
30%
40%
50%
60%
0.0
10.0
20.0
30.0
40.0
50.0
60.0
2006 2007 2008 2009 2010 2011 2012 2013 2014 2015 2016
Indonesia Malaysia Rest of world Indonesia % share
7.1 8.0
8.6
7.1
9.2
7.6 8.5
7.9
9.3 9.2
6.2 6.3 6.1 5.7 5.1
6.0 7.0 7.1 7.3 7.0
2012 2013 2014 2015 2016
Indonesia India China Europe (EU-28)22

96 88 95 114 73
49.7% 50.3% 46.9% 47.5% 36.7%
0
50
100
150
200
250
2014 2015 2016 2017 9M18
EBITDA EBITDA margin 23
194 176 202
239 199
2014 2015 2016 2017 9M18
Nursery
5 Strong Operating Profile Leading to Resilient Financials
Increased production as our plantations mature and enter into their prime production age;
Strategic location, logistical efficiencies and best practices in plantation management;
Application of best-in-class agronomy practices.
• Use of only high yield seeds;
• Culling of unhealthy seedlings.
• High quality fertilizer complemented with organic fertilizer from byproducts of mills;
• Natural methods for planting and pest control.
• Harvest at maximum oil content;
• Process within 12 hours of harvesting.
• Yield gap analysis to benchmark against industry.
Harvesting
Maintenance
Yield Analysis
296
321
290
343 335
2014 2015 2016 2017 9M18
Revenue
EBITDA and Margin
USD mm
USD mm / %
CPO Production MT '000

6,715 6,826 8,212 7,832
39.0% 40.2% 39.5% 37.8%
0.0%
5.0%
10.0%
15.0%
20.0%
25.0%
30.0%
35.0%
40.0%
0
1,000
2,000
3,000
4,000
5,000
6,000
7,000
8,000
9,000
10,000
2015 2016 2017 9M18
Production KOER
321,238 289,653
343,059 335,162
23.7% 23.4% 23.1% 22.7%
16.0%
17.0%
18.0%
19.0%
20.0%
21.0%
22.0%
23.0%
24.0%
25.0%
0
50,000
100,000
150,000
200,000
250,000
300,000
350,000
400,000
450,000
2015 2016 2017 9M18
Production OER
High Yielding Plantation Despite Challenging Market Conditions
FFB
1,094,463 1,074,050 1,231,485 1,230,049
20.1 19.4 19.2 18.6
(60.0)
(50.0)
(40.0)
(30.0)
(20.0)
(10.0)
-
10.0
20.0
30.0
0
200,000
400,000
600,000
800,000
1,000,000
1,200,000
1,400,000
1,600,000
2015 2016 2017 9M18
Production Yield (MT/Ha)
MT
Palm Kernel Crude Palm Kernel Oil
60,861 54,005
62,240 65,167
4.5% 4.4% 4.2% 4.4%
0.0%
0.5%
1.0%
1.5%
2.0%
2.5%
3.0%
3.5%
4.0%
4.5%
5.0%
0
10,000
20,000
30,000
40,000
50,000
60,000
70,000
80,000
90,000
2015 2016 2017 9M18
Production KER
MT MT
Crude Palm Oil MT
24

5. Financial Performance
25

Prudent Financial Policies
Prudent Financial Management Strong Risk Management
• Manage liquidity risk by maintaining cash and cash equivalents sufficient to meet our commitments for normal operations, regularly evaluating cash flow projections and actual cash flows
Significant Liquidity
Dividend Policy
• Annual dividends to be distributed in an amount up to 30% of net income for each year, normalized by excluding net foreign exchange gains/losses, deferred tax revenues or expenses, and deducting all specified reserves
Modest Balance Sheet
Leverage
• Maintain debt to equity leverage around 1.0x
• Maintain gross debt to EBITDA leverage of around 3.0x
Investment Policy
• Investments are decided after careful review and the assessment of a feasibility study
Diversified Funding
Channels
• Secure diversified funding sources from banks and both domestic and international capital markets
Hedging Policies
• Business profile provides a natural hedge against USD/IDR fluctuations
• Do not practice hedging of CPO price
26

Revenue EBITDA and Margin
EBIT and Margin Net Income and Net Income Margin
Strong Operating Financials and Margins
96 88 95 114
73
49.7% 50.3% 46.9% 47.5%
36.7%
0
50
100
150
200
250
2014 2015 2016 2017 9M18
EBITDA EBITDA margin
82 74 77 88 61
42.4% 41.9% 38.2% 36.6%
30.4%
2014 2015 2016 2017 9M18
EBIT EBIT margin
49 42 44 58 24.1
25.4% 24.0% 21.7% 26.5%
12.1%
0.0%
5.0%
10.0%
15.0%
20.0%
25.0%
30.0%
35.0%
40.0%
45.0%
0
50
100
150
200
250
2014 2015 2016 2017 9M18
Net income Net income margin
194 176
202 239
199
2014 2015 2016 2017 9M18
USD mm USD mm / %
USD mm / % USD mm / %
Data as at 30 September 2018. Exchange rate of USD:IDR of 14,929 used. 27
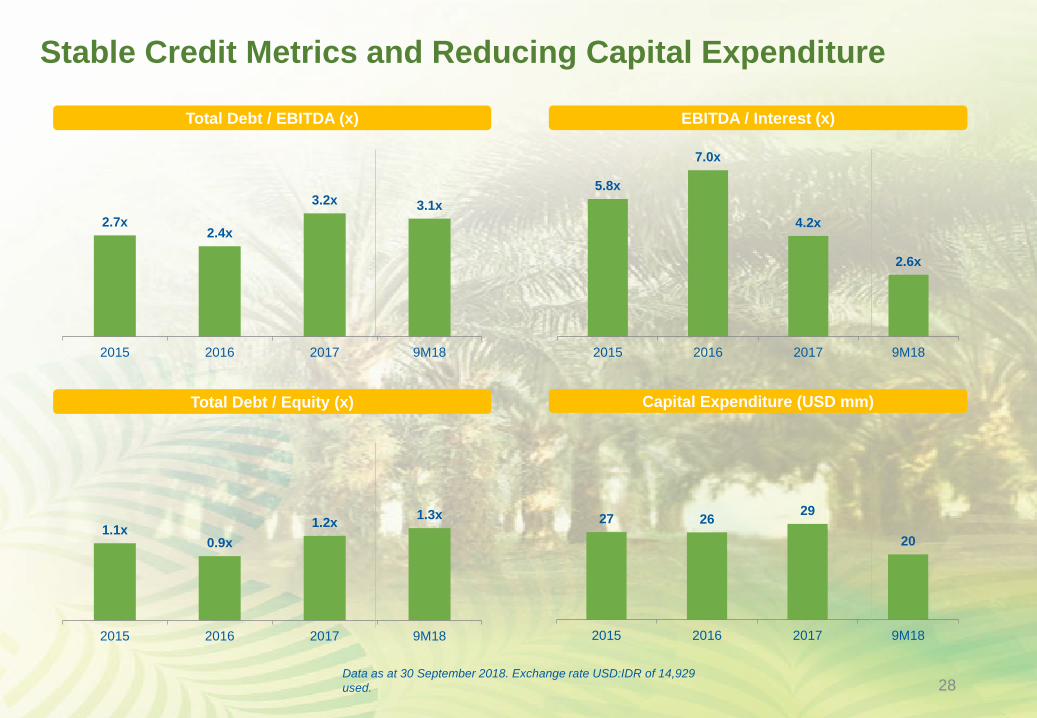
Total Debt / EBITDA (x) EBITDA / Interest (x)
Total Debt / Equity (x) Capital Expenditure (USD mm)
Stable Credit Metrics and Reducing Capital Expenditure
2.7x 2.4x
3.2x 3.1x
0.0x
0.5x
1.0x
1.5x
2.0x
2.5x
3.0x
3.5x
2015 2016 2017 9M18
5.8x
7.0x
4.2x
2.6x
0.0x
1.0x
2.0x
3.0x
4.0x
5.0x
6.0x
7.0x
8.0x
2015 2016 2017 9M18
1.1x 0.9x
1.2x 1.3x
0.0x
0.2x
0.4x
0.6x
0.8x
1.0x
1.2x
1.4x
2015 2016 2017 9M18
27 26 29
20
2015 2016 2017 9M18
Data as at 30 September 2018. Exchange rate USD:IDR of 14,929 used. 28

6. Land Rights Information
29

Land Rights Obtaining Sequence
This is a license granted by the government to enable a company acquiring or relinquish land with area and location that are specified in the related license.
The land acquisition must be completed within the validity period of the location permit. Location permit is valid for 3 years and can be extended for another year if the company already acquired at least 50% of the intended land.
Land acquisition can be done by way of (depending on the type of the land), among others: • plant growth compensation to the local
communities; • forest relinquishment or forest exchange to
the Ministry of Environment and Forestry; and • land purchase/ relinquish from the previous
owner.
Apply for land measurement (cadastral process) to the land office followed by the issuance of cadastral map.
Land Acquisition 2
Obtain Location Permit
1
Apply for Land Measurement 3
Issuance of the Cadastral Map
by the Land Office
4
Land Assessment and Recommendation
by Panitia B 7
Apply for HGU to the Land
Office 5
Issuance of the Ministerial Decree of
Approval of HGU
8
Registration for HGU Certificate to the Relevant
Land Office
9
46,276 ha (HGU)
Land Office to Form/Establish
Panitia B 6
36,583 ha (Location Permit) 3,919 ha (Relinquished Land) 8,992 ha (Cadastral)
30
Thank You
Visit our website at www.ssms.co.id Mailing Address: PT Sawit Sumbermas Sarana Tbk Head Office Representative Office Jl. H. Udan Said No.47 Equity Tower, Suite 43D Pangkalan Bun 74113 Jl. Jend Sudirman Kav.52-53 Kalimantan Tengah, Indonesia Jakarta 12190, Indonesia