Plant diversity and functional trait composition during...
19
Mires and Peat, Volume 21 (2018), Article 02, 1–19, http://www.mires-and-peat.net/, ISSN 1819-754X © 2018 International Mire Conservation Group and International Peatland Society, DOI: 10.19189/MaP.2017.OMB.280 1 Plant diversity and functional trait composition during mire development A.M. Laine 1,2,3 , T. Selänpää 1,3,4 , J. Oksanen 1 , M. Seväkivi 1,5 and E.-S. Tuittila 2 1 Department of Ecology and Genetics, University of Oulu, Finland 2 School of Forest Sciences, University of Eastern Finland, Joensuu, Finland 3 Department of Forest Sciences, University of Helsinki, Finland 4 Natural Resources Institute Finland, Seinäjoki, Finland 5 Current address: Centre for Economic Development, Transport and the Environment for North Ostrobothnia, Finland _______________________________________________________________________________________ SUMMARY During succession, plant species composition undergoes changes that may have implications for ecosystem functions. Here we aimed to study changes in plant species diversity, functional diversity and functional traits associated with mire development. We sampled vegetation from 22 mires on the eastern shore of the Gulf of Bothnia (west coast of Finland) that together represent seven different time steps along a mire chronosequence resulting from post-glacial rebound. This chronosequence spans a time period of almost 2500 years. Information about 15 traits of vascular plants and 17 traits of mosses was collected, mainly from two different databases. In addition to species richness and Shannon diversity index, we measured functional diversity and community weighted means of functional traits. We found that plant species diversity increased from the early succession stages towards the fen–bog transition. The latter stage also has the most diverse surface structure, consisting of pools and hummocks. Functional diversity increased linearly with species richness, suggesting a lack of functional redundancy during mire succession. On the other hand, Rao’s quadratic entropy, another index of functional diversity, remained rather constant throughout the succession. The changes in functional traits indicate a trade-off between acquisitive and conservative strategies. The functional redundancy, i.e. the lack of overlap between similarly functioning species, may indicate that the resistance to environmental disturbances such as drainage or climate change does not change during mire succession. However, the trait trade-off towards conservative strategy, together with the developing microtopography of hummocks and hollows with strongly differing vegetation composition, could increase resistance during mire succession. KEY WORDS: autogenic control, community weighted functional trait, functional diversity, primary succession, species diversity _______________________________________________________________________________________ INTRODUCTION Mires are peat accumulating ecosystems that store large quantities of carbon as peat, mostly since the last ice age. In the northern peatlands in Scandinavia, Russia, Siberia and Canada this peat accumulation still continues (e.g. Yu 2012). Generally, mires develop from ground or surface water influenced fens to more acidic bogs during several millennia following their initiation (Van Breemen 1995, Bauer et al. 2003, Hughes & Barber 2003). The speed of the succession appears to depend on climate and catchment hydrology: in northern boreal and arctic areas, cool climate and long periods of flooding after snowmelt have induced persistence of the fen stage, while most mires in the mid-boreal and southern boreal zones have reached the bog stage (Väliranta et al. 2017). However, a sudden lowering of the water table can induce ombrotrophy, i.e. a transition from fen to bog (e.g. Kuhry et al. 1993, Hughes & Barber 2003, Tahvanainen 2011). Climate change scenarios predict increased aeration of the soil and changes in N availability (Basiliko et al. 2006, Bragazza et al. 2006). Such changes could alter vegetation production and the rate of decomposition in mires (Bridgham & Richardson 2003, Breeuwer et al. 2008) and consequently may threaten the functioning of mires as active carbon sinks in the future (Gong et al. 2013, Wu & Roulet 2014). However, if climate change accelerates autogenic succession in such a way that northern fens are overgrown by bog vegetation (Tahvanainen 2011, Väliranta et al. 2017), their carbon sink function may even increase as bogs
Transcript of Plant diversity and functional trait composition during...
Mires and Peat, Volume 21 (2018), Article 02, 1–19, http://www.mires-and-peat.net/, ISSN 1819-754X
© 2018 International Mire Conservation Group and International Peatland Society, DOI: 10.19189/MaP.2017.OMB.280
1
Plant diversity and functional trait composition during mire development
A.M. Laine1,2,3, T. Selänpää1,3,4, J. Oksanen1, M. Seväkivi1,5 and E.-S. Tuittila2
1Department of Ecology and Genetics, University of Oulu, Finland 2School of Forest Sciences, University of Eastern Finland, Joensuu, Finland
3Department of Forest Sciences, University of Helsinki, Finland 4Natural Resources Institute Finland, Seinäjoki, Finland
5Current address: Centre for Economic Development, Transport and the Environment for North Ostrobothnia, Finland
_______________________________________________________________________________________
SUMMARY
During succession, plant species composition undergoes changes that may have implications for ecosystem
functions. Here we aimed to study changes in plant species diversity, functional diversity and functional traits
associated with mire development. We sampled vegetation from 22 mires on the eastern shore of the Gulf of
Bothnia (west coast of Finland) that together represent seven different time steps along a mire chronosequence
resulting from post-glacial rebound. This chronosequence spans a time period of almost 2500 years.
Information about 15 traits of vascular plants and 17 traits of mosses was collected, mainly from two different
databases. In addition to species richness and Shannon diversity index, we measured functional diversity and
community weighted means of functional traits. We found that plant species diversity increased from the early
succession stages towards the fen–bog transition. The latter stage also has the most diverse surface structure,
consisting of pools and hummocks. Functional diversity increased linearly with species richness, suggesting a
lack of functional redundancy during mire succession. On the other hand, Rao’s quadratic entropy, another
index of functional diversity, remained rather constant throughout the succession. The changes in functional
traits indicate a trade-off between acquisitive and conservative strategies. The functional redundancy, i.e. the
lack of overlap between similarly functioning species, may indicate that the resistance to environmental
disturbances such as drainage or climate change does not change during mire succession. However, the trait
trade-off towards conservative strategy, together with the developing microtopography of hummocks and
hollows with strongly differing vegetation composition, could increase resistance during mire succession.
KEY WORDS: autogenic control, community weighted functional trait, functional diversity, primary
succession, species diversity
_______________________________________________________________________________________
INTRODUCTION
Mires are peat accumulating ecosystems that store
large quantities of carbon as peat, mostly since the
last ice age. In the northern peatlands in Scandinavia,
Russia, Siberia and Canada this peat accumulation
still continues (e.g. Yu 2012). Generally, mires
develop from ground or surface water influenced fens
to more acidic bogs during several millennia
following their initiation (Van Breemen 1995, Bauer
et al. 2003, Hughes & Barber 2003). The speed of the
succession appears to depend on climate and
catchment hydrology: in northern boreal and arctic
areas, cool climate and long periods of flooding after
snowmelt have induced persistence of the fen stage,
while most mires in the mid-boreal and southern
boreal zones have reached the bog stage (Väliranta et
al. 2017). However, a sudden lowering of the water
table can induce ombrotrophy, i.e. a transition from
fen to bog (e.g. Kuhry et al. 1993, Hughes & Barber
2003, Tahvanainen 2011).
Climate change scenarios predict increased
aeration of the soil and changes in N availability
(Basiliko et al. 2006, Bragazza et al. 2006). Such
changes could alter vegetation production and the
rate of decomposition in mires (Bridgham &
Richardson 2003, Breeuwer et al. 2008) and
consequently may threaten the functioning of mires
as active carbon sinks in the future (Gong et al. 2013,
Wu & Roulet 2014). However, if climate change
accelerates autogenic succession in such a way that
northern fens are overgrown by bog vegetation
(Tahvanainen 2011, Väliranta et al. 2017), their
carbon sink function may even increase as bogs
A.M. Laine et al. PLANT DIVERSITY AND FUNCTIONAL TRAITS DURING MIRE DEVELOPMENT
Mires and Peat, Volume 21 (2018), Article 02, 1–19, http://www.mires-and-peat.net/, ISSN 1819-754X
© 2018 International Mire Conservation Group and International Peatland Society, DOI: 10.19189/MaP.2017.OMB.280
2
usually have a higher or, at least, more stable peat
accumulation capacity than fens (Turunen et al. 2002,
Drewer et al. 2010, Mathijssen et al. 2016).
During vegetation succession, a change in species
composition occurs as one plant community is
replaced by another (Miles 1987, Cortez et al. 2007),
and both species turnover (Wheeler 1980) and
environmental conditions change (Van Diggelen et
al. 1996). The community composition depends on
the stage of succession since individual species thrive
best under certain types of environmental conditions
(Van den Broek & Beltman 2006). During mire
succession tall herbs and sedges that prevail in the
early stages are gradually replaced by dwarf shrubs
and Sphagnum mosses (Klinger & Short 1996). The
shift to dominance by Sphagnum moss is a turning
point (Magyari et al. 2001) as their high water
absorbing capacity and resistance to decay further
enhance peat accumulation under water-saturated
conditions (Van Breemen 1995, Eurola 1999, Hájek
et al. 2011). Generally, compositional changes in the
vegetation are associated with changes in the
functional plant traits, i.e. properties that determine
how species respond to the abiotic and biotic
environment and in turn affect the environment (Diaz
& Cabido 2001, Lavorel & Garnier 2002). During
succession, the availability of resources such as light,
nutrients and water generally decrease. Concurrently,
trait trade-offs have been observed from the
‘acquisitive’ (productive) strategy implemented by
rapid resource acquisition towards species with slow
traits and conservative strategy, which enhances
survival status (Reich et al. 2003, Reich 2014).
Logically, these trait changes affect ecosystem
functioning (Weltzin et al. 2000).
Predictions of ecosystem responses to future
disturbances like climate change require a better
understanding of the processes that control
community assembly during succession (Prach &
Walker 2011). The reason for using functional traits
and functional diversity indices in addition to taxon-
based approaches is that ecosystem processes such as
productivity, carbon dynamics and resilience are
more directly affected by functional differences
among species than by their taxonomic richness or
composition (Hooper et al. 2002, Cadotte et al.
2011). While general successional changes in
vegetation composition such as the increasing
importance of Sphagnum mosses and woody species
are well studied, the associated changes in functional
traits in mires have not so far been addressed.
In this study we aimed to assess plant species and
functional diversity during mire succession for the
first time by taking advantage of ongoing post-glacial
rebound. The rebound results in newly exposed land
at the Finnish west coast, thus creating a primary
successional series of undisturbed mires under
similar climatic conditions (e.g. Tuittila et al. 2013).
We expect species and functional diversity to
increase during primary succession until the stress
caused by ombrotrophication begins to filter species.
We also expect changes in the functional traits of
plants that reflect changes in the environmental
conditions as a traits trade-off from acquisitive to
conservative strategies.
METHODS
Study sites and vegetation sampling
The study area is located on the eastern shore of the
Gulf of Bothnia, Baltic Sea (Siikajoki, Finland, 64°
45' N, 24° 43' E). In this area the post-glacial rebound
is still in progress with a land uplift rate of 8 mm per
year (Ekman 1996), and this provides a unique
setting where sites at higher altitudes are not just
older, but their ages can be estimated rather
accurately. The length of the growing season in the
area is approximately 150 days. The 30-year (1979–
2009) average precipitation and mean annual
temperature are 539 mm and 2.6 °C, respectively
(Revonlahti, Siikajoki, 64° 41' N, 25° 05' E, 48 m
a.s.l., Finnish Meteorological Institute).
The sites were located along a 10 km transect and
were selected to represent different successional
stages in primary paludification after exposure of the
land from beneath the sea. The sites began their
development towards mire vegetation after exposure,
as is seen in a palaeological investigation of their peat
profiles (Merilä et al. 2006, Tuittila et al. 2013). The
subsoil beneath the peat at all sites was sand. The
study included 22 mires, which we assigned to seven
different groups based on their estimated age: SJ 0
(less than 100 years), SJ 1 (~180 years), SJ 2 (~200
years), SJ 3 (~700 years), SJ 4 (~1000 years), SJ 5
(~2500 years) and SJ 6 (~3000 years). Each time step
had four replicates, except for SJ 0 and SJ 6 which
had only one site each. The replicate sites were as
similar as possible in age and development history.
The first three groups had no soil or a very shallow
organic soil layer and can be regarded as primary
mires, since they are not yet real mires (sensu Joosten
et al. 2017). Site SJ 0 was a seashore, exposed some
decades ago and characterised by the absence of an
organic soil layer. The vegetation at this site was
dominated by graminoids (e.g. Festuca rubra,
Calamagrostis stricta, Carex glareosa and Juncus
gerardii) and it had a very poorly developed
bryophyte layer. Group SJ 1 included wet meadows
with a patchy cover of mainly brown mosses such as
A.M. Laine et al. PLANT DIVERSITY AND FUNCTIONAL TRAITS DURING MIRE DEVELOPMENT
Mires and Peat, Volume 21 (2018), Article 02, 1–19, http://www.mires-and-peat.net/, ISSN 1819-754X
© 2018 International Mire Conservation Group and International Peatland Society, DOI: 10.19189/MaP.2017.OMB.280
3
Warnstorfia spp. In group SJ 2 the bryophyte layer
was better developed and Sphagnum mosses occurred
as patches among the brown mosses. Otherwise, both
groups were dominated by sedges and grasses such
as Carex nigra and Agrostis canina, while the forbs
Comarum palustre and Lysimachia thyrsiflora were
also common. The organic layer was only a few
centimetres thick in both groups. Groups SJ 3 and
SJ 4 were characterised by mesotrophic and
oligotrophic fen vegetation, respectively. The
vegetation consisted mainly of sedges (e.g. Carex
chordorrhiza, Carex rostrata and Carex limosa).
Dominant forbs in SJ 3 and SJ 4 were C. palustre and
Menyanthes trifoliata, respectively. Hummock
formation with very dense Sphagnum carpets had
already started at the edges of the fens, while the
middle parts of the fens were strongly impacted by
spring and autumn floods. These sites were located
7 m and 12 m above sea level and the peat layer was
0.4 m and 0.9 m thick in SJ 3 and SJ 4, respectively.
Group SJ 5 was at the fen–bog transition stage with a
mosaic of clearly ombrotrophic hummock surfaces
with Rubus chamaemorus, Empetrum nigrum,
Vaccinium oxycoccos and Sphagnum fuscum, and
wetter surfaces dominated by Scheuchzeria palustris,
Carex livida, Carex limosa and C. chordorhiza.
Sphagnum species accustomed to different water
table depths formed a continuous moss layer. The
sites were located 25 m above sea level and the peat
layer was 1.9 m thick on average. Site SJ 6 was a bog,
characterised by S. fuscum, Sphagnum angustifolium
and dwarf shrubs such as E. nigrum and
Rhododendron tomentosum at the hummock surfaces
and Sphagnum balticum and Eriophorum vaginatum
in wetter depressions. The peat layer in SJ 6 was up
to 2.3 m thick, with a terrestrial age of 3000 years.
See Tuittila et al. (2013) for further details of the
study sites.
To cover the characteristic variation in moisture
and vegetation at each site, we placed six 50 × 50 cm
sample plots along a 10 m transect from the centre to
the edge of the mire. We surveyed the projection
cover of different vascular plant and moss species on
a percentage scale in a total of 132 sample plots. The
survey was conducted in July 2003, except in sites
SJ 0 and SJ 6 where it was carried out in July 2007.
The nomenclature follows http://theplantlist.org/.
Diversity measures
As a measure of species diversity, we calculated the
species richness and the Shannon diversity index
(Tuomisto 2012) for each study site based on the
species occurrences. We also calculated the indices
separately for vascular plants and mosses to facilitate
comparison with functional diversity indices.
To study functional diversity, we extracted plant
trait information from two databases, namely
BIOLFLOR (Klotz et al. 2002) and LEDA (Kleyer et
al. 2008), and from literature sources (Dierssen 2001,
Ulvinen et al. 2002, Smith 2004). Specific leaf area
(SLA) for the most common species was measured
by collecting samples of leaves from vascular species
at each site. Leaf area was measured from scanned
leaves with the ImageJ program and the dry weight
of each leaf was measured after drying at 40 ºC for
72 hours. The data consisted of leaf traits,
reproductive and dispersion traits, morphological
traits, life history strategy, indicator values,
environmental requirements, and flowering
phenology traits. Altogether, 15 traits for vascular
plants (Table A1, see Appendix) and 17 traits for
mosses (Table A2) were included.
We calculated two different functional diversity
indices, namely functional diversity (FD) by Petchey
& Gaston (2002) which is a measure of functional
richness, and Rao's quadratic entropy (RaoQ) which
combines functional richness (i.e. the range of trait
values) and functional divergence (i.e. the position of
dominant species relative to centre of the trait range)
(e.g. Botta-Dukát 2005). In addition, we calculated
the community weighted means of functional traits
(CWM traits) (Villéger et al. 2008, Laliberté &
Legendre 2010). RaoQ (Botta-Dukát & Czúcz 2016)
and CWM traits were calculated using the ‘‘FD’’
package (Laliberté et al. 2014) in the R environment
(R Development Core Team 2011). As functional
traits were both categorical and numerical variables,
we applied Gower’s distance coefficient (Podani &
Schmera 2006) to prepare a matrix of dissimilarity,
which was used for calculations of functional
diversity components. We used the dendrogram-
based method with Gower distances following
Petchey & Gaston (2002) to calculate FD
(Figure A1). The non-randomness in FD along the
mire chronosequence was tested using three null
community models, R0 (Patterson & Atmar 1986),
C0 (Jonsson 2001), and quasi-swap method (Miklós
& Podani 2004). We created 9999 simulations with
all three methods and compared the observed FD to
the density distribution of the simulated FD for the
null communities. The models differ: the R0 method
holds the species number and all species have the
same sampling probability; while the C0 method
holds original species frequencies although their
locations are random and, unlike R0, it does not retain
the observed species richness. The non-sequential
quasi-swap method uses fixed species frequencies
and numbers of species. In the C0 and quasi-swap
methods, the original commonness and rarity of
species are retained, while in the R0 method all
A.M. Laine et al. PLANT DIVERSITY AND FUNCTIONAL TRAITS DURING MIRE DEVELOPMENT
Mires and Peat, Volume 21 (2018), Article 02, 1–19, http://www.mires-and-peat.net/, ISSN 1819-754X
© 2018 International Mire Conservation Group and International Peatland Society, DOI: 10.19189/MaP.2017.OMB.280
4
species are equal. Functional diversity (FD) and tree-
based dissimilarities were calculated with the vegan
package (Oksanen et al. 2011) in the R environment
(R Development Core Team 2011).
To test for differences between successional steps
in each diversity metric, we carried out ANOVA
analysis with Tukey post hoc tests. We included only
the replicated successional steps SJ 1–5. In addition,
we calculated Pearson’s correlation coefficients
between species richness and other diversity indices,
separately for vascular plants and mosses.
RESULTS
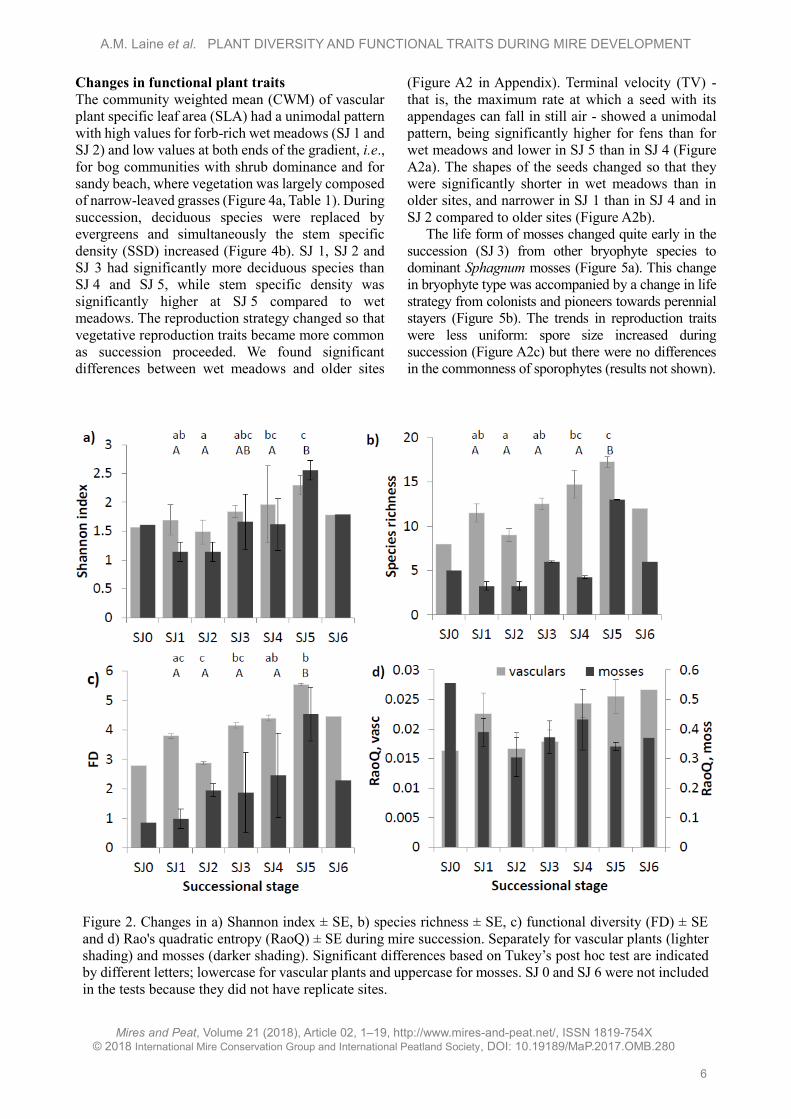
Plant species diversity
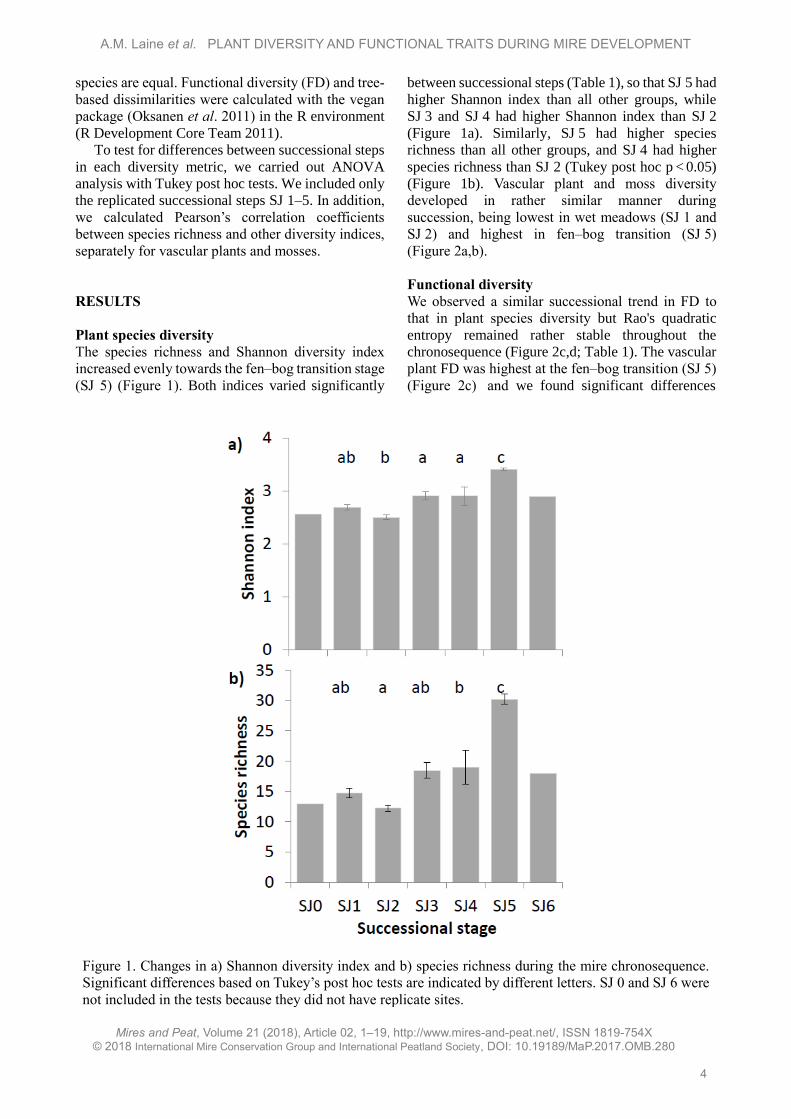
The species richness and Shannon diversity index
increased evenly towards the fen–bog transition stage
(SJ 5) (Figure 1). Both indices varied significantly
between successional steps (Table 1), so that SJ 5 had
higher Shannon index than all other groups, while
SJ 3 and SJ 4 had higher Shannon index than SJ 2
(Figure 1a). Similarly, SJ 5 had higher species
richness than all other groups, and SJ 4 had higher
species richness than SJ 2 (Tukey post hoc p < 0.05)
(Figure 1b). Vascular plant and moss diversity
developed in rather similar manner during
succession, being lowest in wet meadows (SJ 1 and
SJ 2) and highest in fen–bog transition (SJ 5)
(Figure 2a,b).
Functional diversity
We observed a similar successional trend in FD to
that in plant species diversity but Rao's quadratic
entropy remained rather stable throughout the
chronosequence (Figure 2c,d; Table 1). The vascular
plant FD was highest at the fen–bog transition (SJ 5)
(Figure 2c) and we found significant differences
Figure 1. Changes in a) Shannon diversity index and b) species richness during the mire chronosequence.
Significant differences based on Tukey’s post hoc tests are indicated by different letters. SJ 0 and SJ 6 were
not included in the tests because they did not have replicate sites.
A.M. Laine et al. PLANT DIVERSITY AND FUNCTIONAL TRAITS DURING MIRE DEVELOPMENT
Mires and Peat, Volume 21 (2018), Article 02, 1–19, http://www.mires-and-peat.net/, ISSN 1819-754X
© 2018 International Mire Conservation Group and International Peatland Society, DOI: 10.19189/MaP.2017.OMB.280
5
between early and late successional steps (Table 1):
SJ 5 had higher FD than SJ 1 and SJ 2, and SJ 4 higher
FD than SJ 2 (Figure 2c). Of the null models, only the
C0 model, which allows species number to vary,
showed a notable pattern for the vascular plants
(0.05 ≤ p ≤ 0.08), with FD smaller than random for
SJ 0, SJ 2_1, SJ 2_3 and higher than random for
SJ 4_2 (the abbreviation SJx_y, denotes a particular
site y and successional step x). The null model results
are not shown.
Similarly to vascular plants, FD of mosses
increased during succession until SJ 5. SJ 5 had
higher FD than the younger groups but there were no
significant differences between the other groups
(Figure 2c). The C0 null model gives strength to this
increasing successional trend in FD, as FD was
smaller than random in the early successional steps
(SJ 0 (p = 0.057) and SJ 1_1, 2, 3 (p < 0.05)) and
higher than random in the fen–bog transition (SJ 5,
0.008 ≤ p ≤ 0.0001). However, the R0 and quasi-swap
models, which take into account species number, did
not recognise the unimodal pattern. This indicates
that the increase in FD was directly due to an increase
in taxonomic diversity.
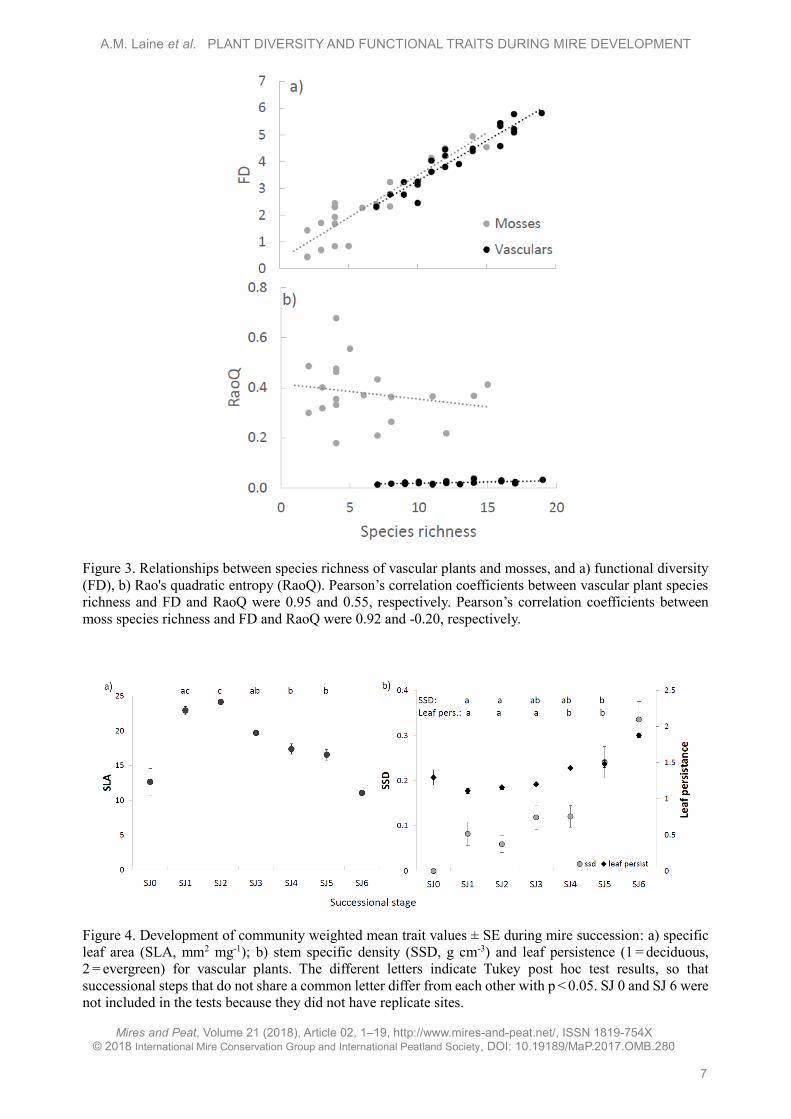
There was a positive linear relationship between
FD and species richness for vascular plants and
mosses (Figure 3a), but RaoQ showed no relationship
with species richness (Figure 3b).
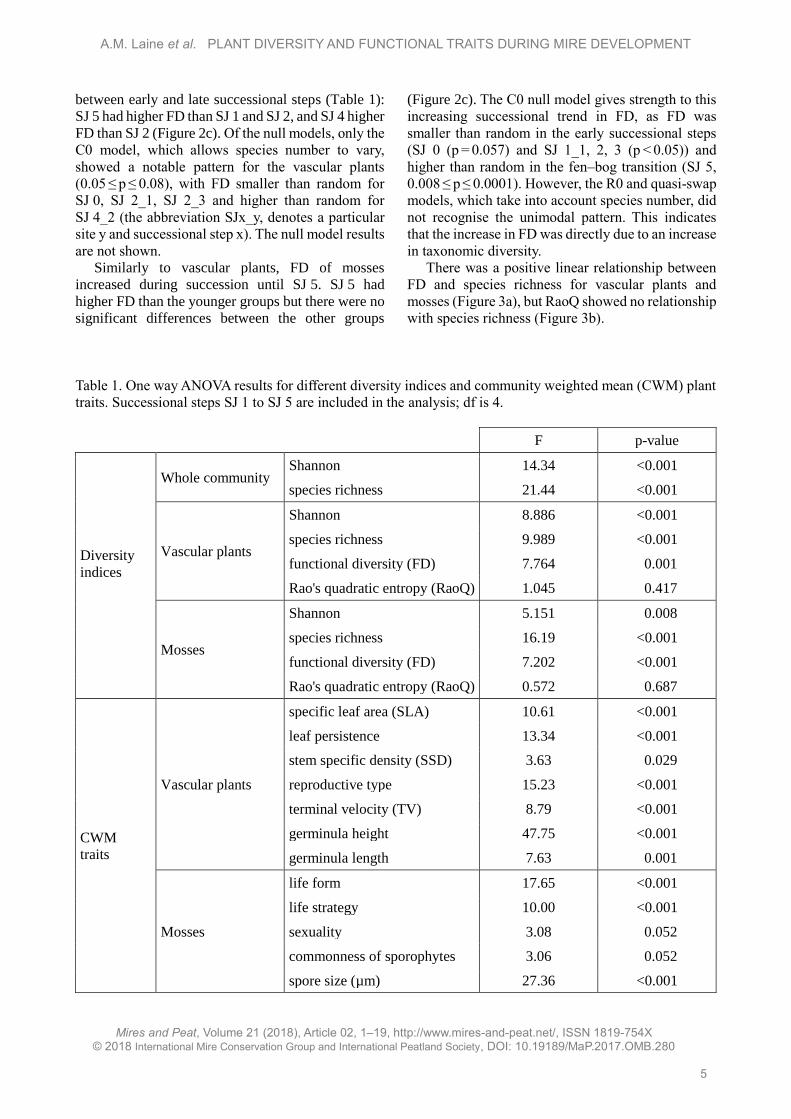
Table 1. One way ANOVA results for different diversity indices and community weighted mean (CWM) plant
traits. Successional steps SJ 1 to SJ 5 are included in the analysis; df is 4.
F p-value
Diversity
indices
Whole community Shannon 14.34 <0.001
species richness 21.44 <0.001
Vascular plants
Shannon 8.886 <0.001
species richness 9.989 <0.001
functional diversity (FD) 7.764 0.001
Rao's quadratic entropy (RaoQ) 1.045 0.417
Mosses
Shannon 5.151 0.008
species richness 16.19 <0.001
functional diversity (FD) 7.202 <0.001
Rao's quadratic entropy (RaoQ) 0.572 0.687
CWM
traits
Vascular plants
specific leaf area (SLA) 10.61 <0.001
leaf persistence 13.34 <0.001
stem specific density (SSD) 3.63 0.029
reproductive type 15.23 <0.001
terminal velocity (TV) 8.79 <0.001
germinula height 47.75 <0.001
germinula length 7.63 0.001
Mosses
life form 17.65 <0.001
life strategy 10.00 <0.001
sexuality 3.08 0.052
commonness of sporophytes 3.06 0.052
spore size (µm) 27.36 <0.001
A.M. Laine et al. PLANT DIVERSITY AND FUNCTIONAL TRAITS DURING MIRE DEVELOPMENT
Mires and Peat, Volume 21 (2018), Article 02, 1–19, http://www.mires-and-peat.net/, ISSN 1819-754X
© 2018 International Mire Conservation Group and International Peatland Society, DOI: 10.19189/MaP.2017.OMB.280
6
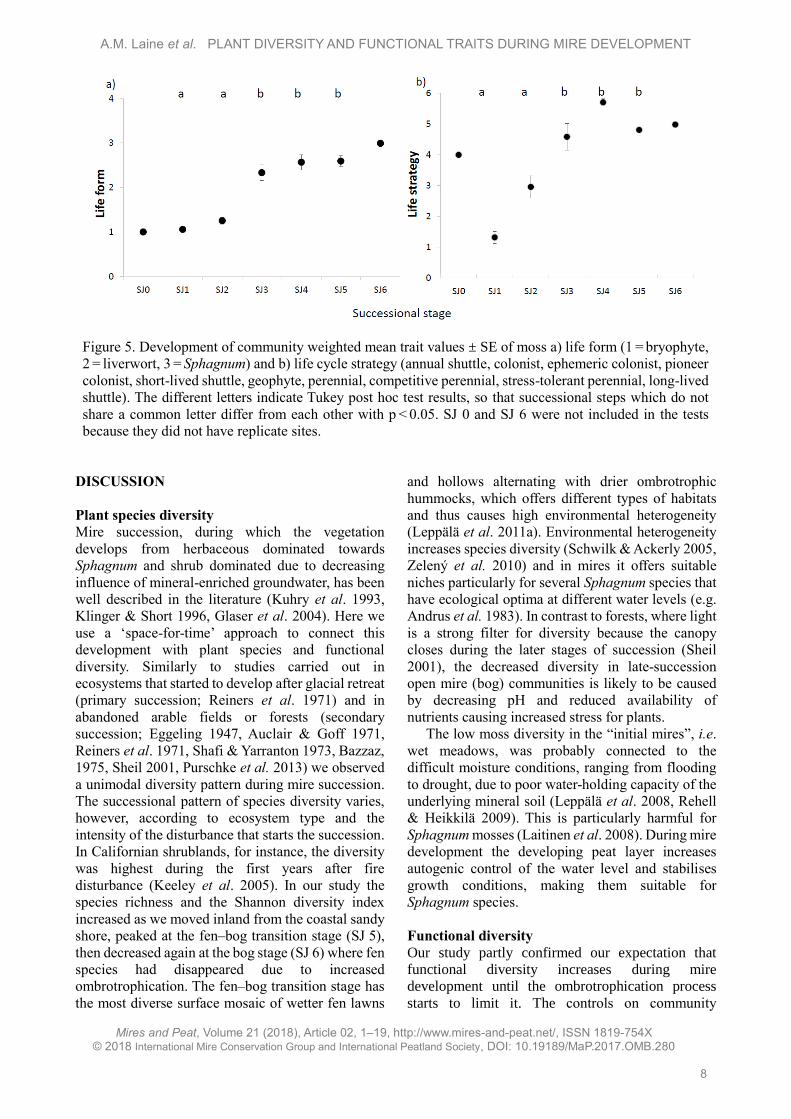
Changes in functional plant traits
The community weighted mean (CWM) of vascular
plant specific leaf area (SLA) had a unimodal pattern
with high values for forb-rich wet meadows (SJ 1 and
SJ 2) and low values at both ends of the gradient, i.e.,
for bog communities with shrub dominance and for
sandy beach, where vegetation was largely composed
of narrow-leaved grasses (Figure 4a, Table 1). During
succession, deciduous species were replaced by
evergreens and simultaneously the stem specific
density (SSD) increased (Figure 4b). SJ 1, SJ 2 and
SJ 3 had significantly more deciduous species than
SJ 4 and SJ 5, while stem specific density was
significantly higher at SJ 5 compared to wet
meadows. The reproduction strategy changed so that
vegetative reproduction traits became more common
as succession proceeded. We found significant
differences between wet meadows and older sites
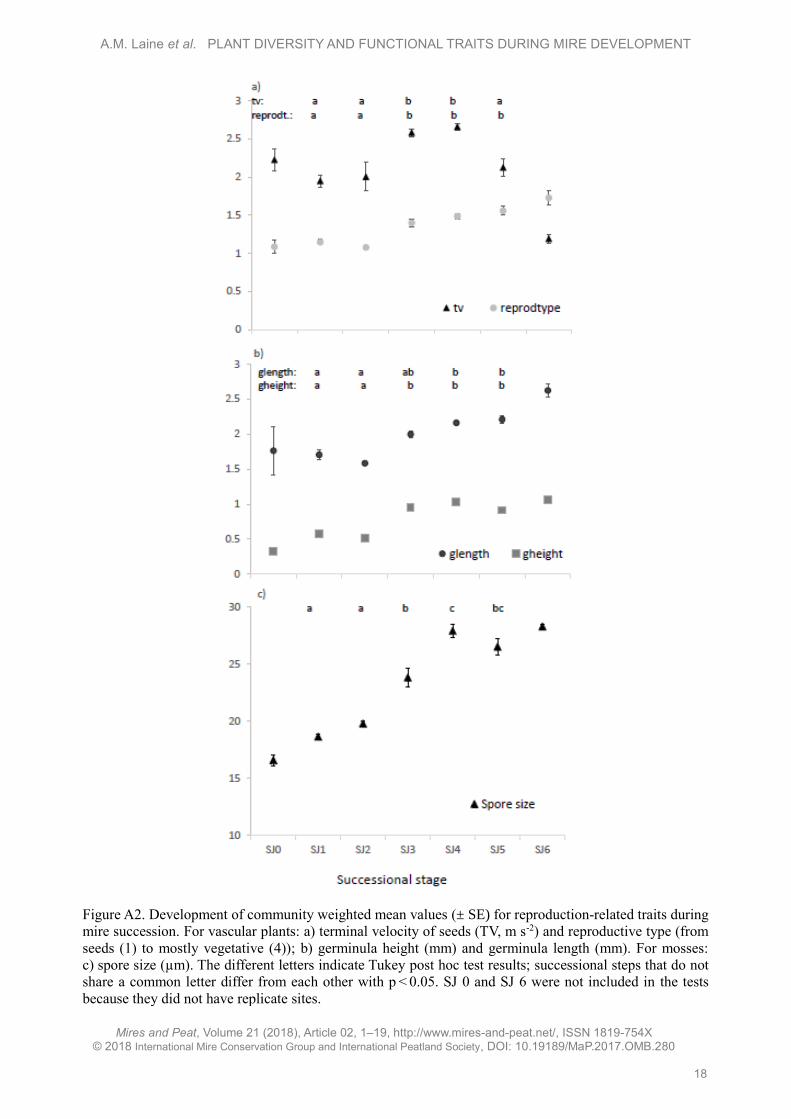
(Figure A2 in Appendix). Terminal velocity (TV) -
that is, the maximum rate at which a seed with its
appendages can fall in still air - showed a unimodal
pattern, being significantly higher for fens than for
wet meadows and lower in SJ 5 than in SJ 4 (Figure
A2a). The shapes of the seeds changed so that they
were significantly shorter in wet meadows than in
older sites, and narrower in SJ 1 than in SJ 4 and in
SJ 2 compared to older sites (Figure A2b).
The life form of mosses changed quite early in the
succession (SJ 3) from other bryophyte species to
dominant Sphagnum mosses (Figure 5a). This change
in bryophyte type was accompanied by a change in life
strategy from colonists and pioneers towards perennial
stayers (Figure 5b). The trends in reproduction traits
were less uniform: spore size increased during
succession (Figure A2c) but there were no differences
in the commonness of sporophytes (results not shown).
Figure 2. Changes in a) Shannon index ± SE, b) species richness ± SE, c) functional diversity (FD) ± SE
and d) Rao's quadratic entropy (RaoQ) ± SE during mire succession. Separately for vascular plants (lighter
shading) and mosses (darker shading). Significant differences based on Tukey’s post hoc test are indicated
by different letters; lowercase for vascular plants and uppercase for mosses. SJ 0 and SJ 6 were not included
in the tests because they did not have replicate sites.
A.M. Laine et al. PLANT DIVERSITY AND FUNCTIONAL TRAITS DURING MIRE DEVELOPMENT
Mires and Peat, Volume 21 (2018), Article 02, 1–19, http://www.mires-and-peat.net/, ISSN 1819-754X
© 2018 International Mire Conservation Group and International Peatland Society, DOI: 10.19189/MaP.2017.OMB.280
7
Figure 3. Relationships between species richness of vascular plants and mosses, and a) functional diversity
(FD), b) Rao's quadratic entropy (RaoQ). Pearson’s correlation coefficients between vascular plant species
richness and FD and RaoQ were 0.95 and 0.55, respectively. Pearson’s correlation coefficients between
moss species richness and FD and RaoQ were 0.92 and -0.20, respectively.
Figure 4. Development of community weighted mean trait values ± SE during mire succession: a) specific
leaf area (SLA, mm2 mg-1); b) stem specific density (SSD, g cm-3) and leaf persistence (1 = deciduous,
2 = evergreen) for vascular plants. The different letters indicate Tukey post hoc test results, so that
successional steps that do not share a common letter differ from each other with p < 0.05. SJ 0 and SJ 6 were
not included in the tests because they did not have replicate sites.
A.M. Laine et al. PLANT DIVERSITY AND FUNCTIONAL TRAITS DURING MIRE DEVELOPMENT
Mires and Peat, Volume 21 (2018), Article 02, 1–19, http://www.mires-and-peat.net/, ISSN 1819-754X
© 2018 International Mire Conservation Group and International Peatland Society, DOI: 10.19189/MaP.2017.OMB.280
8
Figure 5. Development of community weighted mean trait values ± SE of moss a) life form (1 = bryophyte,
2 = liverwort, 3 = Sphagnum) and b) life cycle strategy (annual shuttle, colonist, ephemeric colonist, pioneer
colonist, short-lived shuttle, geophyte, perennial, competitive perennial, stress-tolerant perennial, long-lived
shuttle). The different letters indicate Tukey post hoc test results, so that successional steps which do not
share a common letter differ from each other with p < 0.05. SJ 0 and SJ 6 were not included in the tests
because they did not have replicate sites.
DISCUSSION
Plant species diversity
Mire succession, during which the vegetation
develops from herbaceous dominated towards
Sphagnum and shrub dominated due to decreasing
influence of mineral-enriched groundwater, has been
well described in the literature (Kuhry et al. 1993,
Klinger & Short 1996, Glaser et al. 2004). Here we
use a ‘space-for-time’ approach to connect this
development with plant species and functional
diversity. Similarly to studies carried out in
ecosystems that started to develop after glacial retreat
(primary succession; Reiners et al. 1971) and in
abandoned arable fields or forests (secondary
succession; Eggeling 1947, Auclair & Goff 1971,
Reiners et al. 1971, Shafi & Yarranton 1973, Bazzaz,
1975, Sheil 2001, Purschke et al. 2013) we observed
a unimodal diversity pattern during mire succession.
The successional pattern of species diversity varies,
however, according to ecosystem type and the
intensity of the disturbance that starts the succession.
In Californian shrublands, for instance, the diversity
was highest during the first years after fire
disturbance (Keeley et al. 2005). In our study the
species richness and the Shannon diversity index
increased as we moved inland from the coastal sandy
shore, peaked at the fen–bog transition stage (SJ 5),
then decreased again at the bog stage (SJ 6) where fen
species had disappeared due to increased
ombrotrophication. The fen–bog transition stage has
the most diverse surface mosaic of wetter fen lawns
and hollows alternating with drier ombrotrophic
hummocks, which offers different types of habitats
and thus causes high environmental heterogeneity
(Leppälä et al. 2011a). Environmental heterogeneity
increases species diversity (Schwilk & Ackerly 2005,
Zelený et al. 2010) and in mires it offers suitable
niches particularly for several Sphagnum species that
have ecological optima at different water levels (e.g.
Andrus et al. 1983). In contrast to forests, where light
is a strong filter for diversity because the canopy
closes during the later stages of succession (Sheil
2001), the decreased diversity in late-succession
open mire (bog) communities is likely to be caused
by decreasing pH and reduced availability of
nutrients causing increased stress for plants.
The low moss diversity in the “initial mires”, i.e.
wet meadows, was probably connected to the
difficult moisture conditions, ranging from flooding
to drought, due to poor water-holding capacity of the
underlying mineral soil (Leppälä et al. 2008, Rehell
& Heikkilä 2009). This is particularly harmful for
Sphagnum mosses (Laitinen et al. 2008). During mire
development the developing peat layer increases
autogenic control of the water level and stabilises
growth conditions, making them suitable for
Sphagnum species.
Functional diversity
Our study partly confirmed our expectation that
functional diversity increases during mire
development until the ombrotrophication process
starts to limit it. The controls on community
A.M. Laine et al. PLANT DIVERSITY AND FUNCTIONAL TRAITS DURING MIRE DEVELOPMENT
Mires and Peat, Volume 21 (2018), Article 02, 1–19, http://www.mires-and-peat.net/, ISSN 1819-754X
© 2018 International Mire Conservation Group and International Peatland Society, DOI: 10.19189/MaP.2017.OMB.280
9
assembly change during succession, from abiotic to
biotic filtering (e.g. Leibold et al. 2004, Purschke et
al. 2013), which increases functional diversity
(Weiher & Keddy 1995). In general, abiotic filtering
selects for species with shared adaptations to a
particular habitat and, therefore, similar traits (Diaz
et al. 1998, Cornwell et al. 2006). On the other hand,
biotic filtering increases functional diversity through
processes that select for functionally different
species, such as competitive exclusion and resource
partitioning (Weiher & Keddy 1995, Weiher et al.
2011). In our study the functional complexity index
(FD) confirmed this hypothesis, as it increased until
the fen–bog transition stage and decreased again in
the ombrotrophic bog where abiotic filtering is likely
to play an important role. The same trend has been
observed in other ecosystems (Mason et al. 2011,
Lohbeck et al. 2012, Purschke et al. 2013). On the
other hand, the Rao’s quadratic entropy did not
confirm the same pattern, but remained rather
constant throughout the chronosequence. Unlike FD,
Rao’s quadratic entropy combines functional
richness with functional divergence (Mouchet et al.
2010). High functional divergence indicates a high
degree of niche differentiation and, thus, low
resource competition (Mason et al. 2005). The reason
we did not observe changes in functional divergence
may be that, during mire succession, the habitats
remain open and there is little change in light
competition, while below-ground competition for
soil nutrients and water dominates. Compared to size-
asymmetric light competition, the size-symmetric
below-ground competition does not enhance niche
differentiation in a similar manner (Mason et al.
2013).
We found a clear positive correlation between
species richness and FD for both vascular plants and
mosses. A similar relationship has been found during
secondary forest succession (Lochbeck et al. 2012).
This could imply a lack of functional redundancy
during mire succession so that each added species
will equally increase the functional diversity and the
traits of species do not overlap strongly (Petchey &
Gaston 2002). Then again, the correlation with
species richness is built into the parameter FD, which
is the summed branch lengths of the dendrogram of
species based on functional differences. Therefore,
entering a new species into the community increases
the number of branches and consequently increases
FD (Botta-Dukát 2005). A disadvantage of our
analysis of functional diversity is that it was not
possible to include vascular plants and mosses in the
same analysis because they have very different
functional traits. For many mire functions, the shift
of dominance from vascular plants to Sphagnum is
the most notable change during succession (e.g. Van
Breemen 1995). In our chronosequence, Sphagnum
species were already starting to dominate the moss
layer in mesotrophic fens (SJ 3), and at the fen–bog
transition stage the total cover of Sphagnum
exceeded that of vascular plants (Figure A3).
Trait change
We found an expected trait trade-off from acquisitive
species to conservative species during hydroseral
mire development. The community weighted mean
of SLA clearly decreased after ombrotrophication
had started. SLA is positively correlated with growth
rate and resource richness and negatively correlated
with investment into leaf protection (Schierenbeck et
al. 1994, Westoby 1998). Therefore, decreasing SLA
during succession is a common phenomenon
(Schleicher et al. 2011, Purschke et al. 2013). In
addition, an increase in the stem specific density
(SSD) and a shift from deciduous to evergreen plants
supports the trade-off towards conservative strategy.
As for mosses, the dominance of Sphagnum species
had already begun in the 700-year-old fens. The
development of Sphagnum cover is seen as a turning
point in mire succession as it creates more stable
moisture conditions and accelerates autogenic
development towards ombrotrophication (Van
Breemen 1995). Reproductive traits changed along
the succession gradient in accordance with traditional
succession theory, in that there was more effective
colonisation by vascular plants at younger
successional stages than at later successional stages.
At younger sites, reproduction occurred mostly via
seeds that were smaller in size and had higher
terminal velocity, allowing better wind dispersal. The
reproductive traits of mosses followed the same
trajectory as those of vascular plants, with spore size
increasing during succession, but we found no
differences in the commonness of sporophytes. In
general, our observations on the changes in traits are
very similar to those found by Navas et al. (2010) in
abandoned Mediterranean fields.
Consequences for ecosystem functions
The shift from acquisitive to conservative strategy
during succession influences several ecosystem
processes such as productivity and decomposition
(e.g. Kazakou et al. 2006). Furthermore, increasing
diversity is linked not only with increased rates of
productivity but also with ecosystem resilience (e.g.
Zak et al. 2003). In our study, increasing diversity
and trait shift occurred hand-in-hand. In our
chronosequence, the water table regime, carbon
dioxide (CO2) dynamics and methane (CH4)
emissions were more stable at the most diverse

A.M. Laine et al. PLANT DIVERSITY AND FUNCTIONAL TRAITS DURING MIRE DEVELOPMENT
Mires and Peat, Volume 21 (2018), Article 02, 1–19, http://www.mires-and-peat.net/, ISSN 1819-754X
© 2018 International Mire Conservation Group and International Peatland Society, DOI: 10.19189/MaP.2017.OMB.280
10
successional stage (namely the fen–bog transition)
than in the early stages (Leppälä et al. 2011a,b). At
the young stages, ecosystem functions seemed
extremely sensitive to catchment hydrology and
changes in precipitation, as the buffering capacity of
the peat layer was as yet poorly developed. We do not
have data on the inter-annual variability of gas fluxes
and water table from our bog site, but Korrensalo et
al. (2017) recently showed that the diverse plant
communities in a bog can stabilise carbon
sequestration because different plant species meet
their optimal conditions at different times. This
indicates that resistance to water level fluctuations
and the associated stabilisation of peat accumulation
increase during mire succession. The acquisitive
strategy makes species most productive and
competitive under their optimal growing conditions
(Reich 2014). Therefore, when the conditions change
to suboptimal due to e.g. change in land use or
climate, they are likely to suffer. Soudzilovskaia et al.
(2013) noticed that conservative species with high
resource input into structural traits such as thick
leaves and low SLA and, at the same time, high C
content in roots, increase in abundance under warmer
climate conditions. An artificial warming experiment
in tundra increased leaf size and plant height, and
decreased specific leaf area (SLA) and leaf C
concentration (Hudson et al. 2011). Experimental
warming and water table manipulations at
ecosystem/community level have shown that fens are
more sensitive than bogs to increased temperature
and drying (Weltzin et al. 2003, Bridgham et al.
2008). While the functional redundancy during mire
succession, indicated by the correlation between FD
and species richness, suggests that resistance to
environmental disturbance does not change during
mire succession, the trait trade-off from acquisitive
strategy to conservative strategy, together with the
development of hummock-hollow microtopography
with strongly differing vegetation composition,
indicates increasing resistance during succession.
These counteracting processes create a highly
valuable setting for further investigations on changes
in plant functional traits during natural mire
development and environmental disturbances such as
climate change or land use change. While the use of
traits data from databases is practical for many
situations, it does support the investigation of
intraspecific variability in traits between different
mire types or land uses. This raises a need for further
investigations and highlights the need to measure
traits from a variety of peatland types (see also Moor
et al. 2017). In mires and other ecosystems where
mosses play an important role, the use of functional
diversity indices is complicated by the fact that it is
not practical to use the same traits for mosses and
vascular plants. Therefore, the indices need to be
calculated separately for these two components.
ACKNOWLEDGEMENTS
We warmly thank Kari Kukko-Oja for help with site
selection and David Wilson for language revision.
The financial support of the Academy of Finland
(project code 131409, 218101, 287039), Kone
Foundation, University of Helsinki and University of
Oulu is acknowledged. We are also grateful to the
referees and Editor Ab Grootjans for their valuable
comments on earlier versions of this manuscript.
REFERENCES
Andrus, R.E., Wagner, D.J. & Titus, J.E. (1983)
Vertical zonation of Sphagnum mosses along
hummock-hollow gradients. Canadian Journal of
Botany, 61, 3128–3139.
Auclair, A.N. & Goff, F.G. (1971) Diversity relations
of upland forests in the western Great Lakes area.
American Naturalist, 105, 499–528.
Basiliko, N., Moore, T.R., Jeannotte, R. & Bubier,
J.L. (2006) Nutrient input and carbon and
microbial dynamics in an ombrotrophic bog.
Geomicrobiology Journal, 23, 531–543.
Bauer, I.E., Gignac, L.D. & Vitt, D.H. (2003)
Development of a peatland complex in boreal
western Canada: lateral site expansion and local
variability in vegetation succession and long-term
peat accumulation. Canadian Journal of Botany,
81(8), 833–847.
Bazzaz, F.A. (1975) Plant species diversity in old‐field successional ecosystems in Southern Illinois.
Ecology, 56(2), 485–488.
Botta-Dukát, Z. (2005) Rao's quadratic entropy as a
measure of functional diversity based on multiple
traits. Journal of Vegetation Science, 16(5), 533–
540.
Botta-Dukát, Z. & Czúcz, B. (2016) Testing the
ability of functional diversity indices to detect
trait convergence and divergence using
individual-based simulation. Methods in Ecology
and Evolution, 7(1), 114–126.
Bragazza, L., Freeman, C., Jones, T., Rydin, H.,
Limpens, J., Fenner, N., Ellis, T., Gerdol, R.,
Hájek, M., Hájek, T., Iacumin, P., Kutnar, L.,
Tahvanainen, T. & Toberman, H. (2006)
Atmospheric nitrogen deposition promotes
carbon loss from peat bogs. Proceedings of the
National Academy of Science of the Unites States
A.M. Laine et al. PLANT DIVERSITY AND FUNCTIONAL TRAITS DURING MIRE DEVELOPMENT
Mires and Peat, Volume 21 (2018), Article 02, 1–19, http://www.mires-and-peat.net/, ISSN 1819-754X
© 2018 International Mire Conservation Group and International Peatland Society, DOI: 10.19189/MaP.2017.OMB.280
11
of America, 103(51), 19386–19389.
Breeuwer, A., Heijmans, M., Robroek, B.J., Limpens,
J. & Berendse, F. (2008) The effect of increased
temperature and nitrogen deposition on
decomposition in bogs. Oikos, 117, 1258–1268.
Bridgham, S.D. & Richardson, C.J. (2003) Endogenous
versus exogenous nutrient control over
decomposition and mineralization in North Carolina
peatlands. Biogeochemistry, 65, 151–178.
Bridgham, S.D., Pastor, J., Dewey, B., Weltzin, J.F.
& Updegraff, K. (2008) Rapid carbon response of
peatlands to climate change. Ecology, 89(11),
3041–3048.
Cadotte, M.W., Carscadden, K. & Mirotchnick, N.
(2011) Beyond species: functional diversity and
the maintenance of ecological processes and
services. Journal of Applied Ecology, 48(5),
1079–1087.
Cornwell, W.K., Schwilk, D.W. & Ackerly, D.D.
(2006) A trait‐based test for habitat filtering:
Convex hull volume. Ecology, 87(6), 1465–1471.
Cortez, J., Garnier, E., Pérez-Harguindeguy, N.,
Debussche, M. & Gillon, D. (2007) Plant traits,
litter quality and decomposition in a
Mediterranean old-field succession. Plant and
Soil, 296, 19–34.
Diaz, S. & Cabido, M. (2001) Vive la différence:
plant functional diversity matters to ecosystem
processes. Trends in Ecology & Evolution, 16,
646–655.
Diaz, S., Cabido, M. & Casanoves, F. (1998) Plant
functional traits and environmental filters at a
regional scale. Journal of Vegetation Science,
9(1), 113–122.
Dierssen, K. (2001) Distribution, Ecological Amplitude
and Phytosociological Characterization of
European Bryophytes. Bryophytorum Bibliotheca
56, J. Cramer, Berlin & Stuttgart, 289 pp.
Drewer, J., Lohila, A., Aurela, M., Laurila, T.,
Minkkinen, K., Penttilä, T., Dinsmore, K.J.,
McKenzie, R.M., Helfter, C., Flechard, C., Sutton,
M.A. and Skiba, U.M. (2010) Comparison of
greenhouse gas fluxes and nitrogen budgets from
an ombotrophic bog in Scotland and a
minerotrophic sedge fen in Finland. European
Journal of Soil Science, 61, 640–650.
Eggeling, W.J. (1947) Observations on the ecology
of the Budongo rain forest, Uganda. Journal of
Ecology, 34, 20–87.
Ekman, M. (1996) A consistent map of the postglacial
uplift of Fennoscandia. Terra Nova, 8, 158–165.
Eurola, S. (1999) Kasvipeitteemme alueellisuus (The
Regionality of our Plant Cover). Oulanka Reports
22, Oulanka Biological Station, University of
Oulu, Finland, 116 pp. (in Finnish).
Glaser, P.H., Hansen, B., Siegel, D.I., Reeve, A.S. &
Morin, P.J. (2004) Rates, pathways and drivers for
peatland development in the Hudson Bay
Lowlands, northern Ontario, Canada. Journal of
Ecology, 92(6), 1036–1053.
Gong, J., Kellomäki, S., Wang, K., Zhang, C.,
Shurpali, N. & Martikainen, P.J. (2013) Modeling
CO2 and CH4 flux changes in pristine peatlands of
Finland under changing climate conditions.
Ecological Modelling, 263, 64–80.
Hájek, T., Ballance, S., Limpens, J., Zijlstra, M. &
Verhoeven, J.T.A. (2011) Cell-wall
polysaccharides play an important role in decay
resistance of Sphagnum and actively depressed
decomposition in vitro. Biogeochemistry, 103,
45–57.
Hooper, D.U., Solan, M., Symstad, A., Diaz, S.,
Gessner, M.O., Buchmann, N., Degrange, V.,
Grime, P., Hulot, F., Mermillod-Blondin, F., Roy,
J., Spehn, E. & van Peer, L. (2002) Species
diversity, functional diversity, and ecosystem
functioning. In: Loreau, M., Naeem, S. &
Inchausti, P. (eds.) Biodiversity and Ecosystem
Functioning: Synthesis and Perspectives, Oxford
University Press, Oxford, UK, 195–208.
Hudson, J.M.G., Henry, G.H.R. & Cornwell, W.K.
(2011) Taller and larger: shifts in Arctic tundra
leaf traits after 16 years of experimental warming.
Global Change Biology, 17(2), 1013–1021.
Hughes, P.D.M. & Barber, K.E. (2003) Mire
development across the fen–bog transition on the
Teifi floodplain at Tregaron Bog, Ceredigion,
Wales, and a comparison with 13 other raised
bogs. Journal of Ecology, 91(2), 253–264.
Jonsson, B.G. (2001) A null model for randomization
tests of nestedness in species assemblages.
Oecologia, 127, 309–313.
Joosten, H., Tannenberger, F. & Moen, A. (2017)
Mires and Peatlands of Europe. Schweizerbart
Science Publishers, Stuttgart, 780 pp.
Kazakou, E., Vile, D., Shipley, B., Gallet, C. &
Garnier, E. (2006) Co-variations in litter
decomposition, leaf traits and plant growth in
species from a Mediterranean old-field
succession. Functional Ecology, 20, 21–30.
Keeley, J.E., Fotheringham, C.J. & Baer‐Keeley, M.
(2005) Factors affecting plant diversity during
post‐fire recovery and succession of
mediterranean‐climate shrublands in California,
USA. Diversity and Distributions, 11(6), 525–
537.
Kleyer, M., Bekker, R.M., Knevel, I.C., Bakker, J.P.,
Thompson, K., Sonnenchein, M., Poschlod, P.,
van Groenendael, J.M., Klimeš, L., Klimešová, J.,
Klotz, S., Rusch, G.M., Hermy, M., Adriaens, D.,
A.M. Laine et al. PLANT DIVERSITY AND FUNCTIONAL TRAITS DURING MIRE DEVELOPMENT
Mires and Peat, Volume 21 (2018), Article 02, 1–19, http://www.mires-and-peat.net/, ISSN 1819-754X
© 2018 International Mire Conservation Group and International Peatland Society, DOI: 10.19189/MaP.2017.OMB.280
12
Boedeltje, G., Bossuyt, B., Dannemann, A.,
Endels, P., Götzenberger, L., Hodgson, J.G.,
Jackel, A.-K., Kühn, I., Kunzmann, D., Ozinga,
W.A., Römermann, C., Stadler, M.,
Schlegelmilch, J., Steendam, H.J., Tackenberg,
O., Wilmann, B., Cornelissen, J.H.C., Eriksson,
O., Garnier, E. & Peco, B. (2008) The LEDA
Traitbase: a database of life history traits of the
Northwest European flora. Journal of Ecology,
96, 1266–1274.
Klinger, L.F. & Short, S.K. (1996) Succession in the
Hudson Bay Lowland, Northern Ontario, Canada.
Arctic and Alpine Research, 28, 172–183.
Klotz, S., Kühn, I. & Durka, W. (2002) BIOLFLOR -
Eine Datenbank mit biologisch-ökologischen
Merkmalen zur Flora von Deutschland
(BIOLFLOR - A Database of Biological-
Ecological Characteristics for the Flora of
Germany). Schriftenreihe für Vegetationskunde
38, Bundesamt für Naturschutz, Bonn, Germany,
334 pp. (in German).
Korrensalo, A., Alekseychik, P., Hájek, T., Rinne, J.,
Vesala, T., Mehtätalo, L., Mammarella, I. &
Tuittila, E.-S. (2017) Species-specific temporal
variation in photosynthesis as a moderator of
peatland carbon sequestration. Biogeosciences,
14(2), 257.
Kuhry, P., Nicholson, B.J., Gignac, L.D., Vitt, D.H.
& Bayley, S.E. (1993) Development of
Sphagnum-dominated peatlands in boreal
continental Canada. Canadian Journal of Botany,
71(1), 10–22.
Laitinen, J., Rehell, S. & Oksanen, J. (2008)
Community and species responses to water level
fluctuations with reference to soil layers in
different habitats of mid-boreal mire complexes.
Plant Ecology, 194, 17–36.
Laliberté, E. & Legendre, P. (2010) A distance‐based
framework for measuring functional diversity
from multiple traits. Ecology, 91(1), 299–305.
Laliberté, E., Legendre, P. & Shipley, B. (2014) FD:
measuring functional diversity from multiple
traits, and other tools for functional ecology. R
package version 1.0-12. Online at: https://cran.r-
project.org/web/packages/FD/FD.pdf.
Lavorel, S. & Garnier, E. (2002) Predicting changes
in community composition and ecosystem
functioning from plant traits: revisiting the Holy
Grail. Functional Ecology, 16, 545–556.
Leibold, M.A., Holyoak, M., Mouquet, N.,
Amarasekare, P., Chase, J.M., Hoopes, M.F., Holt,
R.D., Shurin, J.B., Law, R., Tilman, D. & Loreau,
M. (2004) The metacommunity concept: a
framework for multi‐scale community ecology.
Ecology Letters, 7(7), 601–613.
Leppälä, M., Kukko-Oja, K., Laine, J. & Tuittila, E.-
S. (2008) Seasonal dynamics of CO2 exchange
during primary succession of boreal mires as
controlled by phenology of plants. Ecoscience,
15, 460–471.
Leppälä, M., Laine, A.M., Seväkivi, M.-L. & Tuittila,
E.-S. (2011a) Differences in CO2 dynamics
between successional mire plant communities
during wet and dry summers. Journal of
Vegetation Sciences, 22, 357–366.
Leppälä, M., Oksanen, J. & Tuittila, E.-S. (2011b)
Methane flux dynamics during the mire
succession. Oecologia, 165, 489–499.
Lohbeck, M., Poorter, L., Paz, H., Pla, L., van
Breugel, M., Martínez-Ramos, M. & Bongers, F.
(2012) Functional diversity changes during
tropical forest succession. Perspectives in Plant
Ecology, Evolution and Systematics, 14, 89–96.
Magyari, E., Sümegi, P., Braun, M., Jakab, G. &
Molnár, M. (2001) Retarded wetland succession:
anthropogenic and climatic signals in a Holocene
peat bog profile from north-east Hungary. Journal
of Ecology, 89, 1019–1032.
Mason, N.W., Bello, F., Mouillot, D., Pavoine, S. &
Dray, S. (2013) A guide for using functional
diversity indices to reveal changes in assembly
processes along ecological gradients. Journal of
Vegetation Science, 24(5), 794–806.
Mathijssen, P.J., Väliranta, M., Korrensalo, A.,
Alekseychik, P., Vesala, T., Rinne, J. & Tuittila,
E.-S. (2016) Reconstruction of Holocene carbon
dynamics in a large boreal peatland complex,
southern Finland. Quaternary Science Reviews,
142, 1–15.
Mason, N.W., Mouillot, D., Lee, W.G., & Wilson,
J.B. (2005) Functional richness, functional
evenness and functional divergence: the primary
components of functional diversity. Oikos, 111(1),
112–118.
Mason, N.W.H., Carswell, F.E., Richardson, S.J. &
Burrows, L.E. (2011) Leaf palatability and
decomposability increase during a 200-year-old
post-cultural woody succession in New Zealand.
Journal of Vegetation Sciences, 22, 6–17.
Merilä, P., Galand, P.E., Fritze, H., Tuittila, E.-S.,
Kukko-Oja, K., Laine, J. & Yrjälä, K. (2006)
Methanogen communities along a primary
succession transect of mire ecosystems. FEMS
Microbiology Ecology, 55(2), 221–229.
Miklós, I. & Podani, J. (2004) Randomization of
presence-absence matrices: comments and new
algorithms. Ecology, 85, 86–92.
Miles, J. (1987) Vegetation succession: past and
present perceptions. In: Gray, A.J., Crawley, M.J.
& Edwards, P.J. (eds.) Colonization, Succession
A.M. Laine et al. PLANT DIVERSITY AND FUNCTIONAL TRAITS DURING MIRE DEVELOPMENT
Mires and Peat, Volume 21 (2018), Article 02, 1–19, http://www.mires-and-peat.net/, ISSN 1819-754X
© 2018 International Mire Conservation Group and International Peatland Society, DOI: 10.19189/MaP.2017.OMB.280
13
and Stability, Blackwell, Oxford, UK, 1–29.
Moor, H., Rydin, H., Hylander, K., Nilsson, M.B.,
Lindborg, R. & Norberg, J. (2017) Towards a trait‐based ecology of wetland vegetation. Journal of
Ecology, 105, 1623–1635.
Mouchet, M.A., Villéger, S., Mason, N.W.H. &
Moullot, D. (2010) Functional diversity measures:
an overview of their redundancy and their ability
to discriminate community assembly rules.
Functional Ecology, 24, 867–876.
Navas, M.L., Roumet, C., Bellmann, A., Laurent, G.
& Garnier, E. (2010). Suites of plant traits in
species from different stages of a Mediterranean
secondary succession. Plant Biology, 12(1), 183–
196.
Oksanen, J., Blanchet, G., Kindt, R., Legendre, P.,
Minchin, P., O`Hara, R.B., Simpson, G.L.,
Solymos, P., Stevens, M.H.H. & Wagner, H.
(2011) Vegan: Community Ecology Package,
Version 2.0-2. Online at: http://cran.r-project.org.
Patterson, B.D. & Atmar, W. (1986) Nested subsets
and the structure of insular mammalian faunas and
archipelagos. Biological Journal of the Linnean
Society, 28(1–2), 65–82.
Petchey, O.L. & Gaston, K.J. (2002) Functional
diversity (FD), species richness and community
composition. Ecology Letters, 5, 402–411.
Podani, J. & Schmera, D. (2006) On dendrogram-
based measures of functional diversity. Oikos,
115, 179–185.
Prach, K. & Walker, L.R. (2011) Four opportunities
for studies of ecological succession. Trends in
Ecology & Evolution, 26(3), 119–123.
Purschke, O., Schmid, B.C., Sykes, M.T., Poschlod,
P., Michalski, S.G., Durka, W., Kühn, I., Winter,
M. & Prentice, H.C. (2013) Contrasting changes
in taxonomic, phylogenetic and functional
diversity during a long‐term succession: insights
into assembly processes. Journal of Ecology,
101(4), 857–866.
R Development Core Team (2011) R: A language and
environment for statistical computing. R
Foundation for Statistical Computing, Vienna,
Austria. ISBN 3-900051-07-0, URL http://www.r-
project.org
Rehell, S. & Heikkilä, R. (2009) Aapasoiden nuoret
sukkessiovaiheet Pohjois-Pohjanmaan maankohoamis-
rannikolla (The young succession stages of aapa
mires in the North Ostrobothnian coastal landscape).
Suo, 60, 1–22 (in Finnish).
Reich, P.B. (2014) The world-wide ‘fast–slow’ plant
economics spectrum: a traits manifesto. Journal
of Ecology, 102, 275–301.
Reich, P.B., Wright, I.J., Cavender-Bares, J., Craine,
J.M., Oleksyn, J., Westoby, M. & Walters, M.B.
(2003) The evolution of plant functional variation:
traits, spectra, and strategies. International
Journal of Plant Sciences, 164(S3), S143–S164.
Reiners, W.A., Worley, I.A. & Lawrence, D.B. (1971)
Plant diversity in a chronosequence at Glacier
Bay, Alaska. Ecology, 52, 55–69.
Schierenbeck, K.A., Mack, R. & Sharitz, R.R. (1994)
Effects of herbivory on growth and biomass
allocation in native and introduced species of
Lonicera. Ecology, 75,1661–1672.
Schleicher, A., Peppler-Lisbach, C. & Kleyer, M.
(2011) Functional traits during succession: is
plant community assembly trait-driven? Preslia,
83(3), 347–370.
Schwilk, D.W. & Ackerly, D.D. (2005) Limiting
similarity and functional diversity along
environmental gradients. Ecology Letters, 8, 272–
281.
Shafi, M.I. & Yarranton, G.A. (1973) Diversity,
floristic richness, and species evenness during a
secondary (post-fire) succession. Ecology, 54,
897–902.
Sheil, D. (2001) Long-term observations of rain
forest succession, tree diversity and responses to
disturbance. Plant Ecology, 155(2), 183–199.
Smith, A.J.E. (2004) The Moss Flora of Britain and
Ireland, Second Edition. Cambridge University
Press, 1026 pp.
Soudzilovskaia, N.A., Elumeeva, T.G., Onipchenko,
V.G., Shidakov, I.I., Salpagarova, F.S., Khubiev,
A.B., Tekeev, D.K. & Cornelissen, J.H. (2013)
Functional traits predict relationship between
plant abundance dynamic and long-term climate
warming. Proceedings of the National Academy of
Science of the Unites States of America, 110(45),
18180–18184.
Tahvanainen, T. (2011) Abrupt ombrotrophication of
a boreal aapa mire triggered by hydrological
disturbance in the catchment. Journal of Ecology,
99(2), 404–415.
Tuittila, E.-S., Juutinen, S., Frolking, S., Väliranta,
M., Laine, A., Miettinen, A., Seväkivi, M.-L.,
Quillet, A. & Merilä, P. (2013) Wetland
chronosequence as a model of peatland
development: Vegetation succession, peat and
carbon accumulation. The Holocene, 23, 25–35.
Tuomisto, H. (2012) An updated consumer’s guide to
evenness and related indices. Oikos, 121, 1203–
1218.
Turunen, J., Tomppo, E., Tolonen, K. & Reinikainen,
A. (2002). Estimating carbon accumulation rates
of undrained mires in Finland–application to
boreal and subarctic regions. The Holocene,
12(1), 69–80.
Ulvinen, T., Syrjänen, K. & Anttila, S. (eds.) (2002)
A.M. Laine et al. PLANT DIVERSITY AND FUNCTIONAL TRAITS DURING MIRE DEVELOPMENT
Mires and Peat, Volume 21 (2018), Article 02, 1–19, http://www.mires-and-peat.net/, ISSN 1819-754X
© 2018 International Mire Conservation Group and International Peatland Society, DOI: 10.19189/MaP.2017.OMB.280
14
Suomen sammalet - levinneisyys, ekologia ja
uhanalaisuus (Finnish Mosses - Distribution,
Ecology and Conservation Status). Suomen
ympäristö 560, luonto ja luonnonvarat (Finnish
Environment 560, Nature and Natural Resources),
Suomen Ympäristökeskus (Finnish Environment
Institute), Helsinki, 354 pp. (in Finnish), ISBN
952-11-1152-6.
Väliranta, M., Salojärvi, N., Vuorsalo, A., Juutinen,
S., Korhola, A., Luoto, M. & Tuittila, E.-S. (2017)
Holocene fen–bog transitions, current status in
Finland and future perspectives. The Holocene,
27(5), 752–764.
Van Breemen, N. (1995) How Sphagnum bogs down
other plants. Trends in Ecology & Evolution, 10,
270–275.
Van den Broek, T. & Beltman, B. (2006) Germination
and seedling survival in fens undergoing
succession. Plant Ecology, 185, 221–237.
Van Diggelen. R., Molenaar, W.J. & Kooijman, A.M.
(1996) Vegetation succession in a floating mire in
relation to management and hydrology. Journal of
Vegetation Sciences, 7, 809–820.
Villéger, S., Mason, N.W. & Mouillot, D. (2008) New
multidimensional functional diversity indices for
a multifaceted framework in functional ecology.
Ecology, 89(8), 2290–2301.
Weiher, E. & Keddy, P.A. (1995) The assembly of
experimental wetland plant communities. Oikos,
73, 323–335.
Weiher, E., Freund, D., Bunton, T., Stefanski, A., Lee,
T. & Bentivenga, S. (2011) Advances, challenges
and a developing synthesis of ecological
community assembly theory. Philosophical
Transactions of the Royal Society B: Biological
Sciences, 366(1576), 2403–2413.
Weltzin, J.F., Pastor, J., Harth, C., Bridgham, S.D.,
Updegraft, K. & Chapin, C.T. (2000) Response of
bog and fen plant communities to warming and
water-table manipulations. Ecology, 81, 3478–
3646.
Weltzin, J.F., Bridgham, S.D., Pastor, J., Chen, J. &
Harth, C. (2003). Potential effects of warming and
drying on peatland plant community composition.
Global Change Biology, 9(2), 141–151.
Westoby, M. (1998) A leaf-height-seed (LHS) plant
ecology strategy scheme. Plant and Soil, 199,
213–227.
Wheeler, B.D. (1980) Plant communities of rich-fen
systems in England and Wales. I: Introduction.
Tall sedge and reed communities. Journal of
Ecology, 68, 365–395.
Wu, J. & Roulet, N.T. (2014) Climate change reduces
the capacity of northern peatlands to absorb the
atmospheric carbon dioxide: the different
responses of bogs and fens. Global
Biogeochemical Cycles, 28(10), 1005–1024.
Yu, Z.C. (2012) Northern peatland carbon stocks and
dynamics: a review. Biogeosciences, 9(10), 4071–
4085.
Zak, D.R., Holmes, W.E., White, D.C., Peacock, A.D.
& Tilman, D. (2003) Plant diversity, soil microbial
communities, and ecosystem function: are there
any links? Ecology, 84(8), 2042–2050.
Zelený, D., Li, C.-F. & Chytrý, M. (2010) Pattern of
local plant species richness along a gradient of
landscape topographical heterogeneity: result of
spatial mass effect or environmental shift?
Ecography, 33, 578–589.
Submitted 18 Apr 2017, revision 23 Nov 2017
Editor: Ab Grootjans
_______________________________________________________________________________________
Author for correspondence:
Dr. Anna Maria Laine, Department of Ecology and Genetics, University of Oulu, P.O. Box 3000, FI-90014
Oulun yliopisto, Finland. Tel: +358 400826419; E-mail: [email protected]
A.M. Laine et al. PLANT DIVERSITY AND FUNCTIONAL TRAITS DURING MIRE DEVELOPMENT
Mires and Peat, Volume 21 (2018), Article 02, 1–19, http://www.mires-and-peat.net/, ISSN 1819-754X
© 2018 International Mire Conservation Group and International Peatland Society, DOI: 10.19189/MaP.2017.OMB.280
15
Appendix
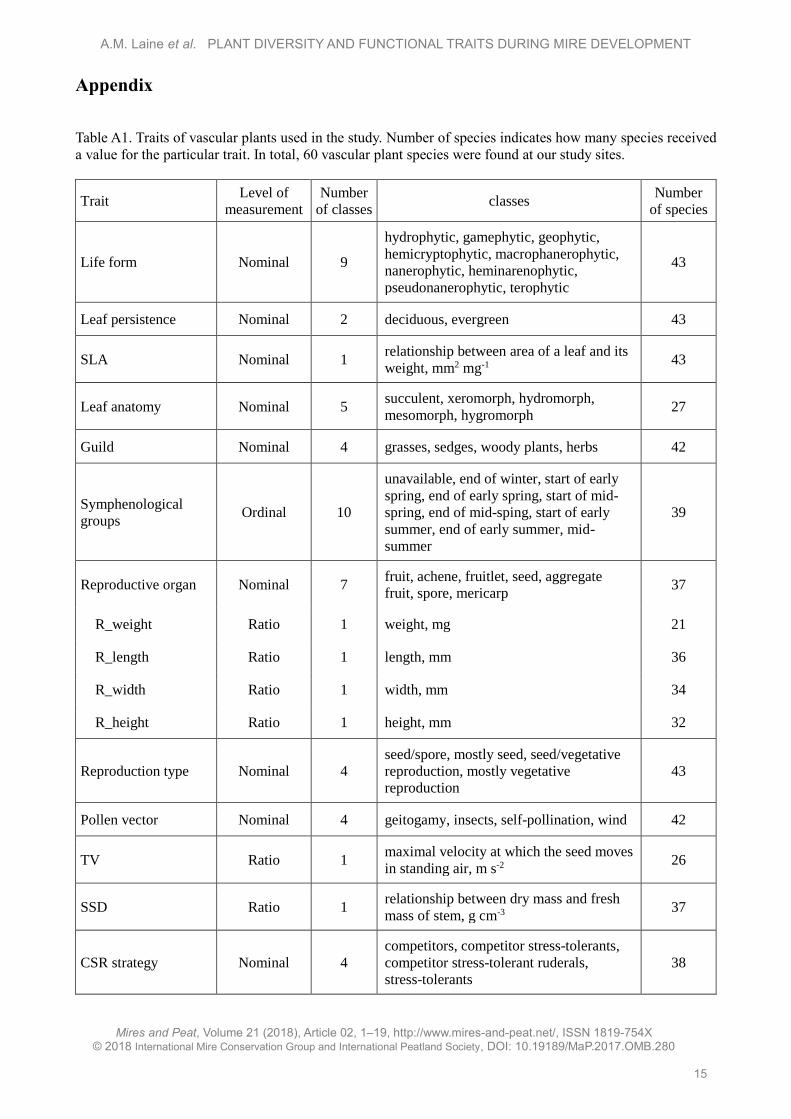
Table A1. Traits of vascular plants used in the study. Number of species indicates how many species received
a value for the particular trait. In total, 60 vascular plant species were found at our study sites.
Trait Level of
measurement
Number
of classes classes
Number
of species
Life form Nominal 9
hydrophytic, gamephytic, geophytic,
hemicryptophytic, macrophanerophytic,
nanerophytic, heminarenophytic,
pseudonanerophytic, terophytic
43
Leaf persistence Nominal 2 deciduous, evergreen 43
SLA Nominal 1 relationship between area of a leaf and its
weight, mm2 mg-1 43
Leaf anatomy Nominal 5 succulent, xeromorph, hydromorph,
mesomorph, hygromorph 27
Guild Nominal 4 grasses, sedges, woody plants, herbs 42
Symphenological
groups Ordinal 10
unavailable, end of winter, start of early
spring, end of early spring, start of mid-
spring, end of mid-sping, start of early
summer, end of early summer, mid-
summer
39
Reproductive organ Nominal 7 fruit, achene, fruitlet, seed, aggregate
fruit, spore, mericarp 37
R_weight Ratio 1 weight, mg 21
R_length Ratio 1 length, mm 36
R_width Ratio 1 width, mm 34
R_height Ratio 1 height, mm 32
Reproduction type Nominal 4
seed/spore, mostly seed, seed/vegetative
reproduction, mostly vegetative
reproduction
43
Pollen vector Nominal 4 geitogamy, insects, self-pollination, wind 42
TV Ratio 1 maximal velocity at which the seed moves
in standing air, m s-2 26
SSD Ratio 1 relationship between dry mass and fresh
mass of stem, g cm-3 37
CSR strategy Nominal 4
competitors, competitor stress-tolerants,
competitor stress-tolerant ruderals,
stress-tolerants
38
A.M. Laine et al. PLANT DIVERSITY AND FUNCTIONAL TRAITS DURING MIRE DEVELOPMENT
Mires and Peat, Volume 21 (2018), Article 02, 1–19, http://www.mires-and-peat.net/, ISSN 1819-754X
© 2018 International Mire Conservation Group and International Peatland Society, DOI: 10.19189/MaP.2017.OMB.280
16
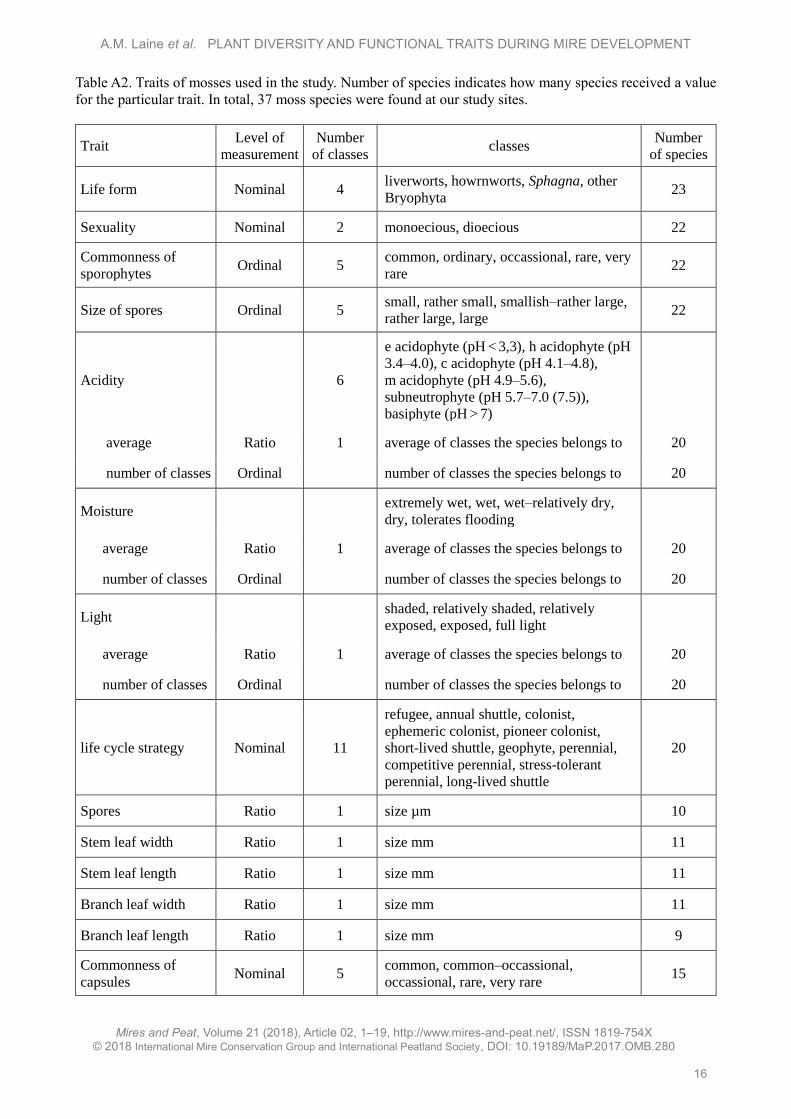
Table A2. Traits of mosses used in the study. Number of species indicates how many species received a value
for the particular trait. In total, 37 moss species were found at our study sites.
Trait Level of
measurement
Number
of classes classes
Number
of species
Life form Nominal 4 liverworts, howrnworts, Sphagna, other
Bryophyta 23
Sexuality Nominal 2 monoecious, dioecious 22
Commonness of
sporophytes Ordinal 5
common, ordinary, occassional, rare, very
rare 22
Size of spores Ordinal 5 small, rather small, smallish–rather large,
rather large, large 22
Acidity 6
e acidophyte (pH < 3,3), h acidophyte (pH
3.4–4.0), c acidophyte (pH 4.1–4.8),
m acidophyte (pH 4.9–5.6),
subneutrophyte (pH 5.7–7.0 (7.5)),
basiphyte (pH > 7)
average Ratio 1 average of classes the species belongs to 20
number of classes Ordinal number of classes the species belongs to 20
Moisture extremely wet, wet, wet–relatively dry,
dry, tolerates flooding
average Ratio 1 average of classes the species belongs to 20
number of classes Ordinal number of classes the species belongs to 20
Light shaded, relatively shaded, relatively
exposed, exposed, full light
average Ratio 1 average of classes the species belongs to 20
number of classes Ordinal number of classes the species belongs to 20
life cycle strategy Nominal 11
refugee, annual shuttle, colonist,
ephemeric colonist, pioneer colonist,
short-lived shuttle, geophyte, perennial,
competitive perennial, stress-tolerant
perennial, long-lived shuttle
20
Spores Ratio 1 size µm 10
Stem leaf width Ratio 1 size mm 11
Stem leaf length Ratio 1 size mm 11
Branch leaf width Ratio 1 size mm 11
Branch leaf length Ratio 1 size mm 9
Commonness of
capsules Nominal 5
common, common–occassional,
occassional, rare, very rare 15
A.M. Laine et al. PLANT DIVERSITY AND FUNCTIONAL TRAITS DURING MIRE DEVELOPMENT
Mires and Peat, Volume 21 (2018), Article 02, 1–19, http://www.mires-and-peat.net/, ISSN 1819-754X
© 2018 International Mire Conservation Group and International Peatland Society, DOI: 10.19189/MaP.2017.OMB.280
17
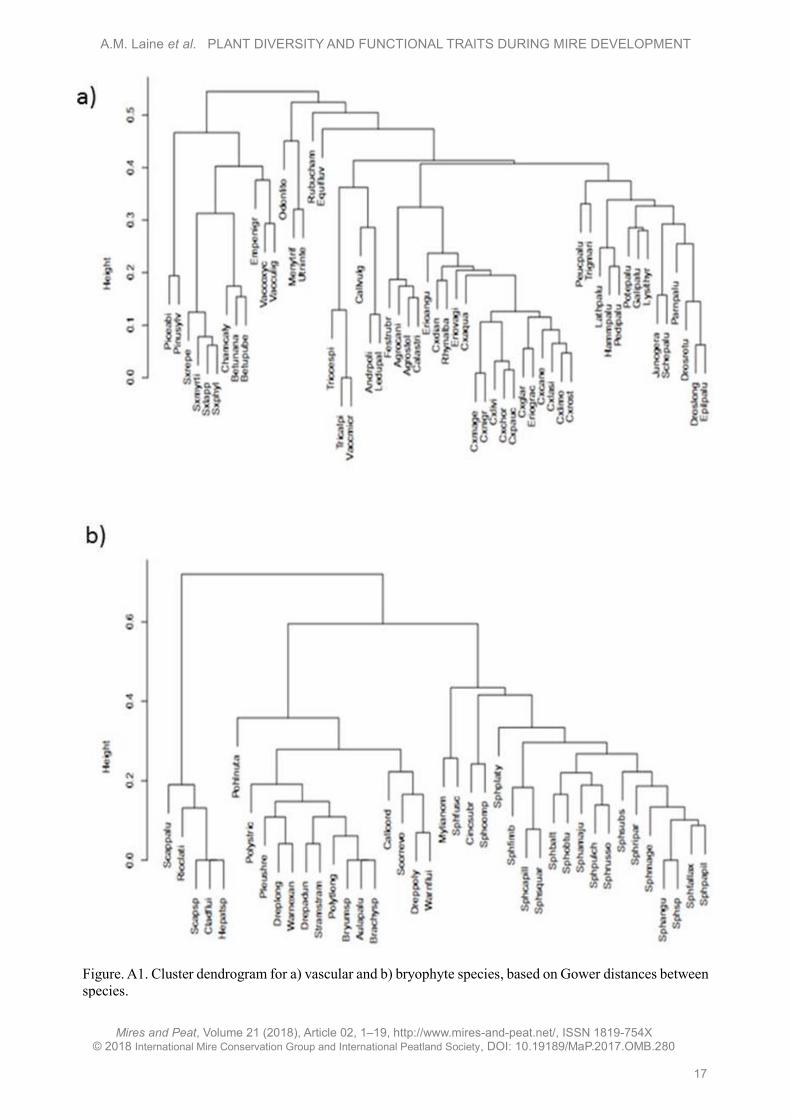
Figure. A1. Cluster dendrogram for a) vascular and b) bryophyte species, based on Gower distances between
species.
A.M. Laine et al. PLANT DIVERSITY AND FUNCTIONAL TRAITS DURING MIRE DEVELOPMENT
Mires and Peat, Volume 21 (2018), Article 02, 1–19, http://www.mires-and-peat.net/, ISSN 1819-754X
© 2018 International Mire Conservation Group and International Peatland Society, DOI: 10.19189/MaP.2017.OMB.280
18
Figure A2. Development of community weighted mean values (± SE) for reproduction-related traits during
mire succession. For vascular plants: a) terminal velocity of seeds (TV, m s-2) and reproductive type (from
seeds (1) to mostly vegetative (4)); b) germinula height (mm) and germinula length (mm). For mosses:
c) spore size (µm). The different letters indicate Tukey post hoc test results; successional steps that do not
share a common letter differ from each other with p < 0.05. SJ 0 and SJ 6 were not included in the tests
because they did not have replicate sites.

A.M. Laine et al. PLANT DIVERSITY AND FUNCTIONAL TRAITS DURING MIRE DEVELOPMENT
Mires and Peat, Volume 21 (2018), Article 02, 1–19, http://www.mires-and-peat.net/, ISSN 1819-754X
© 2018 International Mire Conservation Group and International Peatland Society, DOI: 10.19189/MaP.2017.OMB.280
19
Figure A3. Development of vascular plant, moss and Sphagnum cover (± SD) during mire succession.