Planning & Scheduling Excellence Guide (PASEG) and Examples...Planning & Scheduling Excellence Guide...
212
Planning & Scheduling Excellence Guide (PASEG) Published Release v2.0 6/22/2012 National Defense Industrial Association (NDIA) Procurement Division - Program Management Systems Committee (PMSC)
Transcript of Planning & Scheduling Excellence Guide (PASEG) and Examples...Planning & Scheduling Excellence Guide...
Planning & Scheduling Excellence Guide (PASEG) Published Release v2.0 6/22/2012 National Defense Industrial Association (NDIA) Procurement Division - Program Management Systems Committee (PMSC)

Planning & Scheduling Excellence Guide (PASEG) – Copyright
Page 2 of 212
PASEG Copyright Statement
© NDIA PMSC Planning and Scheduling Excellence Guide June 2012 Edition. This document may be reproduced and distributed, whether subsequently modified by other recipients or not, provided that this copyright notice is included in its entirety, the names of the original authors are identified to the recipient, and information on where to find the original document is provided to the recipient. Portions of these materials [may] contain works of, or materials provided by, the Department of Defense. Works of the US Government are not subject to copyright protection or restrictions under US copyright law. Any Department of Defense contribution to these materials does not constitute an endorsement of [NDIA], its products, activities, or services, or of any information contained herein. Please contact the current director of the NDIA Procurement Division with any questions pertaining to the redistribution of this document.
Planning & Scheduling Excellence Guide (PASEG) – Revision Log
Page 3 of 212
PASEG Revision Log
Version 1.0 (11/5/2010) – Released for PPSS Member Content Review
Version 1.1 (2/11/2011) – General Communications Release
Version 1.1a (2/24/2011) – Minor administrative changes to v1.1 Version 1.1b (4/6/2011) – Public Release for review and comment Version 2.0 (6/22/2012) – Public Release – following 1 year public review period. (PASEG ownership transferred now to NDIA PMSC)

Planning & Scheduling Excellence Guide (PASEG) – Table of Contents
Page 4 of 212
1.0 - PLANNING & SCHEDULING EXCELLENCE GUIDE (PASEG) PURPOSE & SCOPE .................................7
2.0 - GENERALLY ACCEPTED SCHEDULING PRINCIPLES (GASP) ............................................................ 10
3.0 - LEADERSHIP, BUY-IN, & COMMITMENT ..................................................................................... 15
3.1 - MANAGING USING AN IMS ....................................................................................................... 16
3.2 - THE IMS IS A TOOL, NOT JUST A REPORT ................................................................................... 21
3.3 - INTEGRATION OF MANAGEMENT TOOLS ................................................................................... 24
3.4 - ROLES AND RESPONSIBILITIES OF PROGRAM PERSONNEL .......................................................... 27
4.0 - SCHEDULE ARCHITECTURE ........................................................................................................ 31
4.1 - IMS ARCHITECTURE .................................................................................................................. 32
4.2 - INTEGRATED MASTER PLAN (IMP) ............................................................................................. 35
4.3 - SCHEDULE HIERARCHY .............................................................................................................. 42
4.4 - BASELINE VS. FORECAST SCHEDULES ......................................................................................... 45
4.5 - TOP DOWN VS. BOTTOM UP PLANNING .................................................................................... 47
5.0 - SCHEDULE MODELING TECHNIQUES .......................................................................................... 49
5.1 - TASK NAMING CONVENTION .................................................................................................... 50
5.2 - TASK DURATION ....................................................................................................................... 52
5.3 - RELATIONSHIPS / LOGIC............................................................................................................ 54
5.4 - LEAD / LAG TIME ...................................................................................................................... 56
5.5 - TASK CONSTRAINTS .................................................................................................................. 59
5.6 - MILESTONES ............................................................................................................................. 61
5.7 - SUMMARIES & HAMMOCKS ..................................................................................................... 64
5.8 - LEVEL OF EFFORT (LOE) ............................................................................................................. 66
5.9 - APPORTIONED EFFORT ............................................................................................................. 68
5.10 - WORKING CALENDARS............................................................................................................ 70
5.11 - SCHEDULE CALCULATION ALGORITHM .................................................................................... 73
5.12 - SCHEDULE MARGIN ................................................................................................................ 75
6.0 - COST & SCHEDULE RESOURCE INTEGRATION ............................................................................. 76
6.1 - INTRO TO COST/SCHEDULE RESOURCE INTEGRATION ................................................................ 77
6.2 - RESOURCES IN THE SCHEDULE .................................................................................................. 78
6.3 - RESOURCES NOT IN THE SCHEDULE ........................................................................................... 83
7.0 - EXTERNAL SCHEDULE INTEGRATION .......................................................................................... 85
7.1 - SUBPROJECT/EXTERNAL SCHEDULE INTEGRATION ..................................................................... 86
7.2 - INTERFACE HANDOFF MILESTONES ........................................................................................... 89
7.3 - SCHEDULE VISIBILITY TASKS (SVT) ............................................................................................. 91
8.0 - HORIZONTAL & VERTICAL TRACEABILITY ................................................................................... 93
8.1 - HORIZONTAL TRACEABILITY ...................................................................................................... 94
8.2 - VERTICAL INTEGRATION & TRACEABILITY .................................................................................. 98
Planning & Scheduling Excellence Guide (PASEG) – Table of Contents
Page 5 of 212
8.3 - TASK CODING ......................................................................................................................... 102
9.0 - SCHEDULE MAINTENANCE ...................................................................................................... 105
9.1 - STATUSING ............................................................................................................................. 106
9.1.1 - STATUSING TO TIMENOW .................................................................................................... 107
9.1.2 - FORECASTING ...................................................................................................................... 110
9.1.3 - SCHEDULE ACCELERATION TECHNIQUES ............................................................................... 113
9.1.4 - ESTIMATE AT COMPLETION .................................................................................................. 118
9.2 - BASELINE MAINTENANCE ....................................................................................................... 121
9.2.1 - BASELINE CHANGE MANAGEMENT ....................................................................................... 122
9.2.2 - ROLLING WAVE PLANNING .................................................................................................. 125
10.0 - SCHEDULE ANALYSIS ............................................................................................................. 129
10.1 - CRITICAL & DRIVING PATH ANALYSIS .................................................................................... 130
10.2 - SCHEDULE HEALTH ASSESSMENT ........................................................................................... 134
10.3 - RISK & OPPORTUNITY ........................................................................................................... 140
10.3.1 - INCORPORATION OF RISKS & OPPORTUNITIES .................................................................... 141
10.3.2 - SCHEDULE RISK ASSESSMENT (SRA) – SETUP & EXECUTION ................................................. 147
10.3.3 - SCHEDULE RISK ASSESSMENT (SRA) – ANALYSIS.................................................................. 152
10.4 - SCHEDULE EXECUTION METRICS ............................................................................................ 156
10.4.1 - INTRO TO SCHEDULE EXECUTION METRICS ......................................................................... 157
10.4.2 - CRITICAL PATH LENGTH INDEX (CPLI) .................................................................................. 158
10.4.3 - SCHEDULE PERFORMANCE INDEX (SPI) ............................................................................... 161
10.4.4 - BASELINE EXECUTION INDEX (BEI) ...................................................................................... 163
10.4.5 - CURRENT EXECUTION INDEX (CEI) ...................................................................................... 166
10.4.6 - TOTAL FLOAT CONSUMPTION INDEX (TFCI) ........................................................................ 168
10.4.7 - DURATION-BASED VS. SCOPE-BASED PERCENT COMPLETE .................................................. 170
10.4.8 - SCHEDULE RATE CHART ...................................................................................................... 172
11.0 - BUSINESS RHYTHM & SUBMITTAL ......................................................................................... 174
11.1 - IMS SUPPLEMENTAL GUIDANCE ............................................................................................ 175
11.2 - DESKTOP PROCEDURES ......................................................................................................... 178
11.3 - SUBMITTAL OF IMS DATA ..................................................................................................... 180
11.4 - BUSINESS RHYTHM ............................................................................................................... 184
11.5 - PROGRAM SCHEDULE REVIEWS............................................................................................. 188
12.0 – TRAINING ............................................................................................................................ 191
12.1 - LEADERSHIP TRAINING ......................................................................................................... 192
12.2 - PLANNER/SCHEDULER SKILLS & TRAINING ............................................................................ 194
13.0 - PROGRAM & CONTRACT PHASE CONSIDERATIONS ................................................................ 197
13.1 - PROPOSAL IMS CONSIDERATIONS ......................................................................................... 198

Planning & Scheduling Excellence Guide (PASEG) – Table of Contents
Page 6 of 212
13.2 - SCHEDULING IN A PRODUCTION ENVIRONMENT ................................................................... 199
APPENDIX A - TERMS & DEFINITIONS .............................................................................................. 205
APPENDIX B - REFERENCES ............................................................................................................. 208
APPENDIX C - PASEG TO GASP ROADMAP / MATRIX ....................................................................... 209
APPENDIX D - CREDITS & ACKNOWLEDGEMENTS ............................................................................ 211
Planning & Scheduling Excellence Guide (PASEG) – Purpose & Scope
Page 7 of 212
1.0 - Planning & Scheduling Excellence Guide (PASEG) Purpose & Scope
Description
This guide provides the program management team, including new and experienced master planner/schedulers, with practical approaches for building, using, and maintaining an Integrated Master Schedule (IMS). It also identifies knowledge, awareness, and processes that enable the user to achieve reasonable consistency and a standardized approach to project planning, scheduling and analysis.
Sound schedules merge cost and technical data to influence program management decisions and actions. Realistic schedules help stakeholders make key go-ahead decisions, track and assess past performance, and predict future performance and costs. Industry and Government agree that improving IMS integrity has a multiplier effect on improved program management. Program teams can benefit from this guide to gain a common understanding of key scheduling terms, concepts, and practices. The guide also provides practical tips and caveats for scheduling techniques that apply for any scheduling software tool or environment. Using this guide, the program team can build and maintain more robust and dynamic schedules that provide a roadmap for improved program execution.
By capturing the extensive knowledge of experienced Government and Industry professionals, this guide provides how-to direction or instruction. This document aims to translate earned value or scheduling policy and guidance into practical approaches for improving scheduling capabilities and outputs across Government and Industry. Though written primarily for the DOD/Intel community, this guide provides scheduling practices or techniques that apply to any industry. Still, the primary focus is on scheduling for large programs with high technical, schedule, and cost risks. These programs stand to gain the most return on investment when all stakeholders dedicate the proper skills, resources, and time to developing and maintaining excellent schedules that pay high dividends for all parties.
Caveat throughout the Guide: The Microsoft Project screenshots are for demonstration purposes only and don’t advocate the use of one tool over another.
Layout
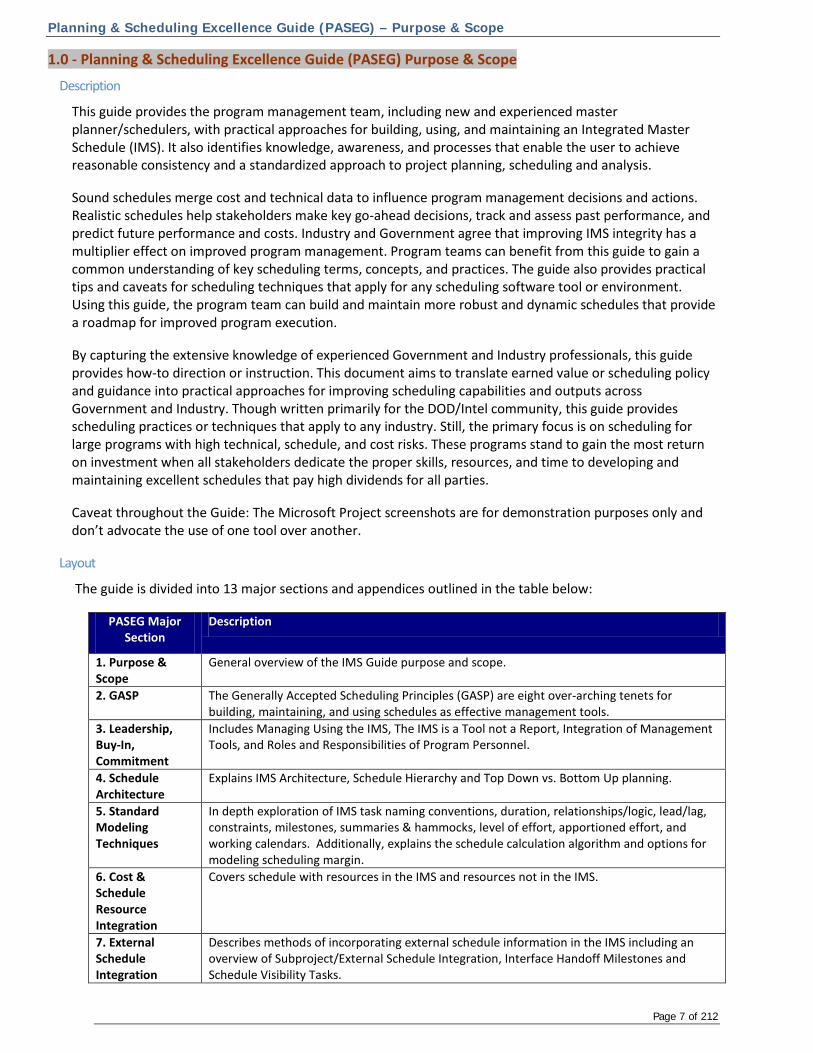
The guide is divided into 13 major sections and appendices outlined in the table below:
PASEG Major Section
Description
1. Purpose & Scope
General overview of the IMS Guide purpose and scope.
2. GASP The Generally Accepted Scheduling Principles (GASP) are eight over-arching tenets for building, maintaining, and using schedules as effective management tools.
3. Leadership, Buy-In, Commitment
Includes Managing Using the IMS, The IMS is a Tool not a Report, Integration of Management Tools, and Roles and Responsibilities of Program Personnel.
4. Schedule Architecture
Explains IMS Architecture, Schedule Hierarchy and Top Down vs. Bottom Up planning.
5. Standard Modeling Techniques
In depth exploration of IMS task naming conventions, duration, relationships/logic, lead/lag, constraints, milestones, summaries & hammocks, level of effort, apportioned effort, and working calendars. Additionally, explains the schedule calculation algorithm and options for modeling scheduling margin.
6. Cost & Schedule Resource Integration
Covers schedule with resources in the IMS and resources not in the IMS.
7. External Schedule Integration
Describes methods of incorporating external schedule information in the IMS including an overview of Subproject/External Schedule Integration, Interface Handoff Milestones and Schedule Visibility Tasks.

Planning & Scheduling Excellence Guide (PASEG) – Purpose & Scope
Page 8 of 212
PASEG Major Section
Description
8. Horizontal & Vertical Traceability
Defines and provides methods of maintaining vertical and horizontal traceability and an overview of task coding.
9. Schedule Maintenance
Discusses status updates, including status updating to Timenow, forecasting, and estimates at complete (EAC). Covers baseline maintenance, including the baseline change management process and the rolling wave process.
10. Schedule Analysis
Covers schedule health assessments, Critical & Driving path analysis, Schedule Risk Assessment (SRA) Set-Up & Execution, SRA Analysis, and incorporating Risk & Opportunities in the IMS. Addresses schedule execution metrics, including Critical Path Length Index (CPLI), Baseline Execution Index (BEI), Schedule Performance Index (SPI), Duration Based vs. Scope Based % Complete, Schedule Rate Chart, and Current Execution Index (CEI).
11. Business Rhythm & Submittal
Includes IMS related documentation recommendations in IMS Supplemental Guidance and Desktop Procedures in addition to considerations for Program Schedule Reviews, IMS Submittal, and the IMS related program Business Rhythm.
12. Training Covers recommended content for IMS related leadership and planner/schedule skills and training.
13. Program & Contract Phase Considerations
Describes various IMS attributes by program / contract phase (e.g. Technology Demonstration and Engineering, Manufacturing Development) and an in-depth explanation of Scheduling in a Production Environment.
Appendices Includes the following four appendices: Terms & Definitions, References, GASP to PASEG Roadmap, & Credits & Acknowledgements
Fig. 1-1
Each section listed in the Table of Contents contains more detailed chapter, each with a standard format described below.
With few exceptions, each chapter in this guide contains eight headings to enhance ease of use, navigation, and readability. Depending on the reader’s role or purpose when using the guide, the Chapter headings will help focus the reader on key points, tips, options, pros and cons, and references to other sections or chapters in this guide. The next table summarizes these chapter headings and when and how to use them.
PASEG Chapter Heading When & How to Use It
Manager’s View Executives, program managers, & others can quickly find why this topic matters to managers. Describes how the concept or approach might impact IMS validity, decision-making capability, or other management values.
Description More detailed description or discussion on the topic. Scheduling professionals, analysts, or the program team can find details—sometimes quite technical—on how & when to use this approach.
Example As applicable, includes screenshots, tables, charts, or other depictions to clarify or enhance the discussion or to illustrate the technique or approach.
Calculations When the topic impacts how scheduling tools calculate or process data, this section describes the key points. This is particularly important for scheduling professionals who seek to understand how & why certain techniques or functions might impact total float, durations, critical path, or impacts from other scheduling tool calculations.
Optional Techniques Where appropriate, describes one or more alternative approaches that a program team might use, considering degree of difficulty, risk, & caveats.
Things to Promote Whenever possible, this section will highlight processes or steps to follow to promote improved scheduling processes, information, or usefulness.
Things to Avoid If applicable, lists techniques or processes to avoid, minimize, or mitigate, expressing the caveats, warnings, or potential pitfalls.
Related Topics As applicable, lists the top three (sometimes more) related major sections or topics within this guide.
Fig. 1-2

Planning & Scheduling Excellence Guide (PASEG) – Purpose & Scope
Page 9 of 212
PPSS PASEG Background
The Program Planning and Scheduling Subcommittee (PPSS) was chartered by the Industrial Council for Program Management (ICPM) to develop and institute standardized scheduling processes across Industry and Government. The ICPM is a working group within the National Defense Industrial Association (NDIA).
This outline was drafted with advice and input from various planning and scheduling subject matter experts (SMEs) within Government and Industry. The starting point for this draft was a June 2009 draft of the NDIA Scheduling Intent Guide Table of Contents. It was drafted with the intent of providing sound practices around the construction, maintenance, and analysis of Integrated Master Schedules and as a supplemental guide to the DOD Integrated Master Plan and Integrated Master Schedule Preparation and Use Guide (v 0.9 Oct 21, 2005). The PASEG is subordinate to the requirements defined in the ANSI/EIA-748 Guidelines, the EVMS Implementation Guide (EVMIG), the DI-MGMT-81650 (IMS DID), the Integrated Program Management Report (IPMR) DID, your company’s approved System Description, and the contract’s IMS CDRL when the EVM clause is applied to DOD contracts.
Recommendations for Use
Use this guide as a reference. In the scheduling arena, each organization or program might assess a topic and make minor adjustments to the approach with the primary aim of generating useful IMS data that helps to better inform management to aid in making decisions and taking actions. Try different approaches when the likely result is better, timelier, or more accurate management information. Share the approach for subsequent versions of this document. Use the Generally Accepted Scheduling Principles, GASP, to arbitrate contentious techniques. The guide is only useful if used with positive intent to produce improved schedules. Organizations and program teams must exercise judgment and follow practices that make sense for their programs and that result in improved program management information and decision-making that are in alignment with their company approved System Description or management procedures (as applicable).
Approaches should only be implemented if they are sustainable, given the organization or program complexity or the program team skills, experience, and capabilities. Use techniques that are realistic for the program team to implement and maintain while minimizing management process risks.
Since this guide should only be used as a reference, it is recommended that each program develops an IMS Supplemental Guidance that clarifies and specifies the uniqueness of the program approach (architecture, ground rules and assumptions, specific methodologies used for generating or analyzing the critical path, the business rhythm for updating the IMS, data dictionary, nomenclature, etc.). Refer to the IMS Supplemental Guidance chapter in the PASEG for additional details.
In particular, the sections in the Guide titled “Things to Promote” and “Things to Avoid” are recommended actions intended to promote better planning practices and improve planning products and uses.
Avoid rejecting approaches simply because they are new, “not-invented here.” Consider that this guide was written by many authors who have a stake in improving scheduling capabilities and competencies, as well as program technical, cost, and schedule performance. If a technique truly seems incorrect or unsound, provide adequate feedback to enable improving the topic write-up in a subsequent version of the guide.
Recommendations for changes to the Guide should be directed to the NDIA Point of Contact (POC) listed at the beginning of this Guide.

Generally Accepted Scheduling Principles (GASP)
Page 10 of 212
2.0 - Generally Accepted Scheduling Principles (GASP)
Description
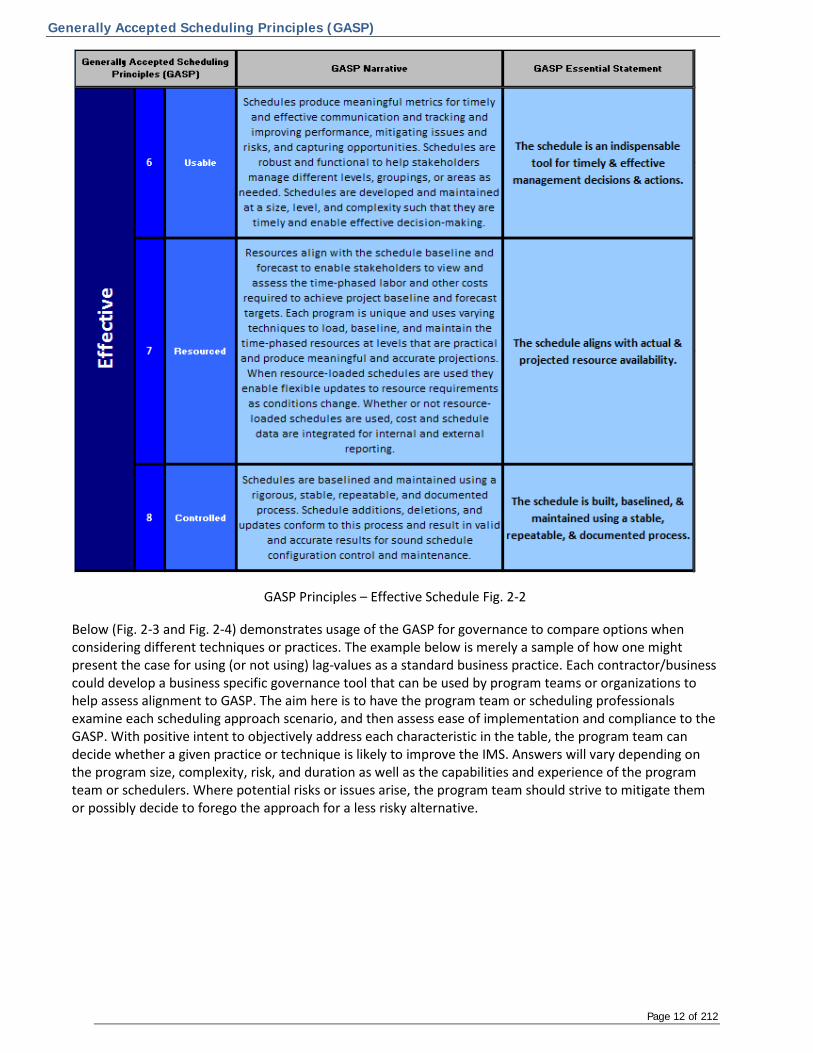
The Generally Accepted Scheduling Principles (GASP) are eight over-arching tenets for building, maintaining, and using schedules as effective management tools. The GASP is concise and easily understood, yet set high expectations for program management teams to develop and use schedules. The first five GASP tenets describe the requisite qualities of a valid schedule; that is, one that provides complete, reasonable, and credible information based on realistic logic, durations, and dates. The latter three GASP tenets reflect increased scheduling maturity that yields an effective schedule. An effective schedule provides timely and reliable data, aligns time-phased resources, and is built and maintained using controlled and repeatable processes.
The GASP serves several purposes. First, they are high level tenets, or targets, for sound scheduling. The GASP also serves as a validation tool for the program team or organization to assess IMS maturity or IMS areas needing improvement. Lastly, the GASP can be used as a governance tool to assess new or different scheduling approaches with objectivity and detachment.
Achieving a GASP-compliant IMS indicates the IMS is not merely healthy, but fit. A healthy IMS is functional and meets minimum management purposes, but a fit IMS is robust and dynamic. A fit IMS provides the program team with a program execution roadmap of meaningful progress and realistic forecasts against a resource-loaded performance measurement baseline. Thus, meeting all eight GASP tenets demonstrates that the program team builds and maintains the IMS with rigor and discipline so that the IMS remains a meaningful management tool from program start through completion.

Generally Accepted Scheduling Principles (GASP)
Page 11 of 212
The following tables show the eight Generally Accepted Scheduling Principles, including an “essential statement” and a more detailed narrative.
GASP Principles – Valid Schedule Fig. 2-1
Generally Accepted Scheduling Principles (GASP)
Page 12 of 212
GASP Principles – Effective Schedule Fig. 2-2
Below (Fig. 2-3 and Fig. 2-4) demonstrates usage of the GASP for governance to compare options when considering different techniques or practices. The example below is merely a sample of how one might present the case for using (or not using) lag-values as a standard business practice. Each contractor/business could develop a business specific governance tool that can be used by program teams or organizations to help assess alignment to GASP. The aim here is to have the program team or scheduling professionals examine each scheduling approach scenario, and then assess ease of implementation and compliance to the GASP. With positive intent to objectively address each characteristic in the table, the program team can decide whether a given practice or technique is likely to improve the IMS. Answers will vary depending on the program size, complexity, risk, and duration as well as the capabilities and experience of the program team or schedulers. Where potential risks or issues arise, the program team should strive to mitigate them or possibly decide to forego the approach for a less risky alternative.

Generally Accepted Scheduling Principles (GASP)
Page 13 of 212
Note: the following tables (from the same tool model) should be considered representative examples only.
Fig 2-3. Example of Planning Method to GASP Governance Model - Compliance
Fig 2-4. Example of Planning Method to GASP Governance Model – Ease of Implementation
Generally Accepted Scheduling Principles (GASP)
Page 14 of 212
GASP Background
The GASP was originally developed as a governance mechanism for the Program Planning and Scheduling Subcommittee (PPSS). The PPSS is a subcommittee formed by the Industrial Committee on Program Management (ICPM) working group under the auspices of the National Defense Industrial Association (NDIA). The GASP was developed collaboratively with inputs from both Government and Industry.
Recommendations for Use
Use the GASP as a governance tool when evaluating new scheduling processes, techniques, or tools. By assessing whether a new approach meets the GASP, the program team can readily arrive at a reasonable solution that minimizes any management process or other risks to producing valid and effective schedules. The GASP may also be used as a framework for training courses, for developing and using schedule information, for schedule reporting and analysis, and for writing program supplemental guidance.
It is essential to understand that the GASP is intentionally broad. The GASP set high expectations for excellent scheduling, yet does not specify particular methodologies. Avoid viewing the GASP as dogma; instead, continually strive to meet or exceed the GASP with creative and practical approaches that work for the size, value, risk, and complexity of the program and the skills and capabilities of the program team. New practices or techniques are encouraged—if and when they meet the GASP. There will be times when a given practice diminishes compliance to one principle over another. This is expected and unavoidable, but what is paramount is that the program team weighs the benefits over the risks. When a practice negatively impacts a GASP tenet, the program team should take necessary steps to mitigate any management process risks that might diminish compliance with the GASP.
Program teams and organizations in both government and industry should remain flexible (within contractual requirements) and focused on placing improved management information above dogma or rigid application of the GASP or any other scheduling “standards” or “industry best practices”.

Leadership, Buy-in, & Commitment
Page 15 of 212
3.0 - Leadership, Buy-in, & Commitment
This section contains the following chapters…
3.1 - Managing Using the IMS
3.2 - The IMS Is a Tool, not Just a Report
3.3 - Integration of Management Tools
3.4 - Roles and Responsibilities of Program Personnel
Managing Using an IMS
Page 16 of 212
3.1 - Managing Using an IMS
Manager’s View
The primary purpose of any Integrated Master Schedule (IMS) is to help the Program Manager and the Program Team optimize the overall execution strategy of a program, coordinate workflows, and assist in the decision making processes to mitigate risks and resolve challenges on a day-to-day basis. As the IMS represents a predictive model of the entire program, it should be considered the focal point in the program management strategy. Program managers should recognize scheduling is a modeling process that helps communicate and coordinate ideas about what, when, and how things might occur in the future. The bottom line is… using an IMS will not guarantee success but operating without an effective schedule will increase the risk of missing program cost, schedule, and technical objectives.
Description
The IMS integrates cost, schedule, and technical performance into an interactive tool. Prior to the creation of the IMS, the Program Leadership team defines the management approach based on the program business culture, customer requirements, and the entire stakeholder community. The team will create processes and methods designed to influence behaviors necessary for successful program management. The IMS is a representation of how the program leadership team expects to execute a program plan. The essential element in developing a useful schedule is engaging the program team throughout the development process. The IMS should always reflect reality and be owned by the entire program team if it is going to be effective. A well constructed IMS reflects all of the contractual scope, is time phased, accounts for all required resources, and is based on sound engineering processes. It is important to document and reiterate schedule and technical assumptions with the entire program team. Typically this is done via a program kickoff meeting, an initial program review, subcontractor kickoff, or other similar programmatic events. This allows stakeholders to understand the IMS and its construction, aligning the entire program team with management approaches and measurements of success. Once input is received from the Control Account Managers (CAMs) as to how their effort is represented in sequence and logically tied to effort outside of their efforts, the planner/scheduler calculates the schedule to determine if the original program goals remain achievable. If not achievable, the team determines the valid and executable changes necessary to meet goals. Changes can be any combination of the following: extending the period of performance, re-sequencing effort, changing a task calendar to allow more work hours per day or more work periods per week, applying additional resources to effectively shorten task durations, or possibly recommending scope removal. After constructing an executable IMS that meets the goals and expectations of the team and stakeholders, the team captures the IMS for performance measurement purposes by establishing the baseline. During the execution phase of a program, frequent IMS updates and robust Quality Control (QC) processes are fundamental to a schedule’s ability to accurately model the path forward. QC is a vitally important process as schedule output values are relied upon to coordinate efforts, communicate priorities, influence decisions, and develop risk mitigation plans. QC is challenging and should be performed by a team acutely familiar with the program direction and program contract requirements (refer to the Forecasting chapter in this guide for more details on schedule QC). Review of schedule status inputs and subsequent schedule impacts is required by stakeholders at the lowest level of the organization. This provides status and impact validation prior to reporting schedule performance analysis up through the management chain. As the schedule is reviewed by each level of management they should be given an opportunity to validate the results of the current schedule status. Senior management should ensure the schedule is consistent with efforts central to program direction and

Managing Using an IMS
Page 17 of 212
focus. The key for schedule quality control is aggressive program leadership that will drive the ownership, accountability, and discipline required to accurately model the road ahead. It is vitally important that every activity in the schedule have correct logic, duration and resources. It’s an unfortunate truth that it only takes one missing logic tie to change what was once thought to be the program direction. This is why it is so important that there is ownership and accountability for schedule data.
Example
Desirable Programmatic Conditions & Attributing Behaviors Condition Behavior Robust schedule management process
The schedule management process is documented and fully understood by all stakeholders. Any modification required to the schedule is clearly outlined in the program procedures. Managed changes can include; Baseline, Task Descriptions, Key Milestone Dates, Handoffs, Deliverables, Logic, Duration, and Resources. Freeze periods should be understood and followed. The IMS is used to as a basis for management and programmatic decisions.
Skilled planner/scheduler staff The staff understands all aspects of schedule management and works with integrity and discipline in the development, management, and reporting of the schedule. They are proactive, motivated, and forward thinking in the anticipation of schedule issues that may potentially affect performance. Planner/Schedulers should be highly skilled and highly trained professionals with a sound working knowledge of engineering processes and the program life cycle. Planning/Scheduling IS NOT an administrative function.
Strong program office support and discipline
Program office fully supports the development and management of the schedule. It manages with the schedule, enforcing compliance and honesty in status and reporting. There is a collaborative management environment between the contractor and customer.
Ownership and accountability of schedule by all stakeholders
Stakeholders assume ownership of the IMS. The stakeholders understand their role and the importance of the schedule as it relates program performance.
Documented information flow into and out of the schedule
Data used to status and report the schedule is well understood through program documentation. Subcontractor integration, manufacturing roll-ups, Government Furnished Equipment (GFE) are documented and easily identified within the schedule Reporting of key dates, facility availability, contractual deliverables to various Functional areas, management, and customers are documented and identifiable in the schedule.
Understanding of schedule construction and terminology
All stakeholders have a clear understanding of schedule terms and architecture enabling effective communication of schedule goals and actions.
Well communicated goals in the form of key events/milestones
Events/Key Milestones are clearly communicated and visible to all stakeholders. They understand their role in the accomplishment of the program goals. Progress to these goals are measured and communicated as part of the regular report cycle.
Establish achievable plans and target dates
The IMS should reflect an achievable plan as denoted by baseline durations and dates. Additionally, the schedule should reflect realistic and accurate forecast dates, substantiated positive total float (work truly can be delayed without impacting goals), and substantiated negative total float (assumes this can be mitigated or else new target dates should be set).
Meaningful performance measurements
Metrics are geared to influence positive behaviors while identifying performance issues early. What is measured and managed strongly influences team direction and activity. Schedule variances are treated as opportunities for improvement instead of reasons for punishment.
Honesty and integrity in reporting by performers
Performers are empowered to status and report true progress and forecast to the schedule. Honesty in reporting is encouraged by program management allowing for

Managing Using an IMS
Page 18 of 212
accurate analysis of schedule issues.
Desirable Programmatic Conditions & Attributing Behaviors (cont) Condition Behavior Network forecast scheduling The schedule is based on network logic, durations, constraints, and working
calendars. A properly networked and statused schedule will quickly and accurately identify schedule problems and support accurate Estimate to Complete analysis.
Desirable Programmatic Conditions & Attributing Behaviors Fig. 3-1
Undesirable Programmatic Conditions & Attributing Behaviors Condition Behavior Lack of stakeholder involvement Stakeholders underestimate the importance of the schedule or
misunderstand their role as a participant. Poor communication between relevant parties
Stakeholders/performers fail to communicate effectively. Schedule Integrity is jeopardized as roles and the accomplishment of team-based schedule goals are not fully understood. Schedule performance and forecasting of potential problems may be compromised as a result.
Lack of management involvement driving accountability and ownership
Management fails to see the need for a schedule. Lack of support encourages performers to defer or ignore requests to plan and to maintain the schedule. Schedule becomes ineffective as a program management tool.
Unclear statement of requirements Work lacks a documented definition. Delays in execution will result until requirements are fully documented and communicated.
Poor quality control Sloppy planning, maintenance, or status of the schedule. A poorly constructed or maintained schedule provides inaccurate schedule data, crippling analysis and decision making by senior management.
Manipulation of schedule data to support political ends
Schedule dates dictated by management resulting in the schedule being used as a reporting tool only, lacking ability to forecast or anticipate problems.
Lack of experienced planner/scheduler support
Schedules are developed, statused, and reported by inexperienced staff. Proper schedule methods are not utilized. The schedule could become compromised by mechanical errors in network development, misuse of constraints, or lack of consistent and accurate status.
Lack of subcontractor integration Vendor/Supplier schedules are not integrated effectively into IMS. Lack relevant detail or integration results in an incomplete program picture and invalid schedule analysis.
Schedule built for reporting and not management
The schedule contains key dates but lacks a network model that represents planning assumptions by performers and provides no value in managing the program. Forecasting based on performance as well as critical path analysis is not possible.
Maintaining unachievable target dates
Maintaining target dates that are not achievable due to amount of remaining work to accomplish in remaining time left or targets that are now earlier than Timenow. This condition produces meaningless negative total float values that obscure management’s ability to prioritize work and hinder effective program management.
Undesirable Programmatic Conditions & Attributing Behaviors Fig. 3-2
Managing Using an IMS
Page 19 of 212
Optional Techniques
Refer to the “unconstrained CPM” method explained in the Critical & Driving Path Analysis chapter.
Things to Promote
The understanding that Time = Money and effective schedule management saves time.
Even though “critical path” is calculated by the scheduling tool, it should be fully vetted and accepted by the task owners and management team during each status cycle throughout the life of the program.
Think through and utilize a suite of schedule performance metrics that identify program objectives the results of which are fed back into the execution strategy. This will ensure you do not end up influencing behaviors that work counter to a schedules ability to model the future. Clearly understand scheduling terms and their functions and uses (Total Float, Free Float, Start / Finish Variances, Late Start / Finish etc). Use these values to instill the necessary behaviors needed to manage successfully. Use a good schedule as a what-if analysis tool to show how even small changes can have a large impact on future performance. Review and validation of the Critical Path by program leadership after each update is a staple of sound schedule management.
Recognize what the cultural necessities are to facilitate schedule utilization.
• Daily use • Frequent (weekly / bi-weekly) update cycle • Well thought out schedule management processes • Highly skilled staff to maintain it • Process discipline by all • Program leadership • Accountability and ownership for schedule data • Well designed information streams both in and out • Executive / senior management participation and buy-in • Understand how to use the schedule data • Understand the terminology • Clearly defined goals • Incentives • Quality planning throughout • Questioning attitude… What-if • Honesty • Integrity • Near term performance measurements • Freeze period for the forecast modeling • Confidence schedule data
Establish target dates on program milestones and program completion that produce meaningful total float values reflecting management’s approach to achieving program goals. Establish a schedule baseline that reflects management’s execution plan, producing consequential performance metrics; update in an authorized and controlled manner when the plan is changed, supporting contractual dates.
Managing Using an IMS
Page 20 of 212
Things to Avoid
At all cost, avoid the unenviable position of trying to defend a poorly constructed schedule. Realize that a poorly constructed schedule is a program management problem, and not a planner/scheduler problem. A poorly constructed schedule is a result, not a cause. Find the root cause. A schedule in this condition is due to poor schedule management practices and processes. Recognize that a schedule cannot be “fixed” when there is an absence of stringent schedule management practices / process and where there is not ownership and accountability for schedule data. Address the cause, the schedule will improve. Realize that having a Program Critical Path changing each month is potentially a problem. Critical Path is not the flavor of the month concept. Critical Path is or should be; the program focus, the program direction, the program length and the primary area of program schedule risk.
Related Topics
Roles and Responsibilities of Program Personnel Program Schedule Reviews The IMS is a Tool not a Report Critical & Driving Path Analysis

The IMS is a Tool, not Just a Report
Page 21 of 212
3.2 - The IMS is a Tool, not Just a Report
Manager’s View
The IMS is often required as a customer deliverable and sometimes viewed purely as a reporting instrument or a report only understood by a trained planner/schedule. This viewpoint misses the IMS effectiveness as the program’s most powerful management tool. For the IMS to be an effective tool, it is necessary to have formal processes for the development, maintenance and daily management of the schedule. The IMS provides an ever changing window into the progress (or lack of it) of current work effort. The strategic mission of a schedule is to point out future risks and opportunities. This provides the ability to mitigate future risks or capture potential opportunities that would have been otherwise unknown. Properly applied predictive schedule analysis is the key to achieving this mission. The role of Program Management is to ensure there is accountability for every aspect of this predictive schedule analysis.
Description
Schedule metrics, reports, and analyses provide a framework for the Program Team to understand both the current state of the work effort and assess the impact of today’s status on work not yet accomplished. Status and comprehensive schedule analysis is required to provide the Program with a predictor of the plan going forward. Programs gain significantly from understanding IMS trends and risks. Programs will not realize the value of this performance feedback if it uses the IMS simply as a reporting tool.
Example
The following table (Fig. 3.2-1) is a representative example of some key IMS analyses and metrics and summary of their value to management on programs that accurately maintain a program IMS.
IMS Analysis/Metric Management Value Critical/Driving Path Analysis • early identification of current and future critical and driving
tasks that require management attention now • provides a framework for proactive management of
downstream risks • quantifies the amount of time flexibility available to every
program task
Schedule Risk Assessment (SRA) • predicts probability of program completion by date • identifies tasks with a high probability of becoming critical • helps to mathematically quantify program risk and
opportunity • paired with cost, provides probabilistic EAC data
Critical Path Length Index (CPLI) • measures how realistic the program completion date is and the efficiency rate required to complete the program as planned
Baseline Execution Index (BEI) • reveals the “execution pace” for a program and provides an early warning of increased risk to on-time completion
Schedule Performance Index • provides an early warning based on past performance to determine if the schedule is at risk and increased performance will be needed to complete on time

The IMS is a Tool, not Just a Report
Page 22 of 212
IMS Analysis/Metric (cont.) Management Value (cont.) Schedule Rate Charts • compares task completion rates to plan
• identifies forecast “bow waves”
Duration vs. Scope Based % • validates accuracy of in-process task finish dates
What-if Analysis • a comprehensive program model that can be used to model and assess alternative program execution strategies
Look Ahead Analysis • identifies activities scheduled to start in the near term • quantifies the amount of time flexibility available to near
term tasks
IMS Vertical Integration & Traceability
• ensures all program scope is accounted for in the program plans
Resource De-Confliction • identifies requirement conflicts and overlaps for key program resources (including people, places, and things)
• quantifies program staffing needs and validates realism for execution
Giver/Receiver - Handoffs • aids in communicating handoffs between program stakeholders
Monitoring Total Float to Program Milestones & Completion
• diminishing positive total float may indicate a risk that the forecast schedule will not achieve program goals; requires management focus on activities contributing to schedule trends
• negative total float suggests that urgency and higher priority attention should be placed on root cause analysis and management actions to mitigate or else affected target dates must be changed to reflect / model reality
• modify program target goals to reflect achievable schedule, providing meaningful total float values to effectively manage earliest completion; fully communicating these actions with customer involvement and concurrence
Monitor Finish Variance between Baseline & Forecast dates (threshold)
• finish variance shows position against contractual commitments or internal targets
• monitor program milestone variances throughout the program
• monitor task variances exceeding established thresholds, paying special attention to any tasks that are on or approaching a critical or driving path
• combined with meaningful total float values provides powerful indicator to activities’ lateness, earliness, and criticality
The IMS is a Tool, not Just a Report
Page 23 of 212
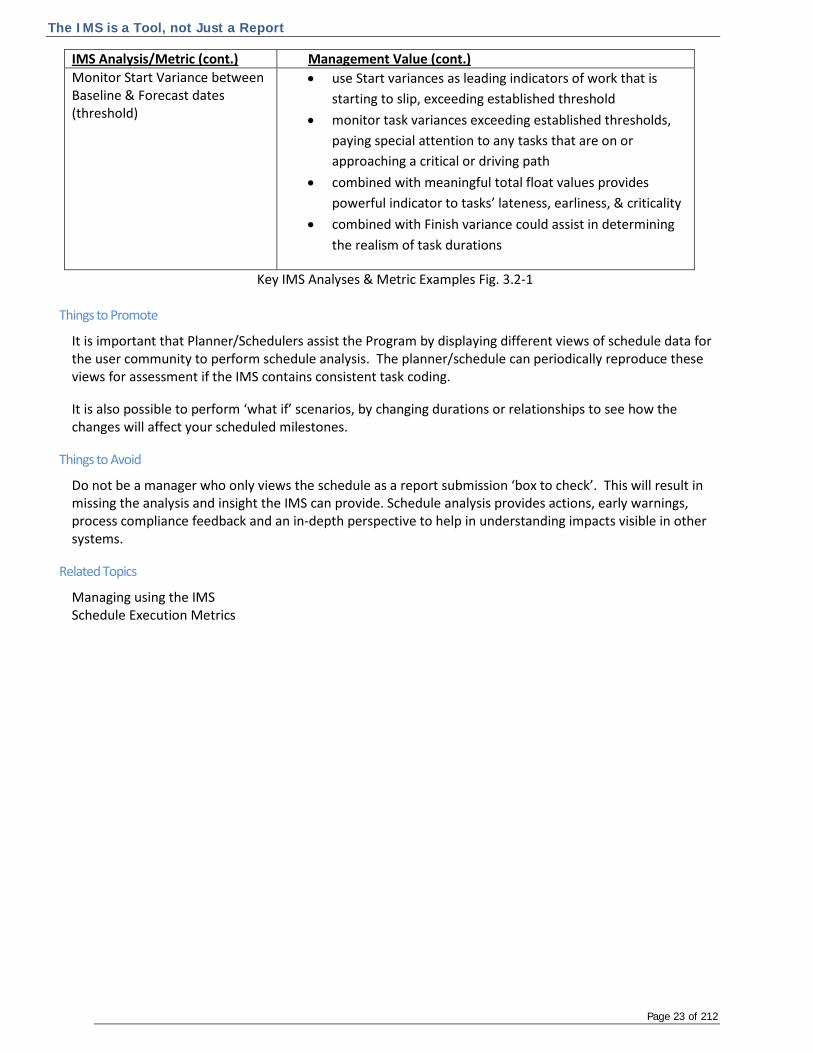
IMS Analysis/Metric (cont.) Management Value (cont.) Monitor Start Variance between Baseline & Forecast dates (threshold)
• use Start variances as leading indicators of work that is starting to slip, exceeding established threshold
• monitor task variances exceeding established thresholds, paying special attention to any tasks that are on or approaching a critical or driving path
• combined with meaningful total float values provides powerful indicator to tasks’ lateness, earliness, & criticality
• combined with Finish variance could assist in determining the realism of task durations
Key IMS Analyses & Metric Examples Fig. 3.2-1
Things to Promote
It is important that Planner/Schedulers assist the Program by displaying different views of schedule data for the user community to perform schedule analysis. The planner/schedule can periodically reproduce these views for assessment if the IMS contains consistent task coding.
It is also possible to perform ‘what if’ scenarios, by changing durations or relationships to see how the changes will affect your scheduled milestones.
Things to Avoid
Do not be a manager who only views the schedule as a report submission ‘box to check’. This will result in missing the analysis and insight the IMS can provide. Schedule analysis provides actions, early warnings, process compliance feedback and an in-depth perspective to help in understanding impacts visible in other systems.
Related Topics
Managing using the IMS Schedule Execution Metrics
Integration of Management Tools
Page 24 of 212
3.3 - Integration of Management Tools
Manager’s View
The Integrated Master Schedule is the cornerstone document in the implementation of the Integrated Product and Process Development (IPPD) process. As such, it is essential that data in the IMS accurately reflect the quantifiable elements of the entire program plan. Additionally, programs should integrate the IMS with other management systems such as the Financial System, EVMS Cost System, Time Tracking System, Material Requirements Planning System, Risk & Opportunity Management, and Requirements Management Systems.
Description
On any program, the IMS is an essential, integrated element of the program’s management approach. It is essential for the proper operation of the program that the data in the IMS be consistent with the overall program plan and integrated with the data in other business systems to maintain continuity across the program. Programs achieve integration of this data either manually or via automated systems. It is important to maintain this integration amongst the various systems to ensure that all participants on the program are making informed decisions based a complete dataset. Inaccurate data integration increases the possibility of conflicting direction, potentially affecting the program. The integration starts with the Systems Engineering Management Plan (SEMP) along with other functional plans that form the basis for all program planning. These plans describe the “who, what, where, and why” of the work that is to be accomplished, the IMS describes the when. Once developed, the IMS becomes a compilation of the technical work on the program and is the living document used to manage the execution of the program plans. The IMS is not only a reflection of the functional plans, but also a reflection of the maturity of the design. Through the completion of the IMS tasks, the technical design maturity, as measured by the current state of the Technical Performance Measures (TPMs), reflects achievement of important interim program objectives. While typically not directly integrated in an automated sense, the IMS should be aligned and consistent with the program requirements and related tracking systems. To provide for integration of cost and schedule, the IMS builds upon the technical information and aligns it with the structural and contractual elements such as the Work Breakdown Structure (WBS) and the Statement of Work (SOW). This information in the IMS provides the necessary traceability to the contract and forms the basis for the Earned Value Management System (EVMS) Performance Measurement Baseline (PMB). Programs document budgets in the IMS in terms of time-phased resources, including labor, material and Other Direct Costs (ODC). The labor resources assist in the bottoms-up reconciliation of staffing plans and are reconciled with company-level Resource Planning tools to provide the program team with an understanding of their consolidated resource needs and availability. The actual labor costs from the financial system are a crucial component of the EVMS. Maintaining a direct correlation between the cost of a program activity and the duration is the basis of the earned value calculations and metrics. It is essential that the data in the schedule match the information in the EVMS cost system. For this reason, automation is the desired approach. In any event, maintaining a consistent and disciplined configuration control process will ensure accuracy in the earned value data used to manage the program and provided to the customer. Because the IMS is the focus document for the entire program team, the program should capture all activities on the program in the schedule. The program typically manages Risk mitigation and opportunity capture plans in a separate Risk and Opportunity (R&O) tool, which provides the program with the necessary
Integration of Management Tools
Page 25 of 212
data to report, monitor, track, and assess R&O impacts. The program should ensure the integration of R&O and the IMS regardless of duplicity. Note: The reason for the separate R&O database is so that candidate risks & opportunities and accepted risks/opportunities can be managed prior to the authorized inclusion of the mitigation or capture tasking in the program IMS and Performance Measurement Baseline (PMB). The final system requiring integration with the IMS is the Material Requirements Planning (MRP) system. The production factory typically utilizes a very detailed management systems to monitor and track all the items necessary (Bill of Material (BOM)) to build the final product(s) using Standard Times for individual task execution, with standard lead times for material procurement based on material commodity classification. This can run into the thousands of separate tasks and is too complex to manage in an IMS. Therefore, programs should integrate the data from the MRP system at a higher level than other tasking in the IMS. This can be accomplished by potentially using higher level/longer duration tasks that summarize detailed MRP tasking, to ensure that the contract IMS status reflects the status of the manufacturing progress in the MRP/ERP system. This level of visibility in the IMS is sufficient to manage the overall program, while managing the details on the factory floor. Programs should take care to ensure that the summary build durations fairly capture overall standard times for the MRP activity. Additionally, programs should ensure to fairly translate material lead-times to appropriate accrual or voucher timeframes in support of EVM requirements.
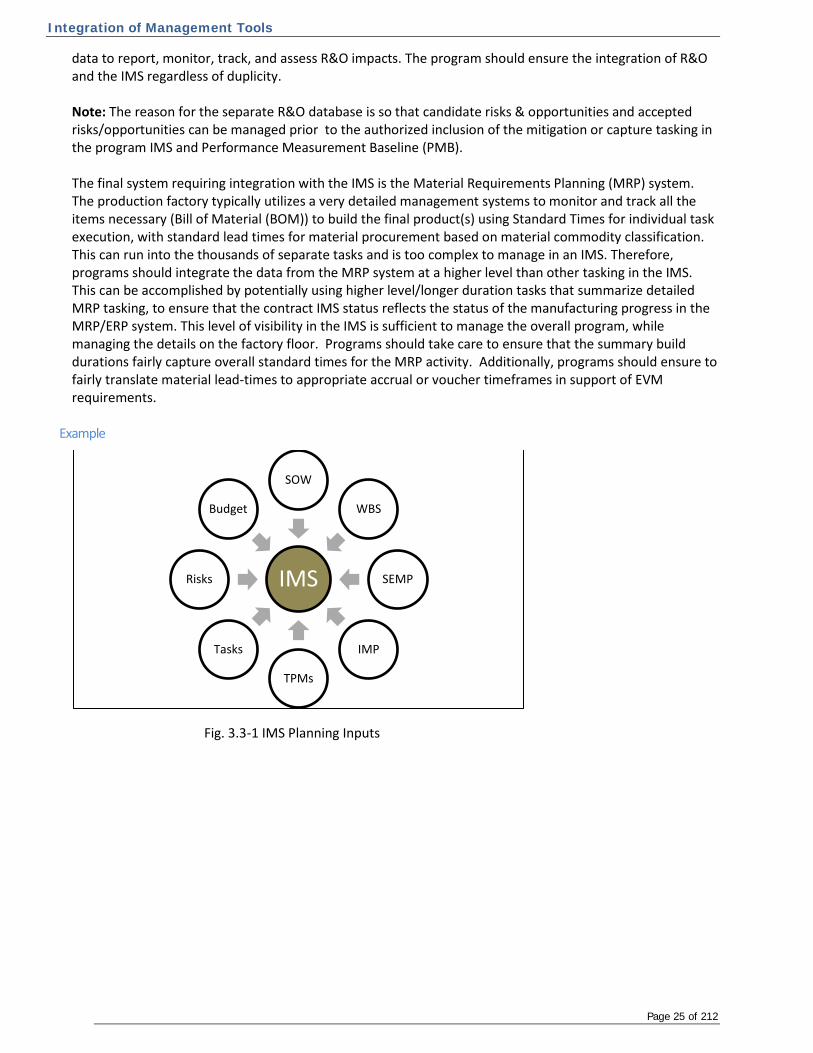
Example
Fig. 3.3-1 IMS Planning Inputs
IMS
SOW
WBS
SEMP
IMP
TPMs
Tasks
Risks
Budget
Integration of Management Tools
Page 26 of 212
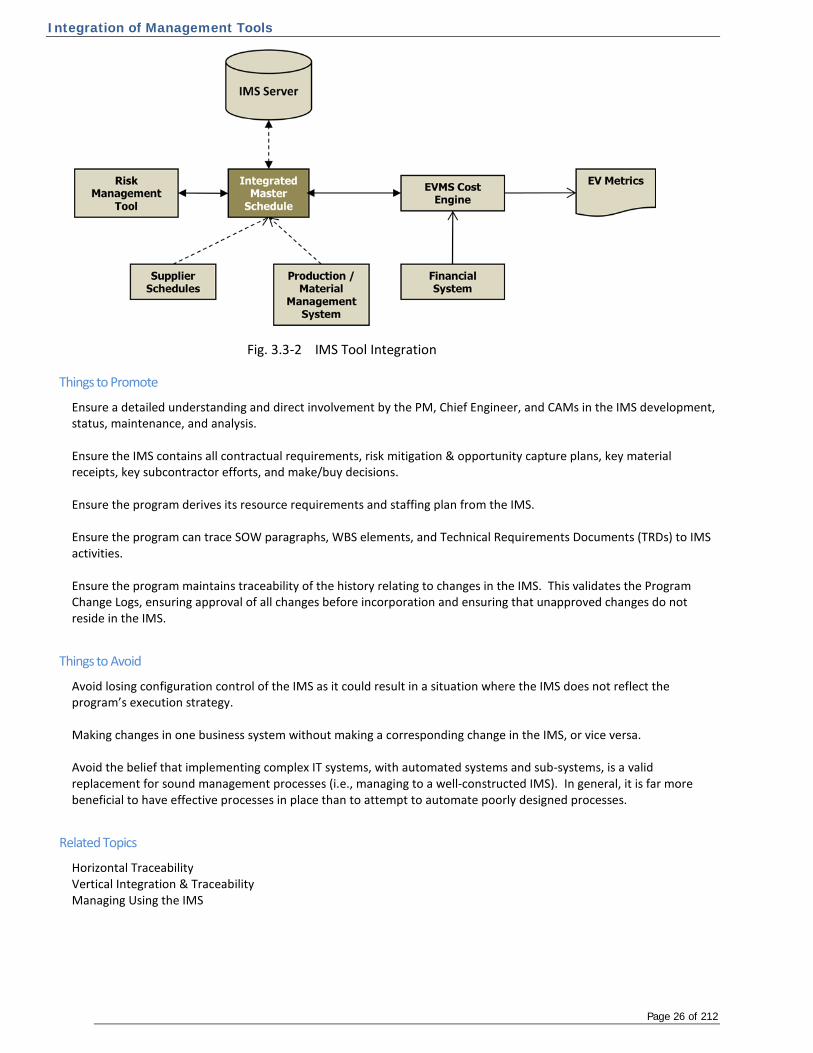
Fig. 3.3-2 IMS Tool Integration
Things to Promote
Ensure a detailed understanding and direct involvement by the PM, Chief Engineer, and CAMs in the IMS development, status, maintenance, and analysis. Ensure the IMS contains all contractual requirements, risk mitigation & opportunity capture plans, key material receipts, key subcontractor efforts, and make/buy decisions. Ensure the program derives its resource requirements and staffing plan from the IMS. Ensure the program can trace SOW paragraphs, WBS elements, and Technical Requirements Documents (TRDs) to IMS activities. Ensure the program maintains traceability of the history relating to changes in the IMS. This validates the Program Change Logs, ensuring approval of all changes before incorporation and ensuring that unapproved changes do not reside in the IMS.
Things to Avoid
Avoid losing configuration control of the IMS as it could result in a situation where the IMS does not reflect the program’s execution strategy. Making changes in one business system without making a corresponding change in the IMS, or vice versa. Avoid the belief that implementing complex IT systems, with automated systems and sub-systems, is a valid replacement for sound management processes (i.e., managing to a well-constructed IMS). In general, it is far more beneficial to have effective processes in place than to attempt to automate poorly designed processes.
Related Topics
Horizontal Traceability Vertical Integration & Traceability Managing Using the IMS

Roles and Responsibilities of Program Personnel
Page 27 of 212
3.4 - Roles and Responsibilities of Program Personnel
Manager’s View
There are a number of key roles in the management and execution of a schedule. Understanding these roles and responsibilities provides the program team with the expectations, responsibilities, and accountability necessary for successful program execution. Program teams are comprised of functional, program, and/or matrix personnel. Understand that the program team and ultimately the program manager are responsible for the schedule, not the planner/scheduler. All members of the program team form an integral partnership in developing, creating the baseline, maintaining, analyzing, and reporting progress and future projections. The program team operates in a timely fashion to ensure the IMS management process leads to successful program execution.
Description
The size of a program team depends on the size of their program. Large programs generally consist of a Program Manager, Integrated Product Team (IPT) Leads, Control Account Managers, Schedulers/Planners, Business Finance, Subcontractors, Functional Managers, and the Customer. On smaller jobs, programs often consolidate these roles. Program Manager The Program Manager (PM) is ultimately responsible and accountable for ensuring successful completion of a program. As part of managing the program team, the PM needs to have a solid understanding of team roles and the planning process. The PM energizes team members to establish and maintain a consolidated schedule to meet program needs and objectives. Program personnel are responsible and accountable for executing the schedule. The PM oversees the execution and maintenance of the schedule, and aggressively drives a sense of ownership and accountability for the schedule and its supporting processes (see Managing Using the IMS) Specific planning-related PM activities include:
1. Confirm that the IMS is accurate and written at a level enabling IPT management of their product and sub-product efforts
2. Ensure that the IMS structure addresses external and internal programmatic and product requirements and that program elements are integrated.
3. Ensure early involvement of all functional elements when generating a program schedule 4. Understand that schedule fidelity needs to be tailored based on the maturity / phase of the
program, and the availability of related planning systems 5. Understand that building / maintaining schedules can be very challenging and complex, and that the
right team / skills need to be in place 6. Understand key scheduling terms 7. Understand the difference between tasks that are considered "crucial" or "critical" to the program
and tasks calculated as "Critical" by the scheduling software. 8. Understand how Critical Path/Float analyses are used to crash critical paths and guide the
assignment of resources 9. Promote schedule quality and integrity 10. Promote the idea that sound planning is an investment in time and energy, resulting in a benefit and
not a cost. 11. Provide oversight and review of schedule execution 12. Hold program personnel accountable for execution to the schedule

Roles and Responsibilities of Program Personnel
Page 28 of 212
13. Use schedule analysis to pro-actively manage program issues, risks, and opportunities
Integrated Product Team (IPT) Lead IPT Leads are usually the next level of management below the Program Manager (PM). To ensure successful completion of a program and as part of the management team, IPT Leads flow PM responsibilities and accountabilities down to their personnel. Like the PM, IPT Leads need to have a solid understanding of team roles and the planning process. IPT Leads energize program personnel to establish and maintain a consolidated schedule to meet program needs and objectives. Program personnel are responsible and accountable for executing the schedule. The IPT Lead oversees the execution and maintenance of the schedule, and aggressively drives a sense of ownership and accountability for the schedule and its supporting processes. IPT leads also facilitate communication between different levels of the program organization. IPT Leads may also facilitate negotiations between CAMs in re-allocation of time, work with functional management to resolve resource issues, and work with their counterparts in the Customer Program Office in clarification of requirements and customer direction. Specific planning-related IPT Leads activities are identical to those of the PM. Control Account Manager A Control Account Manager is responsible for the technical, schedule, and budget related management of a specifically defined element of scope within the contract. Control Account Managers (CAMs) are responsible for ensuring the accomplishment of the scope of work in his or her control accounts, and are the focal points for management control. CAMs determine how their respective effort is represented in the IMS in terms of sequence and logic ties and are responsible for establishing and managing their portion of the baseline. Typically, CAMs report to an IPT Lead. On larger programs, CAMs may delegate specific roles to work package managers (WPMs), as long as they remain cognizant and responsible for the entire control account. As CAMs are responsible for the detail plans, they need to have an extensive knowledge of the team roles and planning process. To ensure successful completion of a program and as part of the program team, CAMs/WPMs flow PM responsibilities and accountabilities down to their personnel. Specific planning-related CAM/WPM activities include those of the PM but also include the following
• Development of the Initial baseline including relationships, duration, and interfaces. The CAM ensures the final baseline is achievable and meaningful.
• Perform status, analysis and baseline maintenance of the IMS tasking within their Control Account • The CAM accepts the responsibility for the validation of the tasking, including the definition of
relationships, resource distribution and de-confliction of the tasking within their Control Accounts. • The CAM accepts responsibility for ownership of all aspects of the IMS tasking within their Control
Account.
Planner/Scheduler The development and maintenance of a schedule can be very challenging and complex. It is important that scheduling personnel have the appropriate background and skill set (see the Training Section for specifics on planner/scheduler training). A group of planner/schedulers, under a planning/scheduling lead, typically supports larger programs. Planner/Schedulers need to have a thorough understanding of scheduling terms, processes, and tools.
Planner/Schedulers are responsible for ensuring the PMs and CAMs adhere to an effective schedule construction, maintenance, and analysis process. They translate the program team’s vision of the workflow by modeling it in a scheduling tool. They ensure the IMS contains all discrete program activities; balance
Roles and Responsibilities of Program Personnel
Page 29 of 212
schedule fidelity based on the program needs and interfaces with other systems, and ensures schedule integrity using metrics and other schedule health indicators. Specifically planner/schedulers needs to:
• Drive the program’s technical approach into the IMS through a strong understanding of the System Engineering life cycle.
• Promote the idea that good planning is in itself a goal, and that it is a benefit instead of a cost • Work with the team to identify all discrete efforts, task dependencies, and resource constraints. • Establish and maintain a quality schedule that adheres to appropriate standards including task
naming, coding, and reporting • Understand and implement sound EVM processes into the schedule management process • Assess schedule health using metrics and/or other indicators to drive IMS improvements • Assure horizontal and vertical integration of the schedule • Maintain a controlled IMS baseline and forecast • Ensure continuous involvement of all functional elements when generating a program IMS • Aggressively drive a sense of ownership and accountability for schedule data and supporting
processes • Support the program team and those responsible/accountable for execution of the schedule • Understand key scheduling terms and processes • Understand the difference between tasks that are considered "crucial" or "critical" to the program
and tasks calculated as "Critical" by the scheduling software. Understand how to use Critical Path/Float analyses to optimize program resources and implement mitigation strategies through what-if modeling
• Use the Schedule Risk Assessments (SRAs) process to gather three point estimates, determine risk-critical activities, and to pro-actively manage risk-critical activities
• Use the schedule as a management and communications tool
Finance Analyst As a central planning document, programs integrate the schedule with the program resources and costs to facilitate program management functions. This can be done within the schedule itself (a resource loaded IMS), or within the finance systems. Specifically a Finance Analyst needs to:
• Validate that the assigned resources and associated time phasing works within program budget and funding constraints
• Assess schedule health using metrics and/or other indicators as they relate to cost • Assist in preparing Schedule/Finance integrated reports
Subcontractors Subcontractors may have contractual requirements to generate and maintain an IMS for their effort. Working with the prime contractor, it is crucial that key hand-offs, product deliveries, and other coordination activities be accounted for in both schedules. These interface points become important to management and control points within the entire program plan. Additionally, subcontractors coordinate the delivery schedule and format of IMS data with the prime contractor (See the Subprojects/External Schedule Integration chapter for more information) Alternatively, the sub-contractor may develop a schedule within the Program IMS and provide baseline maintenance and status updates during each cycle.

Roles and Responsibilities of Program Personnel
Page 30 of 212
Functional Managers Because the functional organizations typically supply the program team with IPT leads, CAMs, and individual contributors, it is important for the functional managers to have a solid understanding of program planning and management approaches so that they can assess the performance of their personnel. The functional manager is responsible for providing the resources needed by the program to meet program commitments as time phased in the IMS. Additionally, the functional manager will validate that the IMS tasking within their functional area is achievable.
Executive Manager Typically, “matrix” functional organizations staff program needs, an Executive Manager is required to align the goals and resources of the company with program needs and commitments. The Executive manager comes from upper level management in the form of company a Vice President or Director. This individual possesses the authority to enforce contractual commitments on behalf of the company and program. Organizationally the Program Manager reports directly to an Executive manager, who manages a portfolio of related programs.
Things to Promote
Ultimately, the program manager, and not the planner/scheduler, owns the program IMS. Program Managers should accept this responsibility and ensure that the IMS accurately reflects the programs execution strategy and uses it as an effective predictive model. Ensure all program stakeholders are versed in IMS-specific “language” and terms to facilitate effective communication on the IMS.
Things to Avoid
Avoid focusing solely on the minute schedule details or intricacies of scheduling software and thereby losing perspective of the big picture of what the team is trying to accomplish.
Related Topics
Managing Using the IMS Subprojects/External Schedule Integration Resource Loaded Schedules Non-Resource Loaded Schedules

Schedule Architecture
Page 31 of 212
4.0 - Schedule Architecture
This section contains the following chapters…
4.1 - IMS Architecture
4.2 - Integrated Master Plan (IMP)
4.3 - Schedule Hierarchy
4.4 - Baseline vs. Forecast Schedules
4.5 - Top Down vs. Bottom Up Planning

IMS Architecture
Page 32 of 212
4.1 - IMS Architecture
Manager’s View
Schedule Architecture is the organizational structure of the work scope or tasks within a program’s Integrated Master Schedule (IMS). The most common IMS architectures are the event based IMP architecture and the product based WBS architecture. The Program team should determine the schedule architecture prior to creating the IMS.
Description
An Integrated Master Plan (IMP) is an Event-based plan with sufficient definition to allow for tracking progress toward completion of a program. An IMP structure subdivides Events into required Significant Accomplishments for the Event and Completion Criteria for each Significant Accomplishment. An IMS with an IMP-driven Architecture incorporates the IMP events, accomplishments, and criteria into its framework. Add detailed tasks to depict the steps required to satisfy criterion. An IMP-based IMS focuses attention on completing the tasks satisfying the entrance and exit criteria for the events and assessing progress towards completing those events. A Work Breakdown Structure (WBS) is an organized method to break down and define the products into sub-products, each at lower levels of detail. It is a product-oriented family tree composed of hardware, software, services, data, and facilities. Structure for an IMS with a Product/WBS Architecture focused on the products which is different from the event-centric structure of the Event/IMP architecture. With a Product/WBS structure, detailed tasks depict the steps required to complete the products. Thus, a WBS-based IMS focuses attention and assesses progress towards completing those products.
Examples
The following example shows an excerpt of an Integrated Master Plan (IMP) (Fig.4.1-1)
Fig 4.1-1 Excerpt of an Integrated Master Plan (IMP) The following example shows detailed tasking structured based on the IMP architecture (Fig. 4.1-2)
Fig. 4.1-2 Example of a detailed schedule based on an IMP Structure
IMS Architecture
Page 33 of 212
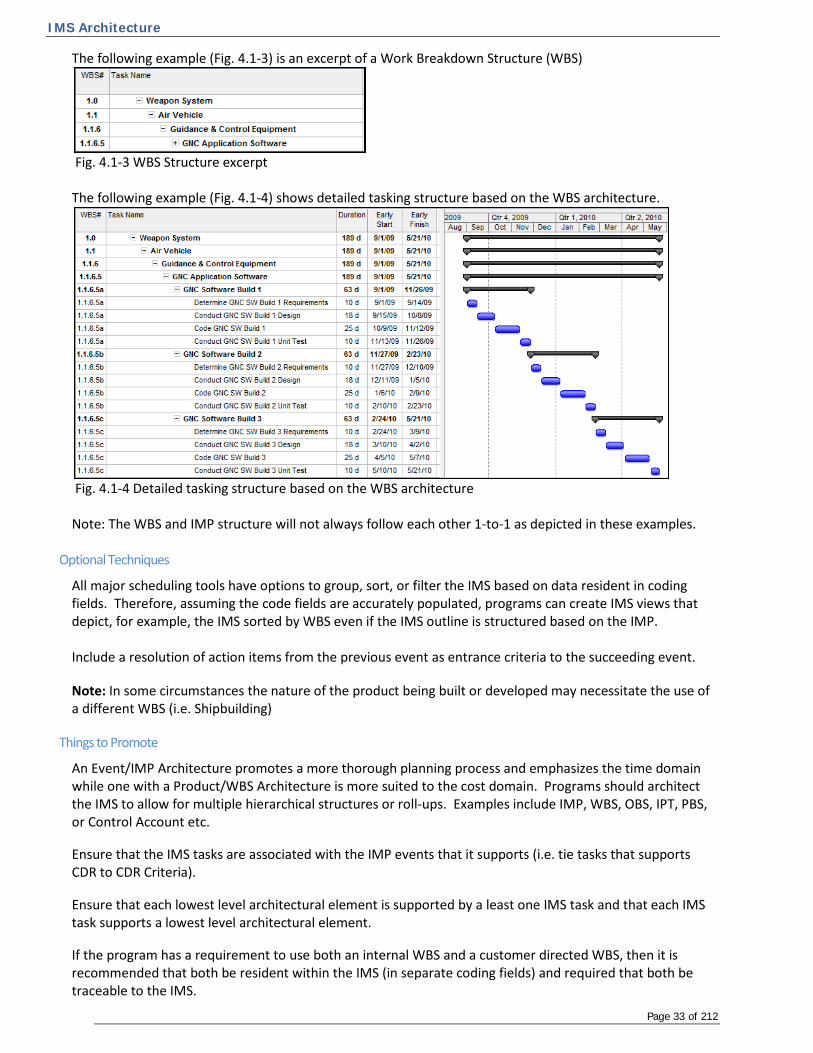
The following example (Fig. 4.1-3) is an excerpt of a Work Breakdown Structure (WBS)
Fig. 4.1-3 WBS Structure excerpt The following example (Fig. 4.1-4) shows detailed tasking structure based on the WBS architecture.
Fig. 4.1-4 Detailed tasking structure based on the WBS architecture Note: The WBS and IMP structure will not always follow each other 1-to-1 as depicted in these examples.
Optional Techniques
All major scheduling tools have options to group, sort, or filter the IMS based on data resident in coding fields. Therefore, assuming the code fields are accurately populated, programs can create IMS views that depict, for example, the IMS sorted by WBS even if the IMS outline is structured based on the IMP. Include a resolution of action items from the previous event as entrance criteria to the succeeding event.
Note: In some circumstances the nature of the product being built or developed may necessitate the use of a different WBS (i.e. Shipbuilding)
Things to Promote
An Event/IMP Architecture promotes a more thorough planning process and emphasizes the time domain while one with a Product/WBS Architecture is more suited to the cost domain. Programs should architect the IMS to allow for multiple hierarchical structures or roll-ups. Examples include IMP, WBS, OBS, IPT, PBS, or Control Account etc.
Ensure that the IMS tasks are associated with the IMP events that it supports (i.e. tie tasks that supports CDR to CDR Criteria).
Ensure that each lowest level architectural element is supported by a least one IMS task and that each IMS task supports a lowest level architectural element.
If the program has a requirement to use both an internal WBS and a customer directed WBS, then it is recommended that both be resident within the IMS (in separate coding fields) and required that both be traceable to the IMS.

IMS Architecture
Page 34 of 212
Use the simplest method in the IMS to capture WBS coding, which may or may not be via the software tools native WBS field.
Regardless of the primary IMS architecture used, ensure the IMS is structured in a way that encompasses the entire scope of discrete work.
Things to Avoid
Avoid adding tasks in the IMS to represent IMP Accomplishments and Criteria rather than using a coding structure to accomplish the architecture.
Related Topics
Integrated Master Plan (IMP) Vertical Integration & Traceability Horizontal Traceability Top Down vs. Bottom up Planning
Integrated Master Plan (IMP)
Page 35 of 212
4.2 - Integrated Master Plan (IMP)
Manager’s View
An Integrated Master Plan (IMP) is an event-based plan that demonstrates maturation of a product as it progresses through a program’s life cycle. It represents the top-level execution strategy for the program and often serves as the primary architecture or outline of the IMS. Although the Events appear in sequential order, the plan demonstrates the execution approach without being time-related. Done correctly and at the appropriate time, an IMP adds rigor and integrity to the program planning process, helping to reduce execution risk, and resulting in a more robust IMS. In some cases an IMP is contractually required; though even when not required, it is a disciplined and comprehensive way to plan a program. Many companies have adopted the IMP as part of their standard planning process. Note: In some cases, acquisition professionals use the term IMP in reference to only an IMP Matrix/Product Section (i.e. Events, Accomplishments, and Criteria). In other cases, they use the term in reference to a larger document that contains several sections, including:
• An introduction describing the IMP • An IMP Matrix/Product Section • A Narrative Section • A Glossary
This chapter focuses primarily on the IMP Matrix/Product Section
Description
Definition The IMP Matrix is a hierarchy of…
Level 1 - program-selected Events
Level 2 - Significant Accomplishments (SAs) required to complete the Event
Level 3 - Accomplishment Criteria (AC) that demonstrate completion of the Accomplishment
The elements of the IMP Matrix are not constrained by calendar dates. Each Event is complete when its Accomplishments are complete. Each Accomplishment is complete when its Criteria are complete. The format for an IMP can be a list, spreadsheet table, or narrative document or any combination of the three. It may also define the entrance and exit criteria. Typically, Accomplishment and Criteria level descriptions use past tense verbs to describe clearly the element’s completed scope.
Application You can use an IMP Matrix on any program and in any phase of an acquisition, modification, or sustainment effort. Use of the IMP Matrix is independent of the program’s complexity, size, or cost. However, these factors may affect the necessary level of detail.
An IMP Matrix is most effective when developed in collaboration with the entire program team and early in the planning process. The IMP evolves iteratively, over the course of the planning process, and if there are scope changes, updated during program execution following configuration control processes and customer submittal and approval where required.
Purpose The IMP Matrix helps to define and communicate the program’s approach to meeting its objectives and contractual requirements. Often, it also serves as the primary architecture and foundation for the program’s Integrated Master Schedule.

Integrated Master Plan (IMP)
Page 36 of 212
Steps in the IMP Development
1. Determine if the program needs only an IMP Matrix or a full IMP (i.e. Introduction, IMP Matrix, Narrative, & Glossary)
2. Build the IMP Matrix o Identify Events, Accomplishments, & Criteria o Validate that the program requirements (i.e. SOW) are covered within the IMP Matrix o Assign a hierarchical number system, ensuring all Events, Accomplishments, and Criteria
have a unique identifier o Assure each Criteria supports a single Accomplishment, and each Accomplishment supports
a single Event 3. If applicable, write Introduction Section 4. If applicable, write Narrative Section 5. If applicable, write Glossary Section. 6. Continuously review and update the IMP throughout the IMS development & execution (with
customer concurrence as applicable). Attributes of IMP Sections Consider including the following attributes (as appropriate based on the individual program needs) in the IMP Sections:
Introduction • Program overview and management approach to executing the program • Explanation of the IMP Matrix numbering & cross-referencing conventions • Key assumptions & ground rules • Program team structure and responsibility
IMP Matrix / Product Section • Level 1 - Events
o Represent maturation phases that often conclude with a program milestone o Are appropriate points to assess the program’s progress
o Are sequential for planned execution order but may overlap o May be customer-directed o May encompass phases such as program design reviews, tests, deliveries, and other key
progress demonstration or risk mitigation points o Do not have dates o Number around 2 – 4 per year (based on program needs) o Include an Event description that defines the purpose and objective of each Event
• Level 2 - Accomplishments o Represent major steps required to complete the supported Event o May represent completion of internal milestones o Number at least 2 per Event (based on program needs)
• Level 3 - Criteria o Are measurable indicators o Represent definitive evidence that the Accomplishment it supports is complete o Number at least two per Accomplishment
Narrative Section • Explains special and crucial tasks or processes to provide additional insight to stakeholders • Provides additional information not covered in the other three sections.
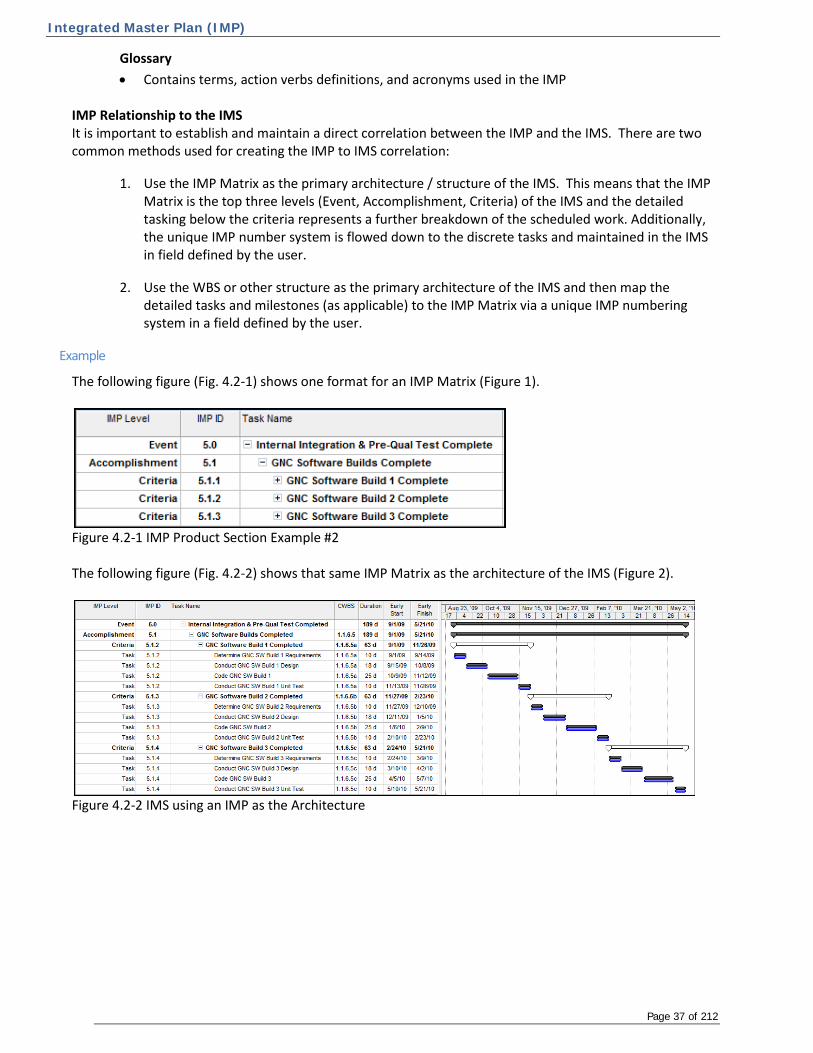
Integrated Master Plan (IMP)
Page 37 of 212
Glossary • Contains terms, action verbs definitions, and acronyms used in the IMP
IMP Relationship to the IMS It is important to establish and maintain a direct correlation between the IMP and the IMS. There are two common methods used for creating the IMP to IMS correlation:
1. Use the IMP Matrix as the primary architecture / structure of the IMS. This means that the IMP Matrix is the top three levels (Event, Accomplishment, Criteria) of the IMS and the detailed tasking below the criteria represents a further breakdown of the scheduled work. Additionally, the unique IMP number system is flowed down to the discrete tasks and maintained in the IMS in field defined by the user.
2. Use the WBS or other structure as the primary architecture of the IMS and then map the detailed tasks and milestones (as applicable) to the IMP Matrix via a unique IMP numbering system in a field defined by the user.
Example
The following figure (Fig. 4.2-1) shows one format for an IMP Matrix (Figure 1).
Figure 4.2-1 IMP Product Section Example #2 The following figure (Fig. 4.2-2) shows that same IMP Matrix as the architecture of the IMS (Figure 2).
Figure 4.2-2 IMS using an IMP as the Architecture

Integrated Master Plan (IMP)
Page 38 of 212
The following figure (Fig. 4.2-3) shows several Event Description examples.
Figure 4.2-3 Example of Event Dictionary Elements
This figure (Fig. 4.2-4) shows how an IMP Code (numbering structure) can be viewed in the IMS.
Figure 4.2-4 Example IMP Code (numbering structure)
EVENT DEFINITION Post-Award Conference (PAC) Completed
The purpose of this event is to ensure that the contractor’s management processes and tools have been implemented and that both the Government/contractor have a common understanding of the program to be executed. The IMP Accomplishments and Criteria and overall schedule will be reviewed, as well as risk status and program metrics. The PAC Event represents the transition from initial post-contract award process implementation and planning updates to a major block of activity related to…
Critical Design Review (CDR) Completed
The purpose of this event is to ensure that the detail design is essentially complete. It will (1) determine that the detail design under review satisfies the performance and engineering requirements; (2) establish the detail design consistency; (3) assess risk areas (on a technical, cost, and schedule basis); and (4) finalize the preliminary item specifications for the subsystems.
Functional/ Physical Configuration Audit (FCA/PCA) Completed
The purpose of this Event is to ensure that the contractor has established a baseline design and physical configuration that meets the performance requirements of the program. It includes validation that the development of a configuration item has been completed satisfactorily and that the configuration item has achieved the performance and functional characteristics specified in the functional or allocated configuration identification. It also includes a technical examination of designated configuration items to verify that the configuration item “As Built” conforms to the technical documentation which defines the configuration.
IMPE A C Description
A Event #01
A 01 Accomplishment #01
A 01 01 Criteria #01
A 01 02 Criteria #02
A 02 Accomplishment #02
A 02 01 Criteria #01
A 02 02 Criteria #02
IMSE A C T Description
A Event #01
A 01 Accomplishment #01
A 01 01 Criteria #01
A 01 01 01 Task #01
A 01 01 02 Task #02
A 01 02 Criteria #02
A 01 02 01 Task #01
A 01 02 02 Task #02
01 02 03 04 05
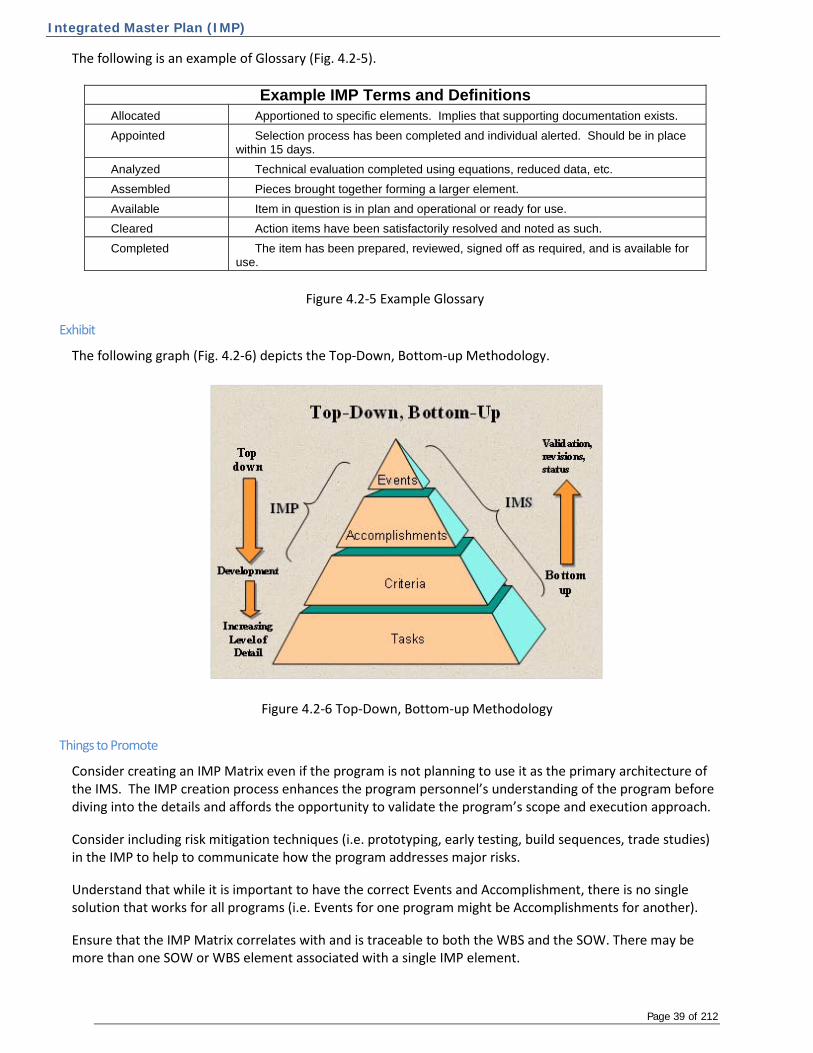
Integrated Master Plan (IMP)
Page 39 of 212
The following is an example of Glossary (Fig. 4.2-5).
Example IMP Terms and Definitions Allocated Apportioned to specific elements. Implies that supporting documentation exists. Appointed Selection process has been completed and individual alerted. Should be in place
within 15 days. Analyzed Technical evaluation completed using equations, reduced data, etc. Assembled Pieces brought together forming a larger element. Available Item in question is in plan and operational or ready for use. Cleared Action items have been satisfactorily resolved and noted as such. Completed The item has been prepared, reviewed, signed off as required, and is available for
use.
Figure 4.2-5 Example Glossary
Exhibit
The following graph (Fig. 4.2-6) depicts the Top-Down, Bottom-up Methodology.
Figure 4.2-6 Top-Down, Bottom-up Methodology
Things to Promote
Consider creating an IMP Matrix even if the program is not planning to use it as the primary architecture of the IMS. The IMP creation process enhances the program personnel’s understanding of the program before diving into the details and affords the opportunity to validate the program’s scope and execution approach.
Consider including risk mitigation techniques (i.e. prototyping, early testing, build sequences, trade studies) in the IMP to help to communicate how the program addresses major risks.
Understand that while it is important to have the correct Events and Accomplishment, there is no single solution that works for all programs (i.e. Events for one program might be Accomplishments for another).
Ensure that the IMP Matrix correlates with and is traceable to both the WBS and the SOW. There may be more than one SOW or WBS element associated with a single IMP element.

Integrated Master Plan (IMP)
Page 40 of 212
Incorporate an IMP Matrix unique numbering scheme that allows mapping of IMP elements in the IMS, whether using the IMP Matrix as the IMS structure or not.
Use Criteria identifying products that the program develops rather than the functions or activities that it performs. Criteria should answer the question “How do you know you’re done?”
Keep the IMP under configuration control once it is established and approved. (Note: may require customer approval as defined in the CDRL.)
When breaking IMP elements into lower level elements ask: “What are the 2-4 most important segments of this element?” Then, as a validity check, ensure they are at an equivalent level and adjust as necessary.
Use clear, meaningful IMP element descriptions at all levels that include past tense verbs (on Accomplishments and Criteria) to denote the emphasis on completion.
Ensure the IMP creation process is a collaborative effort with inputs from all program teams.
Ensure program teams accept and understand which the event, accomplishment, and criteria ownership.
Ensure that verbs are consistently used and defined in the Dictionary.
Maintain the IMP after the program begins execution. It forms a common communication bond between the contractor and the customer and is an excellent tool for understanding current program maturity.
Ensure Vertical Integration & Traceability between a task, through its associated Criteria and Accomplishment, to the Event is consistent with the workflow resulting in Event completion.
Consider including the resolution of actions items from a preceding Event to the entrance criteria of the succeeding Event.
Things to Avoid
Avoid “backing into” the IMP after the IMS has been created. The program loses the top down planning benefit provided by the IMP development process.
Avoid attempting to apply dates to IMP elements during IMP development. The IMS establishes all dates.
Avoid attempting to define dependencies between IMP items. The IMS establishes dependencies.
Watch out for one-to-one relationships in the IMP (i.e. only one Criteria for an Accomplishment). This is typically an indicator that level of detail in the IMP is too low and that you should consider consolidating elements to a higher level.
In order to minimize rework, avoid starting IMP development until the technical approach, WBS, and SOW are relatively stable.
Avoid making the IMP too detailed, as this can drive too much detail into the IMS and may inhibit program flexibility (as many IMPs are contractual).
Avoid unclear descriptions and definitions of the IMP elements, as they will lead to uncertainty and confusion.
Related Topics
IMS Architecture Schedule Hierarchy Top Down vs. Bottom up Planning

Integrated Master Plan (IMP)
Page 41 of 212
Vertical Integration & Traceability
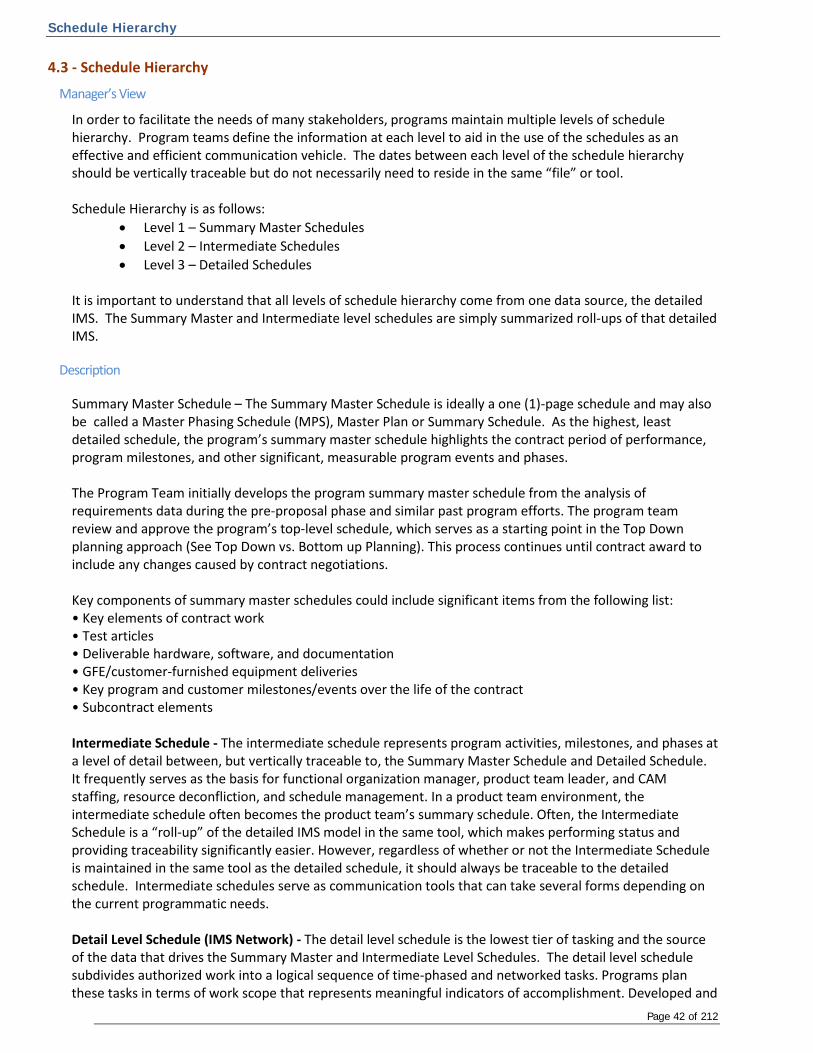
Schedule Hierarchy
Page 42 of 212
4.3 - Schedule Hierarchy
Manager’s View
In order to facilitate the needs of many stakeholders, programs maintain multiple levels of schedule hierarchy. Program teams define the information at each level to aid in the use of the schedules as an effective and efficient communication vehicle. The dates between each level of the schedule hierarchy should be vertically traceable but do not necessarily need to reside in the same “file” or tool.
Schedule Hierarchy is as follows:
• Level 1 – Summary Master Schedules • Level 2 – Intermediate Schedules • Level 3 – Detailed Schedules
It is important to understand that all levels of schedule hierarchy come from one data source, the detailed IMS. The Summary Master and Intermediate level schedules are simply summarized roll-ups of that detailed IMS.
Description
Summary Master Schedule – The Summary Master Schedule is ideally a one (1)-page schedule and may also be called a Master Phasing Schedule (MPS), Master Plan or Summary Schedule. As the highest, least detailed schedule, the program’s summary master schedule highlights the contract period of performance, program milestones, and other significant, measurable program events and phases. The Program Team initially develops the program summary master schedule from the analysis of requirements data during the pre-proposal phase and similar past program efforts. The program team review and approve the program’s top-level schedule, which serves as a starting point in the Top Down planning approach (See Top Down vs. Bottom up Planning). This process continues until contract award to include any changes caused by contract negotiations. Key components of summary master schedules could include significant items from the following list: • Key elements of contract work • Test articles • Deliverable hardware, software, and documentation • GFE/customer-furnished equipment deliveries • Key program and customer milestones/events over the life of the contract • Subcontract elements Intermediate Schedule - The intermediate schedule represents program activities, milestones, and phases at a level of detail between, but vertically traceable to, the Summary Master Schedule and Detailed Schedule. It frequently serves as the basis for functional organization manager, product team leader, and CAM staffing, resource deconfliction, and schedule management. In a product team environment, the intermediate schedule often becomes the product team’s summary schedule. Often, the Intermediate Schedule is a “roll-up” of the detailed IMS model in the same tool, which makes performing status and providing traceability significantly easier. However, regardless of whether or not the Intermediate Schedule is maintained in the same tool as the detailed schedule, it should always be traceable to the detailed schedule. Intermediate schedules serve as communication tools that can take several forms depending on the current programmatic needs. Detail Level Schedule (IMS Network) - The detail level schedule is the lowest tier of tasking and the source of the data that drives the Summary Master and Intermediate Level Schedules. The detail level schedule subdivides authorized work into a logical sequence of time-phased and networked tasks. Programs plan these tasks in terms of work scope that represents meaningful indicators of accomplishment. Developed and
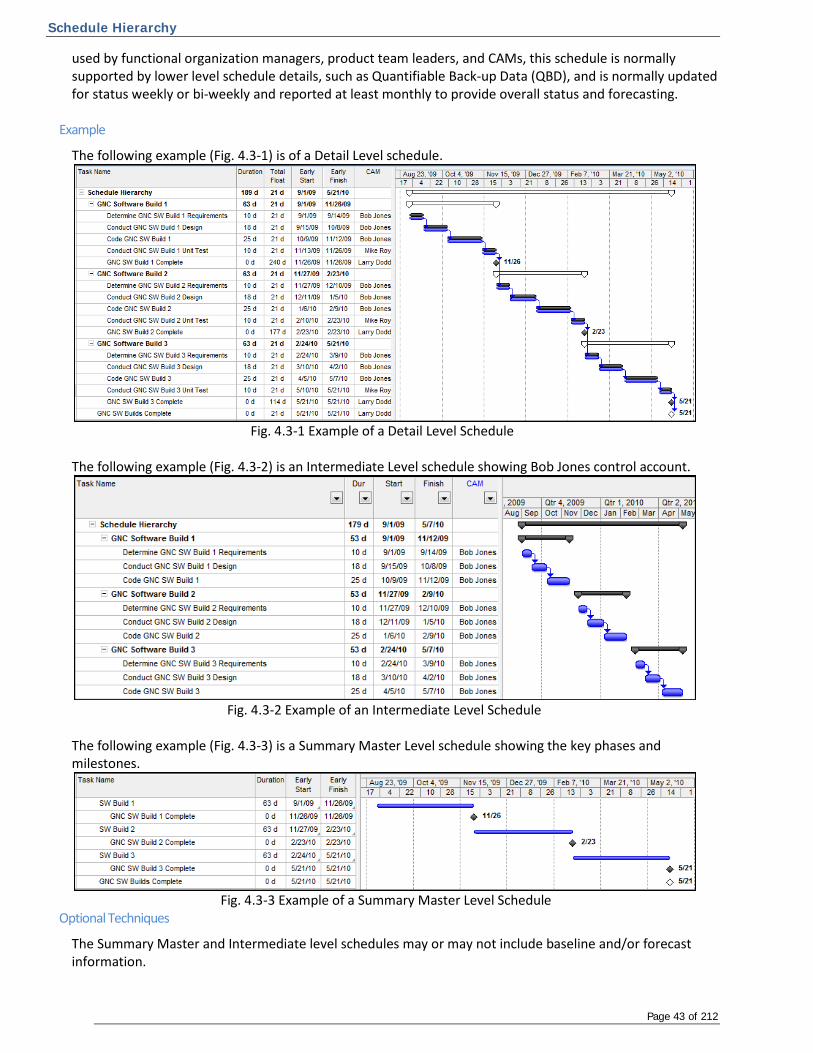
Schedule Hierarchy
Page 43 of 212
used by functional organization managers, product team leaders, and CAMs, this schedule is normally supported by lower level schedule details, such as Quantifiable Back-up Data (QBD), and is normally updated for status weekly or bi-weekly and reported at least monthly to provide overall status and forecasting.
Example
The following example (Fig. 4.3-1) is of a Detail Level schedule.
Fig. 4.3-1 Example of a Detail Level Schedule The following example (Fig. 4.3-2) is an Intermediate Level schedule showing Bob Jones control account.
Fig. 4.3-2 Example of an Intermediate Level Schedule The following example (Fig. 4.3-3) is a Summary Master Level schedule showing the key phases and milestones.
Fig. 4.3-3 Example of a Summary Master Level Schedule
Optional Techniques
The Summary Master and Intermediate level schedules may or may not include baseline and/or forecast information.

Schedule Hierarchy
Page 44 of 212
Things to Promote
Regardless of methodology or tools used, always ensure date traceability between all levels of the schedule hierarchy. The WBS, IMP or other coding field relationship may not always exist between the different hierarchical levels of the IMS so the planner/scheduler should use the IMS Supplemental Guidance to record and document relationships not self-documented in the IMS.
Related Topics
Top Down vs. Bottom up Planning IMS Architecture Managing Using an IMS

Baseline vs. Forecast Schedules
Page 45 of 212
4.4 - Baseline vs. Forecast Schedules
Manager’s View
To be a useful management tool, the IMS should have an original plan (i.e. “baseline”) against which current status (i.e. “forecast”) can be compared. The ability to compare baseline versus forecast dates provides a useful tool for executing and understanding the current state of the program. Both the baseline and the forecast schedules are under frequent maintenance. The baseline schedule is subject to formal change control and changes less frequently while the forecast schedule changes with each status cycle. Each task in the IMS has both baseline and forecast dates.
Description
The initial schedule development results in the program baseline. It becomes the foundation for earned value performance measurement. It must contain the entire scope of the contract including all contractual requirements. It is consistent with the most likely expectations of performance at the time of establishment. It is under configuration control and maintained to ensure consistency with the program’s contractual requirements. It is the schedule that is subject to an Integrated Baseline Review (IBR), as applicable. Conversely, the forecast is updated, by the CAMs, during each status period to reflect program performance and an executable path forward. The schedule statusing frequency is defined in the contractor’s EVMS description and supplemental program directives or Schedule Management Plan (SMP) and results in recalculating the schedule after each status cycle. At a minimum, this process should occur at least every month, if not more often. The recalculation typically results in revised forecast dates, float values, and date variances on each task and a potential revision of the program critical and driving paths. The forecast and baseline may be captured in the same schedule or be in separate versions of the schedule depending on the tool specifics. Regardless, each task in the baseline schedule should be captured in the forecast schedule. The difference between the forecast and baseline is reflected in duration or start/ finish date variance. This type of duration-based finish variance analysis should be reconciled with CPR-based variance analysis (i.e. cumulative and current period BCWS - BCWP) and other schedule analysis metrics. Comparisons between the baseline and forecast schedules provide a fundamental basis for generating schedule workarounds or detailed recovery steps for applicable late activities and their impact as the program progresses over time.
Things to Promote
Ensure the baseline and forecast schedules dates are identical at the time of baseline establishment, which represents the most likely forecast of performance. The baseline is maintained through change control consistent with program requirements and the applicable system description. Compare the forecast schedule to the baseline schedule to assist in management analysis and forecast of contract performance.
Things to Avoid
Avoid changing the baseline to avert unfavorable schedule/EVMS Metrics or to avoid reporting schedule delays. Not maintaining the baseline consistent with scope changes.

Baseline vs. Forecast Schedules
Page 46 of 212
Not keeping the forecast schedule current with status, task forecasts, and workarounds as applicable. Avoid undocumented and/or unapproved changes to the baseline.
Related Topics
Schedule Margin Forecasting Schedule Acceleration Baseline Change Management Program Schedule Reviews
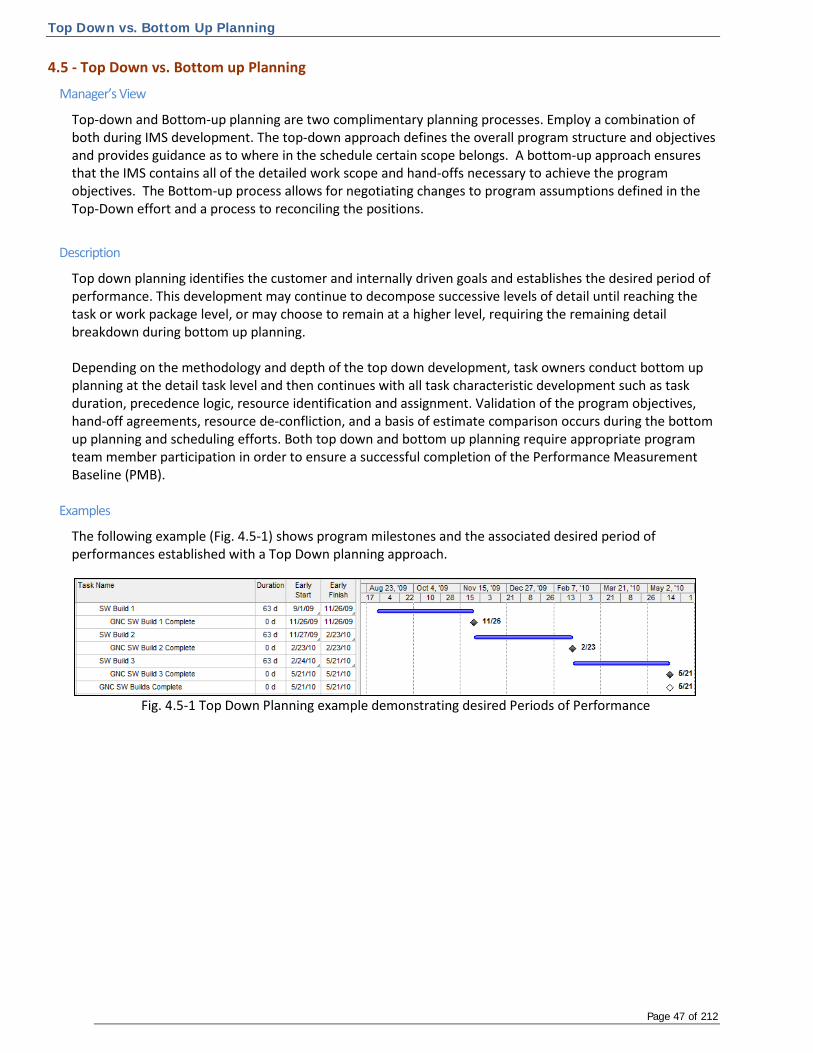
Top Down vs. Bottom Up Planning
Page 47 of 212
4.5 - Top Down vs. Bottom up Planning
Manager’s View
Top-down and Bottom-up planning are two complimentary planning processes. Employ a combination of both during IMS development. The top-down approach defines the overall program structure and objectives and provides guidance as to where in the schedule certain scope belongs. A bottom-up approach ensures that the IMS contains all of the detailed work scope and hand-offs necessary to achieve the program objectives. The Bottom-up process allows for negotiating changes to program assumptions defined in the Top-Down effort and a process to reconciling the positions.
Description
Top down planning identifies the customer and internally driven goals and establishes the desired period of performance. This development may continue to decompose successive levels of detail until reaching the task or work package level, or may choose to remain at a higher level, requiring the remaining detail breakdown during bottom up planning. Depending on the methodology and depth of the top down development, task owners conduct bottom up planning at the detail task level and then continues with all task characteristic development such as task duration, precedence logic, resource identification and assignment. Validation of the program objectives, hand-off agreements, resource de-confliction, and a basis of estimate comparison occurs during the bottom up planning and scheduling efforts. Both top down and bottom up planning require appropriate program team member participation in order to ensure a successful completion of the Performance Measurement Baseline (PMB).
Examples
The following example (Fig. 4.5-1) shows program milestones and the associated desired period of performances established with a Top Down planning approach.
Fig. 4.5-1 Top Down Planning example demonstrating desired Periods of Performance
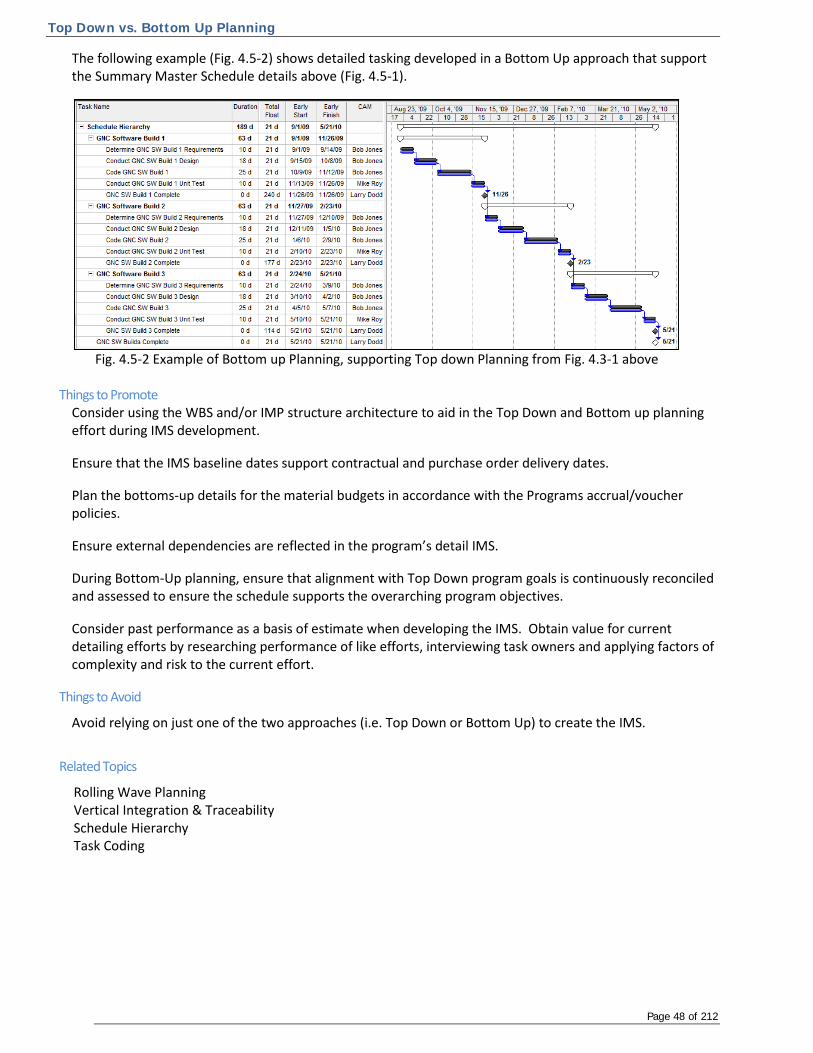
Top Down vs. Bottom Up Planning
Page 48 of 212
The following example (Fig. 4.5-2) shows detailed tasking developed in a Bottom Up approach that support the Summary Master Schedule details above (Fig. 4.5-1).
Fig. 4.5-2 Example of Bottom up Planning, supporting Top down Planning from Fig. 4.3-1 above
Things to Promote Consider using the WBS and/or IMP structure architecture to aid in the Top Down and Bottom up planning effort during IMS development.
Ensure that the IMS baseline dates support contractual and purchase order delivery dates.
Plan the bottoms-up details for the material budgets in accordance with the Programs accrual/voucher policies.
Ensure external dependencies are reflected in the program’s detail IMS.
During Bottom-Up planning, ensure that alignment with Top Down program goals is continuously reconciled and assessed to ensure the schedule supports the overarching program objectives.
Consider past performance as a basis of estimate when developing the IMS. Obtain value for current detailing efforts by researching performance of like efforts, interviewing task owners and applying factors of complexity and risk to the current effort.
Things to Avoid
Avoid relying on just one of the two approaches (i.e. Top Down or Bottom Up) to create the IMS.
Related Topics
Rolling Wave Planning Vertical Integration & Traceability Schedule Hierarchy Task Coding
Schedule Modeling Techniques
Page 49 of 212
5.0 - Schedule Modeling Techniques
This section contains the following chapters…
5.1 - Task Naming Convention
5.2 - Duration
5.3 - Relationships / Logic
5.4 - Lead / Lag Time
5.5 - Task Constraints
5.6 - Milestones
5.7 - Summaries & Hammocks
5.8 - Level of Effort (LOE)
5.9 - Apportioned Effort
5.10 - Working Calendars
5.11 - Schedule Calculation Algorithm
5.12 - Schedule Margin
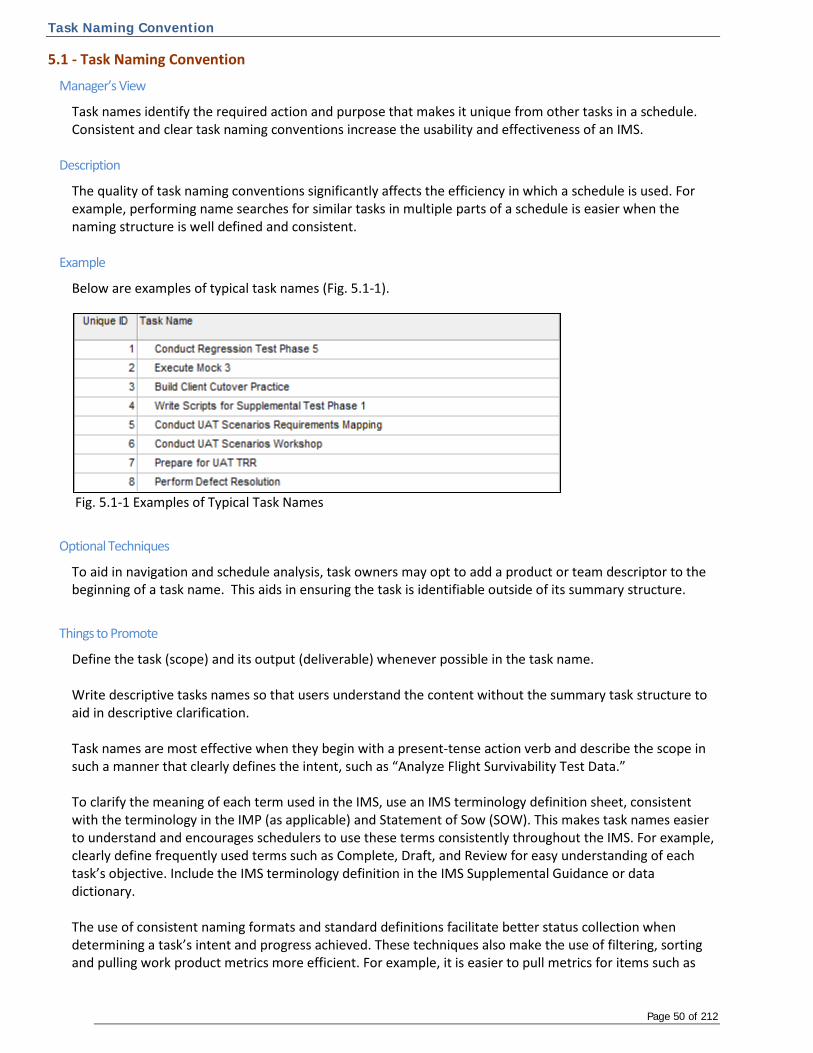
Task Naming Convention
Page 50 of 212
5.1 - Task Naming Convention
Manager’s View
Task names identify the required action and purpose that makes it unique from other tasks in a schedule. Consistent and clear task naming conventions increase the usability and effectiveness of an IMS.
Description
The quality of task naming conventions significantly affects the efficiency in which a schedule is used. For example, performing name searches for similar tasks in multiple parts of a schedule is easier when the naming structure is well defined and consistent.
Example
Below are examples of typical task names (Fig. 5.1-1).
Fig. 5.1-1 Examples of Typical Task Names
Optional Techniques
To aid in navigation and schedule analysis, task owners may opt to add a product or team descriptor to the beginning of a task name. This aids in ensuring the task is identifiable outside of its summary structure.
Things to Promote
Define the task (scope) and its output (deliverable) whenever possible in the task name. Write descriptive tasks names so that users understand the content without the summary task structure to aid in descriptive clarification. Task names are most effective when they begin with a present-tense action verb and describe the scope in such a manner that clearly defines the intent, such as “Analyze Flight Survivability Test Data.” To clarify the meaning of each term used in the IMS, use an IMS terminology definition sheet, consistent with the terminology in the IMP (as applicable) and Statement of Sow (SOW). This makes task names easier to understand and encourages schedulers to use these terms consistently throughout the IMS. For example, clearly define frequently used terms such as Complete, Draft, and Review for easy understanding of each task’s objective. Include the IMS terminology definition in the IMS Supplemental Guidance or data dictionary. The use of consistent naming formats and standard definitions facilitate better status collection when determining a task’s intent and progress achieved. These techniques also make the use of filtering, sorting and pulling work product metrics more efficient. For example, it is easier to pull metrics for items such as
Task Naming Convention
Page 51 of 212
Scripts, Payloads, or Assemblies when these words have the same meaning and in the same format for all tasks.
Things to Avoid
Avoid using duplicate Task Names in the IMS. Each task should have scope clearly defined and be able to stand alone without the need for support from summary task descriptions in order for the task’s scope to be determined.
Avoid common mistakes when naming tasks, as illustrated in the following examples: Inconsistent • “PL11-Planning Reports”- does not describe the action. Better example would be “ PL11- Develop
Plan for producing CDRL A008 reports • “Training Clients”- does not relate to specific training and can be confused with other training
referenced without specific descriptions. Better example would be “ Train Clients with TRN-3400 courseware”
• “Perform Defect Resolution”- does not relate to a particular item, unit or perhaps type of defect. Better example would be “Update Reliability Model with Apr-2010 Field Defect data”
Poorly defined and unclear • “Write Scripts”- especially problematic when reviewing similar tasks, filtered and sorted without
summary task or using code category descriptions. Better example would be “ CSCI AAX-Write Test Scripts for Test Y”
Identified with incorrect format • Incorrect format: “Network Connectivity Readiness” Correct format: “Perform and Document
Network Connectivity Readiness”
Related Topics
Task Coding Managing Using an IMS Desktop Procedures
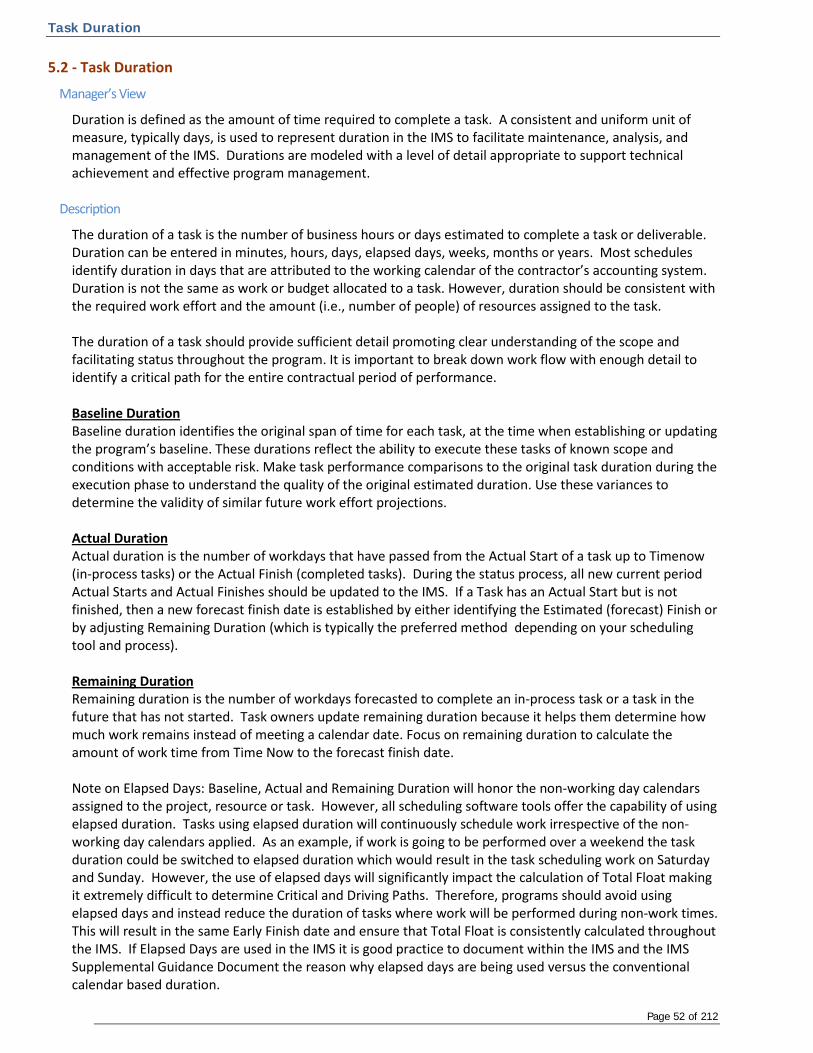
Task Duration
Page 52 of 212
5.2 - Task Duration
Manager’s View
Duration is defined as the amount of time required to complete a task. A consistent and uniform unit of measure, typically days, is used to represent duration in the IMS to facilitate maintenance, analysis, and management of the IMS. Durations are modeled with a level of detail appropriate to support technical achievement and effective program management.
Description
The duration of a task is the number of business hours or days estimated to complete a task or deliverable. Duration can be entered in minutes, hours, days, elapsed days, weeks, months or years. Most schedules identify duration in days that are attributed to the working calendar of the contractor’s accounting system. Duration is not the same as work or budget allocated to a task. However, duration should be consistent with the required work effort and the amount (i.e., number of people) of resources assigned to the task. The duration of a task should provide sufficient detail promoting clear understanding of the scope and facilitating status throughout the program. It is important to break down work flow with enough detail to identify a critical path for the entire contractual period of performance.
Baseline Duration Baseline duration identifies the original span of time for each task, at the time when establishing or updating the program’s baseline. These durations reflect the ability to execute these tasks of known scope and conditions with acceptable risk. Make task performance comparisons to the original task duration during the execution phase to understand the quality of the original estimated duration. Use these variances to determine the validity of similar future work effort projections. Actual Duration Actual duration is the number of workdays that have passed from the Actual Start of a task up to Timenow (in-process tasks) or the Actual Finish (completed tasks). During the status process, all new current period Actual Starts and Actual Finishes should be updated to the IMS. If a Task has an Actual Start but is not finished, then a new forecast finish date is established by either identifying the Estimated (forecast) Finish or by adjusting Remaining Duration (which is typically the preferred method depending on your scheduling tool and process). Remaining Duration Remaining duration is the number of workdays forecasted to complete an in-process task or a task in the future that has not started. Task owners update remaining duration because it helps them determine how much work remains instead of meeting a calendar date. Focus on remaining duration to calculate the amount of work time from Time Now to the forecast finish date. Note on Elapsed Days: Baseline, Actual and Remaining Duration will honor the non-working day calendars assigned to the project, resource or task. However, all scheduling software tools offer the capability of using elapsed duration. Tasks using elapsed duration will continuously schedule work irrespective of the non-working day calendars applied. As an example, if work is going to be performed over a weekend the task duration could be switched to elapsed duration which would result in the task scheduling work on Saturday and Sunday. However, the use of elapsed days will significantly impact the calculation of Total Float making it extremely difficult to determine Critical and Driving Paths. Therefore, programs should avoid using elapsed days and instead reduce the duration of tasks where work will be performed during non-work times. This will result in the same Early Finish date and ensure that Total Float is consistently calculated throughout the IMS. If Elapsed Days are used in the IMS it is good practice to document within the IMS and the IMS Supplemental Guidance Document the reason why elapsed days are being used versus the conventional calendar based duration.
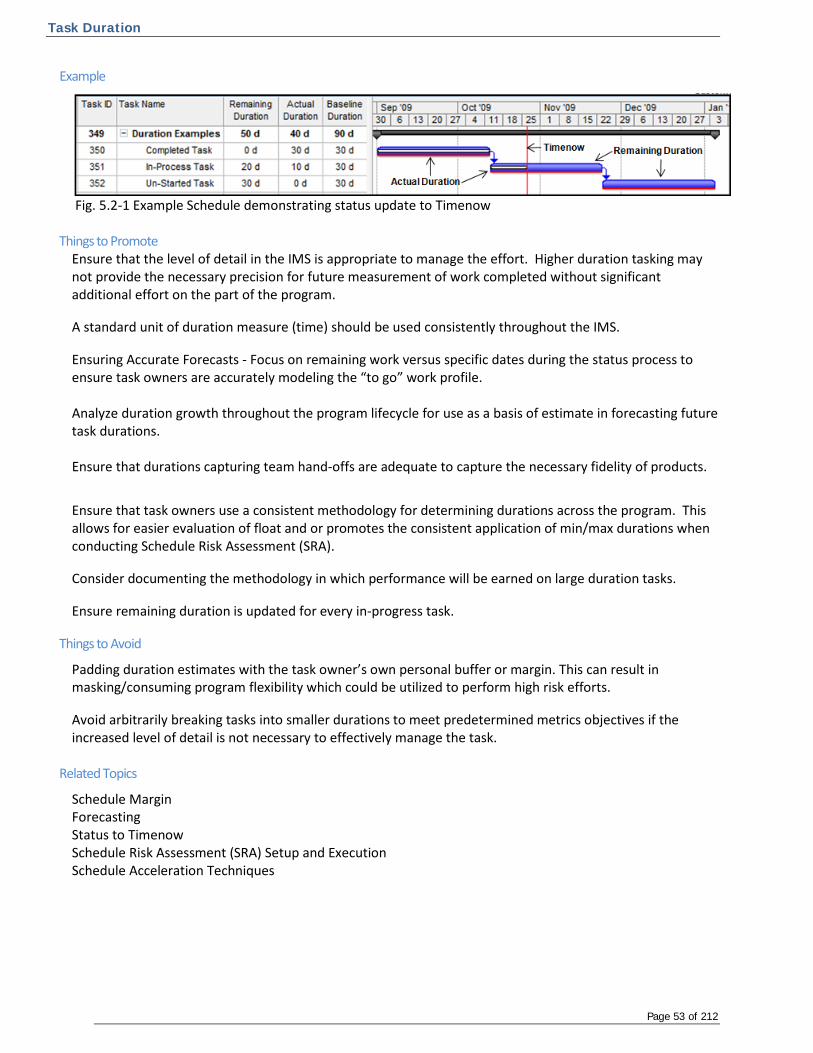
Task Duration
Page 53 of 212
Example
Fig. 5.2-1 Example Schedule demonstrating status update to Timenow
Things to Promote Ensure that the level of detail in the IMS is appropriate to manage the effort. Higher duration tasking may not provide the necessary precision for future measurement of work completed without significant additional effort on the part of the program.
A standard unit of duration measure (time) should be used consistently throughout the IMS.
Ensuring Accurate Forecasts - Focus on remaining work versus specific dates during the status process to ensure task owners are accurately modeling the “to go” work profile. Analyze duration growth throughout the program lifecycle for use as a basis of estimate in forecasting future task durations. Ensure that durations capturing team hand-offs are adequate to capture the necessary fidelity of products.
Ensure that task owners use a consistent methodology for determining durations across the program. This allows for easier evaluation of float and or promotes the consistent application of min/max durations when conducting Schedule Risk Assessment (SRA).
Consider documenting the methodology in which performance will be earned on large duration tasks.
Ensure remaining duration is updated for every in-progress task.
Things to Avoid
Padding duration estimates with the task owner’s own personal buffer or margin. This can result in masking/consuming program flexibility which could be utilized to perform high risk efforts.
Avoid arbitrarily breaking tasks into smaller durations to meet predetermined metrics objectives if the increased level of detail is not necessary to effectively manage the task.
Related Topics
Schedule Margin Forecasting Status to Timenow Schedule Risk Assessment (SRA) Setup and Execution Schedule Acceleration Techniques
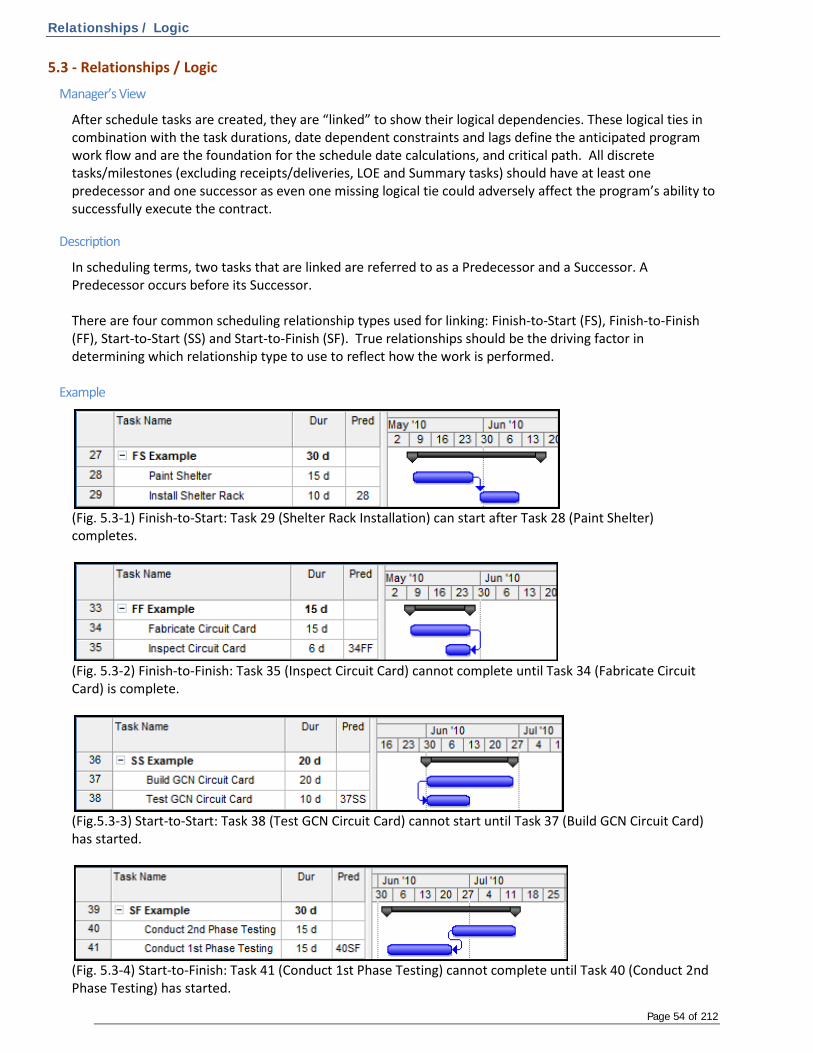
Relationships / Logic
Page 54 of 212
5.3 - Relationships / Logic
Manager’s View
After schedule tasks are created, they are “linked” to show their logical dependencies. These logical ties in combination with the task durations, date dependent constraints and lags define the anticipated program work flow and are the foundation for the schedule date calculations, and critical path. All discrete tasks/milestones (excluding receipts/deliveries, LOE and Summary tasks) should have at least one predecessor and one successor as even one missing logical tie could adversely affect the program’s ability to successfully execute the contract.
Description
In scheduling terms, two tasks that are linked are referred to as a Predecessor and a Successor. A Predecessor occurs before its Successor. There are four common scheduling relationship types used for linking: Finish-to-Start (FS), Finish-to-Finish (FF), Start-to-Start (SS) and Start-to-Finish (SF). True relationships should be the driving factor in determining which relationship type to use to reflect how the work is performed.
Example
(Fig. 5.3-1) Finish-to-Start: Task 29 (Shelter Rack Installation) can start after Task 28 (Paint Shelter) completes.
(Fig. 5.3-2) Finish-to-Finish: Task 35 (Inspect Circuit Card) cannot complete until Task 34 (Fabricate Circuit Card) is complete.
(Fig.5.3-3) Start-to-Start: Task 38 (Test GCN Circuit Card) cannot start until Task 37 (Build GCN Circuit Card) has started.
(Fig. 5.3-4) Start-to-Finish: Task 41 (Conduct 1st Phase Testing) cannot complete until Task 40 (Conduct 2nd Phase Testing) has started.

Relationships / Logic
Page 55 of 212
Calculations
Refer to the Critical Path Method (CPM) section for an explanation of how these relationships play into the forward and backward pass calculations.
Things to Promote
Ideally, programs should structure their IMS with predominantly Finish-to-Start (FS) relationships. However, programs should ensure that the logic types used in the IMS accurately model the real task relationships. It is recommended that each activity have at least one Finish-to-Start or Start-to-start predecessor and one Finish-to-Start or Finish-to-Finish successor. Ensure tasks have at least one non-Start-to-Start successor. If a task only has Start-to-Start succeeding relationships then its finish date does not actually drive downstream work. See Fig. 5.3-5 below.
Fig. 5.3-5 – Example missing non-Start-to-Start Successor Ensure tasks have at least one non-Finish-to-Finish predecessor. If a task only has Finish-to-Finish preceding task relationships then its start date is not actually driven by preceding work. See Fig. 5.3-6 below.
Fig. 5.3-6– Example missing non-Finish-to-Finish Predecessor Note: Caveats to these recommendations are receipt milestones/activities (which may not require a predecessor) and delivery milestones/activities (which may not require a successor).
Things to Avoid
Avoid linking tasks arbitrarily to satify a metric. Each link should be required to complete the project.
Related Topics
Lead / Lag Times Vertical Integration & Traceability Schedule Visibility Tasks (SVT)
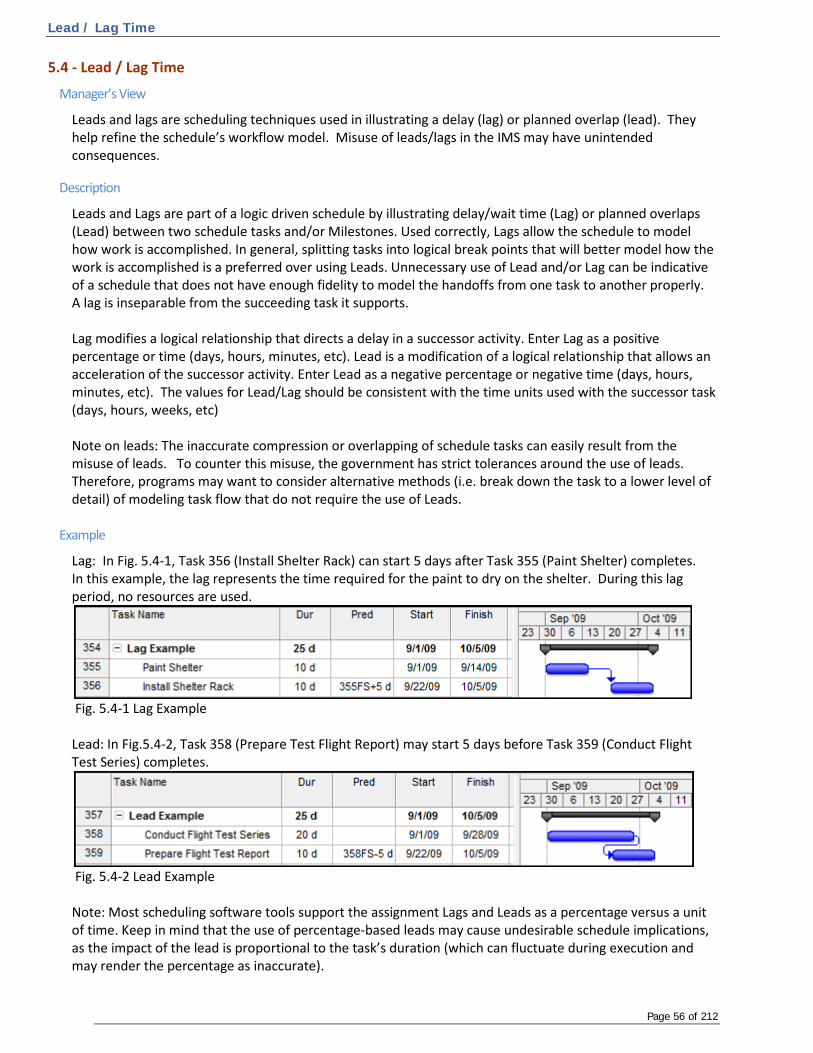
Lead / Lag Time
Page 56 of 212
5.4 - Lead / Lag Time
Manager’s View
Leads and lags are scheduling techniques used in illustrating a delay (lag) or planned overlap (lead). They help refine the schedule’s workflow model. Misuse of leads/lags in the IMS may have unintended consequences.
Description
Leads and Lags are part of a logic driven schedule by illustrating delay/wait time (Lag) or planned overlaps (Lead) between two schedule tasks and/or Milestones. Used correctly, Lags allow the schedule to model how work is accomplished. In general, splitting tasks into logical break points that will better model how the work is accomplished is a preferred over using Leads. Unnecessary use of Lead and/or Lag can be indicative of a schedule that does not have enough fidelity to model the handoffs from one task to another properly. A lag is inseparable from the succeeding task it supports. Lag modifies a logical relationship that directs a delay in a successor activity. Enter Lag as a positive percentage or time (days, hours, minutes, etc). Lead is a modification of a logical relationship that allows an acceleration of the successor activity. Enter Lead as a negative percentage or negative time (days, hours, minutes, etc). The values for Lead/Lag should be consistent with the time units used with the successor task (days, hours, weeks, etc) Note on leads: The inaccurate compression or overlapping of schedule tasks can easily result from the misuse of leads. To counter this misuse, the government has strict tolerances around the use of leads. Therefore, programs may want to consider alternative methods (i.e. break down the task to a lower level of detail) of modeling task flow that do not require the use of Leads.
Example
Lag: In Fig. 5.4-1, Task 356 (Install Shelter Rack) can start 5 days after Task 355 (Paint Shelter) completes. In this example, the lag represents the time required for the paint to dry on the shelter. During this lag period, no resources are used.
Fig. 5.4-1 Lag Example Lead: In Fig.5.4-2, Task 358 (Prepare Test Flight Report) may start 5 days before Task 359 (Conduct Flight Test Series) completes.
Fig. 5.4-2 Lead Example Note: Most scheduling software tools support the assignment Lags and Leads as a percentage versus a unit of time. Keep in mind that the use of percentage-based leads may cause undesirable schedule implications, as the impact of the lead is proportional to the task’s duration (which can fluctuate during execution and may render the percentage as inaccurate).

Lead / Lag Time
Page 57 of 212
Optional Techniques
Programs may want to consider using a Schedule Visibility Task (SVT) versus a lag. Here are some questions relevant to assessing whether or not an SVT would be appropriate:
• Can you ascertain status information (such as remaining time or progress to Timenow) while the lag is in process?
• Is it likely that the actual length of the delay will be different from the originally planned delay? • Is the lag likely to show up on the Critical Path/Driving Path? • Would it be beneficial to track the forecast of the delay against the baseline delay time? • Will the lag adversely affect any Vertical Integration & Traceability to other schedules or systems?
SVT vs. Lag: Fig. 5.4-3 demonstrates how using an SVT versus a Lag can provide enhanced schedule visibility.
Fig. 5.4-3 Example of using an SVT in place of a Lag
Things to Promote
If the schedule is accurately modeled in a way that depends on a large number of leads/lags then document the modeling methodology in the program’s IMS Supplemental Guidance.
Documenting the purpose of each lead/lag within the IMS (i.e. in a field defined by the user) to facilitate the ease of IMS status and analysis.
Consider alternative schedule-modeling techniques to using lags or leads including, but not limited to, the following:
• Lags – Consider whether it is more appropriate to use a Soft Constraint versus a Lag.
• Leads - Consider decomposing (splitting) tasks to a lower level of detail to create logical handoff points. The logical handoff points could then be linked finish-to-start removing the need to use a lead.
Ensure to review and update the duration of each applicable lead and lag during every status cycle.
Things to Avoid
Avoid using lags in place of tasking representing budgeted work.

Lead / Lag Time
Page 58 of 212
Avoid using Lead/Lag to manipulate tasks to meet a certain date. Lags/Leads should be used to represent real work flow requirements versus specific dates.
Related Topics
Task Constraints Task Durations Horizontal Traceability Schedule Visibility Tasks (SVT)
Task Constraints
Page 59 of 212
5.5 - Task Constraints
Manager’s View
Constraints fine-tune a logic-driven schedule by establishing date restrictions based on factors such as component delivery, near term resource availability, or contractual obligations. Used correctly, constraints help reflect realistic and accurate start and finish dates based on the need dates and requirements of a project. Misuse of task constraints in the IMS may have unintended consequences including distortions to float and critical path.
Description
Constraints are restrictions set on the start or finish dates of tasks. These restrictions either establish dates, place conditions on how dates are calculated, and/or affect total float calculations within the schedule. As a result, dates and total float values may calculate differently when performing the forward pass and/or backward pass in a logic network schedule. After assigning logic and duration to all activities in a schedule, their start and finish dates and float values are calculated based on the forward and backward pass through the logic network. The forward pass calculates the Early Start (ES) and Early Finish (EF) dates for all milestones and activities. The backward pass calculates the Late Start (LS) and Late Finish (LF) dates for all milestones and activities. Applying constraints to tasks and milestones in the schedule will impact these network calculations. Early start and early finish dates are the scheduled or forecast dates that reflect when a task or milestone can occur. Late start and late finish dates are the need dates that reflect when a task or milestone should occur to avoid delaying the end of the program, toll gate or major milestone. Total Float is the mathematical difference between an activity's Late Finish Date and Early Finish Date (in work days, based on the calendars applied to the task). Typically, planners/schedulers model tasks to occur as soon as possible, allowing the network logic to determine the earliest and latest dates that tasks can start and finish based on their dependencies and task durations. However, some circumstances often necessitate the need to use constraints in the IMS.
Soft Constraints
Soft constraints allow logic to drive the schedule to the right (i.e. restricts only movement to the left) on the constrained task.
Hard Constraints
Hard constraints do not allow the logic to drive the schedule (i.e. either restricts all movement or restricts movement to the right) on the constrained task. Note on Deadlines/Targets: some tools have constraint options that impact only the backwards pass allowing for the assigning of a deadline or target date. These options are used to help calculate the total float against contract requirements and are not considered hard constraints as the tasks can move to the right.
Example
Refer to the Schedule Calculation Algorithm chapter for examples.
Things to Promote
Use a soft constraint for date dependent activities. Document reasons for using constraints in the schedule

Task Constraints
Page 60 of 212
Use constraints affecting the early dates to reflect resource restrictions Validate that the schedule model contains accurate and complete logic ties with the objective of highlighting and removing unnecessary constraints
Ideally, most tasks in a schedule start and finish as soon as possible so that network logic and planned durations drive the schedule dates. However, there are occasions when constraints should be used. In these cases, the use of constraints should be well documented and not replace well thought out logic.
Soft Constraints
Pay special attention to soft constraints representing accurate dates in the schedule for near-term tasks. Examples of when to use soft constraints are:
• Identifying projected start dates for tasks that are not integrated into the prime schedule (e.g., material deliveries)
• Identifying dates for tasks that need to be scheduled based on other elements or contractor dates (e.g., testing in a shared facility, availability of machinery, availability of funding or resources).
• Identifying projected finish dates for tasks that cannot be completed until other work that is not integrated into the prime schedule is completed (e.g., receiving all necessary user management roles from site prior to completing assignments).
Things to Avoid
Do not use a lag in place of a soft constraint for date-dependent activities.
Do not assume that all scheduling tools handle 'constraints' in the same manner (in terms of how the constraint affects the IMS). Example: in some tools applying an 'As Late as Possible" type constraint to a task will only remove the free float between the task and its direct Successors (i.e., those tasks tied as an immediate successor to the task). In other tools the same application will remove not only the free float between the task and its immediate successors but will also remove all free float in the successor path.
Hard Constraints
Avoid the use of hard constraints, favoring more flexible soft constraints where practical. Hard constraints prevent tasks from being moved by their dependencies and, therefore, prevent the schedule from being logic-driven. If used, reasoning for the need should be documented in the IMS notes or other field defined for that purpose. As a result, the critical path and other analysis may be adversely affected. The use of hard constraints does not support a credible risk assessment and produce unreliable results in a Schedule Risk Assessment (SRA). Instead of hard constraints consider soft constraints for the following reasons:
• Program milestones yield accurate float values throughout the schedule. • Task early dates are always driven by their precedence logic. • Enables the ability to monitor portions of the schedule that are prone to schedule slip by tracking
total float. Related Topics
Schedule Calculation Algorithm Relationships/Logic Lead / Lag Time

Milestones
Page 61 of 212
5.6 - Milestones
Manager’s View
Milestones are specific definable accomplishments or starts in the logic network, recognizable at a particular point in time. Milestones have zero duration and do not consume resources. Milestones may mark the start and/or finish of an interim step, event and/or program phase, making them convenient indicators of attaining program objectives. To ensure Milestones reflect the impact of related task delays or acceleration, programs establish milestone forecast dates through precedence logic.
Description
Program Milestones / Toll-Gate Milestone
Program milestones begin to take on definition during the development of the Integrated Master Plan (IMP) events and are generally defined and imposed upon a program by the customer. These events establish the top-level control points for work scope performance, product development, and product and service definition and are often times identified in the Statement of Work (SOW) or other contractual documents. Typically, an IMS includes a program start milestone and a program finish milestone. The start milestone is used as a predecessor for work that starts at the beginning of a program. The finish milestone is the successor for the end of all logic paths. Milestones identifying major events are also usually included, such as Systems Requirements Review (SRR), Preliminary Design Review (PDR), Critical Design Review (CDR), and Production Readiness Review (PRR). The completion of other major events such as major test events and demonstrations, achieving flight readiness, or first flight, in the case of an aircraft program, may also be incorporated.
Toll-Gate Milestones
Toll-gate milestones often referred to as intermediate or book-end milestones are defined occurrences that constitute the start or completion of work scope and serve as an objective criterion for determining accomplishment. Toll-gate milestones are based on specific program, integrated product team, or performing organization requirements to perform to the defined work scope. These milestones are usually tied to tasks representing major events or program milestones in the IMS.
Example
Program Milestones
Below is an example of typical program milestones included in an IMS (Fig. 5.6-1).
Fig. 5.6-1 Example of typical Program Milestones in an IMS

Milestones
Page 62 of 212
Toll-Gate Milestones An example of a toll-gate milestone (Fig. 5.6-2) is “Consolidated Drawing Package for CDR” and “Consolidated Software Detail Design Package for CDR Complete” tasking. Instead of linking all Hardware and Software efforts directly to Tollgate milestone task 335, the software efforts are “collected” by a Software Tollgate milestone, and Hardware is likewise “collected by a Hardware Tollgate milestone. This clarity reduces the total number of predecessors to the Technical Package for CDR Completed, task 335, in favor of a smaller number whose task name identifies the portion of the IMS leading to the milestone. This clarity facilitates analysis, especially when performing a driving logic path trace to determine the cause of an impacted task.
Fig. 5.6-2 Examples of Toll-Gate Milestone use in an IMS Note: intent on the example (Fig. 5.6-2) is to demonstrate how multiple inputs to a Toll-Gate Milestone may be organized such that schedule analysis is enhanced. In this example, it is clear that of the 2 milestones feeding task 335, that milestone task 333 is being driven by task 330 in the software development area of the IMS.
Optional Techniques
Assign soft constraints that impact the backwards pass to milestones, as appropriate, to enforce the target dates the program commits to supporting. These target dates may align with the baseline finish dates that correlate to contractual dates; or the target dates may be earlier than the baseline dates if program management chooses this approach. This more stringent control enables the team to monitor the total float available by setting earlier constraints and adjusting the constraints in a controlled fashion as necessary.
Things to Promote
Program Milestones: For best visibility, locate major program milestones at the top of the IMS.
Toll-Gate Milestones: Use toll-gate milestones to provide further clarity for logic path ending points. By linking toll-gate milestones to tasks representing major events or program milestones, excessive relationship ties are avoided. Using an excessive number of logical relationships to the same task or milestone complicates schedule analysis. These milestones are convenient reference points for understanding precedence logic traces and determining the completeness of the planning.
Things to Avoid
Program milestones and toll-gate milestones should not be used to represent actual work. Milestones are only reference points used to monitor a program’s progress.

Milestones
Page 63 of 212
Applying soft constraints that impact the backwards pass to milestones without a solid understanding of the scheduling tools business rules, could result in a misrepresentation of task priority and misunderstood impacts to the schedule calculations.
Related Topics
Relationships/Logic Task Constraints Interface Handoff Milestones Horizontal Traceability Vertical Integration & Traceability

Summaries & Hammocks
Page 64 of 212
5.7 - Summaries & Hammocks
Manager’s View
Summary and hammock tasks are both schedule elements designed to represent a roll-up/summary of lower level tasks. If used carefully, these elements provide a very useful capability to communicate the same program schedule data at a very detailed level or at a summary level (for example, for program management use). Note: The business rules around these elements vary between the different scheduling software tools. Schedule management teams need to ensure they understand these rules in order to avoid unintended results in the IMS.
Description
Summary Tasks Summary tasks represent a roll-up or summary of schedule information on a group of tasks including but not limited to duration, labor hours, cost, and dates. Typically, summary tasks represent a group of tasks that are located in the same physical location within the IMS or are part of the same parent Work Breakdown Structure (WBS) element. The methods for establishing summary tasks vary by tool. Hammock Tasks Hammock tasks represent a roll-up or summary of schedule information on a group of tasks including duration and dates. Hammock tasks can represent any group of tasks in the IMS regardless of their physical location or parent Work Breakdown Structure (WBS) element. The methods for establishing hammock tasks vary by tool and are dependent on supporting task logic.
Example
Summary Task
Fig. 5.7-1 Example of a Summary Task in the IMS In this example (Fig. 5.7-1), ‘Pre-Flight Activities’ and ‘Flight Activities’ are Summary Tasks which roll-up duration, dates, labor hours and costs of the tasks below.

Summaries & Hammocks
Page 65 of 212
Hammock Task
Fig. 5.7-2 Example of a Hammock task in an IMS In this example (Fig. 5.7-2), ‘Program Flight Test Series’ is a Hammock Task which rolls-up the duration and dates of the assigned flight test tasks in the IMS, all of which have different Control Accounts
Calculations
Summary tasks roll-up duration, dates, labor hours, and costs. Hammock tasks roll-up duration and dates. In some software tools, Hammock tasks can roll-up additional information about the tasks they are summarizing.
Things to Promote
Understand the business rules of your schedule software tool before attempting to resource load to Summary or Hammock tasks.
Things to Avoid
Use care when creating Hammock tasks as it is possible to introduce error if:
1. the underlying logic between the tasks is missing
2. Changes to start or finish logic to the hammock, either through status updates or schedule execution, may impact the validity of the Hammock
Avoid assigning logical relationships to Summary tasks as this could potentially conflict with the detail schedule relationships under them causing confusion or circular logic.
Hammocks, by definition, should not drive successor logic. Hammocks collect the summarized baseline/forecast finish dates of the tasking in the measurement.
Related Topics
Relationships/Logic Task Duration Schedule Hierarchy Vertical Integration & Traceability

Level of Effort (LOE)
Page 66 of 212
5.8 - Level of Effort (LOE)
Manager’s View
LOE activities are those tasks defined as being of a general or supportive nature and having no measurable output, product or activities for which the attempt to measure progress would be value-added. It is important to ensure that discrete work is not planned as LOE, which earns schedule performance in alignment with the baseline, as it could result in an invalid impact to the IMS model calculations. LOE tasking can be included or excluded from the IMS model as appropriate. However, if LOE tasking is included in the IMS it should be separately identifiable.
Description
Level of effort tasking allows for an allocation of budget across the program period of performance to manage efforts with no measurable output, product, or activity. Schedule performance on these tasks is earned with the passage of time in alignment with the baseline distribution. There can be no schedule variances on LOE tasking. There are pros and cons around including or excluding LOE tasking in the IMS. Including LOE tasking in the IMS allows for a more inclusive total program look at resource distribution, which aids in the maintenance and analysis of program resource distribution. However, if modeled incorrectly, including LOE tasking in the IMS can cause inaccurate total float and critical path calculations. Note: Do not link LOE to discrete tasking.
Optional Techniques
Consider not adding relationships to LOE tasks. As LOE tasks should never drive discrete work, programs may consider removing all logical relationships after the Performance Measurement Baseline is established, alternatively using soft constraints (i.e., Start No Earlier Than) in their place to peg the start to the correct timeframe. If used in this way, the constraint date and durations of the task should be consistent with the baseline Start and baseline duration.
Things to Promote
Tasks planned as LOE in the IMS should be easily and accurately identifiable. This includes populating the appropriate Earned Value Technique field (as applicable) and possibly even identifying the task as LOE in the task description.
During schedule baseline changes (i.e. a re-plan) ensure that you consider the impact of the schedule baseline change on the Level of Effort tasking. As the distribution of resources on these tasks will likely be impacted by the change and are often overlooked.
Resource distribution across an LOE task should be in alignment with the program needs and resource availability and not necessarily simply level loaded.
Consider adding an LOE Completion Milestone to tie all LOE tasking to the end of the program and not link any LOE tasks to discrete tasking.
Ensure that task owners can demonstrate how the time phasing of their LOE tasking relate to the baseline program master schedule.
Things to Avoid
LOE tasking should not be logically tied to drive discrete work. Incorrect logic application on LOE can lead to invalid impacts to the program critical path.

Level of Effort (LOE)
Page 67 of 212
Related Topics
Horizontal Traceability Vertical Integration & Traceability Milestones Intro to Resource and Non-Resource Loaded Schedules Relationships / Logic

Apportioned Effort
Page 68 of 212
5.9 - Apportioned Effort
Manager’s View
The term “Apportioned Effort” is an Earned Value term used to categorize the relationship between a “base” program task or group of tasks and a related “support” effort. Programs can utilize the Apportioned Effort Earned Value Method (EVM) on a “support” task whose performance is always directly proportionate to that of its “base”. Apportioned Effort tasking is somewhat difficult to explain and not widely used in the DOD. Similar to Level of Effort tasks, Apportioned Effort tasks are not required to be in the IMS, but can provide value to the IMS, especially in the area of resource analysis.
Description
In simple terms; Apportioned Effort tasking has a close association of dependence, documented in a consistent manner and at a constant and measurable ratio/factor, to one or more discrete work packages. The use of Apportioned Effort tasking in the IMS is complicated to develop, link, maintain, and status and tends to clutter the management value of these systems. Additionally, the methods used to model Apportioned Effort tasking vary widely from tool to tool. Care should be taken when deciding it is necessary to utilize Apportioned Effort or manage it in the IMS. There are three recommended methodologies to capturing Apportioned Effort tasking in the IMS:
1. Use a Hammock task to represent the “support” Apportioned Effort. In this scenario the Hammock task rolls up or summarizes the status and performance of the “base” task or tasks. (Note: not all tools support effective use of Hammock tasks)
2. Use a normal task to represent the “support” Apportioned Effort. In this scenario the “support” task
is a Start-to-Start Successor of the earliest “base” task. The remaining logic, status, and performance of the “support” task are then manually aligned to match the status and performance of the “base” task or tasks during each status cycle.
3. Use a normal task to represent the “support” Apportioned Effort. In this scenario the “support” task
has no logical relationships. The start, finish, status, and performance are manually aligned to match that of its “base” task or tasks.
Examples
A few of examples of Apportioned Effort include: • Quality Control inspections (support) on fabrication efforts (base)
• In-process SW verification testing (support) on software engineering and design efforts (base)
Thing to Promote
Ensure the status on Apportioned Effort tasking (i.e. “support”) always mirrors the status of the “base” tasking. Document the program’s Apportioned Effort methodology in the IMS Supplemental guidance. Ensure that all relevant government and contractor stakeholders understand the program’s Apportioned Effort methodology. Ensure the Program Controls team understands in detail how Apportioned Effort tasking is managed in the respective scheduling and earned value tools and systems.

Apportioned Effort
Page 69 of 212
Thing to Avoid
Apportioned Effort tasking cannot drive or force a critical or driving path, but may coincide on the critical or driving path along with its associated base task.
Related Topics
Horizontal Traceability Vertical Integration & Traceability Baseline Change Management
Working Calendars
Page 70 of 212
5.10 - Working Calendars
Manager’s View
Calendars specify when work on a program can and cannot be done by identifying the work hours for each workday, the workdays for each week, and exceptions, such as holidays. Calendars present the available work periods, working days and times of the day that tasks can use to determine start and finish dates based on the task duration and resource load where applicable. Calendars may be established for programs, tasks, and resources, and may be applied to leads and lags, depending on the scheduling tool. Calendars are of significant importance to program managers because schedules will incorrectly represent forecasted work if calendars are used inappropriately.
Description
Project Calendars
Project calendars identify working days and hours for entire programs and usually represent a program’s typical schedule. Days off, such as company holidays, should be specified. In addition, other nonworking times may be indentified to reflect periods when the entire team will be working on non-program activities, such as company meetings.
Task Calendars
Task calendars define the working and nonworking days and times for tasks. A single calendar may be applied to all the tasks in a program or customized calendars may be applied to specific tasks that will not follow the default work schedule, such as working 24 hours a day for seven days a week on testing tasks.
Resource Calendars
Resource calendars ensure that work resources (people and equipment) are scheduled only when they are available for work. They affect a specific resource or category of resources and can be customized to show individual schedule information, such as vacations, leaves of absence or equipment maintenance time and indicate the quantity of specific resources available as a function of time. Calendars may be assigned using default calendars or custom calendars.
Default Calendars
Default calendars define the usual working and nonworking periods for tasks or resources. Examples of nonworking periods include lunch breaks and weekends. Most tasks use the default program calendar to determine their start and finish dates. A program calendar is typically based on an eight hour workday, Monday through Friday, 40 hour workweek, and recognizes company holidays as non-work days. However, some programs have special work schedules, such as a four day work week, which may be chosen as the default calendar.
Customized Calendars
Customized calendars are unique calendars representing conditions identifying workdays and hours that are different from the default standard calendar to more accurately reflect available working and nonworking periods for these circumstances. They determine how tasks and resources are scheduled regarding these specific conditions. For example, customized calendars may reflect working Saturdays for the next two months or working two ten-hour shifts, seven days per week for a focused period. In addition, holidays may vary widely between a program team comprised of multiple companies or contractors that need to be indentified using customized calendars.

Working Calendars
Page 71 of 212
Multiple Calendars
It is important to address the pros and cons of using a single calendar versus using multiple calendars. Single file with multiple calendars Be advised that applying different calendars to tasks in the same schedule may result in some date and duration calculations providing mixed values and making analysis more complex. For example, tasks with different calendars that are on the same logical path, in most cases, will have different total float values. Tasks using a five workdays per week calendar might have negative five days of total float and tasks using a seven workdays per week calendar might have seven days of negative total float. Both sets of tasks have one week of negative total float when measured against their respective calendars. Note: Ensure that the schedule management team understands the software tool’s business rules around working calendars. This is because there is an order of precedence in place in regards to multiple calendars. Typically, the order of precedence is… #1. Program Calendar #2. Task Calendar #3. Resource Calendar Multiple schedule files being consolidated into a single schedule While adding precision to the IMS, there is added complexity that needs to be addressed and attended to when consolidating multiple schedule files into a single file. The individual responsible for consolidation should be aware of the different calendars in use and determine how to best integrate these.
Calculations
Tasks with durations and logic translate into dates based on the calendars that provide the dates that are available for scheduling. Milestones are zero based points in time, determined by precedence logic and / or constraints and utilize applicable calendars to reflect their dates and related time-based calculated values. When using durations, other than elapsed durations, only working days are used to populate start and finish dates based on their assigned calendars. Elapsed durations ignore the calendar’s non-working days and populate start and finish dates based on both working and non-working days. All time-based calculations use applicable calendars in determining their related values. These data items include start, finish, early start, early finish, late start, late finish, baseline start, baseline finish, actual start, actual finish, free float, total float, start variance, finish variance, and resource related work, assignment allocation, and delay fields. Calendars used in different time zones may also cause issues and need to be resolved. This condition may exist when performing work at different geographical locations.
Optional Techniques
All tasks and milestones need a calendar assigned but the number and complexity of calendars used in a schedule is discretionary.
Things to Promote
Review and validate calendars on a regular basis to ensure accuracy. Ensure configuration control is in place to avoid problems that can occur if calendars are not carefully managed. Otherwise, date and duration calculations could be incorrect.

Working Calendars
Page 72 of 212
Use calendars as part of what-if scenario techniques. Include calendar definitions in the IMS Supplemental Guidance. Have calendars available in a format that is accessible and readable by all program personnel (i.e., a spreadsheet). The added benefit of maintaining calendars in a spreadsheet in similar format is that it simplifies the import of calendar information into schedule software tools. Ensure that the IMS uses the appropriate calendars to cover all of the program needs.
Things to Avoid
The complexity and number of calendars should not exceed the program’s knowledge or ability to properly manage and validate the use of calendars.
Related Topics
Relationships / Logic Task Durations IMS Supplemental Guidance

Schedule Calculation Algorithm
Page 73 of 212
5.11 - Schedule Calculation Algorithm
Manager’s View
The schedule calculation algorithm uses activity variables configured in the IMS model to calculate dates and float values. Your scheduling professionals should have a solid working knowledge of the algorithm to help facilitate schedule analysis.
Description
Scheduling tools calculate activity date and float values based on an algorithm that progresses forward and backward through the IMS network, applying stepwise calculations as it moved through the network. The algorithm takes into consideration the following variables in its calculations…
• Calendars (project, task, and resource non-working day calendars) • Logical Relationships (i.e. Predecessors & Successors) • Lag & Lead (i.e. negative lag) • Activity Duration • Activity Constraints • Timenow (in scheduling software tools that enforce Timenow)
Calculations
Forward Pass: calculates the earliest possible Start and Finish Dates for every activity in the IMS network. Backward Pass: calculates the latest possible Start and Finish Dates for every activity in the IMS network. Total Float: the algorithm calculates total float by taking the delta between an activity’s Late Finish Date and Early Finish Date (in work days, based on the calendars applied to the task). Free Float: calculated by taking the delta between an activity’s Early Finish Date and Early Start Date of the earliest starting successor task of an activity.
Soft Constraints: allow the logic to drive the schedule (i.e. restricts only movement to the left) on the constrained task. Hard Constraints: do not allow the logic to drive the schedule (i.e. either restricts all movement or restricts movement to the right) on the constrained task. Program, Task, and Resource Calendars: calendars changes affect both the forward and backward pass.
Example
Here are a few representative examples (Fig. 5.11-1 through 5.11-4) showing how different schedule variables have an impact to the schedule calculation algorithm.
Fig.5.11-1 Example demonstrating the impact of a Deadline in a schedule
In the scenario above (Fig. 5.11-1), a deadline is used to apply an impact to the backwards pass while allowing the schedule to accurately project forecast dates.
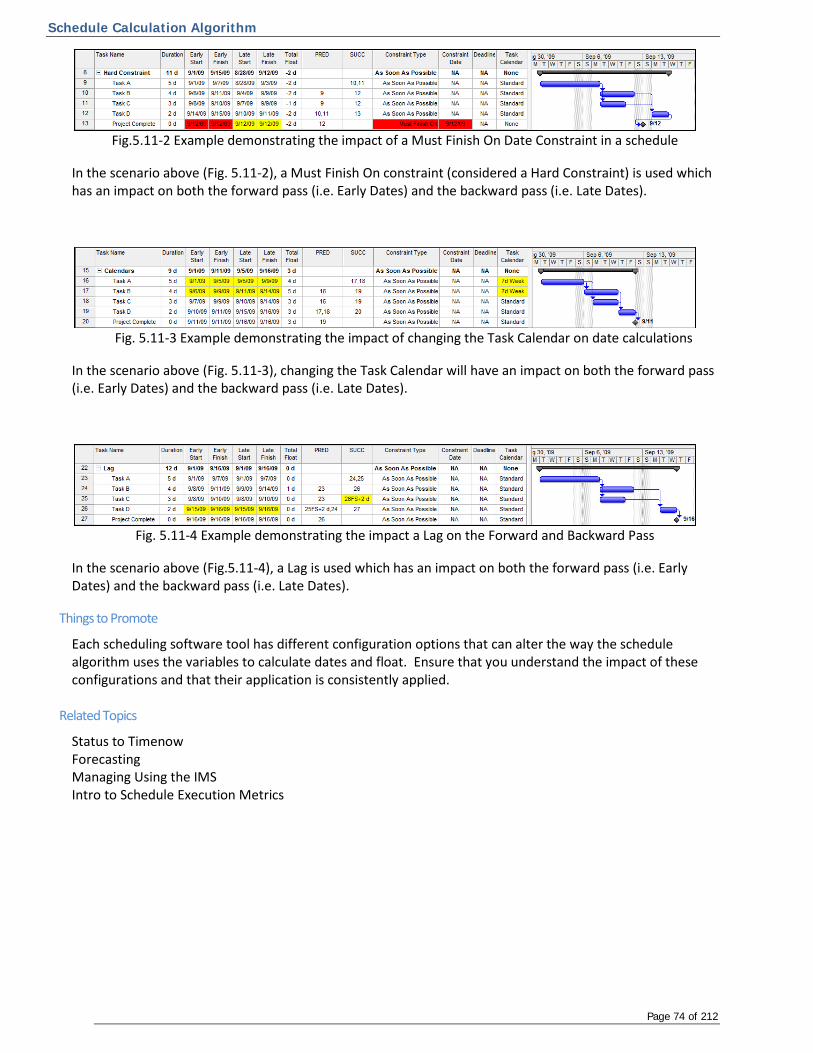
Schedule Calculation Algorithm
Page 74 of 212
Fig.5.11-2 Example demonstrating the impact of a Must Finish On Date Constraint in a schedule
In the scenario above (Fig. 5.11-2), a Must Finish On constraint (considered a Hard Constraint) is used which has an impact on both the forward pass (i.e. Early Dates) and the backward pass (i.e. Late Dates).
Fig. 5.11-3 Example demonstrating the impact of changing the Task Calendar on date calculations
In the scenario above (Fig. 5.11-3), changing the Task Calendar will have an impact on both the forward pass (i.e. Early Dates) and the backward pass (i.e. Late Dates).
Fig. 5.11-4 Example demonstrating the impact a Lag on the Forward and Backward Pass
In the scenario above (Fig.5.11-4), a Lag is used which has an impact on both the forward pass (i.e. Early Dates) and the backward pass (i.e. Late Dates).
Things to Promote
Each scheduling software tool has different configuration options that can alter the way the schedule algorithm uses the variables to calculate dates and float. Ensure that you understand the impact of these configurations and that their application is consistently applied.
Related Topics
Status to Timenow Forecasting Managing Using the IMS Intro to Schedule Execution Metrics
Schedule Margin
Page 75 of 212
5.12 - Schedule Margin
Manager’s View
There is an increased emphasis on execution to schedule resulting from both the government’s initiatives on affordability and the overall changing economic climate. As such, program management teams are expected to deliver their programs on time, on target, and on cost. One optional technique available to these program management teams is the establishment of schedule margin within the IMS. Program teams can establish schedule margin by creating a buffer prior to an end item deliverable or any contract event. The time allotted in this buffer can be used to offset unforeseen issues identified during program execution.
Description
Program teams should follow the following guidelines when using Schedule Margin:
• Schedule Margin should be represented in both the Baseline and Forecast schedules
• Schedule Margin should be controlled by the Program Manager
• When represented as a task, Schedule Margin should be clearly labeled as “Schedule Margin” in the Task Name/Description.
• Schedule Margin should be placed as the last task/activity or gap before a contract event or end item deliverable.
Things to Promote
Ensure that Schedule Margin tasks/activities or gaps are taken into consideration during resource, staffing, and EAC planning. Ensure that the impact of Schedule Margin tasks/activities or gaps is taken into consideration when executing to and analyzing the program IMS. Zero out all durations on Schedule Margin tasks during Schedule Risk Assessments. Ensure there is a comprehensive and well understood process for managing Schedule Margin that is understood by all applicable members of the government and contractor program teams. Ensure that the Schedule Margin management process and rationale for Schedule Margin durations are documented in the IMS Supplemental Guidance.
Things to Avoid
Avoid abandoning the concept of using Schedule Margin in an OTS scenario. It is equally applicable in both normal program execution and OTS situations.
Related Topics
Program Management Using the IMS Schedule Acceleration Baseline Change Management Baseline versus Forecast

Cost & Schedule Resource Integration
Page 76 of 212
6.0 - Cost & Schedule Resource Integration
This section contains the following chapters…
6.1 - Intro to Cost & Schedule Resource Integration
6.2 - Resources in the Schedule
6.3 - Resources Not in the Schedule

Intro to Cost/Schedule Resource Integration
Page 77 of 212
6.1 - Intro to Cost/Schedule Resource Integration
The following chapters define methods of handling resources as they relate to the IMS. The content includes an explanation of maintaining resources in an IMS using both native fields (i.e. scheduling tool’s standard resource fields) and static/non-native fields (i.e. static, fields defined by the user). Additionally, a third method of handling resources outside of the IMS, by maintaining traceability and integration via external tools and processes, is discussed.
This guide recommends the following order of preference between the different methods of handling resources as they relate to the IMS…
#1. Resources in the Schedule (native field method)
#2. Resources in the Schedule (static/non-native field method)
#3. Resources not in the Schedule
This order of preference is based on the inherent value that carrying resources within the IMS brings to IMS update, maintenance and analysis, activity ownership, and cost/schedule integration. However, this order of preference in no way implies a lack of compliance or capability with any of the aforementioned methods.
In all three methods, to ensure Cost/Schedule integration, dates from the IMS should be imported into the cost tool for resource spreading.

Resources in the Schedule
Page 78 of 212
6.2 - Resources in the Schedule
Manager’s View
Cost/schedule integration is a process that links cost and schedule system data to ensure traceability and consistency between the systems. Cost/schedule integration is a key factor to program success as it helps to ensure reporting of consistent and accurate program performance, (including EV Metrics and program forecasts). Additionally, maintaining resources in the schedule helps the program team reconcile staffing requirements and ensure that all work is accounted for in the IMS.
The key components to cost/schedule integration are:
1. Time phasing of BCWS in the cost system is within the baseline period of performance (start and finish dates) in the IMS for the applicable Control Accounts, Work Packages, and Planning Packages.
2. Earned Value performance claimed and the ETC (Estimate to Complete) period of performance is traceable between the IMS and the Cost System
3. Resource categories and quantities match between the IMS and the Cost System (when resources are maintained in the IMS).
Description
Maintaining resources in the IMS is recommended, but not required. It enhances the ability to more accurately model the program’s forecast and increases the analysis capability of the IMS. This includes the ability to quickly compare task duration and related resource requirements (including skill mix and quantity) to validate task achievability. Resource visibility also provides insight to the amount of resources required to complete a task. This gives insight to each task’s significance in comparison to the other tasks in the IMS. When resources are physically maintained in the IMS, it can serve as a single control point for cost/schedule integration. Additionally, it enables the automation of data transfer from scheduling systems to EVM Systems which eliminates redundant effort and/or human error in the data transfer.
Native Field Method
This method of resource loading uses native schedule fields to capture and time phase resource information. The resource pool defined in the scheduling system contains descriptive information for each resource. The quantity of resources are defined when resources are assigned to schedule activities. Resources defined to an appropriate category level provide insight for available skill-related quantities. The scheduling system time phases the quantity of resources based on user input (level spread, curve codes, delays, or manual phasing).
This approach streamlines the resource loading process by eliminating the need for additional software tools and/or manual processes to time phase resource quantities.
Analysis benefits of this method include:
• Integrated capability to validate potential impacts or opportunities of resource availability on the schedule
• Staffing profiles are easily generated from the scheduling tool for all or portions of the program plan

Resources in the Schedule
Page 79 of 212
• Real time resource alignment for recovery or what-if schedule modeling is available (existing resource time phasing moves with the schedule activities)
Note: Programs should ensure they understand the implications on cost/schedule integration due to potential differences in start/end dates between IMS monthly calendars and fiscal calendars utilized in EVM Systems. If the scale of the data in the IMS is not equivalent or relatable to fiscal months then an accurate comparison of time phased data between the IMS and cost system cannot be performed. However, if resources are loaded at the work package level in the IMS, then the work package totals in the IMS should reconcile with the work packages totals in the cost system.
Static/Non-Native Field Method
This method of resource integration uses static fields that are defined by the user (text, number, or other fields) to capture resource information (both description and quantity) for each task. Resource quantities are time phased outside of the scheduling system, the time phasing is still required to be aligned with the schedule dates. This method separates the resource calculations from the schedule date calculations in the scheduling tool.
The benefit of using this method versus not maintaining resources in the schedule is that some, albeit limited, resource information is available in the IMS for analysis of potential impacts or opportunities and does provide a degree of magnitude visibility for tasks.
The disadvantage of this method is the required use of additional software tools and/or manual processes to time phase resource quantities and additional verification steps to ensure cost/schedule integration.
Note: As this method provides only rudimentary cost/schedule integration analysis, it is not considered resource loading by all customers.
Example
Native Field Method
Typical fields include: -Resource Name -Non-Labor Costs (i.e. Material or ODC) - Optional -Work in Hours -Start & Finish (Baseline & Early Dates)
Fig. 6.2-1 IMS Resource Example from Native Field Method

Resources in the Schedule
Page 80 of 212
Fig. 6.2-2 Baseline Staffing Profile View Example from Native Field Method
Static/Non-Native Field Method
Typical fields include: -Resource Name -Non-Labor Costs (i.e. Material or ODC) - Optional -Work in Hours -Start & Finish (Baseline & Early Dates)
Fig. 6.2-3 IMS Resource Example from Static/Non-Native Field Method
Category Native Method Static/Non-Native Method
Resource Graphs Yes No
Resource Time Phasing Yes No
Duration vs. Resource Comparison (Task Level) Yes Yes
IMS vs. Cost System Resource Comparison Yes Yes
Fig. 6.2-4 Comparison resource analyses available in the IMS (native vs. static)
Calculation
Native Field Method
The fundamental calculation for most scheduling tools uses the same base components: activity duration, total resource quantity, and incremental quantity (time phasing) calculated against an identified calendar (task or resource). The specific implementation in each scheduling tool and calculation implications are different. It is important that the resource calculation related business rules and settings used in each scheduling application are understood and applied appropriately at the task and resource levels.
Resources in the Schedule
Page 81 of 212
Static/Non-Native Field Method
As this method captures resource information in static fields, it does not utilize any resource calculations in the schedule tool.
Things to Promote
Include both labor (hours) and non-labor elements (unburdened costs) in resource planning. This allows managers to compare labor/cost reports from the IMS, which are typically available earlier than cost reports, and make better informed decisions.
Align resource requirements with resource availability to assure an achievable schedule.
Ensure that Estimates to Complete (ETC) are consistent with the forecasted IMS. This will require manual assessment and adjustments if using the static/non-native method because the static fields will not update as the forecast schedule changes.
Use the same non-working calendar (holidays and weekends) in the IMS and the cost system to ensure traceability between the systems.
Ensure that the program uses a consistent planning and resourcing approach for ODC, material and LOE tasking.
In the native field method, if BCWS is captured in the baseline IMS, the BCWS spread should align between the cost and schedule systems if both systems are using the same fiscal and manpower calendar.
The resource pool should be designed prior to program planning to ensure adequate level of detail for the program is available and consistent across the program.
Things to Avoid
Avoid updating the resource assignments directly in the cost tool. Resources assignments should be updated in the IMS and then imported into the cost tool.
Redundant and unused resources in the resource pool will complicate resource planning and deconfliction in the native field method.
When planning, take care when using logic to resolve resource conflicts. Using logic to model resource constraints can over complicate the schedule network, especially if the resource relationships are not thoroughly documented. Scheduling systems typically provide alternate methods to represent resource constraints, such as a Leveling Delay or the use of constraints impacting the early dates.
Avoid planning resources on schedule milestones (zero day duration). Scheduling systems may or may not prevent this. Resource efforts should only be planned and/or forecasted where time is planned and/or forecasted. Common pitfall to avoid is receipt of purchased material, when the receipt milestone (zero day duration) activity contains the resource for material costs. These types of activities should be one day in duration to reflect the accrual of the material and to accommodate resource planning.
Avoid planning resources in the IMS by name. Although accurate it typically requires excessive maintenance to handle project staffing changes.

Resources in the Schedule
Page 82 of 212
Use great care when transmitting schedule data to appropriately sanitize rates and factors from the IMS as necessary to protect proprietary information. Note: It is optional to include labor or material rates and factors in the IMS.
Mechanically, most scheduling software can accommodate summary level resource planning. However, if not carefully implemented, it may cause duplications in the resource plan. Resource planning on summary tasks may also complicate resource balancing and resource analysis.
Avoid over allocating personnel by assuming they can work on the program at full capacity (i.e. 8 hours/day) without considering things like vacation, sick time, and corporate training requirements.
Related Topic
Intro to Cost/Schedule Resource Integration Resources Not in the Schedule Working Calendars Status to Timenow Horizontal Traceability Vertical Integration & Traceability

Resource Not in the Schedule
Page 83 of 212
6.3 - Resources Not in the Schedule
Manager’s View
The Integrated Master Schedule (IMS) is an important element of a company's Cost/Schedule management process. Regardless of whether a schedule has resources included, it should facilitate resource analysis and drive resource needs and mitigations. In schedules without resources, the resource information is only physically contained native in the cost tool.
Description
When resources are not included in the schedule, resource quantities are time-phased outside of the scheduling system, but must align with IMS dates. While personnel resources are not loaded into the IMS, resource planning is essential to the development of a credible, executable program plan. It is therefore important that the IMS and the Basis of Estimates (BOEs) be tightly coupled, during the proposal process, and the IMS and control account plans be tightly coupled during execution. The IMS provides the time phasing of tasks against which resources are planned. The program team needs to consistently review the BOEs and/or control account plans to ensure that this correlation is maintained and it is recommend the IMS dates are imported in the cost tool. In non-resourced schedules, the IMS activities are mapped to the work package. This is accomplished by establishing a field in the IMS with identifiers for each task so that it is relatable to the work package. As the resources are not resident within the IMS it is necessary to look outside of the scheduling system to ensure an appropriate time-phased workload. Note: When using a schedule without resources, you can still maintain a system where cost and schedule is integrated. However, the ability to use the IMS as the standalone, interactive tool for resource analysis is diminished.
Example
Fig 6.3-1 Resources not In the IMS, example IMS with Work Package identifiers
Things to Promote
Continual monitoring to ensure tight coupling of IMS tasks and work packages is maintained. Continual evaluation of resources planning changes for potential impact to IMS credibility. Ensure that Latest Revised Estimates (LRE) and Estimates to Complete (ETC) are consistent with the forecasted IMS.

Resource Not in the Schedule
Page 84 of 212
Things to Avoid
Manual processes for time phasing of resource quantities and verification of cost schedule integration as it is prone to human error.
Related Topics
Intro to Cost/Schedule Resource Integration Resources Not in the Schedule Working Calendars Status to Timenow Horizontal Traceability Vertical Integration & Traceability

External Schedule Integration
Page 85 of 212
7.0 - External Schedule Integration
This section contains the following chapters…
7.1 – Subproject/External Schedule Integration
7.2 – Interface Handoff Milestones
7.3 – Schedule Visibility Tasks (SVT)

Subproject/External Schedule Integration
Page 86 of 212
7.1 - Subproject/External Schedule Integration
Manager’s View
Some Program Integrated Master Schedules consist of multiple stand-alone IMS components, integrated to represent the total work scope of a program effort. These components typically consist of the prime contractor (i.e. the company holding the original contract award from the customer) schedules, as well as customer or subcontractor schedules. Together, these schedules represent the total amount of work scope for the program, including the associated risks and opportunities. To ensure that the IMS provides program management with a comprehensive view of the remaining work and an accurate assessment of current schedule performance, programs can integrate external schedules into the detailed IMS. The approach depends on complexity and risks associated with the external effort. Creating tasks to represent the external work or including interface milestones may be appropriate in situations where the risk or complexity is low. However integrating the external schedule in its entirety is the most comprehensive approach and may be more suitable for high risk or complex schedules. Regardless of method employed, accurate, timely schedule data reflecting relationships between supplier and prime tasks, ensure the necessary visibility to all stakeholders.
Description
Integration of external schedules in their entirety requires a disciplined process between the organizations involved to ensure the seamless incorporation of the subcontractor and prime contractor schedules. This process starts with the contractual flow down of detailed scheduling requirements to the subcontractor to ensure the following:
1. The data submitted is in an acceptable format and includes all necessary fields. Although it is not a requirement that a common scheduling tool be utilized, it is necessary to define the expected data fields, format, calendars, business rhythm, resourcing, and tool settings/options (as appropriate) to facilitate exporting and importing the schedule data between tools.
2. Preferably, status dates are consistent between the prime contractor and supplier schedules. If the
subcontractor’s schedule update is to a different point in time it could potentially affect the IMS analysis results. If it is not possible to have consistent status dates between the various schedule elements then implement, and ensure all parties support, a strict process of managing the impacts of the update differences.
3. Change control procedures are established and understood. The prime contractor should clearly
communicate which type of schedule changes will require pre-approval before incorporation and which type will require coordination only or documentation upon submittal. The lack of a disciplined change control process can result in disconnects between the prime contractor and subcontractor’s schedule.
4. Clearly communicate expectations regarding schedule quality to the subcontractor. In addition,
implement a process for conducting quality checks prior to submittal to avoid rework and delays during the integration process.
If the prime and subcontractor are using a common scheduling tool, integrate the subcontractor’s schedule by including their file in the master IMS. If using different tools integrate the subcontractor’s schedule by exporting it to a data file and then importing it into the detailed IMS. Once the data is integrated, establish the relationships between the prime contractor and subcontractor schedules.
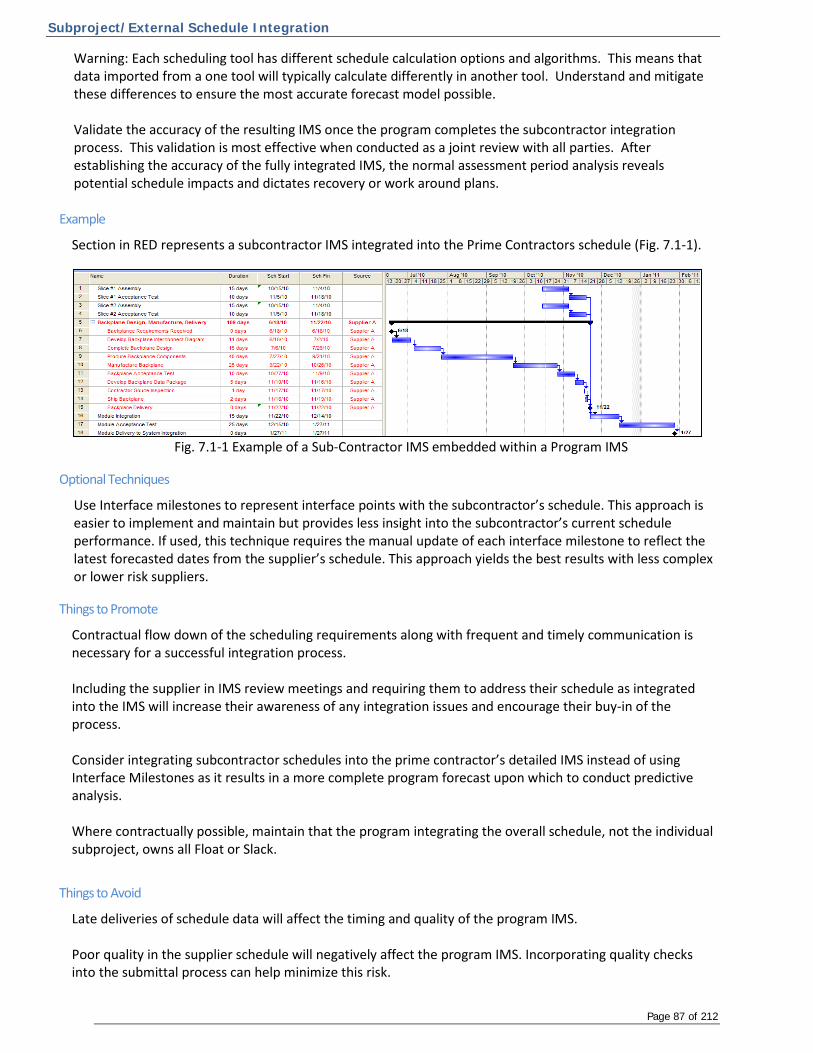
Subproject/External Schedule Integration
Page 87 of 212
Warning: Each scheduling tool has different schedule calculation options and algorithms. This means that data imported from a one tool will typically calculate differently in another tool. Understand and mitigate these differences to ensure the most accurate forecast model possible.
Validate the accuracy of the resulting IMS once the program completes the subcontractor integration process. This validation is most effective when conducted as a joint review with all parties. After establishing the accuracy of the fully integrated IMS, the normal assessment period analysis reveals potential schedule impacts and dictates recovery or work around plans.
Example
Section in RED represents a subcontractor IMS integrated into the Prime Contractors schedule (Fig. 7.1-1).
Fig. 7.1-1 Example of a Sub-Contractor IMS embedded within a Program IMS
Optional Techniques
Use Interface milestones to represent interface points with the subcontractor’s schedule. This approach is easier to implement and maintain but provides less insight into the subcontractor’s current schedule performance. If used, this technique requires the manual update of each interface milestone to reflect the latest forecasted dates from the supplier’s schedule. This approach yields the best results with less complex or lower risk suppliers.
Things to Promote
Contractual flow down of the scheduling requirements along with frequent and timely communication is necessary for a successful integration process. Including the supplier in IMS review meetings and requiring them to address their schedule as integrated into the IMS will increase their awareness of any integration issues and encourage their buy-in of the process. Consider integrating subcontractor schedules into the prime contractor’s detailed IMS instead of using Interface Milestones as it results in a more complete program forecast upon which to conduct predictive analysis. Where contractually possible, maintain that the program integrating the overall schedule, not the individual subproject, owns all Float or Slack.
Things to Avoid
Late deliveries of schedule data will affect the timing and quality of the program IMS. Poor quality in the supplier schedule will negatively affect the program IMS. Incorporating quality checks into the submittal process can help minimize this risk.

Subproject/External Schedule Integration
Page 88 of 212
An inadequate change control process or a large volume of changes can make it difficult and very time consuming to integrate the supplier’s schedule.
Related Topics
Horizontal Traceability Interface Handoff Milestones Status to Timenow Forecasting Schedule Visibility Tasks (SVT)

Interface Handoff Milestones
Page 89 of 212
7.2 - Interface Handoff Milestones
Manager’s View
The integration of external schedules (subs / suppliers / government items etc.) via interface handoffs milestones into the program’s IMS provides insight as to the relationship of an external performer to the overall program. This method ensures external impacts to the program are represented in the program IMS.
Description
External performers often introduce risk to programs. One method of providing visibility into the potential impact of external performer’s schedules is by the use of interface handoff milestones. These milestones typically represent a significant delivery or receipt-date. This type of integration is not ideal as it only allows for limited visibility to external schedules, but it is an expedient means by which managers can determine if issues exist. Characteristics
1. Provides limited, but consistent visibility of impacts
2. Provides the ability to monitor challenges to supplier commitments
3. Allows for schedule integration
4. Does not allow for complete risk modeling
5. Only by analysis of the external performer’s detailed IMS can schedule impacts be identified early. Monitoring of interface milestones will provide limited data and typically necessitate additional information to effectively mitigate problems.
Example
The following example (Fig. 7.2-1) shows an Interface Handoff Milestone identifying a Backplane Delivery from a supplier linked into the logic network. In this example, the start constraint on the Interface Handoff Milestone would match the forecast finish date provided by the supplier (or in the best case, in the supplier’s IMS). In this case, the supplier delivery would cause a break in the “Integration and Test” process and the management team would likely desire to work with the supplier to try and bring the delivery back into the right.
Fig 7.2-1 Example of an Interface Handoff Milestone
Optional Techniques
Reference the Managing/Integrating External Schedules for alternative methods of representing external dependencies in the programs IMS model.

Interface Handoff Milestones
Page 90 of 212
Things to Promote
Work with major subcontractors to coordinate the fidelity and frequency of schedule submittals. Once the schedules are integrated, feedback from the program detail schedule should be communicated back to all stakeholders (including subcontractors).
Ensure that the implications of Timenow misalignment between the program IMS and the external IMS are understood and mitigated.
Interface handoffs should not only represent external dependencies driven from external sources but also tie points from the program IMS to external sources.
When modeling Risk, consider a technique whereby the Interface Handoff Milestone may be re-defined to a task with duration (temporarily) to capture the most likely/ least likely durations (correlating to the most likely/least likely dates) for delivery of the item.
Typically, the Interface Handoff Milestone represents deliveries from external sources. As such, programs should validate that the resulting delivery date, captured in the program IMS as an Interface Handoff Milestone with a soft constrained Start Date, is accurate and driven by sound logical relationships from the external sources’ schedule.
Consider flagging/coding interface handoff milestones to facilitate schedule maintenance and analysis.
Consider adding intelligence into the name/description and/or a code field for Interface Milestones. Examples of this could include pre-pending the name with REC (for receive milestones) or DEL (for delivery milestones) and EXT (for external outside the program team) or INT (for internal inside the program team).
Ensure the program’s methodology of integrating external efforts into the IMS is consistent with contractual obligations.
Related Topics
Subproject/External Schedule Integration Schedule Visibility Tasks (SVT) Schedule Hierarchy

Schedule Visibility Tasks (SVT)
Page 91 of 212
7.3 - Schedule Visibility Tasks (SVT)
Manager’s View
Schedule Visibility Tasks (SVTs) represent effort that is not part of the budgeted program scope, but that is related to and may potentially impact program tasks. By modeling these dependencies as tasks, SVTs may provide increased management visibility to items otherwise represented as lag or constrained milestones.
Description
Schedule Visibility Tasks (SVTs) are tasks with no resources assigned whose duration is greater than zero. They are included in the IMS to characterize potential impacts to the logic driven network. Typically, these unbudgeted tasks represent external scope that is not part of the PMB. They may also depict tasks, such as Government Furnished Equipment (GFE), Customer Furnished Equipment (CFE), capital equipment, hardware shipping spans, “Wait” times or “Scheduled Maintenance” times for equipment or government activities such as review of submitted CDRL items per the contract. Note: Do not use SVTs as zero-budget work packages.
Example
The following example (Fig. 7.3-1) shows an SVT used to capture Vendor lead-time
Fig. 7.3-1 Example of the use of an SVT to capture Vendor Lead Time
Optional Techniques
An alternative to this type of task is the use of a lag to represent the equivalent elapsed time or an Interface Handoff/drop milestone to represent an external dependency. If the IMS uses lags or Hand-off milestones instead of Schedule Visibility Tasks (SVT), it is important to ensure that task owners validate their durations during each status period. Additionally, ensure that task owners appropriately document the lag in the IMS to support an increased understanding of the IMS workflow during schedule analysis.
Things to Promote
Clearly identify SVTs either by using "SVT" in the name/description or identifying in a code field. (Note: ensure to de-conflict with usage of SVT as System Verification Test). Schedule Visibility Tasks should have task owners and have their status updated at the same time, using the same process as other IMS activities. Document the use of SVT tasking in the IMS Supplemental Guidance.
Things to Avoid
Avoid misuse to ensure proper status at necessary intervals. If mapped to control accounts or WBS elements, they may introduce discrepancies in the period of performance between the IMS and the Earned

Schedule Visibility Tasks (SVT)
Page 92 of 212
Value database, specifically if the task with no resources is at the beginning or end of the control account or WBS. SVT’s are not part of the Performance Measurement Baseline (PMB). Use care to avoid period of performance conflicts between the IMS and the Performance Measurement Baseline due to using SVT tasks. Document these effects such that they are explainable during audits. Avoid misuse (i.e. designating a budgeted in-scope effort as an SVT task) and ensure proper status at necessary intervals.
Related Topics
Interface Handoff Milestones Horizontal Traceability Subproject/External Schedule Integration

Horizontal & Vertical Traceability
Page 93 of 212
8.0 - Horizontal & Vertical Traceability
This section contains the following chapters…
8.1 - Horizontal Traceability
8.2 - Vertical Integration & Traceability
8.3 - Task Coding

Horizontal Traceability
Page 94 of 212
8.1 - Horizontal Traceability
Manager’s View
Horizontal traceability refers to the logical relationships and time-phasing between tasks and milestones from the project start to finish. It includes predecessor and successor relationships and “hand-offs” within and across the various schedule sections (e.g., control accounts, Integrated Product Teams, WBS elements, etc.). When a schedule is properly built and maintained, sound horizontal traceability helps the PM during execution to ensure schedule predictability for completing key deliverables and events.
Description
Horizontal traceability is the ability to trace the network logic from project start to finish through the IMS precedence or successor relationships. If the schedule can be traced horizontally, relationships are in place to determine the work flow and aid in assessing schedule impacts as work progresses and conditions change. Being horizontally traceable, however, is not a simple matter of making sure that each task has a predecessor and successor. Instead, tasks should be linked to their most appropriate predecessors and successors based on required inputs and outputs. Horizontal integration also demonstrates that the overall schedule is planned in a rational, logical sequence that accounts for interdependencies. At a minimum, the network logic includes all discrete work (including detailed tasks, work packages and planning packages) and provides a means for assessing interim progress and forecast completion through the key events, deliverables, and the program finish.
Benefits of networking Effective horizontal traceability ensures that nothing in the schedule improperly restricts starts and finishes and that the entire network is constructed of logically tied and progress driven effort determining remaining duration. Provides correct order of execution A properly networked schedule reflects a logical flow of task execution to accomplish the technical work scope. This flow provides the basis for critical path analysis, a method for identifying and assessing schedule priorities and mitigating impacts. Aids in predictability The schedule’s predictability is directly related to how complete and valid the network logic and duration estimates are in a schedule. Missing or incorrect logic ties increase the difficulty in assessing future performance for in achieving key deliverables and target dates. Linking within a Control Account Control Accounts have identified, specific work products usually requiring a sequence of several related tasks to accomplish or deliver the products. Linking the tasks within a control account provides a logical sequence or work flow. Tasks dependent on another work product are linked as a successor to the appropriate related task. Control accounts have clear start and finish tasks or milestones that span the control account period of performance. Linking between Control Accounts Products accomplished in one control account often provide inputs or support to tasks in other control accounts (or other schedule sections). Since the network logic is developed at the task level, the predecessor task will be in one control account and the successor task will be in another control account thereby creating the hand-off dependency. Handoff dependencies should be task-to-task. Consider a repeatable process for such linkage between control account tasks.
Horizontal Traceability
Page 95 of 212
Program / Tollgate Milestones The predecessors of a Program Milestone should represent the inputs (detailed work or events) required to complete prior to starting or finishing the milestone. The successors of a Program milestone should represent the outputs or detailed work that may start or finish only upon completion of the milestone.
At times, many detailed tasks may need to be linked to these Program milestones. To reduce the number of logic ties, “toll-gate” milestones may be used. These are milestones placed throughout the schedule in key points where a collection of tasks end and new work begins. Examples are creating a toll-gate milestone named “IPT X Ready for CDR” for each IPT that provides inputs to the CDR event. If there are five IPTs, then the five IPT toll-gate milestones are ultimately linked to the same CDR Conduct milestone or Event Milestone, thereby ensuring horizontal integration through CDR.
Identifying logic path that results in a product, deliverable or end item Detailed tasks on the same logic path should represent the efforts required to achieve a certain product, deliverable or end item. Whenever possible, use current and repeatable logic block templates to help accelerate schedule development and to promote repeatable quality.
Reverse planning; an approach for ensuring horizontal integration To ensure the correct tasks are linked to a product, deliverable, end item, or event, trace and validate the predecessors starting from the deliverable and following the predecessor path towards the beginning of the network path. In other words, start at the deliverable and work through the predecessor chain reviewing all the predecessors for accuracy. All the predecessor tasks should be delivering a work product that benefits the endpoint. Remove logic from non-essential or unrelated tasks along the logic path and link them elsewhere as appropriate.
Review of logic When the initial effort to establish all the relationships between tasks is completed, a review of the network logic is conducted until the program team agrees it is accurate. Revising logic is an iterative process, depending on how the logic is reviewed and agreed upon. Given that relationships often reach across areas of responsibility, changes to logic in one control account may affect the tasks in another control account and require that the affected parties reach agreement regarding the relationship. Logic reviews should start at the lowest levels of complexity, then up through the schedule. For example, start with each CAM to review control account logic, then meet with groups of CAMs or IPTs to review interdependencies, then review logic with the systems engineer / chief engineer / production manager; and, lastly with the program manager.
Networking meeting (or Linking Party /Wall walk) One method of reviewing the network logic is for everyone involved in the planning to attend a network meeting, or “Linking Party.” Task owners are the vital participants in this meeting ensuring network accuracy and completeness. The meeting format may vary depending on the size of the schedule. Larger programs may print sections of the IMS logic network diagram and attach them to a conference room wall for review. This allows task owners to review and collectively discuss the information and make comments and corrections during the discussion. Smaller programs may project the schedule as a presentation and make the suggested changes real time until reaching consensus. Critical Path/Driving Path check Validate the Critical Path and Near Critical Path to the end of the program, then the Driving and Near Driving Paths to key program milestones with the program team (Refer to the Critical and Driving Path methods & Analysis Chapter for more information).
Calculations
Refer to the Schedule Calculation Algorithm chapter for details on horizontal traceability factors into total float, free float, early/late dates, etc.

Horizontal Traceability
Page 96 of 212
Optional Techniques
The section above describes several options for establishing horizontal traceability. The approaches will vary depending on the size and complexity of the program and whether there are many CAMs, IPTs, or suppliers. Additionally, the scheduling tools or approaches may vary depending on whether the program team uses only one scheduling tool, stand-alone schedules, or multiple files and whether the data is always integrated or is updated periodically via merging or linking multiple schedule files.
Things to Promote
Ensure the use of early date constraints is necessary and avoid using them in place of accurate schedule logic between tasks and milestones. Document the use of early date constraints in the IMS. Appropriate uses of early date constraints include but are not limited to the following: near term tasks when known starts are more accurate than the predecessor logic, inputs driven from sources external to the IMS, and to reflect the impact of people, equipment or facility resource constraints.
Ensure that external schedule dependencies (i.e. subcontractors) are taken into consideration when assessing and validating the horizontal integration of an IMS. See the Subproject/External Schedule integration section for more information.
Employ attention to network logic when performing network status updates and baseline maintenance. Modify logical relationships to accurately reflect the current program path forward and resolve out-of-sequence status conditions.
As discussed in the Forecasting chapter; validate and update the program’s network logic during each update cycle to ensure it matches the current program workflow and execution strategy.
Things to Avoid
Linking for convenience If there is no real logical relationship between two tasks then avoid selecting a predecessor task that has a completion date immediately before a task is supposed to begin. The convenient predecessor task has no relationship to the task in need of a predecessor. This inaccurate linking will affect the accuracy of assessing the impacts of schedule changes and likely require revisions to the network logic.
Redundant links Identify all required relationships but avoid redundant ties (Fig. 8.1-1). These are unnecessary and add confusion to understanding and analyzing the logic network. As you identify redundant links, remove them.
Fig. 8.1-1 Example or redundant relationships, which may need to be removed
In this example (Fig. 8.1-1), task 247 has both 245 and 246 as predecessors. In this case, the link of 245 to 247 is redundant and can/should be removed.
Logic ties to summary tasks Avoid assigning logic relationships at the Summary Task level as this may have unintended consequences on its subtasks and their logic relationships to tasks outside the Summary. It is also difficult to analyze the
Horizontal Traceability
Page 97 of 212
schedule when sorting detail tasks if the logic exists at the Summary Task level. Assign predecessors and successors at the detail task level.
Open Ended Tasks Activities or tasks created without predecessors or successors have what is called “open ended logic.” Fundamentally, although a start-to-start successor is proper and sometimes useful, it is not sufficient to avoid dangling logic. With dangling logic, risk in activities will not automatically cascade down to their successors when updating schedule status or forecasts. Sound horizontal traceability is crucial during Schedule Risk Assessments when activity durations are changed iteratively. Without this logic, the simulation will not be able to identify the correct dates and critical path. When resolving open-ended tasks, ensure that the resulting logic accurately reflects the task work flow and inter-relationships. Logic ties to Level of Effort Avoid assigning logic relationships between discrete and level of effort tasking as this can result in a miscalculation of the program’s workflow and critical path. Refer to the LOE topic within the guide for the appropriate methodologies of modeling LOE in the IMS.
Related Topics
Critical & Driving Path Analysis Vertical Integration & Traceability Schedule Architecture Relationships / Logic Subproject/External Schedule Integration Task Constraints

Vertical Integration & Traceability
Page 98 of 212
8.2 - Vertical Integration & Traceability
Manager’s View
Vertical Integration & Traceability is defined as having demonstrable compatibility between the baseline, actual, and forecast dates, status, and work scope requirements at all levels of schedule detail. This type of schedule integration is imperative to its credibility and ensures completeness of the technical, cost and schedule baseline. Vertical Integration & Traceability demonstrates that the schedule has precedence logic supporting program milestones where lower level detail tasks determine impacts to these milestones. Program milestones reflect the sequence of program execution and provide focus, identifying schedule drivers and impacts to those Milestones by following the Critical Path/Driving Path, providing an understanding of key events and whether desired program end-states will be met. Vertical Integration & Traceability also demonstrates the use of key technical information in planning the schedule, indicating alignment with documents such as the Statement of Work (SOW), Work Breakdown Structure (WBS), and the Integrated Master Plan (IMP). The detail tasks have codes relating the work efforts to these technical source documents.
Description
Vertical Integration & Traceability occurs when data element relationships between the detailed IMS activities and various requirements and structural elements are captured to ensure the technical, schedule and cost baselines demonstrate traceability to, and consistency with one another. Vertical Integration & Traceability is achieved when work products are fully integrated during the initial schedule development. Vertical Integration & Traceability should be maintained during program execution (throughout the life of the program) to ensure the integrity of the work product integration, necessary to provide a comprehensive and complete Performance Management Baseline.
Program schedules should exhibit Vertical Integration & Traceability of dates between the various levels of schedules: Summary Master Schedule, Intermediate Level Schedule, and Detailed Schedule. In addition, the detailed schedule should be vertically traceable to the various requirements and structural elements detailed here:
IMP The IMP is an event based plan that provides a breakout of the work required to accomplish each Event and to successfully complete the program. The IMS is aligned with the IMP. Tasks and milestones in the IMS are directly traceable to IMP events and criteria when an IMP is used to develop the IMS structure. The IMP decomposes the program into:
• Program Events - summarizes the program at "tier one" level milestones • Significant Accomplishments – summarizes the statement of work at "tier two". • Accomplishment Criteria - defines the exit criteria for each accomplishment.
Reference the IMP overview in the Schedule Architecture section for additional information. SOW/SOO The Statement of Work (SOW) and Statement of Objectives (SOO) are formal documents that capture and define the work activities, deliverables and timeline a vendor will execute against in performance of specified work for a customer. The SOW/SOO provides insight to data that should be included in the IMP and the IMS. Detailed requirements for pricing are usually included in the SOW/SOO, along with standard regulatory and governance terms and conditions. It identifies tasks to be completed and states required performance outcomes. It provides the basis for planning the product’s functionality, characteristics, and attributes. The contractor or subcontractor uses the SOW to expand the WBS to lower levels of detail and

Vertical Integration & Traceability
Page 99 of 212
to develop the IMS. The SOW paragraph and WBS elements are directly traceable to IMS tasks/activities and contractual delivery dates. TRD When a Technical Requirements Document (TRD) is part of the Program Technical Baseline, one should also maintain traceability between the TRD sub-sections and the IMS tasking. Ensuring all TRD requirements are traceable to IMS tasking reinforces the concept that the entire scope of the program has been addressed in the IMS. It also identifies when those TRD requirements are expected to be closed, providing Risk Register status visibility to the current state of identified Risks and Opportunities. Ensure that an appropriate TRD sub-level is identified as the point of maintaining traceability to avoid driving the IMS to an unmanageable level of detail. CLIN As applicable, effort within a Contract Line Item (CLIN) in the IMS should be vertically traceable to the relevant CLIN in the contract. This includes cost, technical, and schedule requirements specific to the CLIN. CDRL The Contract Data Requirements List (CDRL) identifies the data items to be developed and delivered on a specific procurement or program. The CDRL provides contractor guidance for preparation and submitting of reports, including reporting frequency, distribution, formatting, and tailoring instructions. All discrete and non-recurring CDRLs should be traceable to detailed IMS tasks/activities. Note: On subcontract efforts, this is referred to as a Subcontract Data Requirements List (SDRL) which carries the same Vertical Integration & Traceability requirements. OBS The Organization Breakdown Structure (OBS) is a functionally oriented division of the contractor’s organization established to perform work on specific contract. Each control account (see control account section below) is associated with a specific single organizational component in the OBS. Each IMS activity/task is assigned and traceable to one Control Account within the OBS. WBS The Work Breakdown Structure (WBS) is a product oriented hierarchical decomposition of the work to be executed on the program. The WBS is derived from the SOW and provides a common framework for the natural development of the overall planning and control of a contract. It is the basis for dividing work into definable increments from which the IMS can be established. Each IMS task/activity is assigned and traceable to one WBS element.
Control Account The Control Account (CA) is a management control point where scope, budget, actual cost, and schedule are integrated to facilitate effective program management via cost/schedule planning, execution, and performance analysis. Control accounts are the lowest point of the WBS where assignment of work responsibility is given to a Control Account Manager (CAM). Each discrete IMS task/activity with resources is assigned and traceable to only one Control Account. Work Package A Work Package (WP) represents a segment of a Control Account’s work scope. The WP is broken out into an IMS task or set of tasks to create the schedule activities and schedule milestones required to complete the work package deliverable. With the exception of SVT tasking, each IMS task/activity is traceable to one WP. Note: Planning Packages (PP) represent future efforts that are not yet detail planned to one or more WPs. PPs carry the same IMS traceability requirements as WPs.

Vertical Integration & Traceability
Page 100 of 212
Lower Level Schedules/Steps/Inchstones/Quantifiable Backup Data (QBD) Lower level schedules, inch-stones, or steps are the lower level items required to achieve completion of IMS tasks/activities. They can reside inside or outside of the IMS model and have a period of performance that aligns with the Work Package they support. If used to quantify performance during schedule status update, then inch-stones or steps are referred to as Quantifiable Backup Data (QBD). These QBD documents may be known as Manufacturing Build Process Sheets, Objective Indicator Milestone Plans, Apportioned Effort Plans, CAM Objective EV Plans, etc. Quantifiable Backup Data (QBD’s) do not have to contain a period of performance when used solely to calculate task progress. QBD elements can be accomplished in any order. Schedule Hierarchy In order to facilitate the needs of many different stakeholders, programs maintain multiple levels of schedule hierarchy. Program teams define the information necessary at each level to aid in the use of the schedules as an effective and efficient communication vehicle. The dates between each level of the schedules should be vertically traceable but do not necessarily need to reside in the same “file” or tool.
Schedule Hierarchy is as follows:
• Level 1 – Summary Master Schedules • Level 2 – Intermediate Schedules • Level 3 – Detailed Schedules
Example
The following example (Fig. 8.2-1) demonstrates on a handful of elements (not an all inclusive list) how IMS coding can be used to maintain and validate Vertical Integration & Traceability.
Fig. 8.2-1 Example of IMS coding to support Vertical Integration & Traceability
Things to Promote
Detail Level Schedules - Ensure that the level of detail in the IMS is sufficient to capture the key workflow handoffs in primarily Finish-To-Start relationships types. This ensures the most accurate IMS model possible as the finish of detailed tasks drive the start of their succeeding work. It is recommended that Quantifiable Backup Data (QBD) be managed under an established control process in the IMS Supplemental Guidance document. Reconciliation of Vertical Integration & Traceability should be conducted throughout the life cycle of the program and not just during program start-up. Review all pertinent parts of Section L in the proposal to understand the order of precedence between statements found in the Contract, SOW/SOO, CDRL documents, TRD and other program supplied documents.

Vertical Integration & Traceability
Page 101 of 212
Ensure buy-in for all levels of the project schedule by having all affected stakeholders participate in the schedule review process.
Things to Avoid
Producing an inaccurate picture of the program schedule that is not vertically traceable to the IMS and the elements listed in this section.
Related Topics
Horizontal Traceability Standard Modeling Techniques Rolling Wave Planning Baseline Change Management

Task Coding
Page 102 of 212
8.3 - Task Coding
Manager’s View
An effective and controlled task coding process is essential to ensuring the horizontal and Vertical Integration & Traceability of the IMS model. Additionally, sorting, filtering and grouping program data is an integral part of data analysis and usability for program personnel at all levels. Capturing essential data leads to smart decision-making and helps Program Managers get a better handle on the current status of the program. Sorting data helps to quickly visualize and understand the data, organize and find significant data, and ultimately facilitates more effective decision making. In addition, using a standardized naming convention is fundamental to schedule architecture in order to optimize the time the program team spends building, maintaining, analyzing, and reporting on the IMS.
Description
Task coding captures and maintains reference information related to a specific task in predefined IMS data fields. It provides data for sorting, filtering and grouping tasks which enhances the ability to analyze the schedule and facilitates Vertical Integration & Traceability. Most Common Traceability Elements The following table contains a list of common data fields used to provide traceability and enhance the capability to sort, group, and filter schedule information. Activity Owner (Control Account Manager) Multi-Project Unique Identifier Planning or Work Package Identifier Government Furnished Equipment / Information Integrated Product Team (IPT) Integrated Master Plan Identifier Organizational Breakdown Structure (OBS) Earned Value Technique Work Breakdown Structure (WBS) Earned Value Percent Complete Statement of Work (SOW) Paragraph Physical (Scope Based) Percent Complete Schedule Visibility Task (SVT) Identifier Schedule Margin Code Control Account Identifier Contract Line Item Number (CLIN) Fig 8.3-1 Common Traceability Elements Custom Fields for Organizing Data Different stakeholders may request specific additional data fields to be included in the IMS model. The reason for this additional data is to support the organization of the IMS data using these fields as filtering and sorting parameters. Data is broken down into groups in order to make it easier to read, understand and analyze. It also enables delivery of only the data needed by the user.

Task Coding
Page 103 of 212
Example
In this example (Fig. 8.3-2), we see three tasks coding fields populated with data (CAM, CWBS, IPT).
Fig 8.3-2 Example of coding fields and their use on IMS tasks In this example (Fig. 8.3-3), we see the IMS filtered to only show tasks with CWBS = 1.1.6.5b
Fig 8.3-3 Filtered IMS to display only CWBS=1.1.6.5b
In this example (Fig. 8.3-4), we see the IMS grouped by CAM.
Fig 8.3-4 Example of an IMS Grouping
Things to Promote
Capture task coding in specific fields in a data dictionary. See the IMS Supplemental Guidance chapter. All changes affecting the predefined data fields need to be captured in the Integrated Master Schedule and maintain consistency with all authorizing documents. Minimize data entry errors by documenting source documents for code fields (e.g., the Responsible Assignment Matrix (RAM) or WBS Dictionary might contain the CA, CAM, WBS, SOW, and even IMP fields in one place) and by building in data validation into the schedule maintenance and baseline change processes.

Task Coding
Page 104 of 212
Early in the IMS architecting phase, the program team should identify required schedule management reports prior to creating the IMS. This will help to facilitate the creation of task coding necessary to support schedule management report generation for the program.
Things to Avoid
Avoid disconnects in vertical and horizontal traceability between the IMS and the authorizing documents and program structures. See the Vertical Integration & Traceability and Horizontal Traceability chapters.
Related Topics
Vertical Traceabilty Horizontal Traceability Submittal of IMS Data Task Naming Convention

Schedule Maintenance
Page 105 of 212
9.0 - Schedule Maintenance
This section contains the following chapters…
9.1 - Statusing
9.1.1 - Status to Timenow
9.1.2 - Forecasting
9.1.3 - Schedule Acceleration Techniques
9.1.4 - Estimate at Completion (EAC)
9.2 - Baseline Maintenance
9.2.1 - Baseline Change Management
9.2.2 - Rolling Wave Planning

Statusing
Page 106 of 212
9.1 - Statusing
This section contains the following chapters…
9.1.1 - Status to Timenow
9.1.2 - Forecasting
9.1.3 - Schedule Acceleration Techniques
9.1.4 - Estimate at Completion (EAC)

Statusing to Timenow
Page 107 of 212
9.1.1 - Statusing to Timenow
Manager’s View
On a recurring basis (i.e. weekly, biweekly, or monthly) the IMS is updated to capture performance and reflect adjustments to the forecast. The frequency of status is important to consider as it clarifies the program position and priorities in addition to identifying issues requiring mitigation that would go unnoticed had the schedule not had its status updated. On most programs, the recommended IMS status frequency is weekly or biweekly. Timenow, also known as the status date or data date, is simply the date that the IMS considers as “today”. This date is commonly aligned with accounting system End-Of-Month closeout dates. Everything to the left of Timenow actually occurred and is in the past; everything to the right of Timenow has yet to occur and is in the future. It is essential that the IMS status be consistent with Timenow to ensure accurate forecast dates.
Description
During the status process, task-owners status all tasks that occurred within the status window. Additionally, they validate and correct the logical relationships, remaining durations, and constraints of future tasks. The IMS Guide’s section entitled “Forecasting” covers the validation and correction of future tasks. Task owners answer the following five questions during the status process for each of their applicable tasks:
1. If the task started, when did it start? a. Capture this date in the IMS as the Actual Start Date.
2. If the task did not start, when will it start?
a. This date represents the new Forecast/Early Start Date. Capture this date in the IMS by adding a missing predecessor or the forecasted start date (as a constraint)..
3. If the task finished, when did it finish?
a. Capture this date in the IMS as the Actual Finish Date.
4. If the task did not finish, how much duration is required to finish it?
a. This date represents the new Forecast/Early Finish Date. Capture this date in the IMS by adjusting the task’s Remaining Duration.
Or b. Capture this date by entering the Forecast Finish Date and letting the tool calculate the
remaining duration. (Note: not all tools allow this method of statusing)
5. What is the Percent Complete of the task?
a. Capture this element in the IMS as the Percent Complete.
Note on Percent Complete. There are a number of different Percent Complete fields available for use within all scheduling systems. They include Percent Complete values that indicate percentages of duration, work (hours), earned value, and scope. It is important that the program understand the differences between

Statusing to Timenow
Page 108 of 212
these values, how they are calculated, and update the correct Percent Complete values during the status process.
Example
In this example (Fig. 9.1.1-1), Task 1 has not started and is sitting to the left of Timenow (Forecast in Past – ERROR). This results in an inaccurately forecasted XYZ CDR date of 2/25/10. The status update is corrected to align with Timenow, resulting in a now accurate forecast relative to the XYZ CDR date of 3/12/10 9 (Forecast in Past – Correction).
Fig 9.1.1-1 Impact of improper forecast update in the IMS
In this example (Fig. 9.1.1-2), Task 4 has an Actual Finish date sitting to the right of Timenow (Actuals in the Future – ERROR). This results in an inaccurately forecasted XYZ CDR date of 2/25/10. This status information, corrected to align with Timenow, results in a now accurately forecasted XYZ CDR occurring on 1/29/10 (Actuals in the Future – Correction).
Fig. 9.1.1-2 Impact of inaccurate Actual Start to Time Now and the Estimate to Complete (ETC)
In this example (Fig. 9.1.1-3), Task 7 has Remaining Duration sitting to the left of Timenow (In-process Activity – ERROR). This results in an inaccurately forecasted XYZ CDR date of 2/25/10. The status, corrected relative to Timenow, resulting in a now accurately forecasted XYZ CDR date of 3/8/10 (In-process Activity – Correction).
Fig. 9.1.1-3 Impact of Remaining Duration to the Left of Timenow
Note: Some scheduling software tools automatically enforce Timenow and therefore would not exhibit the errors depicted in these examples. Ensure that the schedule management team understands the business rules of their scheduling tool and that their status process works in concert with the tool’s capabilities.

Statusing to Timenow
Page 109 of 212
Calculations
For in-process tasks… • Timenow – Actual Duration = Actual Start • Timenow + Remaining Duration = Forecasted Early Finish
Optional Techniques
In some circumstances, task owners may necessitate the splitting of in-process tasks.
Things to Promote
Ensure that at least one of the schedule status cycles coincides with the accounting month end to ensure consistency of Earned Value calculation and reporting. If your scheduling tool does not enforce Timenow, then follow a process that ensures the schedule status is consistent with Timenow. Programs should status the IMS as frequently as possible. However, assess and report Earned Value performance in accordance with contractual and internal requirements. Status frequency should be consistent with programmatic needs. Schedule management teams should ensure they thoroughly understand and consistently apply the calculation options within the scheduling tool. Use the level of detail in the IMS as a variable in determining the appropriate status frequency. During the status process, to properly reschedule a task that did not start inside the status window, first ensure the task is not missing predecessors before applying a constraint. Validation of status should include the verification of actual costs in the current period to support opening or closing of a task. Status change in the absence of actual costs is often indicative of a need for a labor transfer due to inaccuracies in labor charging.
Ensure that the methodology for planning and progressing material in the IMS is consistent with the company’s process for handling material accrual and/or vouchering. Ensure the program culture supports and enforces accurate and executable status updates. If task owners inaccurately capture task performance or model their tasking in a way that is likely not executable than the analysis of the IMS may lead to incorrect program management decisions.
Things to Avoid
Avoid status updates to the out-of-sequence tasks without correcting the out-of-sequence task relationships to reflect the correct and current task workflow. Avoid common status update errors (for example, tasks 100% complete without actual dates or tasks updated inconsistent with Timenow).
Related Topics
Forecasting Critical & Driving Path Analysis Schedule Calculation Algorithm Duration Based vs. Scope Based Percent Complete

Forecasting
Page 110 of 212
9.1.2 - Forecasting
Manager’s View
During each status period, the program addresses all tasks forecasted to occur with-in the status window. It is equally important, however, that the program team also validates and updates the not started and in-process tasks in the IMS. Forecasting is the process of validating the durations and logical relationships of not started and in-process tasks. It may also include a refresh of estimated resource needs. Forecasting ensures the IMS contains the most up to date information, is executable, and accurately represents the program position and priorities.
Description
The following table (Fig. 9.1.2-1) contains a list of schedule quality control steps used by program planners, task owners, and program leadership during the “forecasting” process to validate that the IMS is accurate and executable.
Schedule QC Item Description Schedule Health Assessment
Perform iterative health assessments throughout the status and forecasting processes to identify and resolve potential errors to the IMS structure (refer to the Schedule Health Assessment chapter in this guide).
Duration Check Validate that the remaining durations are accurate and executable by using past performance on like tasks as a basis for comparison (refer to the Task Durations chapter in this guide). Compare the duration-based percent complete with the scope- based percent complete on in-process tasks (refer to the Duration-Based vs. Scope Based Percent Complete chapter in this guide).
Logic Check Validate that the logical relationships on future tasks are accurate (refer to the Relationships/Logic chapter in this guide). Ensure that the “givers” and “receivers” agree to the schedule and product fidelity of expected handoffs. Analyze lags and leads to ensure they are accurate (refer to the Lead / Lag Time chapter in this guide). Remove redundant and unnecessary logical relationships. Correct out of sequence logic errors. Resolve any circular logic errors (or loops). Note: some schedule software tools resolve circular logic errors at time of input. Other software tools display calculation errors and others may not display any indication of an error until you attempt to close the file, at which time it may advise you of a loop error. In this case, the only indication one will see is that the IMS does not re-calculate the IMS after each task change.
Resource De-confliction
Analyze key resources (i.e. people, places, and things) to identify and mitigate requirement overlaps.
Resource Estimates To ensure accurate Estimate to Complete calculations it is important to ensure that the IMS contains the most current resource estimates available.
Bow Wave Analysis Identify bow waves created by task owners “kicking the can” and pushing tasks into the next status period as this often results in an unachievable forecasted schedule (refer to the Schedule Rate Chart chapter in this guide).
Critical / Driving Path Analysis
Perform critical and driving path analysis to the program end and interim milestones (refer to the Critical/Driving Path Analysis chapter in this guide). Validate that the resulting paths are accurate. Analyze and mitigate impacts to the required contractual/target dates by utilizing schedule accelerations methods (refer to the Schedule Acceleration chapter in this guide).
Schedule Margin Analyze the calculated schedule margin to interim and program end milestones and mitigate any unacceptable impact by using schedule acceleration techniques (refer to the Schedule Acceleration Techniques chapter in this guide).
Management Check Validate that all appropriate management stakeholders concur with the

Forecasting
Page 111 of 212
forecasted schedule prior to completing the forecasting process (refer to the Program Schedule Reviews chapter in this guide).
IMS to Lower level Schedule Status Check
Validate that the IMS Status is in alignment with lower level schedules, as applicable (including inchstones, steps and Quantifiable Backup Date (QBD’s))
Historical versus Forecast Rate of Accomplishment Check
Compare the historical versus the forecasted rates of accomplishment from multiple sources (including schedule rate charts (S-Curves), BEI, SPI, Shop Floor outputs, etc.) to identify delta’s between historical and forecasted completions. The forecasted IMS may be inaccurate if the forecast plan suggests a rate of accomplishment that is significantly higher than the program has achieved historically.
Fig. 9.1.2-1 Quality Control Checks to Validate Status Updates
Example
Below are two representative examples that demonstrate the benefits of a robust “forecasting” process.
In this example (Fig. 9.1.2-2), the task owner knows that he has lost a resource and that Task 11, “Prepare for XYZ CDR”, is going to take longer than the IMS currently represents. As this task was not in the status window the duration was not updated which results in an inaccurately forecasted XYZ CDR date of 3/8/10.
The forecast start date, corrected to include this duration increase, resulting in a now accurately forecasted XYZ CDR date of 3/22/10.
Fig. 9.1.2-2 Example of an inaccurate forecast on a task outside of the current Status Window
In this example (Fig. 9.1.2-3), the task owner knows that as long as subcontractor CDRs are complete that Task 14 “Prepare for XYZ CDR” can occur in parallel with Task 13 “Conduct XYZ System Detailed Design”. As this task was not in the status window, the logic was not updated, resulting in an inaccurately forecasted XYZ CDR date of 3/8/10.
The forecast, corrected to include this logic change, resulting in a now accurately forecasted XYZ CDR date of 2/22/10.
Fig. 9.1.2-3 Example of a status that is missing a Logic Update outside of the Status Window
Things to Promote
Ensure the schedule management team understands and consistently applies the configurable schedule calculation options.

Forecasting
Page 112 of 212
Things to Avoid
Avoid artificially breaking logic or reducing durations to “maintain schedule”.
Related Topics
Status to Timenow Critical & Driving Path Analysis Schedule Calculation Algorithm Estimate at Completion (EAC) Duration Based vs. Scope Based Percent Complete
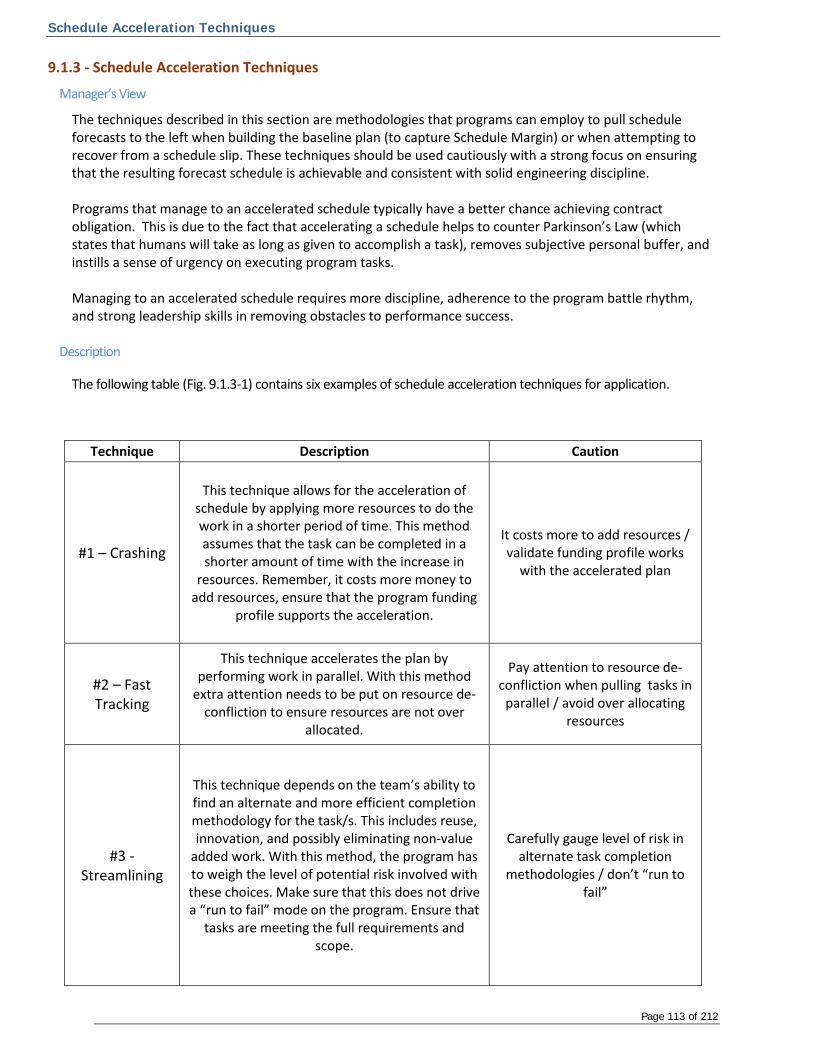
Schedule Acceleration Techniques
Page 113 of 212
9.1.3 - Schedule Acceleration Techniques
Manager’s View
The techniques described in this section are methodologies that programs can employ to pull schedule forecasts to the left when building the baseline plan (to capture Schedule Margin) or when attempting to recover from a schedule slip. These techniques should be used cautiously with a strong focus on ensuring that the resulting forecast schedule is achievable and consistent with solid engineering discipline. Programs that manage to an accelerated schedule typically have a better chance achieving contract obligation. This is due to the fact that accelerating a schedule helps to counter Parkinson’s Law (which states that humans will take as long as given to accomplish a task), removes subjective personal buffer, and instills a sense of urgency on executing program tasks. Managing to an accelerated schedule requires more discipline, adherence to the program battle rhythm, and strong leadership skills in removing obstacles to performance success.
Description
The following table (Fig. 9.1.3-1) contains six examples of schedule acceleration techniques for application.
Technique Description Caution
#1 – Crashing
This technique allows for the acceleration of schedule by applying more resources to do the work in a shorter period of time. This method assumes that the task can be completed in a shorter amount of time with the increase in
resources. Remember, it costs more money to add resources, ensure that the program funding
profile supports the acceleration.
It costs more to add resources / validate funding profile works
with the accelerated plan
#2 – Fast Tracking
This technique accelerates the plan by performing work in parallel. With this method
extra attention needs to be put on resource de-confliction to ensure resources are not over
allocated.
Pay attention to resource de-confliction when pulling tasks in
parallel / avoid over allocating resources
#3 - Streamlining
This technique depends on the team’s ability to find an alternate and more efficient completion methodology for the task/s. This includes reuse, innovation, and possibly eliminating non-value
added work. With this method, the program has to weigh the level of potential risk involved with these choices. Make sure that this does not drive a “run to fail” mode on the program. Ensure that
tasks are meeting the full requirements and scope.
Carefully gauge level of risk in alternate task completion
methodologies / don’t “run to fail”
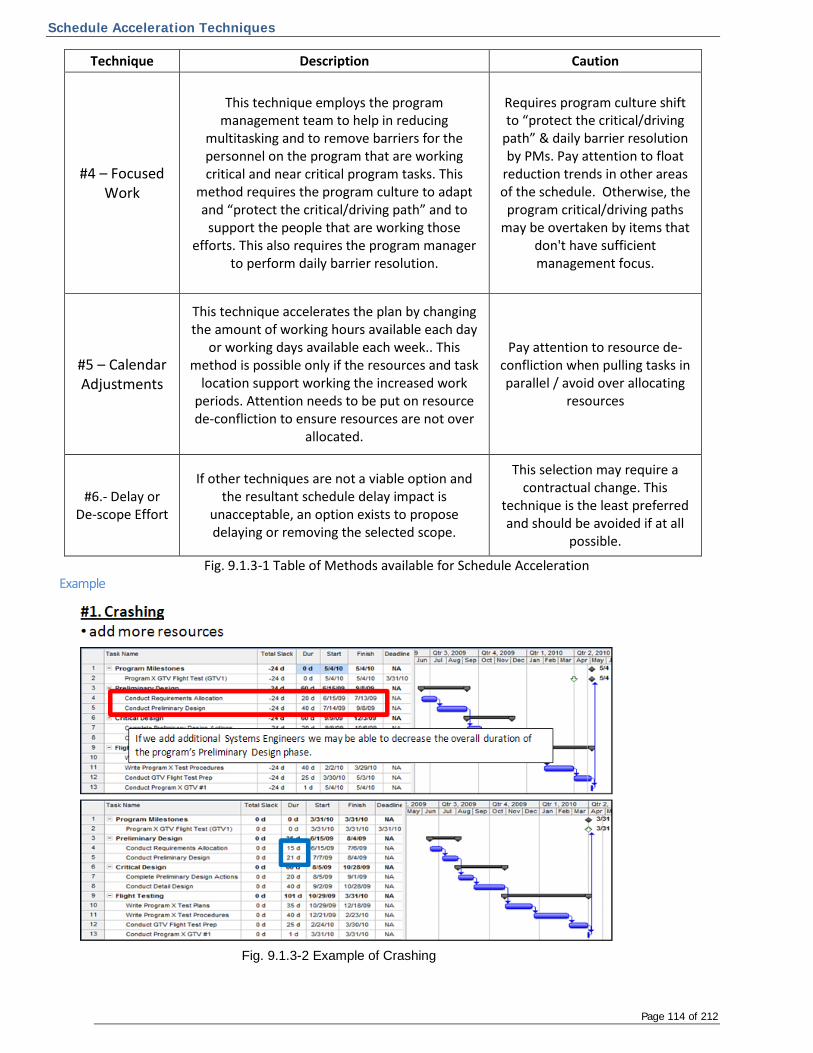
Schedule Acceleration Techniques
Page 114 of 212
Technique Description Caution
#4 – Focused Work
This technique employs the program management team to help in reducing
multitasking and to remove barriers for the personnel on the program that are working critical and near critical program tasks. This
method requires the program culture to adapt and “protect the critical/driving path” and to
support the people that are working those efforts. This also requires the program manager
to perform daily barrier resolution.
Requires program culture shift to “protect the critical/driving
path” & daily barrier resolution by PMs. Pay attention to float
reduction trends in other areas of the schedule. Otherwise, the
program critical/driving paths may be overtaken by items that
don't have sufficient management focus.
#5 – Calendar Adjustments
This technique accelerates the plan by changing the amount of working hours available each day
or working days available each week.. This method is possible only if the resources and task
location support working the increased work periods. Attention needs to be put on resource de-confliction to ensure resources are not over
allocated.
Pay attention to resource de-confliction when pulling tasks in parallel / avoid over allocating
resources
#6.- Delay or De-scope Effort
If other techniques are not a viable option and the resultant schedule delay impact is
unacceptable, an option exists to propose delaying or removing the selected scope.
This selection may require a contractual change. This
technique is the least preferred and should be avoided if at all
possible.
Fig. 9.1.3-1 Table of Methods available for Schedule Acceleration Example
Fig. 9.1.3-2 Example of Crashing

Schedule Acceleration Techniques
Page 115 of 212
Fig. 9.1.3-3 Example of Fast Tracking
Fig. 9.1.3-4 Example of Streamlining
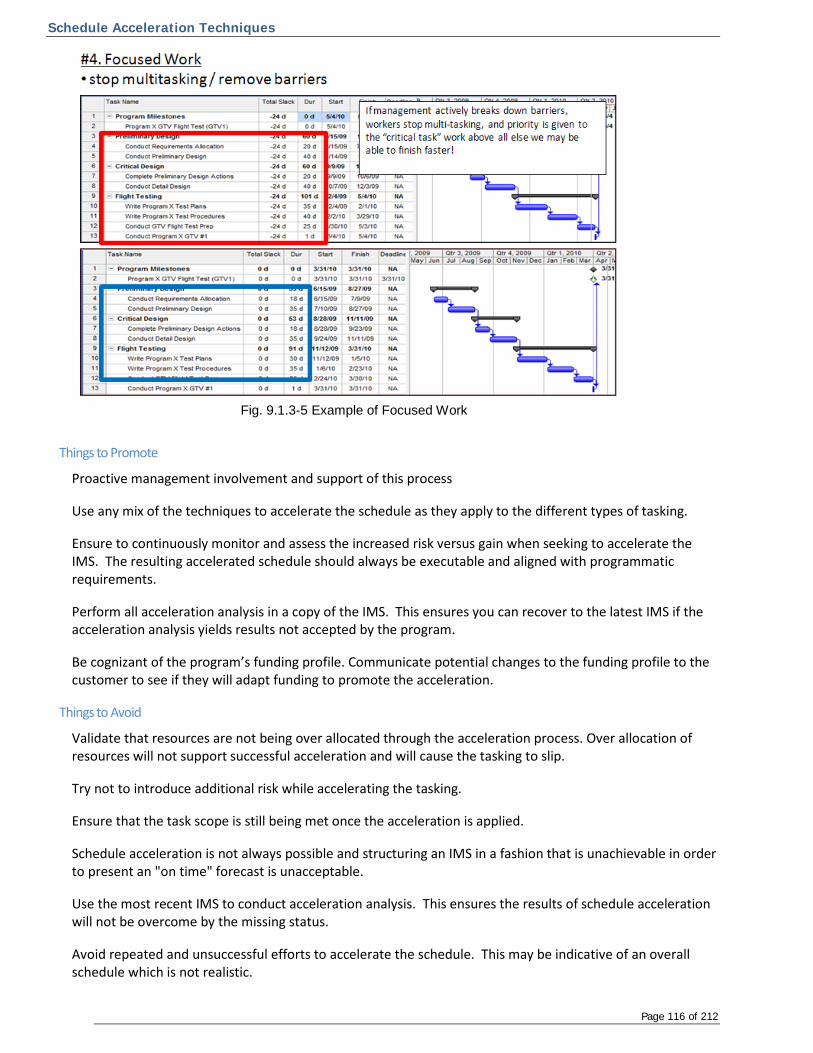
Schedule Acceleration Techniques
Page 116 of 212
Fig. 9.1.3-5 Example of Focused Work
Things to Promote
Proactive management involvement and support of this process
Use any mix of the techniques to accelerate the schedule as they apply to the different types of tasking.
Ensure to continuously monitor and assess the increased risk versus gain when seeking to accelerate the IMS. The resulting accelerated schedule should always be executable and aligned with programmatic requirements.
Perform all acceleration analysis in a copy of the IMS. This ensures you can recover to the latest IMS if the acceleration analysis yields results not accepted by the program.
Be cognizant of the program’s funding profile. Communicate potential changes to the funding profile to the customer to see if they will adapt funding to promote the acceleration.
Things to Avoid
Validate that resources are not being over allocated through the acceleration process. Over allocation of resources will not support successful acceleration and will cause the tasking to slip.
Try not to introduce additional risk while accelerating the tasking.
Ensure that the task scope is still being met once the acceleration is applied.
Schedule acceleration is not always possible and structuring an IMS in a fashion that is unachievable in order to present an "on time" forecast is unacceptable.
Use the most recent IMS to conduct acceleration analysis. This ensures the results of schedule acceleration will not be overcome by the missing status.
Avoid repeated and unsuccessful efforts to accelerate the schedule. This may be indicative of an overall schedule which is not realistic.

Schedule Acceleration Techniques
Page 117 of 212
Related Topics
Intro to Schedule Risk Assessment Incorporation of Risk & Opportunities Status to Timenow Forecasting

Estimate at Completion
Page 118 of 212
9.1.4 - Estimate at Completion
Manager’s View
The Estimate at Completion (EAC) is the estimated total cost of all authorized work. The EAC includes all actual costs incurred to date plus the estimated cost to complete all remaining work. The estimate to Complete (ETC) is the component of the EAC that is an input to the EVMS and as such will be the primary focus of this section.
Accurate EAC/ETC information is fundamental to successful program management and performance reporting. Given that the IMS should accurately reflect all work required to complete the program, the ETC should align with, and the expected case be derived from, the forecasted tasking in the IMS model.
Description
The Cost & Schedule Integration section of this guide discusses resource loaded vs. non-resource loaded schedules and the benefits and limitations of each. A relevant point from that section is that ETC information from the schedule should be in alignment with ETC information in the cost system. This includes the time phasing of the resources and the total amount or quantity of resources. In native field implementation of a resource-loaded schedule, this alignment is inherent to the cost-schedule integration process.
IMS maintenance requires that on a regular basis, or at least monthly, the schedule is updated to Timenow to reflect the state of the program. The status cycle records; actual start and finish dates, remaining durations for in-progress tasks, percent complete assessed for Earned Value purposes, and in a resource loaded schedule, the remaining work (ETC) is estimated. The ETC alignment with the schedule is automatic using the native fields of the scheduling software to assign resources to tasks. For non-resource loaded schedules, the status process should include a separate ETC estimating process that ensures IMS alignment as described in the Cost Schedule Integration section.
Using the IMS as the basis for the ETC will provide the most detailed and accurate information available to program/IPT management. A resource loaded IMS enables integrated evaluation of resource availability and capacity issues across the program or enterprise. It also simplifies the ability to include resource and cost implications to “What-if” program analysis.
Note: Including accurate resource rates, in addition to prime elements, in a resource loaded schedule enhances the capability of the IMS to assist in ETC analysis. However, it is important to understand the impacts of maintaining rates in the IMS as there are proprietary and rate change implications to consider.

Estimate at Completion
Page 119 of 212
Example
This is an example (Fig. 9.1.4-1) of a resource-loaded schedule. ETC alignment with the schedule is inherent because the native fields of the software are used.
Fig. 9.1.4-1 Example of a Resource loaded IMS using Native field resource loading
Calculations
EAC = ACWP + ETC. EAC = Estimate at Completion ACWP=Actual Cost of Work Performed, may also be known as Actual Cost (AC) ETC= Estimate to Complete The IMS is the basis for the ETC period of performance. When using a resource loaded schedule, the IMS can serve as the basis for all aspects of the ETC. When using a non-resource loaded source for the ETC, care should be taken to ensure that alignment for both dates (baseline and forecast) and resources (baseline resources and forecast resources) are in alignment with the data in the IMS.
Things to Promote
Resource loaded schedules enable automation of ETC data transfer from scheduling systems to EVM Systems to eliminate redundant effort and/or human error in data transfer. Program should periodically validate that data in the Finance Tool remains in sync with the data in the schedule (IMS) as the differences in calendars, Finance Tool import options and user error in tasks selection may result in data provided by the IMS to not be accepted by the Finance tool. Resources are budgeted at the Work Package level of the WBS. Therefore, programs should validate dates and resources at the Work Package level, at a minimum. Use of EVM cost metrics such as Cost Variance (CV), Cost Performance Index (CPI), and To Complete Performance Index (TCPI) to gauge realism of EAC projections.
Things to Avoid
Avoid developing an EAC without ETC information that is directly traceable to and supported by the forecast tasking in the IMS model. Avoid allowing the system to automatically estimate the work remaining without CAM review and approval.

Estimate at Completion
Page 120 of 212
Related Topics
Resource Loaded Schedules Non-Resource Loaded Schedules Status to Timenow Forecasting

Baseline Maintenance
Page 121 of 212
9.2 - Baseline Maintenance
This section contains the following chapters…
9.2.1 - Baseline Change Management
9.2.2 - Rolling Wave Planning
Baseline Change Management
Page 122 of 212
9.2.1 - Baseline Change Management
Manager’s View
The Baseline Change Management process provides a clear understanding of IMS revisions as they relate to the establishment and modifications of scope, schedule and budget distributions. When used correctly, the baseline change process clearly traces changes with appropriate supporting documentation and approvals. However, without a clearly documented baseline change process, or worse, no baseline change process at all, configuration control of the IMS is impossible. Additionally, without a dependable baseline change process, management and other consumers of the IMS information have no way of understanding changes made to the IMS. This loss of configuration control influences management's confidence in the IMS and the ability to use it to manage the program.
Description
Utilize Baseline Change Requests (BCRs) as a means of IMS baseline configuration control by documenting approved changes to the baseline. The change process establishes a clear definition of required documentation to support changes to the program and the impact to the IMS. Include the following items in BCR documentation; justification, BCR type, impacted tasks, duration, resources required to implement change and the existing condition of these elements prior to the change. Specifically, the documentation should reference the CAMs (task owners), control accounts, WBS elements, OBS elements, budget amounts and net impact to program milestones. The BCR process defines the managing Program Team for approvals, along with documented disposition for incorporation into the IMS. Incorporating baseline changes is one of the most time consuming and complicated steps in maintaining an IMS. The process covers everything from small tactical baseline changes to full global reprogramming efforts. As such, the program team should strictly follow a detailed business rhythm defining the BCR steps. Ensure the BCR business rhythm is scalable and includes sufficient time to perform quality control and pre/post cost & schedule impact analysis. This will help to facilitate the timely and accurate implementation of baseline changes. Types of BCRs include… Contract Baseline Changes Contract Baseline Changes provide traceability into customer driven contract changes. BCR documentation includes changes to SOW (additions, changes or deletions) along with impact to key Program Milestones. Coding and unique fields allow for visibility into these changes for internal and external reviews. Impacts due to Baseline revisions affecting cost, schedule and risk are critical when processing scope changes to align both customer and program team expectations. Reprogramming When the baseline is no longer executable and the IMS as a tool is ineffective, it may require a reprogramming - adjusting the baseline dates for executability. Reprogramming requires collaboration between both the contractor and customer, to produce an IMS that identifies all remaining efforts with alignment of Major Program Milestones. A comprehensive analysis of the program's path forward should be conducted prior to implementing a reprogram. The reprogramming may result in an Over-Target Schedule (OTS), a schedule that exceeds the contracted milestones. Reprogramming or an OTS does not affect the terms and conditions of the contract; all contractual milestones remain in effect. The new dates are for performance measurement purposes only. Supporting documentation and the BCR process that identifies changes to duration, logic, and resources is required when implementing changes. The draft “DoD Over Target Baseline and Over Target Schedule Handbook” provides additional information regarding reprogramming.

Baseline Change Management
Page 123 of 212
Internal Baseline Changes Use Internal Baseline Changes to document internal or non-contractual changes to the IMS baseline. These changes include but are not limited to, rolling wave planning and replanning of tasks and resources in the future based on a new understanding of program goals, constraints or execution strategy. BCR documentation for internal baseline changes should identify changes in duration, logic, and resources in addition to deleted, changed, or added tasks. Internal changes should not be retroactive and should adhere to any “freeze” period (i.e., period of time when baseline changes are not allowed) that the contractor may have in place. Prohibiting retroactive changes helps maintain the fidelity of the baseline and ensures performance measurement against the plan that was in place at the time of execution. The exception to retroactive changes is for the correction of errors. Administrative Schedule Changes Administrative schedule changes do not affect the distribution of BCWS and include the addition and deletion of milestones or Schedule Visibility Tasks (SVTs) and the correction or clarification of task names. Document and maintain these types of schedule changes in a configuration-controlled process. Typically, administrative schedule changes do not require the level of detail or management approval prior to implementation as compared to Baseline Changes affecting BCWS distribution. See section on Schedule Visibility Tasks.
Things to Promote
Use unique BCR numbers for each change made to the IMS baseline. Using a BCR field in the IMS, capture these unique BCR numbers on impacted tasks in the IMS as a means of ensuring traceability back to the BCR documentation.
BCR documentation should be easily traceable, provide a clearly identified timeframe, identify downstream and scope impacts, and be part of a controlled approval process.
BCR documentation should include data that depicts changes to both the IMS and the Performance Measurement baseline.
Ensure open collaboration between the contractor and customer on baseline changes that impact or alter program execution
Ensure all stakeholders clearly understand the cost and schedule impacts of significant BCRs.
Ensure to include changes to the IMP and/or WBS during the baseline maintenance process. This may require contractual coordination with the customer.
BCRs will likely require adding and deleting tasks in addition to making changes to in-process tasks. There are many alternative methods to implementing BCRs on in-process tasks including closing the in-process task and reopening a new task with the remaining scope or simply documenting the change to the remaining scope of the in-process task. Ensure all IMS stakeholders clearly understand and consistently apply the chosen method of changing in-process tasks.
Ensure to consider contractual and internally defined commitment dates when incorporating baseline changes to avoid unintended downstream impacts.
Ensure the program team understands the difference between managing forecast task characteristics (duration, logic, resource allocation, date constraint application) versus baseline maintenance, eliminating any confusion surrounding normal active schedule task management.
Baseline Change Management
Page 124 of 212
Explain a retroactive change, due to a correction of an error, in the BCR (Baseline Change Request) documentation. Retroactive changes for this purpose may still require notification to the customer.
Things to Avoid
Avoid incorporating changes, which influence metrics or mask performances variances or retroactive changes to the baseline schedule, in order to improve historical metric performance.
BCRs allow the IMS to represent an accurate model of the program plan. Baseline changes which are poorly defined and do not have substance often put the program at risk for having a “rubber baseline” (i.e. one that changes continuously) or an IMS that cannot be effectively used as a management tool. Effective process control is necessary to ensure baseline and forecast integrity as a predictive model for program execution.
Avoid scope change BCR’s that use schedule float or funds that were available or excess in the original schedule as changes in scope should come through contractual changes.
Related Topics
Rolling Wave Planning Vertical Integration & Traceability Managing using the IMS Schedule Visibility Tasks (SVT)

Rolling Wave Planning
Page 125 of 212
9.2.2 - Rolling Wave Planning
Manager’s View
Rolling Wave planning is an incremental approach that helps program management focus on more immediate work with a detailed schedule and far term schedules planned at a higher level until the program better understands the details about the scope, cost and delivery requirements of that effort. As the program progresses and requirements are refined, the program extends the detailed schedule into the future as a 'rolling wave' of planning. This concept allows program personnel to provide clarity where needed while saving unnecessary time and expense developing plans where details cannot be clearly defined. Rolling Wave planning can be especially beneficial to programs where the Statement of Work (SOW) is likely to change.
Description
The Rolling Wave concept pulls together two schedule development approaches; Top-down and bottom-up planning. Top down planning is the process of breaking down into detail a schedule starting with the major milestones. For example, a schedule based on an RFP with desired review and delivery dates can be broken down into summary schedules to support those milestones. Because the full scope of the effort is undefined, these schedules provide a framework for the program but recognize that more information from the review process is necessary to provide specifics for the work. Additionally, programs can employ bottom-up planning when the program knows that detail. Armed with this knowledge, the program can define the specific tasks, durations, relationships and resources to complete the work. The goal of the rolling wave planning exercise is to balance the framework of the scope, date and cost requirements of the top-level plan with the organization’s capabilities and the specific requirements in the detailed plan. The program can then extend the detail plan into the future, as the program understands additional information about the program goals and requirements. In rolling wave planning, the IMS usually contains near term detailed information in work packages. These work packages are composed of one or more IMS tasks, are shorter in duration, and have necessary logic ties to all other tasks. Additionally, these elements are either resource loaded or linked to resource and cost budgets in other management systems. These work packages represent a specific plan for accomplishing the near term program goals and, in an EVM System, are the basis for the time-phased Performance Measurement Baseline (PMB) and the Estimate to Complete (ETC). They also have assigned earned value measurement techniques to provide performance measurement against the plan for analysis and issue resolution. For planning outside of the Current Detail Plan Period, Planning Packages represent work defined at a higher level of detail. Planning Packages have almost all the same characteristics of work packages. Their average durations may be longer than detail tasks, but like detail tasks, they also have logical relationships with other tasks in the IMS so a Critical Path may be determined. They have associated resource cost budgets and forecasts to support the scope they represent, providing that information in the EVM System to maintain the PMB and forecast. However, because Planning Packages lack sufficient detail for measured progress, EVM performance data is limited until the detailed planning is available. During the initial development phase of a new program, the program establishes detailed work packages for the first phase of the program and planning packages for the remaining effort. How far into the future work packages are planned is determined by a number of factors including event phasing, program risk level, quality of the requirements, experience with similar programs and common sense. However, a balance should be struck between having enough accurate detail in the current 'planning horizon' to manage the program without extending the detailed planning so far out in time that changes to the plan are frequently required to keep it relevant.

Rolling Wave Planning
Page 126 of 212
To help provide guidance for determining the period of the planning horizon, the program effort is usually detail planned to the next program phase, major milestone, or event. This approach allows the schedule to develop based upon increased understanding of the requirements discovered during the progression of the program. In the initial program phase, the planning period periods tend to be shorter during the requirements definition and design review phases and grows longer as the program matures into the development and deployment phases.
As the first planning period ends, the process of developing the next period of detail begins. Programs should precede rolling wave exercises with instructions to the participants for goals and expectations of the exercise. These instructions usually contain the duration of the next planning horizon, quality discussions, an implementation schedule, methods of integration, and a schedule of management review meetings necessary to assure a smooth transition to the next level of schedule development. Program should repeat this process as necessary throughout the life cycle of the program. In some cases, programs implement rolling wave planning based not on Event-to-Event gates but upon other increments such as revisions, updates or blocks. This approach, referred to as Block Planning, describes the increasing detail of the schedule based upon logical building blocks of information. While not all blocks contain the exact information, they are similar in structure to each other. For example, software block planning may have different features as the goal of each block. This creates minor variations in each block when detailed from planning packages to work packages, but the basic structure for updating the particular block revision is the same. In other cases, programs cannot easily align its detail-planning window with periodic IMP Events or Major milestones or the time between Events or Milestones may be greater than practical planning can support. To address these situations, the detail-planning window could extend to a relevant defined period, rather than the conclusion of an IMP Event or major milestone. For example, if the minimum level of detail is 3 months, then the program may decide to plan for 6-month intervals and conduct rolling wave exercises every 3 months until conditions change or the program ends.
Task 1Task 2
Task 4Task 5
Task 3Work Packages
Planning Packages
Fig. 9.2.2-1 Detail Planning Window
Major Milestone (ex: PDR)

Rolling Wave Planning
Page 127 of 212
Example
An example of a 3-month rolling wave:
At the beginning of the effort, only three months are detail planned as shown in Fig. 9.2.2-2.
To maintain the 3-month look-ahead in the IMS, the Planning Package represented by Task #4 in Fig. 9.2.2-2 is detail planned to detailed tasks 4-6 as shown in Fig. 9.2.2-2.
Task 7 in Fig. 9.2.2-3 captures the remainder of the Planning Package Period of Performance and budget, allowing decomposition into detailed tasking later, though the program may choose to detail these details now if sufficient knowledge of the details exists.
Fig 9.2.2-2 - 3 months of detail tasking and a Planning Package.
Fig. 9.2.2-3 – After detailing Task 4 in Fig. 9.2.2-3, we have 6 months of discrete tasking and a newly created Planning Package for the balance of the Period of Performance.
Things to Promote
Find a balance between enough near-term detailed planning to be managerially useful but not so far out in the future to require constant changing. Use documentation with a level of fidelity similar to the “Basis of Estimate (BOE)” in the proposal phase as part of the BCR process. Periodically review the planning horizon over the life of the program to determine if the rolling wave methodology still meets the program needs. Consider using different planning horizons on different aspects of the program depending on baseline volatility. During the rolling wave, CAMs should re-evaluate all work within the wave, not just the new work planned. Programs should break down Planning Packages that are on or near the Critical Path/Driving Path or carry a high degree of risk into smaller elements to facilitate schedule analysis and risk mitigation. Detail plan beyond the rolling wave period if possible and reasonable. Ensure that the appropriate program stakeholders participate in the Rolling Wave process and validate the resultant detail plan to help garner buy-in and ownership.
Rolling Wave Planning
Page 128 of 212
When decomposing Planning Packages into task details ensure you also consider their impact to the total program IMS. Use sound, logical relationships that accurately represent the total program’s workflow.
Things to Avoid
Avoid permitting work to remain in planning packages during the current accounting period. Assuming only tasks in the planning horizon should have network logic Avoid artificially “cutting off” tasks to finish at the end of the rolling wave or detail planning window. Work Packages can be detail planned outside of the rolling wave window or detail planning window. Ensure that the program is not incorporating out of scope changes into the PMB during a Rolling Wave process, without considering contractual implications.
Related Topics
Baseline Change Management Top Down vs. Bottom Up Planning Horizontal Traceability Vertical Integration & Traceability
Schedule Analysis
Page 129 of 212
10.0 - Schedule Analysis
This section contains the following chapters…
10.1 - Critical & Driving Path Analysis
10.2 - Schedule Health Assessment
10.3 - Risk & Opportunity
10.3.1 - Incorporation of Risk & Opportunities
10.3.2 - Schedule Risk Assessment (SRA) - Set-up & Execution
10.3.3 - Schedule Risk Assessment (SRA) - Analysis
10.4 - Schedule Execution Metrics
10.4.1 - Intro to Schedule Execution Metrics
10.4.2 - Critical Path Length Index (CPLI)
10.4.3 - Schedule Performance Index (SPI)
10.4.4 - Baseline Execution Index (BEI)
10.4.5 - Current Execution Index (CEI)
10.4.6 - Duration-Based vs. Scope-Based Percent Complete
10.4.7 - Schedule Rate Chart

Critical & Driving Path Analysis
Page 130 of 212
10.1 - Critical & Driving Path Analysis
Manager’s View
Critical Path Method (CPM) models a program network by capturing the duration and logical relationships of every program task. There are three basic elements of the Critical Path Method. They are the Forward Pass, the Backward Pass and the Float calculation. The Float calculation enables identification of the Critical and Driving Paths in the IMS. The PASEG utilizes the following definitions for Critical and Driving paths. Critical Path = the longest sequence of tasks from Timenow to the program end date. If a task on the critical path slips, the forecasted program end date should slip Near Critical Path(s) = the secondary, tertiary, etc. Critical Paths to the program end date Driving Path = the longest sequence of tasks from Timenow to an interim program milestone. If a task on a Driving Path slips, the forecasted interim program milestone date should slip. Near Driving Path(s) = the secondary, tertiary, etc., Driving Paths to an interim program milestone. Note: “near” driving paths are separately identifiable and may or may not intersect with the Driving Path Critical/Driving Paths may start to the right of Timenow if the driver to the path originates from any constrained task or milestone utilized as an input to the program schedule. Critical/Driving path identification and analysis is essential to ensure that management is focusing on the correct tasks to prevent slippage of the program end date. Close monitoring and analysis of Critical and Near Critical Paths will ultimately provide management with the necessary insight to keep the program under control and on track for successful completion. The Critical and Driving paths are not static and can change as the program progresses.
Description
Critical Path Analysis is a network analysis technique used to predict program duration by analyzing which sequence of activities has the least amount of scheduling flexibility. The result of Critical Path analysis is the identification of the program’s Critical and Driving Paths. To ensure the accuracy of this analysis, task owners should constantly validate the task durations and logical relationships (refer to the Forecasting chapter for additional information on IMS quality control).
Common characteristics of a credible Critical Path include the following:
• it begins at “time now” and proceeds to program completion • the tasks and milestones are tied together with sound network logic in a sequence that is
programmatically feasible and makes sense from a workflow standpoint • the path contains no level-of-effort (LOE) or summary activities • the path does not contain unexplained gaps in time between tasks, such as lags representing non-
PMB effort the initial and subsequent changes to the critical path are concurred to by senior program leadership
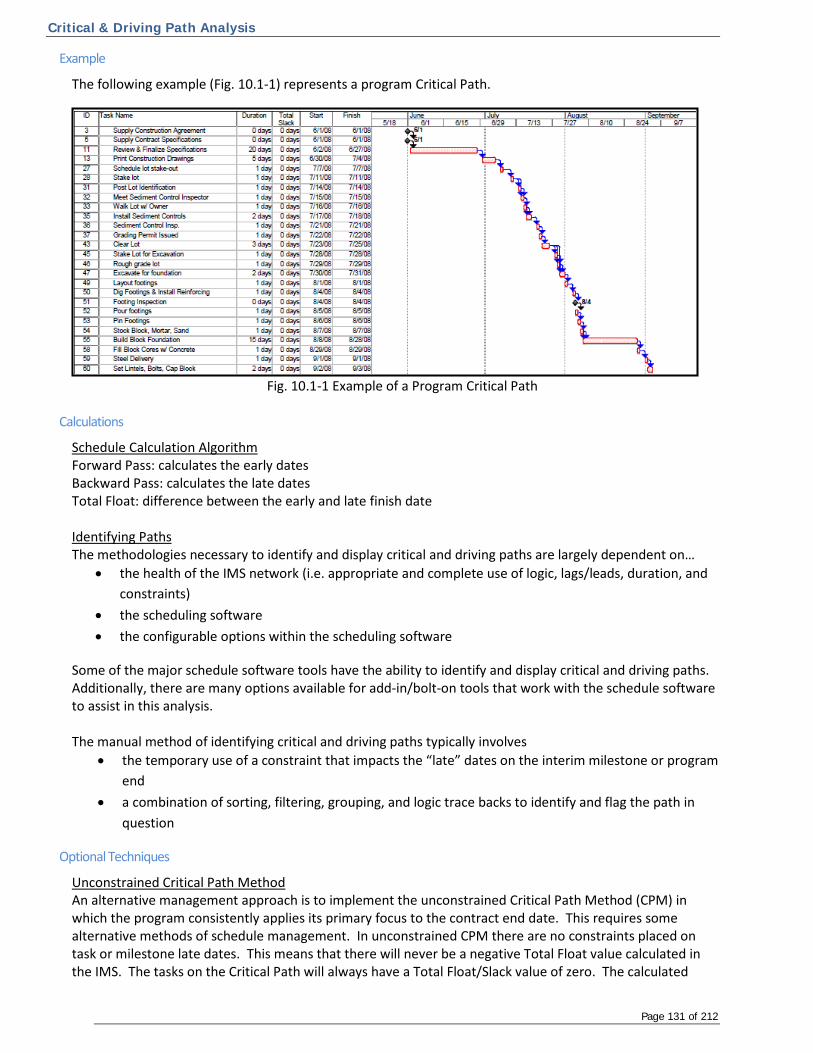
Critical & Driving Path Analysis
Page 131 of 212
Example
The following example (Fig. 10.1-1) represents a program Critical Path.
Fig. 10.1-1 Example of a Program Critical Path
Calculations
Schedule Calculation Algorithm Forward Pass: calculates the early dates Backward Pass: calculates the late dates Total Float: difference between the early and late finish date Identifying Paths The methodologies necessary to identify and display critical and driving paths are largely dependent on…
• the health of the IMS network (i.e. appropriate and complete use of logic, lags/leads, duration, and constraints)
• the scheduling software • the configurable options within the scheduling software
Some of the major schedule software tools have the ability to identify and display critical and driving paths. Additionally, there are many options available for add-in/bolt-on tools that work with the schedule software to assist in this analysis. The manual method of identifying critical and driving paths typically involves
• the temporary use of a constraint that impacts the “late” dates on the interim milestone or program end
• a combination of sorting, filtering, grouping, and logic trace backs to identify and flag the path in question
Optional Techniques
Unconstrained Critical Path Method An alternative management approach is to implement the unconstrained Critical Path Method (CPM) in which the program consistently applies its primary focus to the contract end date. This requires some alternative methods of schedule management. In unconstrained CPM there are no constraints placed on task or milestone late dates. This means that there will never be a negative Total Float value calculated in the IMS. The tasks on the Critical Path will always have a Total Float/Slack value of zero. The calculated

Critical & Driving Path Analysis
Page 132 of 212
Total Float value on the non-critical path tasks will then always indicate the amount of flexibility the task has before it affects the contractual end date. Important things to consider when implementing unconstrained CPM
• In unconstrained CPM, the Total Float value does not indicate the program’s position against contractually required dates as the Total Float calculation is ONLY in reference to the program’s end. To mitigate this situation schedule management teams should capture the contractually required dates in the baseline or an alternative static date field and calculate the variance between it and the most recent forecasted early dates. The resulting variance will indicate the program’s position against contractually required dates. Note: Ensure that the variance formula calculates working days versus calendar days.
• Ensure that all program stakeholders (to include the program team, senior executives, customers, and auditors) fully understand and accept the program’s decision to manage via unconstrained CPM. It will be necessary to explain in detail the idiosyncrasies of how Total Float and contractual date variances management process with all stakeholders of the IMS. If all stakeholders on the program have same understanding, this will ensure that accurate, consistent conclusions are drawn as they perform schedule analysis from their own perspectives
Unconstrained CPM may not be an appropriate use on programs where the primary objective is to demonstrate remaining effort to the program completion (i.e. delivering real time incremental capability to war fighters in the field).
Things to Promote
Your process should ensure that management has insight into the Critical and Near Critical paths to enable accurate decision making for program success. It is important that the program team know and understand where the schedule has flexibility, and where it does not. The program team’s confidence in the IMS is essential. Confidence will only materialize if senior program leadership ambitiously supports managing to the IMS by holding all program personnel accountable for schedule data and requiring task owners to provide consistent and accurate inputs to the model. Understand and consistently apply the configurable scheduling software options.
Set the bar high in the assessment of a schedules condition and its execution. Uphold sound schedule management practices / processes, and instill a sense of accountability and ownership for schedule data. A poorly constructed schedule is a schedule management problem, not a schedule problem. A poorly constructed schedule is a result, not a cause.
Maintain robust Quality Control (QC) processes for schedule integrity. Attributes of a successful program schedule as defined by the GASP are:
• The schedule is complete • The schedule is traceable • The schedule is transparent • The schedule is statused • The schedule is predictive • The schedule is usable • The schedule is resourced • The schedule is controlled
Critical & Driving Path Analysis
Page 133 of 212
It is extremely important to note the difference between critical path activities and “critical activities” as defined by management or the schedule software tool. These two may be, but are not necessarily, the same. In scheduling terms, the critical path is the sequence of activities that are tied together with network logic that have the longest overall duration from time now until program completion. Critical activities are tasks having these distinctions assigned to them, identified as “crucial” activities in this guide. Ensure that schedule analysis clearly communicates the program’s current progress against contractual requirements.
Things to Avoid
Recognize / understand the consequences and pitfalls associated with… • maintaining negative total float in a schedule as it depicts a behind schedule position and can
negatively influence task prioritization • Use of total float as a baseline variance measurement as Total Float is not calculated relative to the
baseline position but relative to the program end. • ignoring and losing focus on Critical Path • The improper use of schedule construction options (i.e. constraints, lags, leads, etc) as these uses
could result in an inaccurate and ineffective IMS. • focusing the program team exclusively on the near term milestone drivers and losing site of the far
term obligations
Related Topics
Schedule Calculation Algorithm Managing Using the IMS Schedule Margin Current Execution Index (CEI)

Schedule Health Assessment
Page 134 of 212
10.2 - Schedule Health Assessment
Manager’s View
Periodic schedule health assessments are essential to ensure the IMS is valid and effective for reporting on accomplishments and predicting future performance. The program leadership team needs to be aware of the health of the schedule used to execute the program. By implementing regular schedule health assessments and addressing issues identified in those assessments, program managers should be confident in using the schedule to manage the program. Programs should perform schedule health assessments not only during program execution but also throughout the IMS design and development process to ensure the integrity and the validity of the IMS data.
Description
A schedule health assessment is often a report (display or document) containing a defined set of data or statistics reviewed for compliance to a standard, threshold, or guideline. Schedule health assessments are primarily quantitative and address the Generally Accepted Scheduling Principles (GASP). In the IMS Supplemental Guidance, programs should document procedure that states the frequency of schedule health assessments, weighting of data, and a defined set of exceptions to criteria (e.g. does not include summary tasks, LOE). Refer to the IMS Supplemental Guidance chapter in this guide. Schedule health metrics are different from schedule execution metrics (see chapters on Schedule Execution Metrics for discussion of this topic). Schedule health metrics focus on the mechanics of the schedule to ensure it is a useful program planning and execution tool. The calculation section below includes a sample list of schedule health metrics. Schedule execution metrics focus on the performance of the program and include metrics such as Baseline Execution Index, Schedule Performance Index, and Current Execution Index. Planner/Schedulers are often required to run schedule health assessments on a regular basis (at least monthly). Planners/Schedulers may have at their disposal a number of automated tools that will analyze the IMS in accordance with the DCMA’s 14 points or any user-generated criteria. Running these metrics regularly is essential to maintaining an accurate IMS. The schedule health assessment is a tool to help the schedule analyst focus on areas that may need further clarification or documentation. For example, although it may be unusual for a healthy schedule to have many tasks with long durations, this is entirely feasible for an IMS that references detailed production activity from an MRP using longer duration tasks to representative the MRP details. Planner/Schedulers should understand the program goals in regards to schedule health metrics. They should work with program management to construct a metrics package that serves the program’s needs. It is important to note that these metrics simply indicate a potential issue that needs either mitigation or justification. The IMS should always represent the program’s path forward. Refrain from constructing a schedule that does not represent the program’s path forward in order to achieve a favorable schedule health assessment.
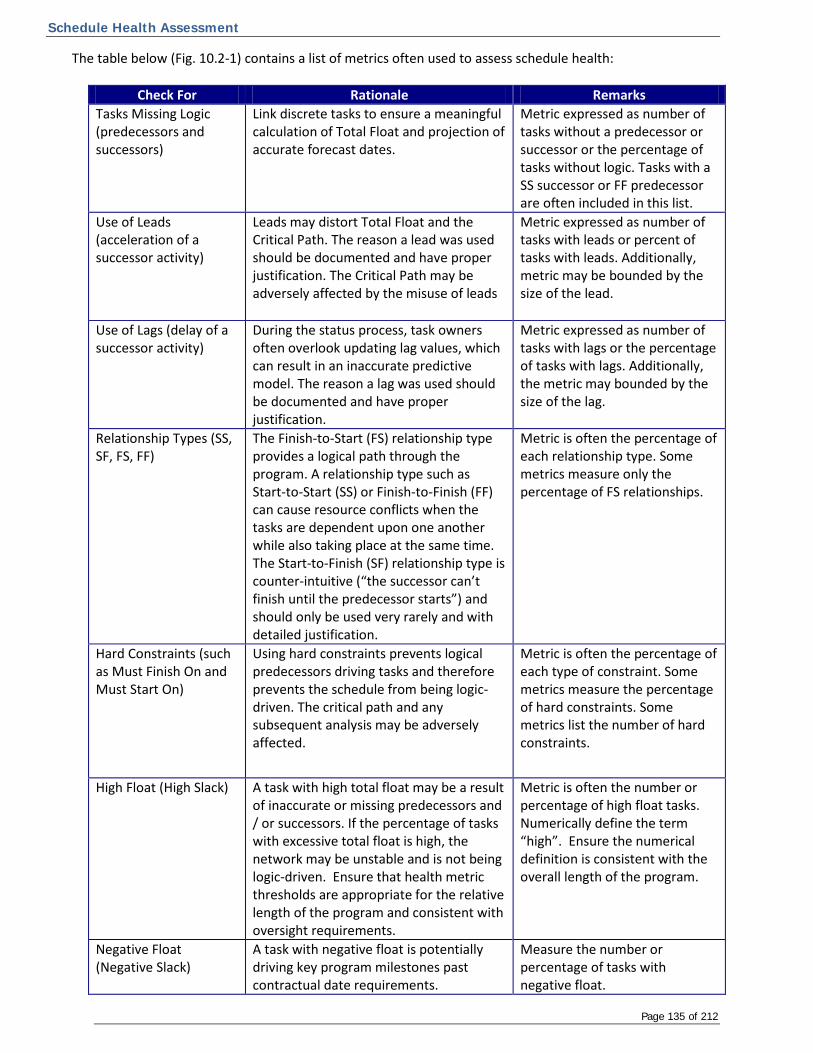
Schedule Health Assessment
Page 135 of 212
The table below (Fig. 10.2-1) contains a list of metrics often used to assess schedule health:
Check For Rationale Remarks Tasks Missing Logic (predecessors and successors)
Link discrete tasks to ensure a meaningful calculation of Total Float and projection of accurate forecast dates.
Metric expressed as number of tasks without a predecessor or successor or the percentage of tasks without logic. Tasks with a SS successor or FF predecessor are often included in this list.
Use of Leads (acceleration of a successor activity)
Leads may distort Total Float and the Critical Path. The reason a lead was used should be documented and have proper justification. The Critical Path may be adversely affected by the misuse of leads
Metric expressed as number of tasks with leads or percent of tasks with leads. Additionally, metric may be bounded by the size of the lead.
Use of Lags (delay of a successor activity)
During the status process, task owners often overlook updating lag values, which can result in an inaccurate predictive model. The reason a lag was used should be documented and have proper justification.
Metric expressed as number of tasks with lags or the percentage of tasks with lags. Additionally, the metric may bounded by the size of the lag.
Relationship Types (SS, SF, FS, FF)
The Finish-to-Start (FS) relationship type provides a logical path through the program. A relationship type such as Start-to-Start (SS) or Finish-to-Finish (FF) can cause resource conflicts when the tasks are dependent upon one another while also taking place at the same time. The Start-to-Finish (SF) relationship type is counter-intuitive (“the successor can’t finish until the predecessor starts”) and should only be used very rarely and with detailed justification.
Metric is often the percentage of each relationship type. Some metrics measure only the percentage of FS relationships.
Hard Constraints (such as Must Finish On and Must Start On)
Using hard constraints prevents logical predecessors driving tasks and therefore prevents the schedule from being logic-driven. The critical path and any subsequent analysis may be adversely affected.
Metric is often the percentage of each type of constraint. Some metrics measure the percentage of hard constraints. Some metrics list the number of hard constraints.
High Float (High Slack) A task with high total float may be a result of inaccurate or missing predecessors and / or successors. If the percentage of tasks with excessive total float is high, the network may be unstable and is not being logic-driven. Ensure that health metric thresholds are appropriate for the relative length of the program and consistent with oversight requirements.
Metric is often the number or percentage of high float tasks. Numerically define the term “high”. Ensure the numerical definition is consistent with the overall length of the program.
Negative Float (Negative Slack)
A task with negative float is potentially driving key program milestones past contractual date requirements.
Measure the number or percentage of tasks with negative float.
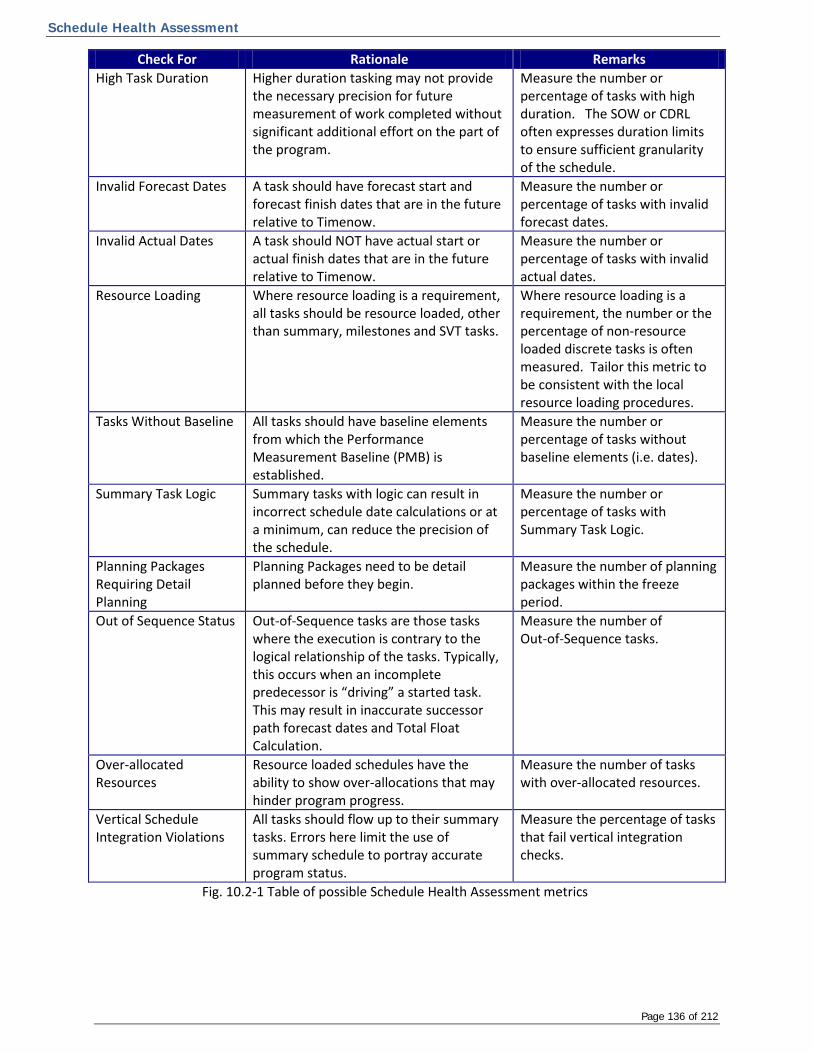
Schedule Health Assessment
Page 136 of 212
Check For Rationale Remarks High Task Duration Higher duration tasking may not provide
the necessary precision for future measurement of work completed without significant additional effort on the part of the program.
Measure the number or percentage of tasks with high duration. The SOW or CDRL often expresses duration limits to ensure sufficient granularity of the schedule.
Invalid Forecast Dates A task should have forecast start and forecast finish dates that are in the future relative to Timenow.
Measure the number or percentage of tasks with invalid forecast dates.
Invalid Actual Dates A task should NOT have actual start or actual finish dates that are in the future relative to Timenow.
Measure the number or percentage of tasks with invalid actual dates.
Resource Loading Where resource loading is a requirement, all tasks should be resource loaded, other than summary, milestones and SVT tasks.
Where resource loading is a requirement, the number or the percentage of non-resource loaded discrete tasks is often measured. Tailor this metric to be consistent with the local resource loading procedures.
Tasks Without Baseline All tasks should have baseline elements from which the Performance Measurement Baseline (PMB) is established.
Measure the number or percentage of tasks without baseline elements (i.e. dates).
Summary Task Logic Summary tasks with logic can result in incorrect schedule date calculations or at a minimum, can reduce the precision of the schedule.
Measure the number or percentage of tasks with Summary Task Logic.
Planning Packages Requiring Detail Planning
Planning Packages need to be detail planned before they begin.
Measure the number of planning packages within the freeze period.
Out of Sequence Status Out-of-Sequence tasks are those tasks where the execution is contrary to the logical relationship of the tasks. Typically, this occurs when an incomplete predecessor is “driving” a started task. This may result in inaccurate successor path forecast dates and Total Float Calculation.
Measure the number of Out-of-Sequence tasks.
Over-allocated Resources
Resource loaded schedules have the ability to show over-allocations that may hinder program progress.
Measure the number of tasks with over-allocated resources.
Vertical Schedule Integration Violations
All tasks should flow up to their summary tasks. Errors here limit the use of summary schedule to portray accurate program status.
Measure the percentage of tasks that fail vertical integration checks.
Fig. 10.2-1 Table of possible Schedule Health Assessment metrics
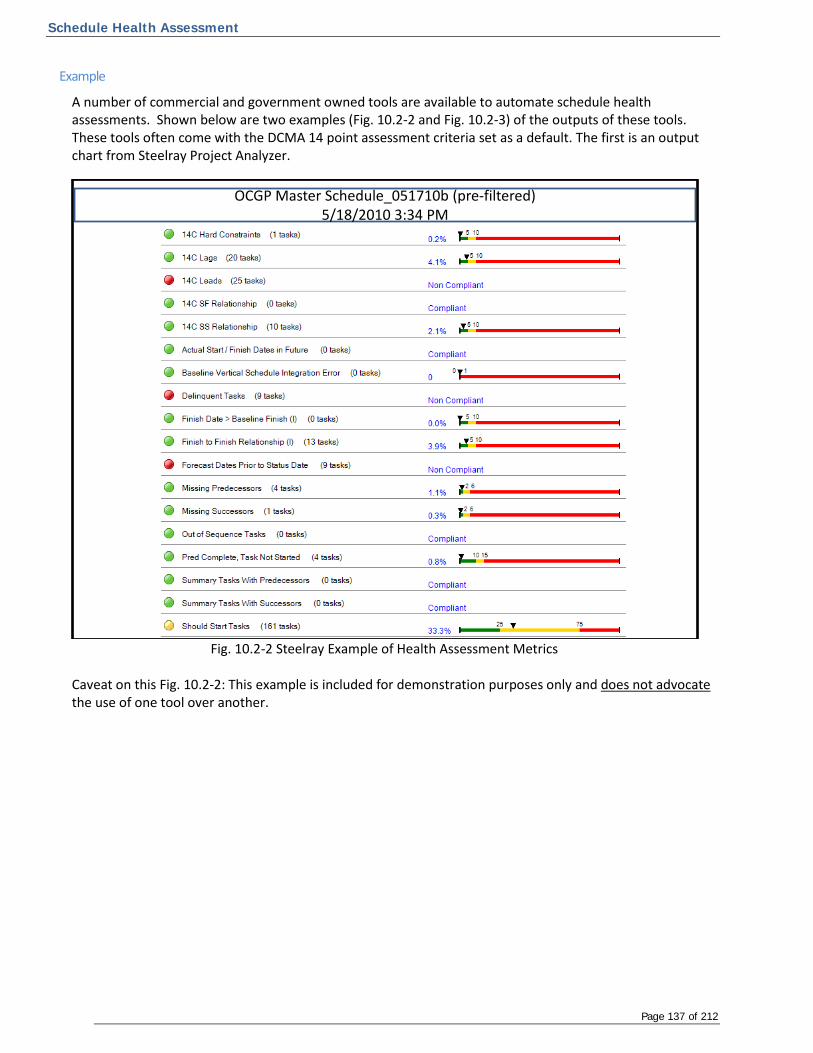
Schedule Health Assessment
Page 137 of 212
Example
A number of commercial and government owned tools are available to automate schedule health assessments. Shown below are two examples (Fig. 10.2-2 and Fig. 10.2-3) of the outputs of these tools. These tools often come with the DCMA 14 point assessment criteria set as a default. The first is an output chart from Steelray Project Analyzer.
Fig. 10.2-2 Steelray Example of Health Assessment Metrics Caveat on this Fig. 10.2-2: This example is included for demonstration purposes only and does not advocate the use of one tool over another.
OCGP Master Schedule_051710b (pre-filtered)5/18/2010 3:34 PM
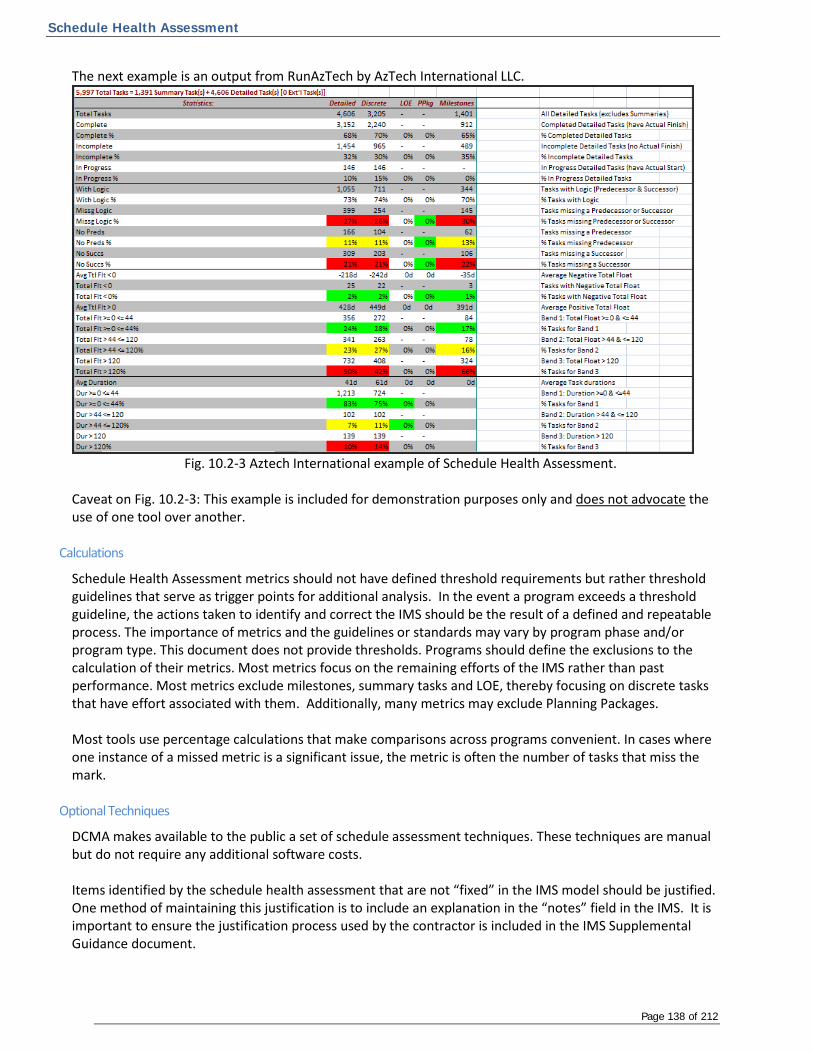
Schedule Health Assessment
Page 138 of 212
The next example is an output from RunAzTech by AzTech International LLC.
Fig. 10.2-3 Aztech International example of Schedule Health Assessment. Caveat on Fig. 10.2-3: This example is included for demonstration purposes only and does not advocate the use of one tool over another.
Calculations
Schedule Health Assessment metrics should not have defined threshold requirements but rather threshold guidelines that serve as trigger points for additional analysis. In the event a program exceeds a threshold guideline, the actions taken to identify and correct the IMS should be the result of a defined and repeatable process. The importance of metrics and the guidelines or standards may vary by program phase and/or program type. This document does not provide thresholds. Programs should define the exclusions to the calculation of their metrics. Most metrics focus on the remaining efforts of the IMS rather than past performance. Most metrics exclude milestones, summary tasks and LOE, thereby focusing on discrete tasks that have effort associated with them. Additionally, many metrics may exclude Planning Packages. Most tools use percentage calculations that make comparisons across programs convenient. In cases where one instance of a missed metric is a significant issue, the metric is often the number of tasks that miss the mark.
Optional Techniques
DCMA makes available to the public a set of schedule assessment techniques. These techniques are manual but do not require any additional software costs. Items identified by the schedule health assessment that are not “fixed” in the IMS model should be justified. One method of maintaining this justification is to include an explanation in the “notes” field in the IMS. It is important to ensure the justification process used by the contractor is included in the IMS Supplemental Guidance document.

Schedule Health Assessment
Page 139 of 212
Things to Promote
Periodic use of a schedule health assessment and trending commentary contained in the “schedule health assessment report” provided to the customer in the IMS Narrative, when required. Give priority to improving the schedule health. The ability to use the schedule to predict future performance requires a sound schedule. Ensure the program is addressing IMS health concerns in a logical order of precedence. Address items with the biggest deviation from the established standards first. Communicate the reason for performing schedule health metrics to all of the task owners, not just to the planner/schedulers. Ensure that health metric threshold guidelines are appropriate for the relative length of the program and consistent with oversight requirements.
Things to Avoid
Avoid creating an environment driven to eliminate variances to the metrics standards as the primary goal as this objective typically drives bad behavior and will likely result in an erroneous IMS.
Avoid viewing all schedule health metrics as a “pass/fail” mechanism, but rather an analytical tool for discovering areas that may need further focus and/or clarification.
Related Topics
Desktop Procedures Horizontal Traceability IMS Supplemental Guidance Critical & Driving Path Analysis

Risk & Opportunity
Page 140 of 212
10.3 - Risk & Opportunity
This section contains the following chapters…
10.3.1 - Incorporation of Risk & Opportunities
10.3.2 - Schedule Risk Assessment (SRA) - Set-up & Execution
10.3.3 - Schedule Risk Assessment (SRA) - Analysis

Incorporation of Risks & Opportunities
Page 141 of 212
10.3.1 - Incorporation of Risks & Opportunities
Manager’s View
Identifying and addressing Risks and Opportunities (R&O) supports the achievement of cost, schedule, and technical objectives and is part of any Program Management strategy. The integration of the risk mitigation or opportunity capture plans from the R&O database/register directly into the Integrated Master Schedule (IMS) allows progress to be monitored during the normal status cycle. This establishes an efficient forward-looking process that will help program managers make informed decisions faster, leading to improved performance and increased customer confidence.
Description
Process elements such as Organization, Identification, Analysis, Planning, Authorization (implementation), Progress Measurement (tracking) and Revision / Closeout are common to most risk management systems. A sample process follows: Sample process
Risk and Opportunity Management Process
3. Analysis• Assign Project &
WBS• Determine
Likelihood / Consequence
• Review Board Acceptance
2. Identification• Identify R&O
Candidates• Initial
Assessment
4. Risk Mitigation / Opportunity Capture Planning
• Identify feasible alternatives
• Prepare Risk Mitigation / Opportunity Capture Plans
• Coordinate with stakeholders
1. Organization• Prepare R&O
Management Plan• Configure Supporting
Computer Applications
• Conduct Initial R&O Review
Risk and Opportunity Management Process
7. Revision / Closeout
• Reclassify, edit R&O item or action plan
• Close R&O item
5. Work Authorization• Authorize Risk
Mitigation / Opportunity Capture plan
• Implement action plans (incorporate into the IMS)
6. Progress Measurement
• Gather, assess and record plan status
• Report R&O status to Program Management
Fig. 10.3.1-1 Risk and Opportunity Management Process By tagging risk or opportunity activities in the IMS (using standard activity codes available in most scheduling software), it is possible to identify the plan steps and transfer them to a risk management tool. The program schedule becomes the single source for R&O plan status resulting in elevated visibility and ensures that the program team addresses risk and opportunities during the regular update cycle. At a minimum, the individual schedule activities should be traceable to individual risks and opportunities in the R&O database/register. It is possible to include other information that can be used to help automate reporting and accountability such as the expected likelihood and consequence of occurrence, risk owner etc. The day-to-day execution of the program provides the earned value, accounting and schedule metrics needed to manage and understand the probable impact of risks and opportunities. When the status is
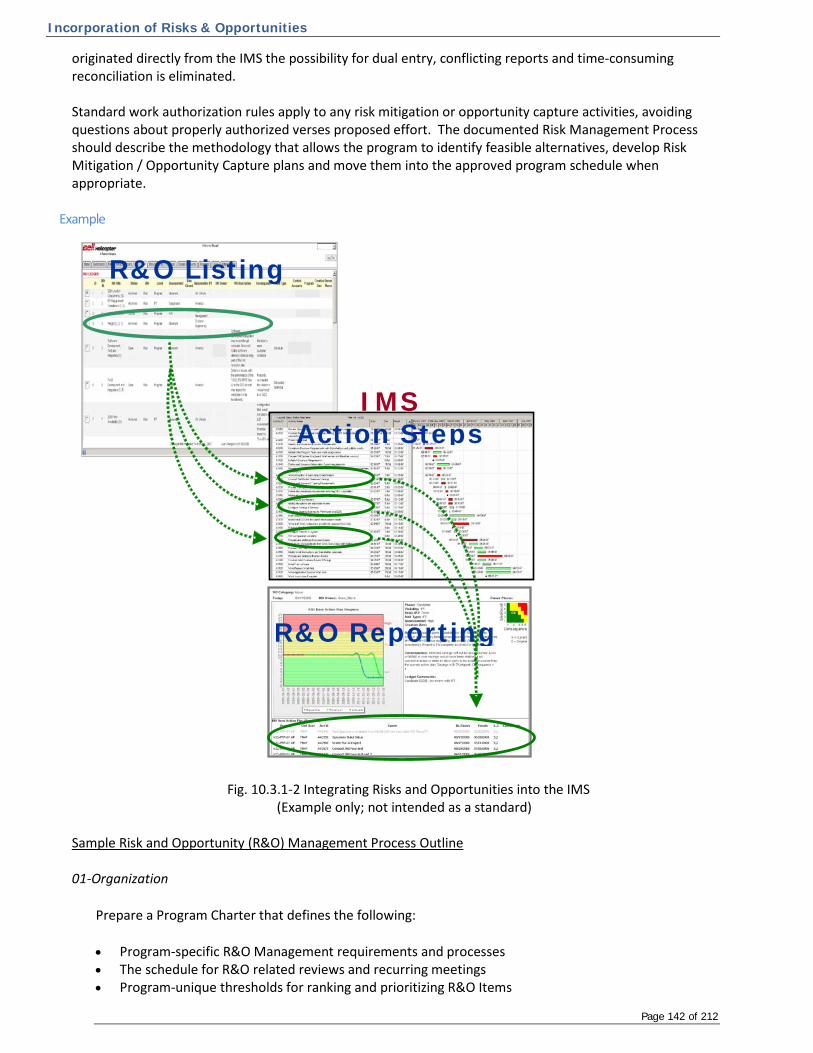
Incorporation of Risks & Opportunities
Page 142 of 212
originated directly from the IMS the possibility for dual entry, conflicting reports and time-consuming reconciliation is eliminated. Standard work authorization rules apply to any risk mitigation or opportunity capture activities, avoiding questions about properly authorized verses proposed effort. The documented Risk Management Process should describe the methodology that allows the program to identify feasible alternatives, develop Risk Mitigation / Opportunity Capture plans and move them into the approved program schedule when appropriate.
Example
Fig. 10.3.1-2 Integrating Risks and Opportunities into the IMS (Example only; not intended as a standard)
Sample Risk and Opportunity (R&O) Management Process Outline 01-Organization
Prepare a Program Charter that defines the following:
• Program-specific R&O Management requirements and processes • The schedule for R&O related reviews and recurring meetings • Program-unique thresholds for ranking and prioritizing R&O Items
R&O Listing
IMS Action Steps
R&O Reporting
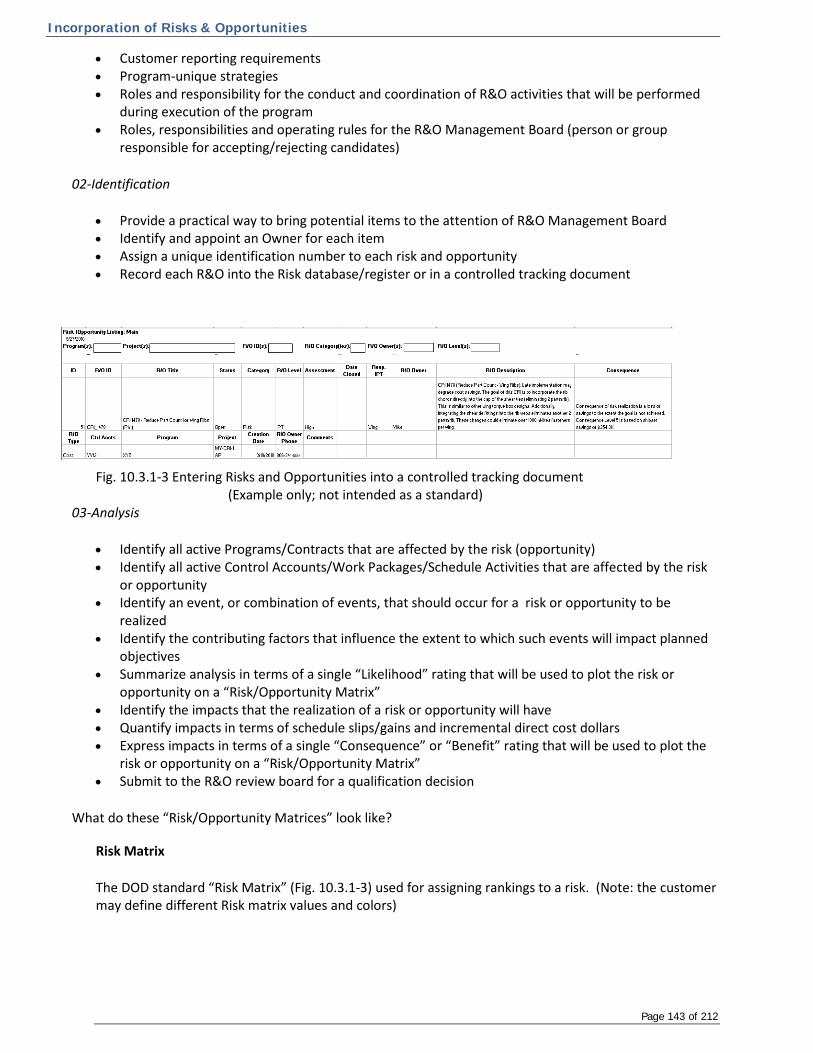
Incorporation of Risks & Opportunities
Page 143 of 212
• Customer reporting requirements • Program-unique strategies • Roles and responsibility for the conduct and coordination of R&O activities that will be performed
during execution of the program • Roles, responsibilities and operating rules for the R&O Management Board (person or group
responsible for accepting/rejecting candidates)
02-Identification
• Provide a practical way to bring potential items to the attention of R&O Management Board • Identify and appoint an Owner for each item • Assign a unique identification number to each risk and opportunity • Record each R&O into the Risk database/register or in a controlled tracking document
Fig. 10.3.1-3 Entering Risks and Opportunities into a controlled tracking document (Example only; not intended as a standard)
03-Analysis
• Identify all active Programs/Contracts that are affected by the risk (opportunity) • Identify all active Control Accounts/Work Packages/Schedule Activities that are affected by the risk
or opportunity • Identify an event, or combination of events, that should occur for a risk or opportunity to be
realized • Identify the contributing factors that influence the extent to which such events will impact planned
objectives • Summarize analysis in terms of a single “Likelihood” rating that will be used to plot the risk or
opportunity on a “Risk/Opportunity Matrix” • Identify the impacts that the realization of a risk or opportunity will have • Quantify impacts in terms of schedule slips/gains and incremental direct cost dollars • Express impacts in terms of a single “Consequence” or “Benefit” rating that will be used to plot the
risk or opportunity on a “Risk/Opportunity Matrix” • Submit to the R&O review board for a qualification decision
What do these “Risk/Opportunity Matrices” look like? Risk Matrix
The DOD standard “Risk Matrix” (Fig. 10.3.1-3) used for assigning rankings to a risk. (Note: the customer may define different Risk matrix values and colors)
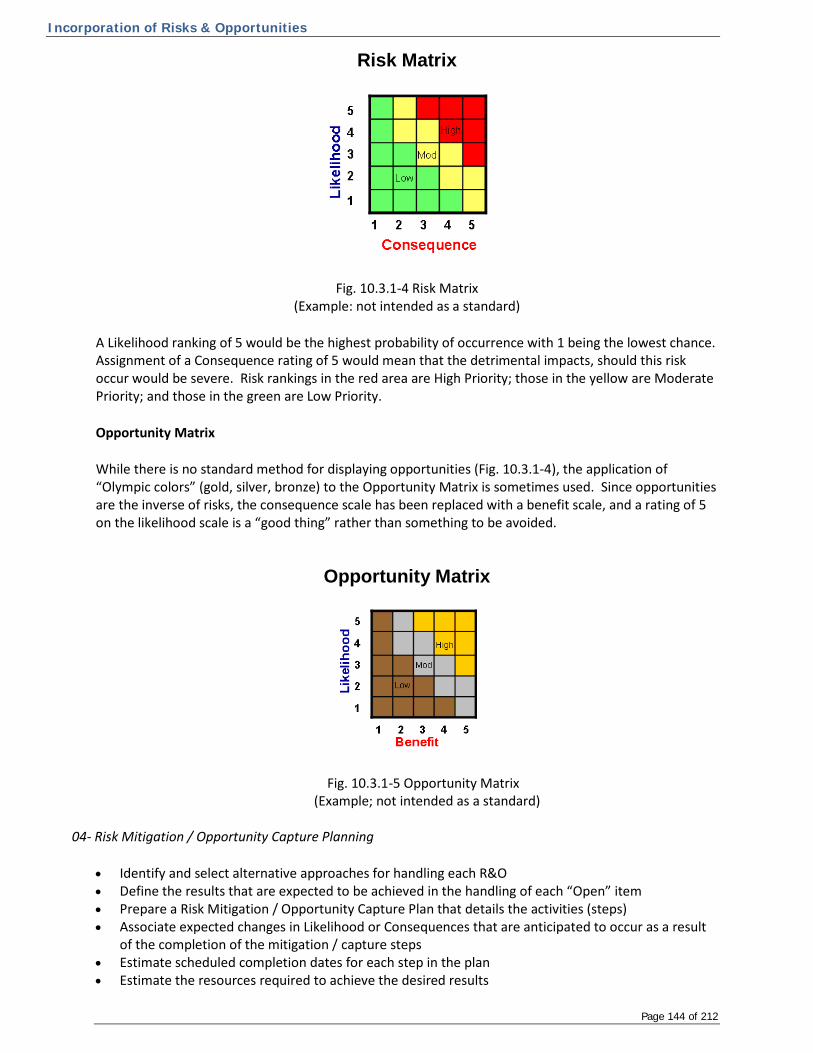
Incorporation of Risks & Opportunities
Page 144 of 212
Risk Matrix
Fig. 10.3.1-4 Risk Matrix (Example: not intended as a standard)
A Likelihood ranking of 5 would be the highest probability of occurrence with 1 being the lowest chance. Assignment of a Consequence rating of 5 would mean that the detrimental impacts, should this risk occur would be severe. Risk rankings in the red area are High Priority; those in the yellow are Moderate Priority; and those in the green are Low Priority.
Opportunity Matrix
While there is no standard method for displaying opportunities (Fig. 10.3.1-4), the application of “Olympic colors” (gold, silver, bronze) to the Opportunity Matrix is sometimes used. Since opportunities are the inverse of risks, the consequence scale has been replaced with a benefit scale, and a rating of 5 on the likelihood scale is a “good thing” rather than something to be avoided.
Opportunity Matrix
Fig. 10.3.1-5 Opportunity Matrix (Example; not intended as a standard)
04- Risk Mitigation / Opportunity Capture Planning
• Identify and select alternative approaches for handling each R&O • Define the results that are expected to be achieved in the handling of each “Open” item • Prepare a Risk Mitigation / Opportunity Capture Plan that details the activities (steps) • Associate expected changes in Likelihood or Consequences that are anticipated to occur as a result
of the completion of the mitigation / capture steps • Estimate scheduled completion dates for each step in the plan • Estimate the resources required to achieve the desired results

Incorporation of Risks & Opportunities
Page 145 of 212
• Enter the steps and resources in the appropriate cost/scheduling tools (i.e. IMS) along with coding necessary for R&O tracking (a unique Risk or Opportunity identification number at a minimum)
05-Work Authorization (Implementation)
• Evaluate the work content of each Risk Mitigation / Opportunity Capture Plan to determine if any, or all, of the proposed implementation steps require the processing and approval of additional work authorization documents (does the action plan represent new scope?)
• Coordinate and initiate the actions needed to generate and release all required work authorization documents including, but not limited to:
o Contract Modifications o Purchase Orders (PO) o Baseline Change Requests (BCR)
• Ensure that all costs incurred in the performance of the Risk Mitigation / Opportunity Capture Plans are recorded against valid charge numbers that have been authorized prior to work being performed or resources being expended
• Ensure that all stakeholders and participants in the execution of an Action Plan understand their work assignments and roles in implementing the plan
• Ensure that all Control Account Managers (CAMs) impacted by the Action Plan understand and record, when applicable, the expected effect of the plan on each Control Account’s Estimate to Complete (ETC) and Estimate at Completion (EAC)
06-Progress Measurement (Tracking)
• Assess the completion status of the steps in each Action Plan • Identify changes to “likelihood” and “consequence/benefit” ratings • Inform stakeholders changes to likelihood and consequences/benefits in a timely manner • Ensure that changes that could impact downstream performance are communicated • Identify items that require submission to the Risk Management Board for review
07-Re-classify / Close-Out
• Ensure that all Risk and Opportunity records in the R&O database/register are maintained to ensure items classified properly and described correctly
• Ensure items are reclassified in the system from “Risk” to “Issue” once the Risk is realized • Consider closing or reclassifying the item when the Risk Mitigation / Opportunity Capture plan is
completed
Things to Promote
Automate transfer of data between R&O management tool and the IMS… • Limits/eliminates redundant effort • Limits translation errors and reconciling effort
Display R&O information with related management data such as: EVMS Dashboards, Labor Accounting, Schedule Metrics and Reports, etc …
• Improves visibility • Effects on cost/schedule performance, Estimates at Complete (EAC), etc. can easily be compared
and analyzed • Easily automated minimizing unnecessary effort and errors
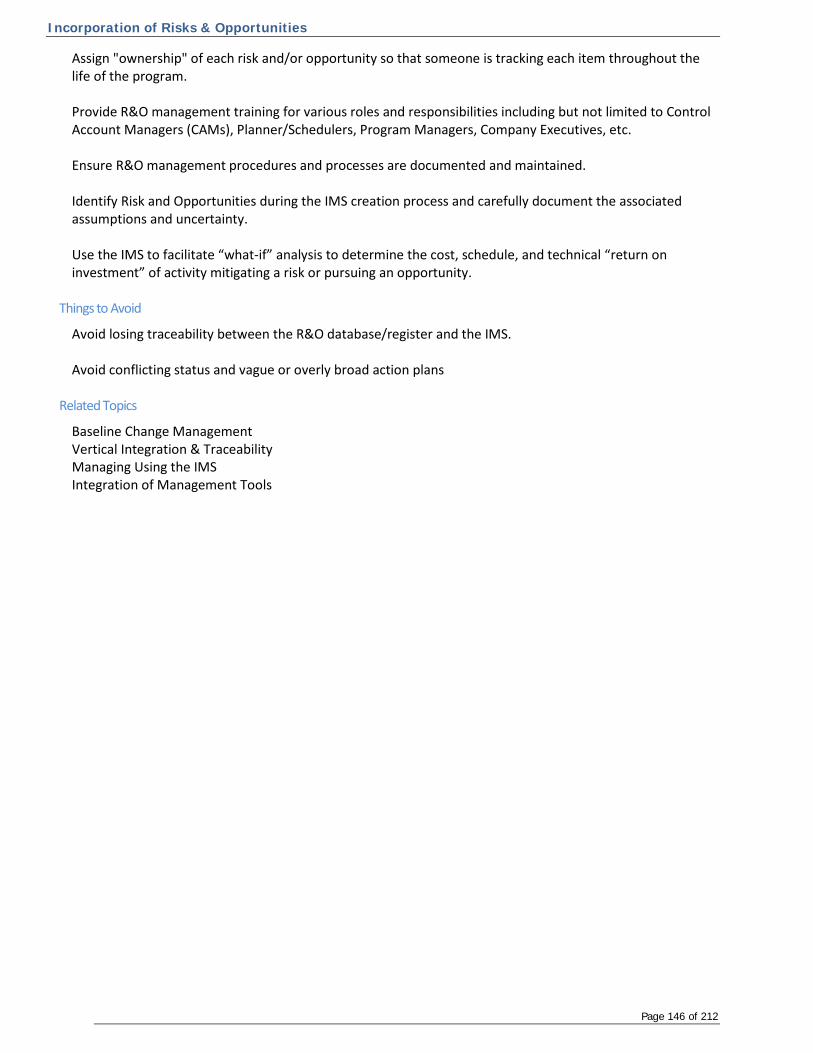
Incorporation of Risks & Opportunities
Page 146 of 212
Assign "ownership" of each risk and/or opportunity so that someone is tracking each item throughout the life of the program. Provide R&O management training for various roles and responsibilities including but not limited to Control Account Managers (CAMs), Planner/Schedulers, Program Managers, Company Executives, etc. Ensure R&O management procedures and processes are documented and maintained. Identify Risk and Opportunities during the IMS creation process and carefully document the associated assumptions and uncertainty. Use the IMS to facilitate “what-if” analysis to determine the cost, schedule, and technical “return on investment” of activity mitigating a risk or pursuing an opportunity.
Things to Avoid
Avoid losing traceability between the R&O database/register and the IMS. Avoid conflicting status and vague or overly broad action plans
Related Topics
Baseline Change Management Vertical Integration & Traceability Managing Using the IMS Integration of Management Tools

Schedule Risk Assessment (SRA) – Setup & Execution
Page 147 of 212
10.3.2 - Schedule Risk Assessment (SRA) – Setup & Execution
Manager’s View
The probability of overrunning a program schedule can be assessed by determining how much risk exists and where it is greatest. The Schedule Risk Assessment (SRA) enables Program Managers to estimate the time and significance of those risks. This is achieved by identifying the highest risk items along the critical and near critical paths in the schedule. This also involves calibrating the risk thresholds of all activities. At the same time, Program Managers should assess all opportunities and consider their probable impact to the schedule during this analysis. The combination of these factors during an SRA will result in a more accurate vision of the schedule’s likely completion. Additionally, through the SRA process, the program team gains an enhanced understanding of the program’s risk and opportunity profile. Many SRA SMEs believe that this is the primary benefit of performing an SRA. The IMS model, including all tasking, logical relationships, durations, constraints and lags should be validated prior to performing a Schedule Risk Assessment. The frequency of Schedule Risk Assessments should be consistent with the risk and complexity of the program. The contractor may elect to conduct SRA analyses more frequently than required by the contract. The optimum case is for the customer and contractor to discuss and agree on the SRA frequency.
Description
The following table (Fig. 10.3.2-1) contains an example of the steps taken during a Schedule Risk Assessment.
P
repa
ratio
n
1. Establish Expectations Establish and agree to the ground rules and assumptions
2. Determine Reporting Tasks Determine the key or high risk tasks/milestones for which statistical data will be collected during the risk analysis (simulation)
3. Assess & Prepare IMS Ensure the IMS is healthy and consistent with the ground rules and assumptions
Dat
a Co
llect
ion
4. Determine Critical/Driving Paths & High Risk Items
Identify and validate critical, near critical, driving, and near driving paths, in addition to the high risk tasks which will require individual three-point estimates
5. Determine Three Point Estimates
Solicit and validate CAM inputs for individually determined and globally applied (for tasks that are not high risk or on a critical/driving path) three point estimates
6. Determine Distribution Curves Solicit and validate CAM inputs for distribution curves based on known factors about tasks, three point estimates, and confidence in the schedule

Schedule Risk Assessment (SRA) – Setup & Execution
Page 148 of 212
Exec
ute
7. Conduct Risk Analysis Setup the SRA files, assign risk parameters, run the risk simulation and analyze the results
Res
ults
8. Produce SRA Out Brief Develop and provide an SRA out brief to leadership
9. Leadership Follow-up Determine follow-up actions to reduce or eliminate risks and/or capture opportunities. Monitor execution and SRA trends over time.
Fig. 10.3.2-1 Example Schedule Risk Assessment (SRA) Process Flow Technical Details The Schedule Risk Assessment determines program-level schedule risk as a function of risk associated with various activities that compose the program. Probability distributions are developed for each activity using 3-point duration estimates (Maximum, Most Likely, & Minimum) with reference to historical data. The method uses these distributions in a Monte Carlo simulation of the schedule to derive a probability distribution of total program completion or other key dates within the program. It also identifies the activities most likely to delay the program completion so they can be targeted for risk mitigation. The resulting program level schedule is then analyzed to determine the actual schedule risk and to identify the schedule drivers. Schedule Risk Assessment expands the Critical Path Method (CPM) of determining the most likely finish dates by taking into account the probability and impact of risks and opportunities on the Integrated Master Schedule. The CPM approach uses only a single point (most likely) estimate for the duration of program activities to develop the programs expected duration and schedule. Use of only a deterministic schedule management approach can lead to underestimating the time required to complete the program and schedule overruns. This occurs for three reasons:
• The single point estimates do not adequately address the uncertainty inherent in individual activities and in many programs are underestimated
• Predicting the future is difficult and humans tend to be optimistic about it • The structure of the schedules implies extra risk at points where paths merge
At these merge points a delay on any of the merging paths will cause the program to be delayed, so its progress is sensitive to delays on all paths. After the SRA is run the Risk software will indicate how often a task is on the critical path for the number of trials. Tasks on the Critical Path a high percentage of the time represent the “Probabilistic Critical Path” and may be different from the “Deterministic Critical Path”
Schedule Risk Assessment Parameters
• 3 Point Duration Estimates – developed using consistent criteria with accompanying rationale
o Individually assigned 3 point durations = tasks on critical and near critical paths
o Individually assigned 3 point durations = tasks driving key program level milestones (SRR, PDR, CDR) which are of interest to the Program Team
o Individually assigned 3 point durations = tasks tied to risk mitigation or capture opportunities as called out in the program’s Risk & Opportunity Management Process
Schedule Risk Assessment (SRA) – Setup & Execution
Page 149 of 212
o Globally assigned 3 point durations = logical groupings of tasks that are not individually assigned
• Distribution curves
o There are a multitude of distributions curves available for programs to use during SRA. Please ensure you understand the available options and the rationale for their use. The following three distribution curves are the most common.
o Beta Distribution
Use when: you have a high confidence in 3 point durations Curve is: bell shaped and falls very quickly from the peak Peak is: off center
o Normal Distribution
Use when: you have a moderate confidence in 3 point durations Curve is: bell shaped and falls quickly from the peak Peak is: center
o Triangular Distribution
Use when: risk is high, historically realized or unknown or on globally applied 3 point durations
Curve is: triangular shaped distribution curve that steadily decreases Peak is: off center
Things to Consider
Hard Constraints – remove hard constraints from the IMS prior to running an SRA as hard constraints impact the forward and backward pass and can cause inaccurate SRA results Level of Effort (LOE) – an LOE task should never drive discrete work. It should be excluded from the SRA. Planning Packages – for SRA purposes treat Planning Packages the same as every other discrete task by ensuring they are logically linked in the network and have 3 point durations assigned. Interface Handoff Milestones – these represent receipts/deliveries from/to external sources and will need modification to accurately impact the SRA process. Methods for consideration include using 3 point milestone date estimates (not all risk tools can do this), or assigning the earliest receipt/delivery dates as a soft start constraint then adjusting the most likely duration to be consistent with the most likely receipt/delivery date and the worst case duration to be consistent with the worst case receipt/delivery date (this might require duplicating the milestone as a task in some tools). Note: when modeling 3 point estimates on milestones ensure that the succeeding relationships are all FS. See Schedule Risk Assessment in DI-MGMT-81650 (IMS DID) or Integrated Program Management Report (IPMR) DID (current version) for additional information and requirements.

Schedule Risk Assessment (SRA) – Setup & Execution
Page 150 of 212
Calculations
Monte Carlo simulation is the most common technique used when performing an SRA. Monte Carlo methods are computational algorithms that rely on repeated sampling to compute their results. This method is most often used when it is unfeasible or impossible to compute an exact result with a deterministic algorithm. Various combinations of each input variable are randomly chosen (Min, Max, or most likely) based on the distribution curves and the results recorded for each scenario. Monte Carlo simulation considers random sampling of probability distribution functions as model inputs to produce thousands of possible outcomes instead of a few discrete scenarios. The results provide probabilities of different outcomes occurring. The opposite of Monte Carlo simulation might be considered deterministic modeling using single-point estimates.
Optional Techniques
PERT (Project Evaluation and Review Technique) Method – Analyzes the tasks involved in completing a task or milestone within the period of performance of a program. It helps identify the minimum amount of time it will take to complete specific tasks in the program and to complete the entire program.
• Optimistic time (O): the minimum possible time required to accomplish a task, assuming everything proceeds better than is normally expected.
• Pessimistic time (P): the maximum time required to accomplish a task, assuming everything goes wrong (but excluding major catastrophes).
• Most likely time (M): the likeliest estimate of the time required to accomplish a task, assuming everything proceeds as normal.
• Expected time (TE): the likeliest estimate of the time required to accomplish a task, assuming everything proceeds as normal (the implication being that the expected time is the average time the task would require if the task were repeated on a number of occasions over an extended period of time).
TE = (O + 4M + P) ÷ 6 (Key: O= optimistic or Min, M=Most Likely, P= Pessimistic or Max)
Latin Hypercube Sampling - An alternative to Monte Carlo sampling is Latin hypercube. The statistical method of Latin hypercube sampling (LHS) was developed to generate a distribution of plausible collections of parameter values from a multidimensional distribution. The sampling method is often applied in uncertainty analysis. Latin hypercube is often used where the sample size is small.
Things to Promote
A well constructed IMS with a sound logical network is essential to conducting a good SRA. Program Management (as well as government program management) support and commitment to the process will yield more realistic and actionable results. Commitment to the SRA process will give the program insight to previously unseen risks and opportunities that could affect the schedule. Exclude LOE and recurring CDRL deliveries from the SRA analysis. If a Schedule Margin task is used in the IMS, its durations should be zeroed out prior to running an SRA such that the Schedule Margin task does not impact the probability calculations of the discrete tasking in the IMS

Schedule Risk Assessment (SRA) – Setup & Execution
Page 151 of 212
Document the methodology for determination of minimum and maximum duration estimates in the IMS Supplemental Guidance and if applicable the Risk Management Plan.
Things to Avoid
The file used to conduct the SRA should never be reused as the working file. The algorithms used during the Monte Carlo analysis could affect the data in other fields. Base the SRA on the programs logical network that represent the true path forward. Avoid making changes to the logic network that do not represent that true path forward during the SRA process.
Related Topics
Critical & Driving Path Analysis Incorporation of Risk & Opportunities Task Durations

Schedule Risk Assessment (SRA) - Analysis
Page 152 of 212
10.3.3 - Schedule Risk Assessment (SRA) – Analysis
Manager’s View
Conducting SRAs will lead to the development of more realistic program schedules and help managers make timely, informed decisions that increase the probability of achieving or exceeding expectations. Based on the output analysis, an SRA may also lead to opportunities to develop and implement risk mitigation plans. Risk Histograms
o Identify the probability of “on time” program completion o Displays the confidence levels for specific events to occur on specific dates
Sensitivity Analysis and Criticality Indexes
o Isolate specific activities that are most likely to o cause a schedule delay or cost overrun o provide opportunity to bring in schedule or decrease cost
The payoff is a forward-looking process that will help program leaders make informed decisions faster, leading to improved performance and increased customer confidence.
Description
Probability Thresholds - Prior to conducting an SRA, programs define the probability thresholds and understand what actions could result from an SRA output. The probability threshold is the completion probability of success for any milestone (i.e. the program may accept an 85% probability of completing the program by the contractually required date). This threshold is completely dependent on the program and customer specificities. The program should determine its threshold objectives and socialize these objectives with all stakeholders. Output Analysis – The data that comes out of the schedule risk assessment is for analysis purposes. This data allows for the identification of risks and opportunities within the program IMS. No one output should be used in isolation. When the results are all used in concert, the decisions that are made will be comprehensive, and will make an impact in the right portion of the schedule. Programs should assess the confidence level and validity of the SRA, communicate results, and propose options to key stakeholders. Clearly identify the items that are eligible and in need of risk mitigation or have an opportunity to implement. Identify the correct stakeholders to create and execute the mitigation plan and then apply the plan to the IMS. Incorporate the results of the analysis into the EAC and IMS forecasts. If the Completion Probability desired by the program is not achieved as part of the SRA trial, the program team should investigate additional mitigation of the IMS, re-assess the validity of SRA assumptions for Min/Max duration and review the setup criteria (LOE and Milestone Exclusion) to ensure that a valid SRA trial was executed. The goal of running an SRA is in developing a plan which meets the program’s Probability threshold. SRA results should not be perceived as a deterministic predictor of exact dates, but instead a method to identify opportunities/risks impacting milestones. SRA resulting dates represent a hypothetical version of the schedule after risk/opportunity is introduced and before opportunity is acted upon or risk mitigated.

Schedule Risk Assessment (SRA) - Analysis
Page 153 of 212
Example
Sensitivity Analysis (Tornado Chart)
Fig. 10.3.3-1 Sensitivity Analysis, also known as a tornado chart
Sensitivity Analysis (Fig.10.3.3-1): identifies the tasks, in descending order, that have the largest impact (positive or negative), according to the SRA simulation, on the event Analysis Histogram
Fig. 10.3.3-2 Risk Histogram Sample output (Risk+ output provided as an example only)
Analysis Histogram (Fig. 10.3.3-2) Key:
Top Left (Key): contains a date/time stamp, the number of samples in the analysis (iterations) run, and the Unique ID and name of the reporting task (i.e., the task or milestone to which completion is measured.
Bottom Left (histogram): the earliest, expected and latest completion dates are represented as the three dates at the bottom of the histogram. The left side of the histogram indicates the number of times (i.e. frequency) that an iteration completed on a given date while the cumulative probability curve is the line drawn in the graph and is relational to the value displayed on the right.
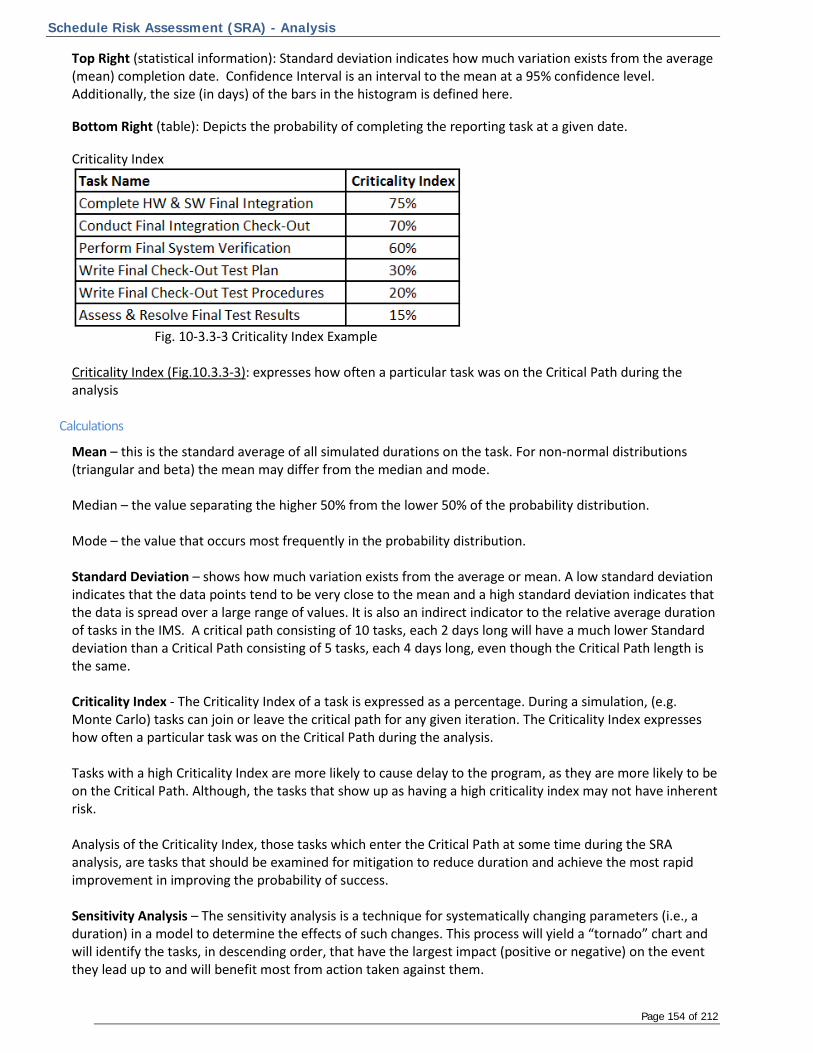
Schedule Risk Assessment (SRA) - Analysis
Page 154 of 212
Top Right (statistical information): Standard deviation indicates how much variation exists from the average (mean) completion date. Confidence Interval is an interval to the mean at a 95% confidence level. Additionally, the size (in days) of the bars in the histogram is defined here.
Bottom Right (table): Depicts the probability of completing the reporting task at a given date.
Criticality Index
Fig. 10-3.3-3 Criticality Index Example Criticality Index (Fig.10.3.3-3): expresses how often a particular task was on the Critical Path during the analysis
Calculations
Mean – this is the standard average of all simulated durations on the task. For non-normal distributions (triangular and beta) the mean may differ from the median and mode. Median – the value separating the higher 50% from the lower 50% of the probability distribution. Mode – the value that occurs most frequently in the probability distribution. Standard Deviation – shows how much variation exists from the average or mean. A low standard deviation indicates that the data points tend to be very close to the mean and a high standard deviation indicates that the data is spread over a large range of values. It is also an indirect indicator to the relative average duration of tasks in the IMS. A critical path consisting of 10 tasks, each 2 days long will have a much lower Standard deviation than a Critical Path consisting of 5 tasks, each 4 days long, even though the Critical Path length is the same. Criticality Index - The Criticality Index of a task is expressed as a percentage. During a simulation, (e.g. Monte Carlo) tasks can join or leave the critical path for any given iteration. The Criticality Index expresses how often a particular task was on the Critical Path during the analysis. Tasks with a high Criticality Index are more likely to cause delay to the program, as they are more likely to be on the Critical Path. Although, the tasks that show up as having a high criticality index may not have inherent risk.
Analysis of the Criticality Index, those tasks which enter the Critical Path at some time during the SRA analysis, are tasks that should be examined for mitigation to reduce duration and achieve the most rapid improvement in improving the probability of success. Sensitivity Analysis – The sensitivity analysis is a technique for systematically changing parameters (i.e., a duration) in a model to determine the effects of such changes. This process will yield a “tornado” chart and will identify the tasks, in descending order, that have the largest impact (positive or negative) on the event they lead up to and will benefit most from action taken against them.

Schedule Risk Assessment (SRA) - Analysis
Page 155 of 212
The Sensitivity Analysis results should also help in identifying tasks for which mitigation would most effectively benefit the program. These tasks are typically on the Critical or Near Critical Path(s). The most effective method of achieving reduced program duration is to examine the Critical Path with the secondary and tertiary Critical Paths, code these IMS tasks so they can be displayed together and identify the intersection points of these various paths as points to mitigate. Mitigating this one intersecting task, or an IMS task immediately succeeding it, has the effect of mitigating both branches at the same time. Work your way down the path, identifying areas that mitigation can be applied to achieve duration reductions that bring the analysis to the program’s acceptable probability of success. Confidence Interval – The size of the interval that contains the real mean to the specified level of certainty. Completion Standard Deviation – For distributions that approximate the normal curve, this reflects that about 68% of the completion dates should be within plus or minus the number of days specified. Completion Probability – This is the probability of completing the reporting task by a certain date. The Completion Probability date has a plus/minus range of days indicated in the standard deviation.
Things to Promote
Any schedule improvements supporting the SRA process should be considered and possibly implemented in the active IMS.
Ensure that new risks and opportunities identified in the SRA process are captured and added to the program’s Risk & Opportunity Register/database.
Related Topics
Schedule Risk Assessment (SRA) – Setup & Execution Managing Using an IMS Horizontal Traceability Task Durations

Schedule Execution Metrics
Page 156 of 212
10.4 - Schedule Execution Metrics
This section contains the following chapters…
10.4.1 - Intro to Schedule Execution Metrics
10.4.2 - Critical Path Length Index (CPLI)
10.4.3 - Schedule Performance Index (SPI)
10.4.4 - Baseline Execution Index (BEI)
10.4.5 - Current Execution Index (CEI)
10.4.6 - Total Float Consumption Index (TFCI)
10.4.7 - Duration-Based vs. Scope-Based Percent Complete
10.4.8 - Schedule Rate Chart

Intro to Schedule Execution Metrics
Page 157 of 212
10.4.1 - Intro to Schedule Execution Metrics
The following chapters introduce a set of schedule analysis and execution metrics intended to assist the program team in using the IMS to make sound programmatic decisions. The content includes a brief over view of Critical Path Length Index (CPLI), Baseline Execution Index (BEI), and Schedule Performance Index (SPI), Duration-Based vs. Scope-Based Percent Complete, Schedule Rate Charts, and Current Execution Index (CEI). Consider this list of execution metrics as a representative example and not an exhaustive list of schedule execution metrics available to programs. Program teams should develop and tailor a suite of schedule execution metrics in conjunction with other forms of schedule analysis (Critical/Driving Path Analysis, Schedule Risk Assessment, and Schedule Health Assessment etc.) and use them on a recurring basis to interpret and understand schedule information.
Overall, this guide advocates the use of the IMS primarily as a management tool versus a reporting tool. A handful of the schedule metrics listed in this guide may be required for delivery to your internal or external management teams and customers. A word of caution on the value of metrics, avoid manipulating the schedule with the intent of producing favorable metrics for reporting purposes as this severely impacts the value of the IMS as a management tool. It also important to note that frequent baseline changes (i.e. replanning, reprogramming) can also alter the effectiveness of the IMS as a management tool.
Each of the schedule execution metrics presented in the guide, and those that are not in the guide, assess schedule performance in different ways, from various angles and data sets. As such, programs run the risk of drawing false conclusions from a single metric. To mitigate this risk, programs should utilize a suite of complimentary schedule metrics to corroborate potential schedule risks and execution concerns.
Bottom line, the objective of using schedule execution metrics is to identify potential issues, propose and implement solutions, and assess the effectiveness of those solutions. The objective is not to simply have a report card.

Critical Path Length Index (CPLI)
Page 158 of 212
10.4.2 - Critical Path Length Index (CPLI)
Manager’s View
The Critical Path Length Index (CPLI) measures how realistic the program completion date is, based on the remaining duration of the critical path and the amount of total float available. CPLI is one of DCMA’s 14- Point Assessment Metrics and identifies programs that are having difficulty executing their critical path. The target for CPLI is 1.0 or greater. A lower value indicates an increased risk of being late at program completion.
Description
Calculate CPLI using the following formula: CPLI = Critical Path Length + Total Float Critical Path Length Where, Critical Path Length is the number of days from time now to the early finish date of the task or milestone representing program completion. Total Float on the task or milestone representing program completion may be either positive or negative. The result is an index that measures the sufficiency of the total float available relative to the remaining duration of the critical path. For example, 20 days of float on a critical path that has 80 days remaining would result in a CPLI of 1.25 indicating a low risk of not completing on time. However, if the critical path has 800 days remaining, a total float of 20 days would result in a CPLI of 1.03. Although this is still above the target of 1.0, it indicates there is much less room for error. To achieve a CPLI of 1.25 in this case would require 200 days of total float.
CPLI also measures the relative efficiency required to complete the program critical path on time. A CPLI of 1.00 means the program has 0 days of total float available on the critical path and therefore should accomplish one day’s worth of work for every day that passes. This means the program should execute the critical path at a 100% efficiency rate to complete on time. A CPLI less than 1.00 indicates that the program is not executing the critical path as planned and has created a negative total float condition potentially delaying program completion. To prevent this from happening, the program should now accomplish more than one day of work for every day that passes. This means the program should now execute the critical path at an efficiency rate higher than 100%. Likewise, a CPLI greater than 1.00 indicates that the program is executing the critical path ahead of plan and still has positive total float remaining. As a result the program has a lower risk of delaying program completion since they can operate at an efficiency rate of less than 100% and still complete on time Typically, programs calculate CPLI to program completion or an interim milestone. Any activities on or near the program critical path can directly impact this metric if not completed as planned. Note: CPLI will not work correctly, if the network does not have a constrained finish date on the task representing program completion, because the result would be a Critical Path that has zero total float and a CPLI of 1.00 at all times.
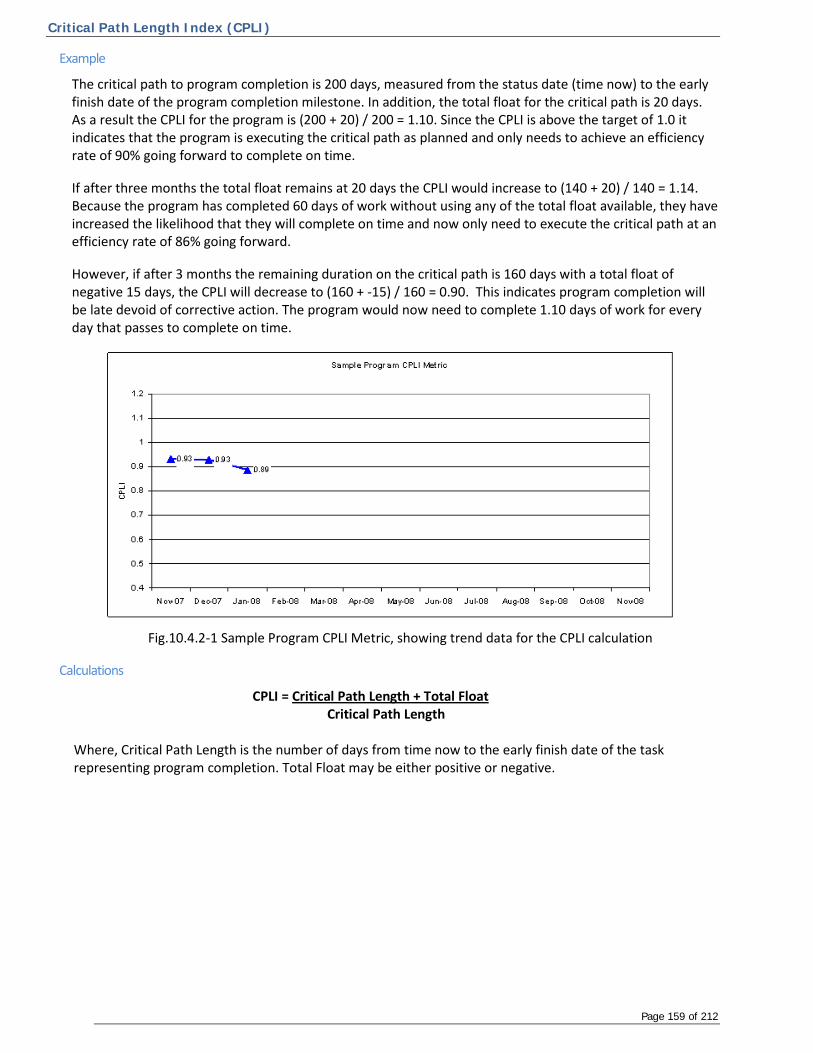
Critical Path Length Index (CPLI)
Page 159 of 212
Example
The critical path to program completion is 200 days, measured from the status date (time now) to the early finish date of the program completion milestone. In addition, the total float for the critical path is 20 days. As a result the CPLI for the program is (200 + 20) / 200 = 1.10. Since the CPLI is above the target of 1.0 it indicates that the program is executing the critical path as planned and only needs to achieve an efficiency rate of 90% going forward to complete on time.
If after three months the total float remains at 20 days the CPLI would increase to (140 + 20) / 140 = 1.14. Because the program has completed 60 days of work without using any of the total float available, they have increased the likelihood that they will complete on time and now only need to execute the critical path at an efficiency rate of 86% going forward.
However, if after 3 months the remaining duration on the critical path is 160 days with a total float of negative 15 days, the CPLI will decrease to (160 + -15) / 160 = 0.90. This indicates program completion will be late devoid of corrective action. The program would now need to complete 1.10 days of work for every day that passes to complete on time.
Fig.10.4.2-1 Sample Program CPLI Metric, showing trend data for the CPLI calculation
Calculations
CPLI = Critical Path Length + Total Float Critical Path Length Where, Critical Path Length is the number of days from time now to the early finish date of the task representing program completion. Total Float may be either positive or negative.

Critical Path Length Index (CPLI)
Page 160 of 212
Resulting Values
Fig.10.4.2-2 Interpretation of CPLI Results
Optional Techniques
The traditional method of monitoring Total Float also provides management with insight into how well the program is executing the Critical Path and provides an early warning of potential impacts to program completion.
Things to Promote
Tracking CPLI results over time to monitor trends can provide additional insight and an early warning into potential problem areas. Because CPLI is an index, it normalizes the results and allows for comparisons between programs.
Things to Avoid
CPLI is an indicator of the efficiency related to the tasks on the critical path, and does not necessarily provide insight into other tasks in the schedule. It is important to monitor other metrics like BEI and SPI and not rely on CPLI as the sole indicator of program schedule performance. The CPLI metric becomes meaningless once the program has passed its required completion date but is not yet complete. The CPLI metric will only be accurate if the IMS is a well-constructed predictive model with a validated Critical Path.
Related Topics
Baseline Execution Index (BEI) Schedule Performance Index (SPI) Critical & Driving Path Analysis Current Execution Index (CEI)

Schedule Performance Index (SPI)
Page 161 of 212
10.4.3 - Schedule Performance Index (SPI)
Manager’s View
Schedule Performance Index (SPI) is an Earned Value Management tool comparing Baseline Cost of Work Performed (BCWP) with Baseline Cost of Work Scheduled (BCWS) to indicate cumulative and monthly schedule performance. It is an early warning tool used to determine if the schedule is at risk and indicates whether the program should increase efficiency to complete on time.
Description
SPI is a summary level snapshot measuring how well the program (or a portion of the program) has actually performed to the baseline plan. SPI is similar in function to the Baseline Execution Index (BEI), except it is a ratio based on the earned value fundamentals of Budgeted Cost of Work Scheduled (BCWS) and Budgeted cost of Work Performed (BCWP).
Comparison to BEI
SPI is similar in function to the Baseline execution Index (BEI). For additional information, please refer to the topics listed below within the BEI Chapter:
• Advantages of BEI Over SPI • Advantages of SPI Over BEI • End-of-Project Dampening • “Average” Metric
Example
Fig. 10.4.3-1 Method of calculation for SPI
Calculations
BCWS (Budgeted Cost of Work Scheduled) - The approved budget allocated to complete a program to Timenow (also referred to as the “Planned Value (PV)”). BCWP (Budgeted Cost of Work Performed) - The budgeted cost of work actually performed on a program to date (also referred to as the “Earned Value (EV)”).

Schedule Performance Index (SPI)
Page 162 of 212
Resulting Values
Similar to reading BEI or CPI, an SPI value of 1.00 indicated the effort is progressing as planned (per the baseline). Values above 1.00 denote performance better than planned, while values below 1.00 suggest poorer performance than planned.
SPI Value Implication
> 1.00 Favorable – The program on average is being accomplished at a faster than planned rate
= 1.00 On Track – The program on average is performing to plan
< 1.00 Unfavorable – The program on average is being accomplished at a slower rate than was planned
Fig. 10.4.3-2 SPI Interpretation Guide
Periodicity
SPI should be calculated and analyzed after each Earned Value status period. For most programs, this is monthly, but may be more or less frequent depending on the effort or contractual requirement.
Things to Promote
Understanding the impact of LOE, this can skew SPI as it always earns BCWP in-line with BCWS. BEI and SPI should be used in conjunction with sound critical path analysis, and never as a stand-alone indicator of the health of a program.
Related Topics
Baseline Execution Index (BEI) Critical & Driving Path Analysis

Baseline Execution Index (BEI)
Page 163 of 212
10.4.4 - Baseline Execution Index (BEI)
Manager’s View
Baseline Execution Index (BEI) measures the number of tasks completed as a ratio to those tasks that should have completed to date according to the original (baseline) plan. It reveals the “execution pace” for a program and provides an early warning of increased risk to on-time completion. Note: BEI is one of the DCMA 14-Point Assessment Metrics
Description
BEI is a summary level snapshot measuring how well the program (or a portion of the program) has actually performed to the baseline plan. The BEI is a simple index measure of a count of completed tasks with a count of tasks schedule to be completed. As with most indices, 1.0 is ideal, a number greater than 1.0 indicates more task completions than planned and a number less than 1.0 indicates fewer completed tasks than planned. Management can use this metric to evaluate schedule progress towards the baseline plan. BEI is similar in function to the Schedule Performance Index (SPI), except it is a ratio based on a simple task count.
Advantages of BEI over SPI
Objectivity • BEI is a more objective metric than SPI
o Programs consider BEI an objective assessment since it is based on the planned and actual completion of activities.
o SPI has at least some degree of embedded subjectivity due to the earned value assessments made on in-progress effort.
Potency • SPI may be a more “watered down” index than BEI
o Level-of-Effort (LOE) tasks are excluded from BEI calculations. The primary reason for this exclusion is to keep the LOE from “masking” the true state of the program.
o LOE is generally included in the calculation of a program’s SPI (although programs can exclude LOE). Much like BEI, the inclusion of LOE on SPI effectively dampens (skews toward 1.00) the true execution performance of a program.
Advantages of SPI over BEI
• SPI is more sensitive than BEI o BEI places equal importance/weight on all activities. Because of this, completing a complex
500-hour activity will affect the metric calculation the same as completing a routine 5-hour activity.
o SPI weights activities by their planned resource loading. Therefore, activities that require more effort will have a greater affect the SPI calculation.
BEI (and SPI) Flaws
End-of-Project Dampening No matter how early or late a program completes, BEI (and SPI) calculations will eventually equal 1.00. This is due to the fact that once everything is in the rear-view mirror, the numerator and denominator for BEI will be equivalent (if 1000 tasks were planned to complete and the program is finished, by definition, 1000 activities were actually completed).
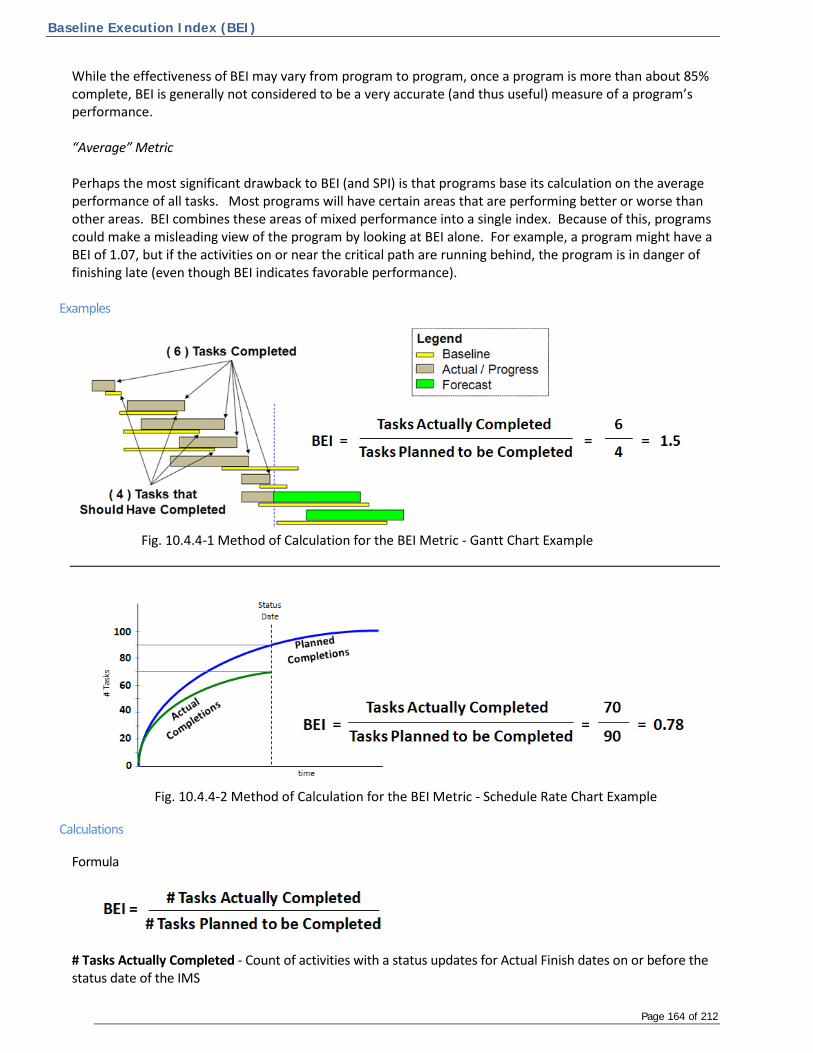
Baseline Execution Index (BEI)
Page 164 of 212
While the effectiveness of BEI may vary from program to program, once a program is more than about 85% complete, BEI is generally not considered to be a very accurate (and thus useful) measure of a program’s performance. “Average” Metric Perhaps the most significant drawback to BEI (and SPI) is that programs base its calculation on the average performance of all tasks. Most programs will have certain areas that are performing better or worse than other areas. BEI combines these areas of mixed performance into a single index. Because of this, programs could make a misleading view of the program by looking at BEI alone. For example, a program might have a BEI of 1.07, but if the activities on or near the critical path are running behind, the program is in danger of finishing late (even though BEI indicates favorable performance).
Examples
Fig. 10.4.4-1 Method of Calculation for the BEI Metric - Gantt Chart Example
Fig. 10.4.4-2 Method of Calculation for the BEI Metric - Schedule Rate Chart Example
Calculations
Formula
# Tasks Actually Completed - Count of activities with a status updates for Actual Finish dates on or before the status date of the IMS
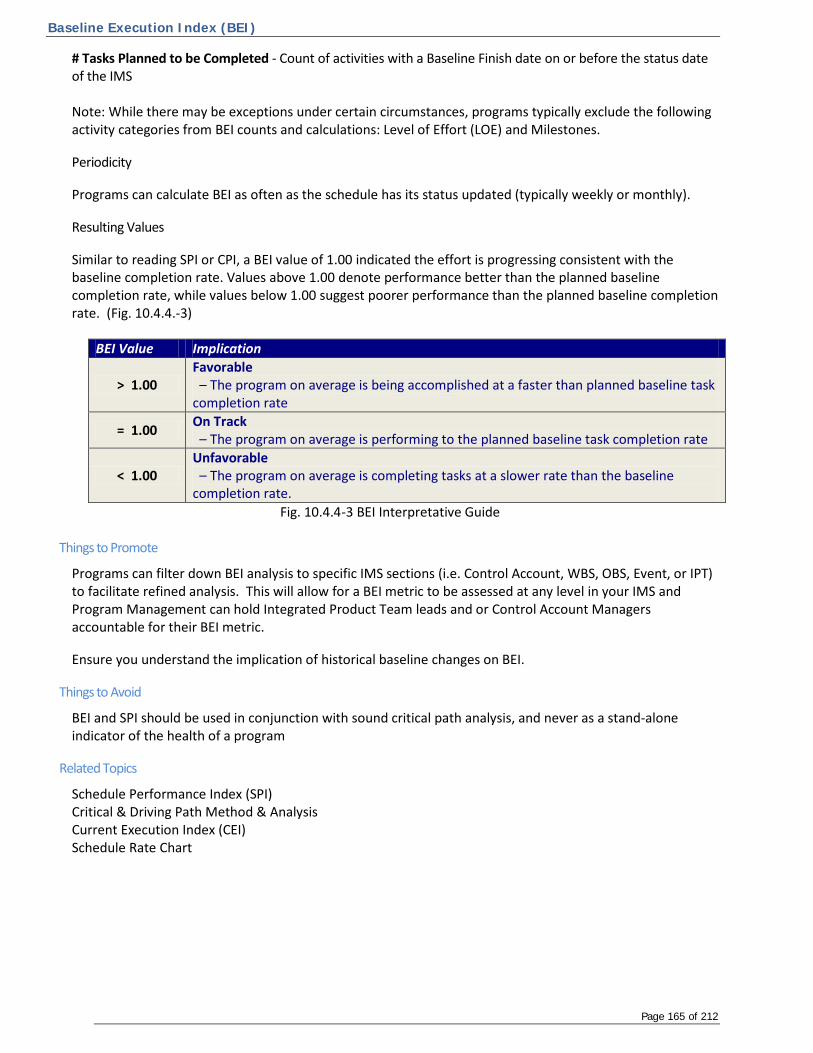
Baseline Execution Index (BEI)
Page 165 of 212
# Tasks Planned to be Completed - Count of activities with a Baseline Finish date on or before the status date of the IMS Note: While there may be exceptions under certain circumstances, programs typically exclude the following activity categories from BEI counts and calculations: Level of Effort (LOE) and Milestones.
Periodicity
Programs can calculate BEI as often as the schedule has its status updated (typically weekly or monthly).
Resulting Values
Similar to reading SPI or CPI, a BEI value of 1.00 indicated the effort is progressing consistent with the baseline completion rate. Values above 1.00 denote performance better than the planned baseline completion rate, while values below 1.00 suggest poorer performance than the planned baseline completion rate. (Fig. 10.4.4.-3)
BEI Value Implication
> 1.00 Favorable – The program on average is being accomplished at a faster than planned baseline task completion rate
= 1.00 On Track – The program on average is performing to the planned baseline task completion rate
< 1.00 Unfavorable – The program on average is completing tasks at a slower rate than the baseline completion rate.
Fig. 10.4.4-3 BEI Interpretative Guide
Things to Promote
Programs can filter down BEI analysis to specific IMS sections (i.e. Control Account, WBS, OBS, Event, or IPT) to facilitate refined analysis. This will allow for a BEI metric to be assessed at any level in your IMS and Program Management can hold Integrated Product Team leads and or Control Account Managers accountable for their BEI metric.
Ensure you understand the implication of historical baseline changes on BEI.
Things to Avoid
BEI and SPI should be used in conjunction with sound critical path analysis, and never as a stand-alone indicator of the health of a program
Related Topics
Schedule Performance Index (SPI) Critical & Driving Path Method & Analysis Current Execution Index (CEI) Schedule Rate Chart

Current Execution Index (CEI)
Page 166 of 212
10.4.5 - Current Execution Index (CEI)
Manager’s View
Current Execution Index (CEI) is a schedule execution metric that measures how accurately the program is forecasting and executing to its forecast from one period to the next. Its design is to encourage a forward-looking perspective to IMS and program management. The real benefit of implementing CEI is an increased program emphasis on ensuring the accuracy of the forecast schedule. This results in a more accurate predictive model and increases the program’s ability to meet its contractual obligations on schedule.
Description
The goal of this metric is to measure and indicate how well the near term schedule represents what actually takes place through execution. This measurement provides insight into the accuracy of the forecast schedule and its abilities as a predictive model. The index maximum is 1.00, but a sound forecast schedule will consistently trend in the greater than 80th percentile range. There is a direct correlation between the lower probability (less than 80 % probability of completion) and the program’s ability to manage the projected near term tasks. This indicates that work is slipping to the right and possibly adding to the “bow wave” of unachievable work. Use of the CEI metric drives ownership and accountability behaviors that are necessary for program success when consistently used by program management.
You can derive CEI by comparing the number of tasks forecasted to finish within the status period to the number of those tasks that actually did finish within the status period.
The process for collecting the data necessary to calculate CEI is as follows:
1. At the beginning of the status period, create a “snapshot” of the status period (capturing Forecast Finishes).
2. Execute through the status period. 3. Retrieve initial “snapshot". 4. Compare actual finish dates to the initial “snapshot”.
Program teams that can effectively manage the road ahead have a higher percentage of success. The intent of CEI is to focus the program team on ensuring the forecast schedule is accurate and then executing to it as effectively as possible.
Calculations
Current Execution Index (CEI) = # of tasks that finished in the window (of those tasks forecasted to finish in the defined window)
-Divided by- # of tasks forecasted to finish in the defined window
Note: Tasks in this formula include 'Discrete', 'Milestones' and 'LOE' (if LOE is in the schedule) and exclude Summary lines. Be careful when establishing the parameters of this metric, unlike BEI, the numerator
should contain only tasks that were previously forecasted to finish and did finish in the defined window.
Example
37 = # of tasks forecasted to finish in the window 29 = # of tasks that finished in the window (out of the 37 forecasted to finish in the window) CEI = 29/37 = .78
Optional Techniques
You can also measure "start CEI" using the start dates vice the finish dates.

Current Execution Index (CEI)
Page 167 of 212
Things to Promote
Good program management is good people management. The intent of this metric is to drive behavior by motivating and influencing the program team to focus on the accuracy and execution of the forecast schedule. By influencing the “soft” or “people” side of program management, the program team increases its chance of success.
Note: People will adapt their behaviors to succeed if they perceive success is measured. Changing people’s behavior creates new experiences that in turn create new attitudes. Over time, the new attitudes fuse into a new culture: a culture where program success is possible.
Things to Avoid
Work to keep CEI percentages above 80%. CEI percentages lower than 80% directly correlate to the program team’s ability to manage successfully.
Related Topics
Program Schedule Reviews Status to Timenow Forecasting Business Rhythm

Total Float Consumption Index (TFCI)
Page 168 of 212
10.4.6 - Total Float Consumption Index (TFCI)
Manager’s View
Many duration-based schedule metrics capture status as a “moment in time” and do not consider what would happen if the program continued at its current rate of total float consumption Total Float Consumption Index (TFCI) applies the schedule’s current rate of total float consumption to the remaining scope of work and projects a forecast finish date of the entire project. Applying the most recent rate of duration-based efficiency is analogous to applying the most recent rate of cost efficiency (TCPI) to an expected cost at the end of the project (EAC).
Description
The focus of the TFCI is to provide a duration-based performance index calculating total float consumption as an efficiency factor. The TFCI can be used to assess the achievability of the project completion date in any network schedule rather than just using the total float as a static indicator of projected completion. Program personnel use TFCI to estimate a projected forecast finish date. During this process, the total float is calculated by constraining the program finish milestone to its baseline finish date (this is synonymous with finish variance).
TFCI= Project Actual Duration + Critical Path Total Float Project Actual Duration
For any schedule using the critical path method, such as an IMS, total float is created or consumed based on network logic, completion of activities, and constraints within. This is commonly referred to as total float management. Managing a schedule by total float allows Applied Project Status to be quantified, Predicted Critical Path Total Float to be calculated, and a forecast finish date to be pinpointed. A TFCI of less than 1.00 indicates that a project may not complete on-time and applying that indicator to the total program duration (as depicted in steps #1 through #4 below) predicts where a project would complete if trends persist or corrective action is not taken.
Example
Step 1: Find the TFCI How is the program doing so far? If the TFCI is below 1.0, then the program may not complete on-time without mitigation. Project Actual Duration = span of actual working time accrued (in days or like unit of measure), from the beginning of the program through the status date.
Project Actual Duration (763) + Critical Path Total Float (-23) Project Actual Duration (763)
= TFCI (0.97)
Total Float Consumption Index (TFCI)
Page 169 of 212
Step 2: Find the Applied Project Status (based on TFCI) If the TFCI trend persists, how much of the project effort will be completed (in working days) by the baseline program finish date? Project Duration = span of time (in days or like unit measure) from the Baseline Start Date to the expected (early) finish.
Project Duration (2351 days) x TFCI (0.97) = Applied Project Status (2280 days)
Step 3: Find Predicted Critical Path Total Float This provides a quantitative assessment of future total float management using the total float consumed to date as an efficiency factor. How much total float will the project have by the baseline program finish date?
Applied Project Status (2280 days) – Project Duration (2351 days) = Predicted Critical Path Total Float (-71 days)
If the TFCI trend of 0.97 persists, then the project will be -71 days behind schedule at project completion instead of -23 days at the baseline program finish date. Step 4: Find the Predicted Forecast Finish Date Using the project calendar (which includes non-working days) add 71 working days to the baseline finish date to calculate a Predicted Forecast Finish date
Baseline Finish Date (2/16/15) + Predicted Critical Path Total Float (71 days) = Predicted Forecast Finish Date (5/26/15)
Things to promote
Consider the Predicted Forecasted Finish date during EAC development. Validate the TFCI metric results by utilizing other analysis techniques to investigate the cause of delinquent schedules and understand the implications for future project completion predictions. Ensure the values used to calculate TFCI are adjusted to accommodate any differences between working and calendar days.
Things to Avoid
Avoid relying solely on this metric to determine the forecasted finish date.

Duration Based vs. Scope Based Percent Complete
Page 170 of 212
10.4.7 - Duration-Based vs. Scope-Based Percent Complete
Manager’s View
Programs conduct Duration-based vs. Scope-based Percent Complete analysis on in-process tasks during each status cycle. This analysis identifies in-process tasks that may not have sufficient time remaining to finish their incomplete scope. Programs should validate the forecasted finish date of each task that trips the analysis threshold to ensure the accuracy of the program’s IMS.
Description
Percent complete vs. Time Analysis compares the calculated time or duration-based percent complete with scope-based percent complete value (may be either Physical or Earned Value Percent Complete).
Example
Fig. 10.4.7-1 Results of identifying and adjusting duration to validate scope versus duration based update In this example (Fig. 10.4.7-1), Task 16 “Conduct XYZ System Detailed Design” has consumed 75% of the tasks time but only completed 40% of the scope. This results in a possible inaccurate forecast date of 3/11/10 for the “XYZ CDR”. The task owner assesses the task and determines that it is not possible to complete the remaining 60% of the task’s scope in the remaining 25% of time. To resolve this unrealistic duration, the task owner may increase the task’s remaining duration from 10 to 30 days, extending the forecast finish date of the task. This change flows through the network and results in a corrected forecast date of 4/22/10 for the “XYZ CDR”.
Calculations
• Total Duration = Actual Duration + Remaining Duration
• Duration Based % Complete = Actual Duration / Total Duration
• Scope Based % Complete = task owners assessment of % complete
o Could be a Physical % Complete or Earned Value % Complete
Note: If using Earned Value %-Complete to depict scope, understand that some Earned Value Techniques (i.e. Percent Start/Percent Complete) may distort the IMS analysis as the earned value performance may not be actually be equivalent to the task scope completed.
Things to Promote
Include an assessment of the remaining required resources on in-process tasks in conjunction with this analysis. Examine task resource profiles when making duration versus scope analysis to ensure that remaining durations are consistent with the planned resource loads.

Duration Based vs. Scope Based Percent Complete
Page 171 of 212
Related Topics
Status to Timenow Forecasting Managing Using the IMS Intro to Schedule Execution Metrics

Schedule Rate Chart
Page 172 of 212
10.4.8 - Schedule Rate Chart
Manager’s View
Schedule Rate Charts provide management with an easy to read overview of the program’s task completion over time. The chart shows a trend line with the number of cumulative tasks Baselined, Forecasted, and Actually Finished at each status interval. The program team can use this chart to identify activity performance trends over time.
Description
Actual Finish vs. Baseline Finish Compare the number of cumulative tasks with Actual Finish dates in each past period to the number of cumulative baselined tasks planned to finish in the period. This indicates the difference between the planned and actual task completion rate. Programs conduct further analysis to understand the reasoning behind the variance, which could include the type of tasks, complexity of tasks, or resource availability. Forecast Finish vs. Baseline Finish Compare the number of cumulative tasks with Forecasted Finish dates in each future period to the number of cumulative Baselined tasks planned to finish in the period. This indicates the difference between the planned and forecasted task completion rate. Programs conduct further analysis to understand the reasoning behind the variance, which could include the type of tasks, complexity of tasks, or resource availability. Bow Wave Analysis A schedule bow wave occurs when tasks continually slip into the future. If this continues to happen as the program progresses, it could result in an insurmountable number of tasks forecasted for completion in one or more status periods. Programs should identify potential bow waves by comparing historical monthly completion rates to forecasted monthly completion rates.
Example
Fig 10.4.8-1 Program Rate Chart, showing actual data through 4/3/09, and ETC projections thereafter

Schedule Rate Chart
Page 173 of 212
Calculations
Actual Finish (Cumulative) Total number of tasks with an Actual Finish prior to the end of the status period
Forecast Finish (Cumulative)
Total number of tasks with Forecast Finish prior to the end of the status period Baseline Finish (Cumulative)
Total number of tasks with Baseline Finish prior to the end of the status period Incomplete Tasks (Status Period)
Number of tasks in the status period with an Actual Start date prior to the end of the status period and no Actual Finish date
Things to Promote
Schedule has to be baselined for the chart to be useful Rate Chart should be created based on a statused and validated IMS Data in this chart should be analyzed and compared to the data in the SPI, CPLI, and BEI to make informed choices and drive action
Things to Avoid
Avoid including LOE, Summary tasks and repetitive CDRL delivery task strings in the Rate Chart as inclusion of these tasks may mask the performance of the discrete tasking. If Milestones are included, understand the impact they may have on the results.
Related Topics
Task Durations Managing Using an IMS Status to Timenow Forecasting

Business Rhythm & Submittal
Page 174 of 212
11.0 - Business Rhythm & Submittal
This section contains the following chapters…
11.1 - IMS Supplemental Guidance
11.2 - Desktop Procedures
11.3 - Submittal of IMS Data
11.4 - Business Rhythm
11.5 - Program Schedule Reviews

IMS Supplemental Guidance
Page 175 of 212
11.1 - IMS Supplemental Guidance
Manager’s View
The IMS Supplemental Guidance is a communication tool that accompanies the IMS with an intended audience of new program personnel, auditors, and customers. Its objective is to assist the user in understanding the construct and specifics of the IMS as the program’s forward looking predictive model. It defines the structure and data resident within the IMS, the methodology for vertical and horizontal traceability, and the update, maintenance, and analysis processes.
Description
The following table (Fig. 11.1-1) contains an example list of recommended elements for inclusion in the IMS Supplemental Guidance. Element Description IMS Construct Data Dictionary A table that defines the format and location of fields defined by the user in the
IMS. Risks & Opportunities Defines of how risk mitigation plans and opportunity capture plans are
traceable to the IMS. Schedule Software Configuration Options
Lists the configurable settings used by the program’s schedule management team in the scheduling software tool.
Resource Loading Defines how the IMS is resource loaded and/or traceable to the Earned Value System.
Calendars A table or series of tables, depicting the non-working days or times in the program, activity, and/or resource calendars used in the IMS.
Schedule Margin Defines how the management of schedule margin in the IMS is accomplished Schedule Baseline Defines how the schedule baseline is constructed. Defines how the Rolling
Wave decomposes Planning Packages into tasks within the IMS. Basis & Assumptions Captures the assumptions made during the creation of the IMS by the task
owners. Vertical & Horizontal Traceability
Constraints, Lags/Leads Defines how to use constraints, leads, and lags in the IMS. Relationship Types Defines how the program is using the various logical relationship types Schedule Hierarchy Defines how the Master Summary, Intermediate, and Detail level schedules
are vertically traceable. Program Milestones Lists the key program milestones defined in the IMS. Control / Toll Gate Milestones
Defines the use of control and toll-gate milestones within the IMS.
External Schedule Integration
Defines the integration methods used with external schedules (i.e. subcontractors and partners). Document IMS related requirements flowed down to subcontractors.
Schedule Visibility Tasks (SVTs)
Defines the use of “Schedule Visibility Tasks” (SVT) in the IMS.
Statement of… Work (SOW)/Objectives (SOO) /Requirements (SOR)
Defines how each Statement of Work (SOW), Statement of Objectives (SOO), Statement of Requirements (SOR) paragraph is traceable to the IMS.
Work Breakdown Structure (WBS)
Defines how the Work Breakdown Structure(s) (WBS) are traceable to the IMS.
Organizational Breakdown Structure (OBS)
Defines the traceability of the Organizational Breakdown Structure (OBS) in the IMS.
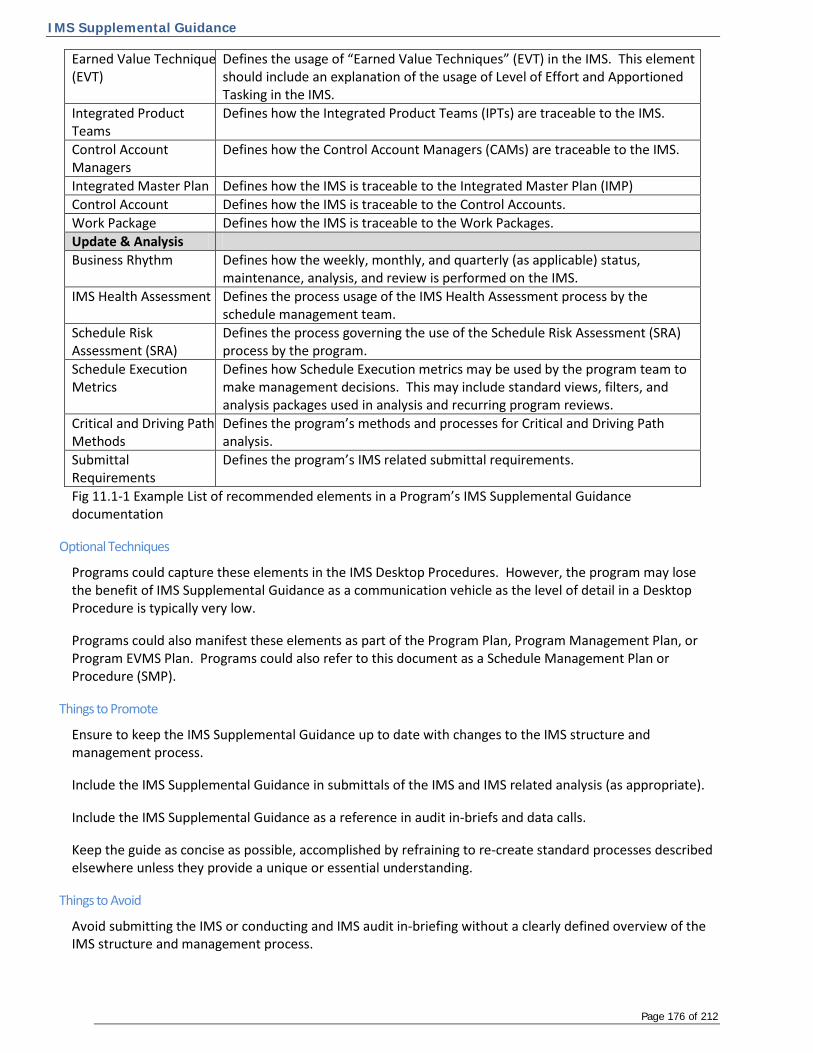
IMS Supplemental Guidance
Page 176 of 212
Earned Value Technique (EVT)
Defines the usage of “Earned Value Techniques” (EVT) in the IMS. This element should include an explanation of the usage of Level of Effort and Apportioned Tasking in the IMS.
Integrated Product Teams
Defines how the Integrated Product Teams (IPTs) are traceable to the IMS.
Control Account Managers
Defines how the Control Account Managers (CAMs) are traceable to the IMS.
Integrated Master Plan Defines how the IMS is traceable to the Integrated Master Plan (IMP) Control Account Defines how the IMS is traceable to the Control Accounts. Work Package Defines how the IMS is traceable to the Work Packages. Update & Analysis Business Rhythm Defines how the weekly, monthly, and quarterly (as applicable) status,
maintenance, analysis, and review is performed on the IMS. IMS Health Assessment Defines the process usage of the IMS Health Assessment process by the
schedule management team. Schedule Risk Assessment (SRA)
Defines the process governing the use of the Schedule Risk Assessment (SRA) process by the program.
Schedule Execution Metrics
Defines how Schedule Execution metrics may be used by the program team to make management decisions. This may include standard views, filters, and analysis packages used in analysis and recurring program reviews.
Critical and Driving Path Methods
Defines the program’s methods and processes for Critical and Driving Path analysis.
Submittal Requirements
Defines the program’s IMS related submittal requirements.
Fig 11.1-1 Example List of recommended elements in a Program’s IMS Supplemental Guidance documentation
Optional Techniques
Programs could capture these elements in the IMS Desktop Procedures. However, the program may lose the benefit of IMS Supplemental Guidance as a communication vehicle as the level of detail in a Desktop Procedure is typically very low.
Programs could also manifest these elements as part of the Program Plan, Program Management Plan, or Program EVMS Plan. Programs could also refer to this document as a Schedule Management Plan or Procedure (SMP).
Things to Promote
Ensure to keep the IMS Supplemental Guidance up to date with changes to the IMS structure and management process.
Include the IMS Supplemental Guidance in submittals of the IMS and IMS related analysis (as appropriate).
Include the IMS Supplemental Guidance as a reference in audit in-briefs and data calls.
Keep the guide as concise as possible, accomplished by refraining to re-create standard processes described elsewhere unless they provide a unique or essential understanding.
Things to Avoid
Avoid submitting the IMS or conducting and IMS audit in-briefing without a clearly defined overview of the IMS structure and management process.

IMS Supplemental Guidance
Page 177 of 212
Related Topics
Managing Using the IMS Intro to Schedule Execution Metrics Desktop Procedures

Desktop Procedures
Page 178 of 212
11.2 - Desktop Procedures
Manager’s View
Document and control all activities associated with the preparation, use, and maintenance of the Integrated Master Schedule (IMS). Desktop procedures ensure consistent standardized scheduling and continuity of processes and procedures across all personnel in the event of personnel changes. These procedures align and support higher-level procedures and directives such as the IMS Supplemental Guidance, the Program Management Plan (PMP), Subcontract Management Plan, and the EVM System Description.
Description
Desktop Procedures contain the detailed steps that personnel employ to prepare, use, and maintain an IMS. Desktop procedures come in many forms. They may be checklists, program unique instructions, scheduling supplemental guidance, or even sections in the EVMS Description document. The extent of desktop procedures needed varies based upon the procedures documented at the various levels of the organization. Some Candidates for Desktop Procedures include:
• IMS schedule development • Application of work templates networks in IMS development • Preparation of PM IMS analysis information • IMS data element trace procedures • Procedures for customer unique schedule reports • Procedures to develop/update resources and rate tables in IMS • Export of IMS data into Work Authorization documents • Extracting Control Account Plans and other reports for CAMs • Procedures for schedule health metrics IMS preparation for customer submittal • Risk Management analysis and reporting • Preparation of IMS data for import to EVMS Cost System • CAM inputs to schedule updates • IMS Update procedures • IMS inputs and procedures to support ETC and EAC estimates • Incorporation of approved baseline changes • Preparation of proposed schedule changes (BCRs, SCRs, BARs, CRs, etc.) • Rolling wave planning procedures
Example
Below are examples of the hierarchy of IMS direction and guidance in a large corporation through desktop procedures:
• Corporation EVMS Description – Containing general requirements for IMS preparation content and coding
• Business Division Scheduling Methodology Document – Standardizing scheduling techniques templates and tools across all schedulers
• IMS Supplemental Guidance – Defines the structure and data resident within the IMS, the methodology for vertical and horizontal traceability, and the update, maintenance, and analysis processes.

Desktop Procedures
Page 179 of 212
• Position or Task Unique desktop procedures – Procedures for CAMs to use when updating the schedule, procedures to perform what-if analysis with IMS on baseline change requests and procedures to validate the IMS before importing information into the EVMS cost system.
Optional Techniques
Place all IMS related desktop procedures in program supplemental scheduling guidance or in a program unique scheduling instruction. Allow usability features to dictate procedure’s media and format. For example, web-enabled procedures may prove beneficial to some organizations while hand written checklist may suffice for others.
Things to Promote
Management performs a desk audit for all personnel that touch or use the IMS. Ensure they each have documented procedures for their activities. Management collects, reviews, and controls all desktop procedures. Have all IMS stakeholders review and coordinate on all IMS desktop procedures. Have a plan for periodic review and update of desktop procedures. Use feedback to identify process changes to the Desktop Procedure. Monitor to ensure these process changes result in measurable performance. Update processes based on lessons learned analysis at program completion
Things to Avoid
Allowing personnel using the IMS to have unaudited and uncontrolled procedures.
Avoid not having a desktop procedure for any recurring task, process or procedure crucial to a program.
Related Topics
Business Rhythm Roles and Responsibilities of Program Personnel Planner/Scheduler Skills and Training

Submittal of IMS Data
Page 180 of 212
11.3 - Submittal of IMS Data
Manager’s View
A program’s Integrated Master Schedule (IMS) contains a large number of data elements used for program performance and predictive analysis in addition to establishing horizontal and vertical integration. Many of these data elements may be in addition to the fields natively found in scheduling software. It is important for both the contractor and government teams to understand and agree to the frequency, format, and content of the submitted IMS data and analysis. This enables a common understanding of the IMS and helps to ensure that the IMS related contractual obligations are satisfied.
Description
Frequency It is recommended that the program IMS be formally submitted:
• In conjunction with Cost Performance Report (CPR) submittal requirements (CPR or Integrated Program Management Report, Data Item Description; current version) to ensure consistent data are available for recurring cost and schedule performance analysis.
• If the program does not require Earned Value Management or a CPR, then submit the IMS in concert with other program performance reports.
• In the absence of any cost performance reporting requirements, submit the IMS monthly on development type contracts and less frequently on non-development type contracts that require the use of an IMS.
Note: Consider the duration of the work effort as well as the level of program risk and complexity when determining the frequency of IMS status updates, analysis, and reporting.
Format It is recommended that the IMS be submitted in both its native scheduling software format and the software neutral UN/CEFACT IMS XML schema format. The UN/CEFACT IMS XML schema format uses an open source XML data schema published by the United Nations Centre for Trade Facilitation and Electronic Business (UN/CEFACT). An XML schema is an open source structured text format designed to efficiently facilitate data exchanges and other uses. It is a carrier of raw data and therefore not meant to be human readable, although it is a text file. The structure is such that an XML expert can easily create an XML file and/or read an XML file and convert it to whatever other data structure (database files, spreadsheets, etc.) the receiving end requires. XML does not require a license to create or read, making it a standard, world-wide solution for many applications. The UN/CEFACT XML schema enables the ability to transfer data between various schedule software tools. It identifies a normalized set of schedule data elements and is designed to help exchange schedule data between parties regardless of the schedule toolsets that may be used at either end. The complete UN/CEFACT data library can be found on the UN/CEFACT web site: http://www.unece.org/cefact/index.html
Note: At this point there are unmitigated differences in the schedule algorithms between scheduling software tools. In many cases moving schedule information whether in part or full can result in deltas when the schedule is calculated. Therefore, contractors and government personnel, who are attempting to use two different software tools for schedule management, should clearly understand the configurable options and the potential deltas that may occur.

Submittal of IMS Data
Page 181 of 212
The NDIA Program Management Systems Committee (PMSC) has published a set of joint industry and government guidelines that provide specifics on how to use the schemas to produce an XML instance file that reflects the data requirements identified in the DoD CPR, IMS, and IPMR Data Item Descriptions (DIDs) and related data exchanges. Any end user proficient in XML or software vendor can use these guidelines as the basis to produce, parse (read or extract), or transform an XML instance file that follows the applicable guideline. A complete description of the XML schema guidelines and data element requirements can be found on the Defense Cost and Resource Center (DCARC) EVM Central Repository website: http://dcarc.pae.osd.mil/EVM/Uncefact.aspx. The Guideline documents are multi-tabbed files that include Data Requirements Guidelines, Task Coding Guidelines, Data Type, and Complex Data Type coding details useful for a technical end user who wishes to produce or use an XML instance file that follows the guidelines. Note: The Data Item Descriptions always govern the contractual data requirements. The guidelines are designed to reflect the data requirements specified in the DIDs. Various commercial off the shelf (COTS) vendors have used the joint industry and government guidelines to provide end users with the ability to import and export schedule data using the UN/CEFACT schemas. For these software vendors, the UN/CEFACT XML is just one more import and/or export option within their software. The utilities in the software either produce an XML instance file and/or provide the ability to import an XML instance file that follows the guidelines.
Data Element Recommendations – Native Fields The following tables contain a list of recommended native Project (Fig. 11.3-1), Activity (Fig. 11.3-2), and Resource (Fig. 11.3-3) schedule fields for inclusion in the IMS submittal. The titles of these data fields may vary slightly between the scheduling software tools. Note: if the IMS is not resource loaded then the associated resource and cost fields would not be available for submission. Project Fields - Native
Start Date End Date Status Date (Timenow Date) Calendar Fig. 11.3-1 Sample recommended list of Native Project Fields to be included in a submittal IMS Activity Fields - Native
Unique Identifier Free Float / Free Stack Successor Name/Description Start (i.e. Early/Forecast) Lag / Lead Duration Finish (i.e. Early/Forecast) Relationship Type (i.e. FS, SF, SS, FF) Baseline Duration Late Start Calendar Remaining Duration Late Finish Constraint Type Actual Duration Baseline Start Constraint Date Finish Variance Baseline Finish Percent Complete (Calculated / Duration Based) Start Variance Actual Start Type (i.e. Task, Milestone, Hammock) Duration Variance Actual Finish Relationship Type (i.e. FS, SF, SS, FF) Total Float / Total Slack Predecessor Fig. 11.3-2 Sample recommended list of Native Activity Fields to be included in a submittal IMS

Submittal of IMS Data
Page 182 of 212
Resource Fields - Native
Unique Identifier Calendar Type (labor / non-labor) Baseline Amount (direct cost) Estimated Amount (direct cost) Actual Amount (direct cost) Baseline Quantity (hour or unit) Estimated Quantity (hour or unit) Actual Quantity (hour or unit) Baseline Cost Estimated Cost Fig. 11.3-3 Sample recommended list of Native Resource Fields to be included in a submittal IMS Data Element Recommendations – Custom / Defined By User Fields The following table (Fig. 11.3-4) contains a list of recommended custom / defined by user fields for inclusion in the IMS submittal. Activity Owner (Control Account Manager) Schedule Risk Assessment – Distribution Curve Planning or Work Package Identifier Schedule Risk Assessment – Reporting Task Integrated Product Team (IPT) Schedule Risk Assessment – Minimum Duration Organizational Breakdown Structure (OBS) Schedule Risk Assessment – Most Likely Duration Work Breakdown Structure (WBS) Schedule Risk Assessment – Maximum Duration Statement of Work (SOW) Paragraph Earned Value Technique Control Account Identifier Earned Value Percent Complete Multi-Project Unique Identifier Physical (Scope Based) Percent Complete Government Furnished Equipment / Information Justification of Lags/Constraints Integrated Master Plan Identifier Subcontract Identifier Risk & Opportunity Codes Critical & Driving path Indicators Schedule Visibility Task (SVT) Identifier (may be built into task name)
Schedule Margin Code (may be built into task name)
Fig. 11.3-4 Sample recommended list of fields defined by the user for inclusion in an IMS submittal IMS Narratives Ensure that an IMS Narrative and an IMS Supplemental Guidance document (see IMS Supplemental Guidance chapter in this guide) accompany the IMS submittal. The IMS Narrative should include the following items:
• Critical & Driving Paths: an analysis of at least the top three critical and driving paths • Finish Variance: a discussion of Finish Variance (in this case the delta between the Forecast Finish
date and the Baseline Finish date on the last task in the network) at the total contract level in days. • Schedule Margin: a discussion of any changes in the duration (baseline or forecast) of schedule
margin (if applicable). • Data Dictionary: a discussion of any changes to the data dictionary (including task activity codes) • Schedule Health: a discussion of any internal schedule health assessments (if applicable) • Schedule Changes: a discussion of any major changes to the schedule including significant changes
to the baseline schedule, working calendars, resource utilization, or execution strategy
Example
IMS Narratives - Critical & Driving Paths An example of this analysis might contain a screen shot of the path in question and a narrative with the following elements…
1. What? - a brief explanation of the situation 2. So What? – the impact of the situation on the program 3. Now What? – the steps being taken to mitigate the situation including any requested customer help

Submittal of IMS Data
Page 183 of 212
The following is an example (Fig. 11.3-5) IMS Narrative analysis for the primary driving path to a program’s next major milestone.
Driving Path Screenshot
Fig. 11.3-5 Example Driving Path Screen Shot
Driving Path Narrative The IMS indicates the forecast date for the next test flight is 4 days after its target date due to an overlap of program assets that require testing in the environmental lab. This test flight slip will not impact the overall program as additional test engineers are being brought on to decrease the duration needed to conduct post test analysis and report generation. However, the contractor is requesting assistance in ensuring the test range is available on the current forecasted dates. To ensure that no future slips occur, the program team will closely monitor environmental lab needs and schedule multiple shifts to mitigate any potential overlaps.
The following is an example (Fig. 11.3-6) IMS narrative analysis to the program end’s critical path.
Critical Path Screenshot
Fig. 11.3-6 Critical Path Screenshot to accompany the IMS narrative
Critical Path Narrative The program currently has 14 of the original 20 days of calculated margin remaining in the critical path. 6 days of calculated margin were lost due to clearance requirements holding up key software developers. The program currently has all required assets cleared to the program, is forecasting an early completion date, has accepted the margin loss and anticipates no further delays.
Related Topics
Managing Using the IMS Intro to Schedule Execution Metrics IMS Supplemental Guidance

Business Rhythm
Page 184 of 212
11.4 - Business Rhythm
Manager’s View
Successful programs establish, execute, and follow a business rhythm for the status, maintenance, and analysis of the IMS. Establishing this rhythm early in the program creates the momentum that keeps the program processes on track, creating an environment of on-time work completion at a regular and consistent pace. The Program Manager and the Leadership Team create this rhythm by establishing and following a standard business calendar that lays out regular IMS updates and program status reviews.
Description
A typical business rhythm calendar shows the activities that occur on a recurring cycle, coinciding with the financial and customer reporting cycles. The examples below represent typical recurring activities on a typical business calendar. Programs also have the option of implementing a weekly calendar showing regularly scheduled meetings, reviews, and other program activities. These calendars augment the IMS providing regularly scheduled details associated with managing both the program and the schedule. Establishing this rhythm early in the program life cycle establishes the discipline and sense of importance necessary to motivate the program team to work to the IMS and complete work regularly and on time. A key purpose for the Business Rhythm Calendar is to ensure that intermediate products are available for review and validation. This ensures that the integrity of all of the inter-related systems is current. Late reviews of intermediate products typically affect the validity of downstream products so programs should ensure timeliness in the production and review of intermediate products. Some programs will also establish weekly or bi-weekly status updates and review of the IMS to enhance the management style. The advantage to more frequent IMS updates is that the program team can better monitor progress and implement corrective actions before the program realizes schedule impacts. Programs should weigh the advantage of more frequent IMS updates against the extra burden and cost associated with the maintenance of the schedule in addition to ensuring that it affords sufficient time for analysis. On programs with less frequent IMS status updates and review, a look-ahead schedule showing only tasks relevant for the upcoming weeks is a useful tool for weekly program meetings to address areas that require immediate focus.
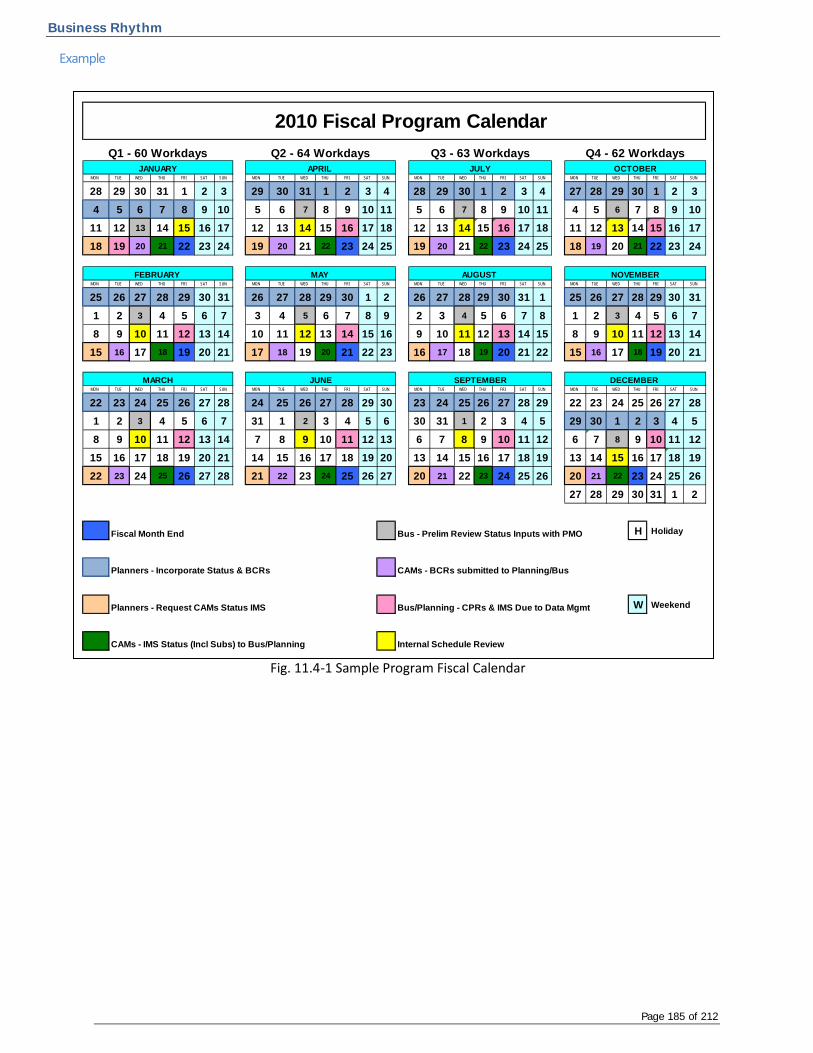
Business Rhythm
Page 185 of 212
Example
Fig. 11.4-1 Sample Program Fiscal Calendar
MON TUE WED THU FRI SAT SUN MON TUE WED THU FRI SAT SUN MON TUE WED THU FRI SAT SUN MON TUE WED THU FRI SAT SUN
28 29 30 31 1 2 3 29 30 31 1 2 3 4 28 29 30 1 2 3 4 27 28 29 30 1 2 34 5 6 7 8 9 10 5 6 7 8 9 10 11 5 6 7 8 9 10 11 4 5 6 7 8 9 10
11 12 13 14 15 16 17 12 13 14 15 16 17 18 12 13 14 15 16 17 18 11 12 13 14 15 16 1718 19 20 21 22 23 24 19 20 21 22 23 24 25 19 20 21 22 23 24 25 18 19 20 21 22 23 24
MON TUE WED THU FRI SAT SUN MON TUE WED THU FRI SAT SUN MON TUE WED THU FRI SAT SUN MON TUE WED THU FRI SAT SUN
25 26 27 28 29 30 31 26 27 28 29 30 1 2 26 27 28 29 30 31 1 25 26 27 28 29 30 311 2 3 4 5 6 7 3 4 5 6 7 8 9 2 3 4 5 6 7 8 1 2 3 4 5 6 78 9 10 11 12 13 14 10 11 12 13 14 15 16 9 10 11 12 13 14 15 8 9 10 11 12 13 14
15 16 17 18 19 20 21 17 18 19 20 21 22 23 16 17 18 19 20 21 22 15 16 17 18 19 20 21
MON TUE WED THU FRI SAT SUN MON TUE WED THU FRI SAT SUN MON TUE WED THU FRI SAT SUN MON TUE WED THU FRI SAT SUN
22 23 24 25 26 27 28 24 25 26 27 28 29 30 23 24 25 26 27 28 29 22 23 24 25 26 27 281 2 3 4 5 6 7 31 1 2 3 4 5 6 30 31 1 2 3 4 5 29 30 1 2 3 4 58 9 10 11 12 13 14 7 8 9 10 11 12 13 6 7 8 9 10 11 12 6 7 8 9 10 11 12
15 16 17 18 19 20 21 14 15 16 17 18 19 20 13 14 15 16 17 18 19 13 14 15 16 17 18 1922 23 24 25 26 27 28 21 22 23 24 25 26 27 20 21 22 23 24 25 26 20 21 22 23 24 25 26
27 28 29 30 31 1 2
Fiscal Month End Bus - Prelim Review Status Inputs with PMO H Holiday
Planners - Incorporate Status & BCRs CAMs - BCRs submitted to Planning/Bus
Planners - Request CAMs Status IMS Bus/Planning - CPRs & IMS Due to Data Mgmt W Weekend
CAMs - IMS Status (Incl Subs) to Bus/Planning Internal Schedule Review
JUNE
JANUARY
FEBRUARY
MARCH DECEMBER
NOVEMBER
OCTOBERJULY
AUGUST
SEPTEMBER
Q3 - 63 Workdays Q4 - 62 WorkdaysAPRIL
MAY
2010 Fiscal Program CalendarQ1 - 60 Workdays Q2 - 64 Workdays

Business Rhythm
Page 186 of 212
Sample Program Weekly Calendar
Fig. 11.4-2 Sample Weekly Program Calendar
Things to Promote Leave flexibility in the business rhythm for the program team to analyze and implement corrective actions. Business rhythm includes actions and deadlines necessary for all relevant stakeholders, not just IMS related activities.
Monday Tuesday Wednesday Thursday Friday
Daily Status Daily Status Daily Status Daily Status Daily Status
Status Request
Planners - Request CAMs Status IMS
CAMs - IMS Status
Planners - Incorporate Status
Internal Schedule Review
Other Program Meetings (notional)
15:00
16:00
Update IMS
IMS Metrics Available
IMS Review
Configuration Control Board
CAM Status
IMS Analysis
9:00
10:00
11:00
12:00
13:00
14:00
Weekly Calendar
Configuration Control Board
Risk Review Board
Material Line of Balance
Assembly Line of Balance
Material Line of Balance
IMS Look Ahead
Customer Update
7:00
8:00

Business Rhythm
Page 187 of 212
Ensure the management process includes methods to address actions that cannot be resolved within the current reporting cycle.
Establish back-ups for individual roles within the business rhythm to support extended periods of absence from the team.
Establish and follow a formal IMS status process that is fast and effective.
Ensure the program business rhythm contains a comprehensive schedule review. Refer to the Program Schedule Reviews chapter in this guide.
Things to Avoid
Avoid deviating from the business rhythm due to conflicting programmatic commitments.
Avoid using a program calendar that is out of alignment with the company’s financial calendar.
Spending more time getting status updates and discussing the IMS then getting work done, there needs to be the correct balance with regard to the time spent updating status and evaluating the IMS.
Related Topics
Forecasting Baseline Change Management Managing Using the IMS Program Schedule Reviews
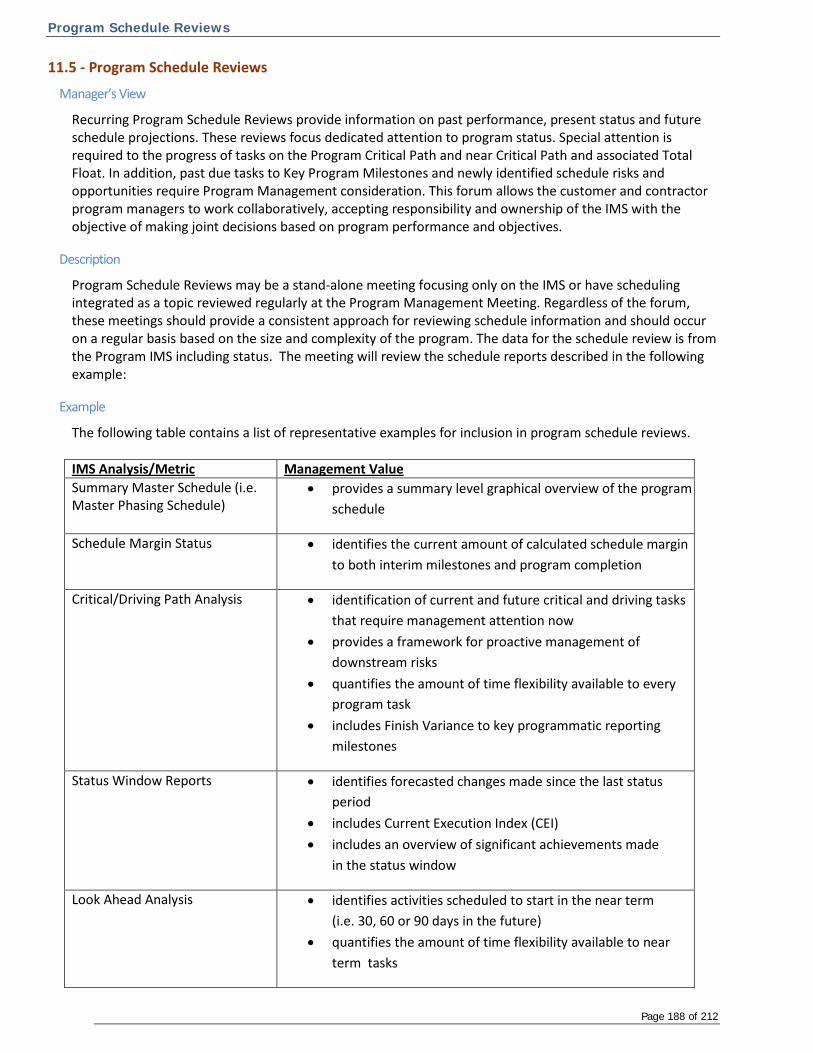
Program Schedule Reviews
Page 188 of 212
11.5 - Program Schedule Reviews
Manager’s View
Recurring Program Schedule Reviews provide information on past performance, present status and future schedule projections. These reviews focus dedicated attention to program status. Special attention is required to the progress of tasks on the Program Critical Path and near Critical Path and associated Total Float. In addition, past due tasks to Key Program Milestones and newly identified schedule risks and opportunities require Program Management consideration. This forum allows the customer and contractor program managers to work collaboratively, accepting responsibility and ownership of the IMS with the objective of making joint decisions based on program performance and objectives.
Description
Program Schedule Reviews may be a stand-alone meeting focusing only on the IMS or have scheduling integrated as a topic reviewed regularly at the Program Management Meeting. Regardless of the forum, these meetings should provide a consistent approach for reviewing schedule information and should occur on a regular basis based on the size and complexity of the program. The data for the schedule review is from the Program IMS including status. The meeting will review the schedule reports described in the following example:
Example
The following table contains a list of representative examples for inclusion in program schedule reviews. IMS Analysis/Metric Management Value Summary Master Schedule (i.e. Master Phasing Schedule)
• provides a summary level graphical overview of the program schedule
Schedule Margin Status • identifies the current amount of calculated schedule margin to both interim milestones and program completion
Critical/Driving Path Analysis • identification of current and future critical and driving tasks that require management attention now
• provides a framework for proactive management of downstream risks
• quantifies the amount of time flexibility available to every program task
• includes Finish Variance to key programmatic reporting milestones
Status Window Reports • identifies forecasted changes made since the last status period
• includes Current Execution Index (CEI) • includes an overview of significant achievements made
in the status window
Look Ahead Analysis • identifies activities scheduled to start in the near term (i.e. 30, 60 or 90 days in the future)
• quantifies the amount of time flexibility available to near term tasks

Program Schedule Reviews
Page 189 of 212
Schedule Risk Assessment (SRA) (Histogram, Sensitivity Analysis, Criticality Analysis to a key program milestone & program end)
• predicts probability of program completion by date • identifies tasks with a high probability of becoming critical • helps to mathematically quantify program risk and
opportunity
Critical Path Length Index (CPLI) • measures how realistic the program completion date is and the efficiency rate required to complete the program as planned
Baseline Execution Index (BEI) • reveals the “execution pace” for a program and provides an early warning of increased risk to on-time completion
Schedule Performance Index (SPI) • provides an early warning based on past performance to determine if the schedule is at risk and increased performance will be needed if the program is to complete on time
Current Execution Index (CEI) • measures how accurately the program is forecasting and executing to its forecast from one period to the next
Total Float Consumption Index (TFCI)
• used to assess the reasonableness of the forecasted project completion date based on float consumption trends to date
Schedule Rate Charts • compares task completion rates to plan • identifies forecast “bow waves”
Duration vs. Scope Based % • validates accuracy of in-process task finish dates and ETC resource forecasts
Resource De-Confliction Analysis • identifies requirement conflicts and overlaps for key program resources (including people, places, and things)
• quantifies program staffing needs
Upcoming Giver/Receiver Handoffs
• aids in communicating handoffs between program stakeholders
Program Schedule Risks • should provide an update on program schedule risks identified in the program Risk Management process.
External Impacts • identifies status of key supplier schedule impacts and a status of Government Furnished Items (GFx)
Performance Measurement Baseline Changes
• summarizes major changes to the programs Performance Measurement Baseline (PMB) (i.e., Replans, Reprograms, Rolling Waves)
Fig. 11.5-1 Example Items for Program Schedule Reviews

Program Schedule Reviews
Page 190 of 212
Integrated Baseline Reviews
Programs undergo Integrated Baseline Reviews (IBRs) shortly after contract award. The objectives of the IBR is to ensure both the contractor and customer validate that the established baseline (technical, schedule and cost) is executable within the cost and schedule constraints of the contract and with an acceptable level of risk. Additionally, the IBR should demonstrate the program’s technical (scope), schedule, cost, resource, and general management processes. Finally, the IBR will cover roles and responsibilities of program personnel and a status on required technical expertise. Contractors and customers should clearly define the expectations and assumptions of the IBR content to ensure an efficient and effective IBR. Address IBR actions identified in the IBR out-brief quickly.
Optional Techniques
Contract Data Requirements List (CDRL) Deliverables – Consider reviewing the CDRL’s during Program schedule reviews. This report aids in keeping the contractual deliveries in the management team’s focus. The data manager typically oversees the delivery and status of the program CDRLs. Identifying and tracking program CDRLs in the IMS is an effective method of tracking progress and accomplishment required to identify problem deliverables or issues.
Things to Promote
Focus program schedule reviews on relevant schedule information that the PM and Program Management Team need in order to make proactive decisions and take corrective action should an issue arise. The IMS will reflect past performance but should also provide the information necessary to guide the decisions to manage the remaining work to meet the key program milestones including program completion. During these meetings, it is essential for the Team Leaders to understand both the program summary schedule information and their team schedule data, be able to explain it to the PM during these meetings and be accountable in managing their portion of the Program. Ensure that the program schedule accurately reflects the program performance to date and that the remaining task durations and relationships reflect an accurate and executable path forward. Programs should tailor the schedule-related items reviewed (including report format and level) in management reviews to match program management needs. Additionally, programs should regularly assess if the included schedules are adding value, and adjust accordingly.
Things to Avoid
The Program Schedule Review should not just focus on the past; e.g. looking in the rear view mirror and reacting. There should be consistent analysis and evaluation of status on the IMS forecast - because tasks do not always occur as planned.
Ensure the program schedule review is not just a presentation. The review is a time for all teams to reinforce effective management behaviors and communicate issues and concerns. It is an ideal opportunity to determine how the teams will work together towards achieving program objectives.
Related Topics
Intro to Schedule Execution Metrics Managing Using the IMS

Training
Page 191 of 212
12.0 – Training
This section contains the following chapters…
12.1 - Leadership Training
12.2 - Planner/Scheduler Skills & Training

Leadership Training
Page 192 of 212
12.1 - Leadership Training
Manager’s View
The success of a program is dependent on the leadership team’s ability to understand and interpret the data contained in the IMS and to use the information proactively to drive the program to a successful outcome. The leadership’s training should be targeted at a level where they understand basic scheduling concepts and can interpret the metrics to assess the health of the program’s schedule, make decisions to impact the outcome and facilitate communication to their management and customers. Additionally, leadership training should occur in a timely fashion for program stakeholders, ideally prior to the start of their support to the program. The central theme of all leadership training should be around the use of the IMS as a management tool versus simply a reporting vehicle. This theme should also emphasize the correct and incorrect management behaviors around schedule related metrics (i.e. manage by metrics vs. letting metrics manage you). Finally, it is essential for management tiers to be proficient in the basic schedule “language” to increase the manager’s effectiveness and ability to assist in breaking down program barriers for all program stakeholders.
Description
A comprehensive leadership training program should consist of a tiered approached based on the following roles: Senior Executive Leaders, Program Managers and CAM/IPT Leads. Training should aligned with the hierarchy of the IMS with CAMs/IPTs focused on the detail tasking, Program Managers focused on the program outlook, and Executive Leadership focused on the ability to manage goals. Senior Executive Leadership training should define knowledge management practices that emphasize lessons learned and polices which ensure compliance with established regulations and the enterprise system description and procedures. The training program would continually evolve in the usage of metrics and toolsets which provide visibility into areas which are high risk to the execution of Program commitments. The training for Senior Executive Leadership would include the following skills:
• high level overview of regulations and the system description especially as it relates to baseline establishment and change management
• overview of schedule analysis and metrics (with a focus on how to use these metrics to make programmatic decisions and influence behavior) including…
o CPLI, BEI, SPI, Duration-Based vs. Scope-Based Percent Complete, Schedule Rate Chart, CEI, Critical Path Method & Analysis, Schedule Risk Assessment and Opportunities, DCMA 14 Point Scheduling Assessment
Program Manager training would include management practices that emphasize proficiency in contract requirements and guidelines for architecting an IMS which will be an effective management tool for internal and external customers. The concepts of managing schedule margin and using critical and driving paths to make effective Program decisions are emphasized. Decisions are made in a proactive manner utilizing the IMS as tool which models the program’s execution to requirements. In addition to the skills listed under Senior Executive Leadership, the following skills should be included in the training for Program Managers:
• overview of horizontal and Vertical Integration & Traceability (including the IMS relationship with the IMP)
• overview of schedule health indicators

Leadership Training
Page 193 of 212
• overview of the schedule validation and baseline process • overview of the schedule maintenance, status (including Timenow), and analysis battle rhythm • overview of how to use the IMS and its associated metrics and reports to manage the program
(with, including but not limited to: float, critical/driving path analysis, and schedule margin)
CAM/IPT Leads training defines management practices that emphasize proficiency in contract requirements and guidelines for developing an IMS that will be an effective management tool to communicate execution to baseline requirements. The concepts of establishing activities, which provide the appropriate level of visibility into Key Program milestones and accurate precedence logic amongst teams along with an understanding of managing with float and critical path, allow the use of the IMS as a forward-looking tool for execution of requirements. Management of subcontractor efforts is a key attribute in this training module in order to ensure the proper integration of supplier efforts within the Program IMS. Emphasis on metrics for managing the Program such as Trip Wire metrics are essential in order to be effective in communicating with the IMS. In addition to the skills listed under Senior Executive Leadership and Program Managers, the following skills should be included in the training for CAMs and IPT Leads:
• an in-depth understanding of how the scheduling tool works • an in-depth understanding of the schedule baseline maintenance, status, and analysis processes
Things to Promote
Learning through Knowledge Sharing and mentoring Certification Training tailored to level of Leadership within the Programs team Using tools to foster positive behavior for Program Execution Leadership Training Program with Learning Objectives from Executive to Practitioner, in a forum tailored to the desired competency. Method of delivery is flexible to target audience, with material from Subject Matter Experts from cross-functional departments. Invite program, customers, and DCMA representatives to the IMS-related Leadership Training sessions Manage using metrics versus letting metrics manage you.
Things to Avoid
Learning Environment dependant on internal political factors Poorly defined Learning Objectives Inflexible method of delivery
Leadership Training Program that does not have a well defined learning model for Executive Associates through Entry Level Associates.
Related Topics
Planner/Scheduler Skills & Training Managing Using the IMS

Planner/Scheduler Skills & Training
Page 194 of 212
12.2 - Planner/Scheduler Skills & Training
Manager’s View
The ability to manage the information within the IMS is dependent on a combination of skill sets and knowledge necessary to develop, interpret and analyze the data. A planner/scheduler’s training must be broad enough to communicate effectively with the program team, drive the planning process to ensure the IMS reflects how the work is accomplished and provide data in a form that will aid the team in making sound management decisions. Ensure Planner/Schedulers have sufficient knowledge, training, and understanding of the scheduling discipline prior to the start of their support to a program. A robust training program will identify the learning objectives that best support development of these kinds of skill sets and knowledge combined with program requirements.
Description
Roles & responsibilities The role of an effective Planner/Scheduler on a program is multifaceted. Their role includes leading the team in the use of sound scheduling practices; ensuring program processes align with Enterprise guidelines or Systems descriptions and actively participates as a valued member of the program leadership team. Understanding the qualities that enable a Planner/Scheduler to make the most of these roles will greatly influence the type of training to support each Use of sound scheduling practices The Planner/Scheduler plays a significant role in the use of sound scheduling practices. Examples include the development of a logically linked network to allow accurate critical path analysis based on network calculations/logic, validation of staffing load with a resource loaded schedule, and regular review of program data by the core program team to assess accuracy and feasibility and promote team buy-in. Aligning to Enterprise EVMS or Program Planning Guidelines Work done in support of government contracts typically requires a validated EVMS system. Additionally, internal policies and procedures define requirements for managing cost and schedule. Planner/Schedulers should be knowledgeable on all policies and procedures that affect the IMS and be able to translate and apply these requirements on the programs, they support. Valued member of program leadership team The Planner/Scheduler is an important member of the program leadership team. Providing detailed analysis of the IMS associated with each update, processing change request with documented visibility into the change, or award of additional scope, the Planner/Scheduler is the subject matter expert to focus the team on the areas impacted and needing additional review. As most people are visual learners, the Planner/Scheduler should understand when additional training is required to interpret the data, or be creative in developing a different format for the data
Skills for Execution The most effective Planner/Schedulers possess a balance of intellectual qualities or assets that include the possession of the knowledge, applied experience, organizational technology, customer relationship and professional skills. Often times these assets are grouped into categories referred to as Soft and Hard Skills Soft skills Soft skills, sometimes known as "people skills," are personal attributes that enhance a Planner/Scheduler’s interaction, job performance and even career prospects and are defined as a wide variety of business skills that fall into one of the following three categories:

Planner/Scheduler Skills & Training
Page 195 of 212
1. Interaction with Coworkers - This category is the ability to interact effectively with coworkers and customers and includes skills such as networking, communication, and team work/collaboration.
2. Professionalism and/or Work Ethic – This category focuses on how a person conducts himself or herself at work and includes skills professionalism, integrity, enthusiasm/motivation
3. Critical Thinking or Problem Solving – This category deals with one’s ability to think critically and solve problems in a reasonable timeframe.
Hard skills Hard skills are those easily observed and can be taught in a formal classroom setting or using an on-the-job situation. For Planner/Schedulers, examples of hard skills include the ability to work with scheduling software or associated add-on software, work with spreadsheets, integrating and analyzing IMS data with other functional areas such as finance or risk & opportunity or even include learning and speaking a foreign language.
Types of training Training is not limited to classroom instruction and can take many forms. Examples of alternative forms of training include on-the-job training, internal or external training courses, mentoring, training assignments, role-playing or peer review exercises.
Example
Soft skills training examples include: Effective communication Leading a team Conducting a meeting Problem Solving Working with difficult employee’s Presentation skills Hard Skill training examples: Tool specific training such as MS Project, Primavera, Open Plan, etc Working with Microsoft Office products (Excel, PowerPoint, Word) Fundamentals of Planning Cost/Schedule Integration Schedule Analysis Critical Path Analysis Schedule Risk Analysis Metric Analysis – such as BEI, CPLI, SPI, etc Subcontractors schedule integration Managing Risk and Opportunity in the IMS
Optional Techniques
Boot Camps Train-the-trainer (TTT) Mentoring Peer Reviews

Planner/Scheduler Skills & Training
Page 196 of 212
Things to Avoid
A training plan that only utilizes one method for training such as Web Based Training Vague Learning objectives
Related Topics
Leadership / Program Management Training Managing Using the IMS

Program & Contract Phase Considerations
Page 197 of 212
13.0 - Program & Contract Phase Considerations
This section contains the following chapters…
13.1 - Proposal IMS Considerations
13.2 - Scheduling in a Production Environment

Proposal IMS Considerations
Page 198 of 212
13.1 - Proposal IMS Considerations
Manager’s View
In general, programs benefit from developing and refining their program IMS as early as possible. In many cases, this means constructing a comprehensive IMS to support a proposal submittal. While there is not a fundamental difference between an execution and proposal IMS, there are some unique items to consider when developing a proposal IMS. This section defines those considerations.
Description
Consider the following in regards to building a Proposal IMS:
Proposal team goals should be to create an IMS with health standards as close to the execution criteria as possible.
Proposal schedules are typically not “earned value” ready as the control accounts may not been established.
Resource loading proposal schedules may be required and/or may be at a higher level, which supports the reconciliation between the IMS and the BOEs.
Ensure consistent IMS structures (i.e. IMP/WBS) between the proposal and execution IMS. This greatly simplifies the transition from a proposal to an execution IMS.
The IMS may be less detailed in the proposal than in execution. This allows the execution CAMs to develop the specific execution details.
IMS Supplemental Guidance document should be included with the IMS submittal to explain approaches, ground rules, and assumptions used in the development of the proposal.
IMS Specific RFP requirements (i.e. restrictions on the # of tasks in the proposal IMS) may not afford for the creation of a proposal IMS consistent with execution IMS standards.
Related Topics
Managing using an IMS Scheduling in a Production Environment

Scheduling in a Production Environment
Page 199 of 212
13.2 - Scheduling in a Production Environment
Manager’s View
The Department of Defense (DOD) 5000.2 Instruction identifies the following program phases:
1. Material Solution Analysis Phase 2. Technology Development Phase 3. Engineering and Development (EMD) Phase 4. Production and Deployment Phase 5. Operations and Support Phase
During Production, a contractor or organization produces/provides physical products that are typically the result of efforts from the development phase of a contract. While the development and production phases of an acquisition are closely related, the means of managing schedules can be very different. During development, an Integrated Master Schedule (IMS) is normally required, developed, and maintained. In production, the judicious application of an Integrated Master Schedule (IMS) can in some cases be used to complement and supplement existing production-planning processes. This is because using an IMS during production can be helpful in tracking and monitoring high-risk items.
Note: The use of an IMS is often not applicable on Full Rate Production (FRP) programs.
Description
A production system is a framework of activities within which the creation of value can occur. At one end of the system are the inputs; at the other end are outputs. Connecting the inputs and outputs is a series of operations or processes. Although all production systems differ somewhat, there are two basic types; one is based upon continuous production of a product, and the other is based upon intermittent production of a product.
Most production-schedule architecture discussions and decisions focus on the relationship and integration of Manufacturing Resource Planning (MRP II) data with an Integrated Master Schedule (IMS). The goal should be to balance the value added summarization of MRP tasks in the IMS as representations of the detailed manufacturing activities for managerial visibility and assessing meaningful critical path impacts. To understand these decisions, a consistent understanding of the following processes is necessary:
1. Integrated Master Plan (IMP) 2. Material Requirements Planning (MRP) 3. Master Production Schedule (MPS) 4. Manufacturing Resource Planning (MRP II) 5. Line of Balance (LOB) 6. Integrated Master Schedule (IMS)
1. Integrated Master Plan (IMP) is an event-based plan consisting of a hierarchy of Program Events, Significant Accomplishments, and Accomplish Criteria. An IMP is usually required for development programs and may be required for Low Rate Initial Production (LRIP), but is rarely required for Full Rate Production programs (FRP).
2. Material Requirements Planning (MRP) is a high-level production planning and inventory control system used to manage manufacturing processes. It ensures materials are available for production, and that products are available for delivery to customers. MRP employs backward (As Late As Possible) scheduling using the customer need date (i.e. independent demand) to determine setbacks. MRP uses quantities; product structure, also known as the Bill of Material (BOM); current inventory levels; and supplier and

Scheduling in a Production Environment
Page 200 of 212
manufacturing lead times, to determine when material acquisition, fabrication, assembly and test activities must begin to ensure an organization meets its delivery date(s). Independent demand is typically a customer defined requirement documented in the contract.
MRP balances:
1. Demand a. What do I need b. How many do I need c. When do I need it
2. Supply a. What to buy/make b. When will it arrive c. How many will be delivered
Any delay to start and finish dates calculated by As Late as Possible (ALAP) scheduling, causes the need for expediting and/or workarounds. Because MRP employs ALAP scheduling, it is prudent to work toward internal delivery dates that are prior to these contractual delivery dates. Use of a setback schedule allows time to resolve future unforeseen production problems. Production Systems assume lead times are the same each time an item processed through the factory (regardless of quantity, capacity, and potential learning curves). MRP results may therefore be impossible to implement or execute to due to labor, machine, and/or supplier capacity constraints. 3. Master Production Schedule (MPS) is the anticipated build schedule for each product on the line. It translates the business plan (including forecast demand), into a production plan using planned orders. A master production scheduler develops an MPS that makes it possible, given resources available to the company, to meet business plan requirements/demands. The MPS takes the form of items, quantities, and specific dates. Unlike the business plan, the MPS level of planning is within the context of individual product family members instead of the broad context of product families. 4. Manufacturing Resource Planning (MRP II) systems expand upon MRP. MRP II brings integrated financials, MPS, rough-cut capacity planning, and capacity requirements planning to MRP. It facilitates the development of a detailed production schedule that accounts for machine and labor capacity, and schedules production runs according to the arrival of materials. The MPS is a key ingredient in the evolution of MRP to MRP II. Fluctuations in forecast data are taken into account by including simulations of the MPS, also referred to as Rough-Cut Capacity Planning (RCCP), thus creating medium to long-range (i.e., 1 – 5 years) control. Use RCCP to test proposed changes to the MPS. Capacity requirements planning (including infinite capacity planning), and finite capacity scheduling (including operations sequencing), provide short-range (i.e., months, weeks and days) control down to the workstation level. Shop floor control systems (in conjunction with MRP II) schedule finishing or final assembly work on the factory floor via a daily dispatch list. State the Detailed factory-floor work–schedules in terms of hours and minutes. A key MRP II output is a final labor and machine schedule. 5. Line of Balance (LOB) Technique LOB is a management technique for collecting measuring and presenting facts related to time, cost and accomplishment – all measured against a specific plan. It shows the process, status, background, timing and phasing of the project activities, thus providing management with measuring tools that help:
1. Comparing actual progress to a formal objective plan

Scheduling in a Production Environment
Page 201 of 212
2. Examine only the deviations from established plans, and gauge their degree of severity with respect to the remainder of the project.
3. Receiving timely information concerning trouble areas and indicating areas where appropriate corrective action is required.
4. Forecasting future performance
The “Line of Balance” (LOB) is a graphical device that enables a manager to see at a single glance which of many activities comprising a complex operation are “in balance” (i.e. whether those that should have been completed at the of the time of the review actually are completed and whether any activities scheduled for future completion are lagging behind schedule). The Line of Balance chart comprises only one feature of the whole philosophy, which includes numerous danger signal controls for all the various levels of management concerned.
6. Integrated Master Schedule (IMS) - Per Integrated Master Schedule (IMS) Data Item Description DI-MGMT-81650, an IMS is an integrated schedule containing the networked, detailed tasks necessary to ensure successful program execution. The IMS is vertically traceable to the Integrated Master Plan (IMP) (if applicable), the Contract Work Breakdown Structure (CWBS), and the Statement of Work (SOW). Use the IMS to verify attainability of contract objectives, to evaluate progress toward meeting program objectives, and to integrate the program schedule activities with all related components. Per DI-MGMT-81650, the IMS is applicable to development, major modification, and low rate initial production efforts; and is typically not applied to Full Rate Production (FRP) efforts.
Base the need for an IMS on contract value, contract-type, volatility of design, capability of existing production systems, and project management needs. As a program-approved process, any IMS should be developed and maintained to complement and supplement (instead of replacing or duplicating) existing design/production systems and processes. An IMS based on a logical network of interdependent tasks allows critical path/float analyses, and identifies handoffs between and among performing organizations. A production IMS should contain schedule-significant activity strings, and draw upon the strengths of existing production systems (such as MRP/MRP II), and applicable performance measurement systems (such as Earned Value). Why Use an IMS During Production? MRP II / LOB can provide exception reporting to the labor/machine schedules. The use of an IMS in conjunction with existing production systems allows for on-going critical path/float analyses, what-if analysis, external dependencies on items outside the MRP systems (i.e. software loads, engineering change/development activities, etc.) and the addition of resource attributes allows for the determination and reconciliation of cost and schedule variances. Perform Critical Path/float analyses throughout the period of performance of a contract to ensure adequate resources are available for critical/near-critical program activities. Always utilize an IMS during the transition from development to production and more specifically during any Low Rate Initial Production (LRIP) contract. During Full Rate Production (FRP), the benefit of using an IMS should exceed the effort of its development and maintenance. Enhance IMS fidelity by early development and tailoring based upon the availability/maturity of related supporting production/management systems and processes. Use of a logically networked IMS that is effectively and efficiently integrated with existing production systems, can be used to determine performance criticality and status; perform critical path analysis, “what if” exercises and SRAs; and identify lurking risks and potential opportunities. Risks
Scheduling in a Production Environment
Page 202 of 212
The nature and maturity of a program drives the quantity and type of risks and opportunities. However, keep in mind that the risk focus is different between development and production programs. Development programs are more concerned with design and development, and production programs are more concerned with parts availability, producibility engineering, and obsolescence. LRIP programs utilize a small production lot to transition from the completion of the development phase to the Full Rate Production Decision Review. Production IMS Content/Considerations Scheduling in a production environment is similar to scheduling in a development environment in that program maturity drives variation to IMS volatility, fidelity, and health metrics. During development, there is a greater emphasis on the identification of program/system requirements, and the prove-out of design concepts. During production, emphasis changes from non-recurring design/development activities, to recurring fabrication and test activities.
As a program approved process, the decision to employ an IMS should be based on whether it will compliment and supplement existing design/production systems and processes. An IMS should be modeled, generated, and maintained to interact/interface with related production/management system/processes associated with material acquisition and control, inventory management, and shop floor processes. Due to the nature of a development program, IMS activities, linkages and resources are not as tangible or certain as during a production program. For either type of program, one should develop and model an IMS that provides a reasonable and measurable means to execute the program. The IMS needs to accurately represent key program activity chains, and avoid replicating all the details that are already contained in supporting systems. Material Most production builds require the purchase and receipt of major/minor equipment and common piece parts. Normally, a factory would generate a subcontract for major components and assemblies/subassemblies above the production or technical capabilities of the factory. Procure Off-the-shelf piece parts, also known as General Purchase (GP) items, in bulk. General Purchase Items - Procuring items in bulk generally yields a lower per-unit price. A number of factors determine the size of a lot-buy including: design stability, contractual quantities, budget availability, and unit cost. Model the IMS to allow for interim and/or out-of-sequence deliveries. Most production builds require the acquisition, handling, and assembly of hundreds of unique piece parts. Most purchasing/production systems do an excellent job of identifying hardware requirements, and tracking the purchase and receipt of each of these items. Because each of these hundreds of GP items is inherent within the IMS, discrete IMS activities should only be created for schedule-significant or fixture-critical items (those items that preclude an assembly from entering or exiting the next phase of production). There are at least three (3) ways to model the IMS to include schedule-significant GP items:
1. Interface hand-off milestones that represent purchase order issue dates and/or delivery dates 2. Zero-duration milestones (that represent purchase order issue dates/delivery dates) connected
by lags or Schedule Visibility Tasks (SVT) 3. Schedule Visibility Tasks (SVT) that represent lead times.
Of the three, the third option is the easiest to implement since it provides an easy means to depict completed and remaining supplier work. Depending on company EVMS procedures, these activities may or may not be designated as Work Packages or defined as Schedule Visibility Tasks (SVT)

Scheduling in a Production Environment
Page 203 of 212
Major Subcontracts Most production builds require the acquisition, handling, and assembly of dozens of subcontractor-supplied sub-assembles/assemblies. Most purchasing/production systems do an excellent job of identifying major hardware requirements, and tracking the purchase and receipt of each of these items. Because most major hardware requirements are schedule-significant, each of these items should be included and linked within an IMS. Like GP, there are at least three (3) ways to model the IMS to include schedule-significant major hardware requirement items:
1. Interface hand-off milestones that represent purchase order issue dates and/or delivery dates 2. Zero-duration milestones (that represent purchase order issue dates/delivery dates) connected
by lags or activities 3. Schedule Visibility Tasks (SVTs) that represent lead times Of the three, the third option is the
easiest to implement since it provides an easy means to depict completed and remaining supplier work.
Shop Floor Processes Because the IMS and shop floor processes should work hand-in-hand, the integration of the two needs to consider the strengths and weaknesses of each of the systems. Take care to keep these systems in sync throughout program execution. When used properly, MRP / MRP II databases reflect all the documents, parts, processes, and resources that yield a production deliverable. Most MRP systems use just-in-time scheduling and/or setbacks to identify need dates. Managers in turn create internal schedules and assign resources to meet or beat these need dates. A good IMS converts backward-looking MRP data into forward-looking IMS data. The creation of an activity interdependency network allows the determination of critical items, free/total float, and schedule risk based on three (3) point estimates (minimum, most- likely, and maximum remaining durations). Use Cycle times to smooth resources by minimizing downtime. By stacking and then offsetting stages of production, a product can readily move from one crew/fixture to another. Early or late completion of a cycle adversely effects the smoothing of resources. By assuring the completion of fixture-critical items on time and in-station, non-fixture-critical activities items may in turn be delayed or done-out-of-station on a non-interference basis. When it is not possible or practical to complete a cycle on time, non-fixture dependent tasks are often delayed and done out of station. Doing this work out-of-sequence (on a non-interference basis) is usually more economical than violating standard cycle times and causing choke points. Standard cycle times therefore usually include some wiggle-room to allow for inevitable unforeseen workarounds. Take into consideration contractor/subcontractor work calendars when scheduling a program. Instead of overwriting pre-defined contractor/subcontractor work calendars, use calendar days/alternate resource calendars to schedule tasks that fall on working days. (Reference the Working Calendars chapter in the guide). Other Production Considerations: As required, production programs should address related items such as: NRE (Non-Recurring Engineering), rework & scrap, Obsolescence, resource requirements and availability, touch/support labor, standard/budgeted hours, and external dependencies.

Scheduling in a Production Environment
Page 204 of 212
Update the IMS to reflect the integrated path forward due to recovery and work-around plans on the production floor. This includes making adjustments for traveled work Correlate IMS tasking to production system details. Production Program activity durations are often longer than development program activities due to the numbers of long supplier lead times. Production IMS tasks should represent key project activity chains. IMS tasks should not be arbitrarily broken up to hit metrics guidelines.
Optional Techniques
Load-Leveling Technique: Every plant manager’s dream is to run the manufacturing facility at a steady pace – i.e., at a level load. The plant loads vary widely; there is underutilized capacity during some periods, and the need for costly overtime in others. These fluctuations are due to fluctuating demand, equipment downtime, and/or poor scheduling. Master Production Schedulers attempt to even out production peaks and valleys. Building-up stock (and incurring excess inventory costs) is one possible solution. Working with the sales department to manage demand is another possible solution. Discounts could be effective in this effort. Breaking the overall time span into smaller blocks, and level loading these blocks is another solution.
Things to Promote
As a minimum, review production schedule artifacts weekly in support of at least a monthly IMS status process. Develop guidelines or “rescheduling time zone rules” to aid master production schedulers in making decisions. Management policies drive the rules that specify the kinds of changes allowed to the production flow at certain points in time. For the sake of discussion, say that Zone A includes the current and near-term periods, and is one in which the master production scheduler and management should carefully investigate all suggested changes. Changes here will be disruptive and costly. Consider implementing only safety and emergency changes here. Zone B is one in which caution should be exercised with respect to changes. Capacity and material availability for changes need scrutiny here, and the prioritization of different orders may be required. The boundary between Zone A and Zone B often coincides with final assembly. In Zone C, the master scheduler is free to make changes as long as the schedule remains within the production plan constraints. This period is far enough into the future that the master scheduler can modify the IMS without affecting the procurement of material or the process of getting the product to market. The boundary between Zone B and Zone C is typically the cumulative lead-time to build the production article. Integrate and drive engineering and production activities with a common production scheduling system.
Things to Avoid
Do not permit the production steps to go past due and remain there. Capacity planning and MRP II are tools that may support proposal inputs. However, to validate these recommendations, a full complement of planning tools is necessary. The Master Production Scheduler will adjust the production line whenever an unbalanced supply and demand condition exists or when policy violations occur.
Related Topics
Resource Loaded Schedules Scheduling for Different Program/Contract Types Working Calendars Schedule Visibility Tasks (SVT)
Appendix A - Terms, & Definitions
Page 205 of 212
Appendix A - Terms & Definitions
The following list contains some useful terms & definitions relevant to program planning.
Activity / Task: an element of work with duration in the Integrated Master Schedule (IMS)
Backward Pass: the calculation used by the schedule software tool to determine the latest possible Start and Finish Dates for every activity in the IMS network
Contract: an awarded agreement from a government or industry customer specifying the terms and conditions of performance, including defining all clauses, delivery schedules, data products, rights to data, work scope and performance boundaries, cost share criteria, etc.
Control Account (C/A): the intersection of one WBS and one OBS representing a discrete portion of program scope assigned to an individual manager. The control account is the minimum level where technical, schedule, and cost responsibility exists.
Control Account Manager (CAM): the individual responsible for cost, schedule and technical performance of the scope within a control account (also typically responsible for the creation, status, and maintenance of the IMS tasks within the control account)
Critical Path: the longest sequence of tasks from Timenow until the program end
Driving Path(s): the longest sequence of tasks from Timenow to an interim program milestone
Early Start / Finish: the earliest possible start or finish date for an IMS activity
Earned Value Management: a management technique used to measure program performance and progress by combining aspects of technical (scope), schedule, cost, and execution efficiency
Finish-to-Finish (FF): a logical relationship used in the IMS network that establishes the following rule between two activities: the succeeding task cannot finish until a preceding task finishes
Finish-to-Start (FS): a logical relationship used in the IMS network that establishes the following rule between two activities: the succeeding task cannot start until a preceding task finishes
Forward Pass: the calculation used by the schedule software tool to determine the earliest possible Start and Finish Dates for every activity in the IMS network
Free Float: the amount of time between an activity and its next closest successor / calculated by taking the delta between an activity’s Early Finish Date and Early Start Date of the its next closest successor
General Purchase (GP) Items: off-the-shelf piece parts generally purchased in bulk
Hard Constraint: does not allow the logic to drive the schedule (i.e. either restricts all movement or restricts movement to the right) on the constrained task.
Integrated Master Plan (IMP): a top level program plan / hierarchy that is decomposed into program events, event accomplishments, and accomplishment criteria, the IMP is typically not time phased and often serves as the basis for the program Integrated Master Schedule (IMS)
Integrated Master Schedule (IMS): an integrated and logical network of activities required to accomplish the program scope
Lag: a scheduling option that inserts a delay in time between two logically linked IMS activities
Appendix A - Terms, & Definitions
Page 206 of 212
Late Start / Finish: the latest possible start or finish date for an IMS activity
Lead: a scheduling option that models an overlap between two logically linked IMS activities
Level of Effort: an indiscrete support type activity that automatically earns performance with the passage of time - an Earned Value Technique/Method
Line of Balance (LOB) Technique: a production management technique for collecting measuring and presenting facts related to time, cost and accomplishment – all measured against a specific plan
Master Production Schedule (MPS): the anticipated build schedule for each product on the line
Master Production Scheduler: the individual responsible for managing the Master Production Schedule in MRP
Materials Requirement Planning (MRP): a high-level production planning and inventory control system used to manage manufacturing processes
Materials Requirement Planning II (MRP II): an expansion to MRP that adds integrated financials, MPS, rough-cut capacity planning, and capacity requirements planning
Milestone: a schedule element that has zero duration and is used as a point of reference in the IMS
Near Critical Path(s): the 2nd, 3rd, 4th (etc) longest sequence of tasks from Timenow to the program end date
Near Driving Path(s): the 2nd, 3rd, 4th (etc) longest sequence of tasks from Timenow to an interim program milestone
Non-Recurring Effort (NRE): a program effort that does not repeat during the program life cycle
Organizational Breakdown Structure (OBS): a program structure that depicts the established organizational framework
Over Target Baseline (OTB): a Contract Budget Base (CBB) that was formally reprogrammed to include additional performance management budget and which therefore exceeds the contract target cost
Over Target Schedule (OTS): a program schedule that was formally reprogrammed to a condition where work is scheduled and the associated budgets are time phased beyond the contract completion date.
Performance Measurement Baseline (PMB): the time-phased budget plan for accomplishing the program scope, the PMB is traceable to the baseline dates in the IMS
Planner/Scheduler: the individual responsible for maintaining the Integrated Master Schedule (IMS)
Planning Package: a segmented portion of discrete program scope within a Control Account that is not yet broken down into work packages but is logically linked in the IMS - performance cannot be taken against a Planning Package
Program, Task, and Resource Calendars: calendars established in the IMS used determine non-working days (i.e. holidays, weekends, etc)
Recurring Effort: a program effort that repeats during the program life cycle
Schedule Visibility Task (SVT): an un-resourced activity representing effort that is not part of the budgeted program scope, but that is related to and may potentially impact program tasks

Appendix A - Terms, & Definitions
Page 207 of 212
Soft Constraint: allows the logic to drive the schedule (i.e. restricts only movement to the left) on the constrained task. Start-to-Finish (SF): a logical relationship used in the IMS network that establishes the following rule between two activities: the succeeding task cannot finish until a preceding task starts (rarely used)
Start-to-Start (SS): a logical relationship used in the IMS network that establishes the following rule between two activities: the succeeding task cannot start until a preceding task starts
Statement of Work (SOW): an organized specification of contract requirements to be performed on a program
Summary Level Work Planning Package (SLPP): a segmented portion of discrete program scope spanning multiple Control Accounts that has not been detail planned but that is logically linked in the IMS - performance cannot be taken against a Summary Level Planning Package
Task Owner: the individual responsible for executing a task
Timenow: the date that the scheduling tool treats as "today" (also known as the update, data, or status date) - all dates "to the left" of Timenow are considered by the scheduling tool to be "in the past" - all dates "to the right" of Timenow are considered by the scheduling tool to be "in the future"
Toll Gate Milestones: milestones that constitute the start or completion of work scope and serve as an objective criterion for determining accomplishment - Toll Gate milestones aid in analyzing and managing complex Integrated Master Schedules
Total Float: is defined as the number of workdays an activity's finish date can slip before impacting the program's end date, it is calculated by taking the delta between an Activity's Late Finish date and Early Finish date - it is also known as Total Slack
Travel Work: effort performed out of the planned workflow sequence in order to mitigate scheduling impacts on downstream process steps - this term is used primarily on production efforts
Work Breakdown Structure (WBS): a program structure that depicts the subdivision of effort required to accomplish the program scope
Work Package: a segmented portion of discrete program scope within a Control Account that is broken down into logically linked activities in the IMS – performance is taken against work packages

Appendix B - References
Page 208 of 212
Appendix B - References
The following is a list of recommended references to accompany this guide.
DI-MGMT-81650, Integrated Master Schedule
DI-MGMT-XXXXX (# TBD at time of PASEG v2.0 release) Integrated Program Management Report (IPMR)
DOD Integrated Master Plan and Integrated Master Schedule Preparation and Use Guide
GAO Scheduling Best Practices (in development)
GAO Cost Estimating and Assessment Guide
DCMA 14-Point IMS Assessment
DCMA Microsoft Project Integrated Master Schedule Assessment Guide (EVC 101)
DCMA Open Plan Integrated Master Schedule Assessment Guide (EVC 102)
DCMA Primavera Integrated Master Schedule Assessment Guide (EVC 103)
DCMA EVMS Standard Surveillance Instruction
NAVAIR Scheduling Guide
Navy CEVM Analysis Toolkit
NASA Scheduling Guide (NASA/SP-2010-3403)
ANSI Standard (EIA-748-B)
NDIA PMSC EVMS Intent Guide
Earned Value Implementation Guide (EVMIG)
Mil-Handbook 881 Work Breakdown Structure
Risk Management Guide for DOD Acquisition
PMI PMBOK
DOD Guide to Integrated Product and Process Development
Defense Acquisition Guidebook
Defense Acquisition Program Support Methodology
NDIA PMSC EVMS Intent Guide
NDIA Surveillance Guide
Over Target Baseline / Over Target Schedule Handbook
Program Managers Guide to the Integrated Baseline Review Process - USD/AT&L
DAU EVMS Gold Card
DAU 262 White Card
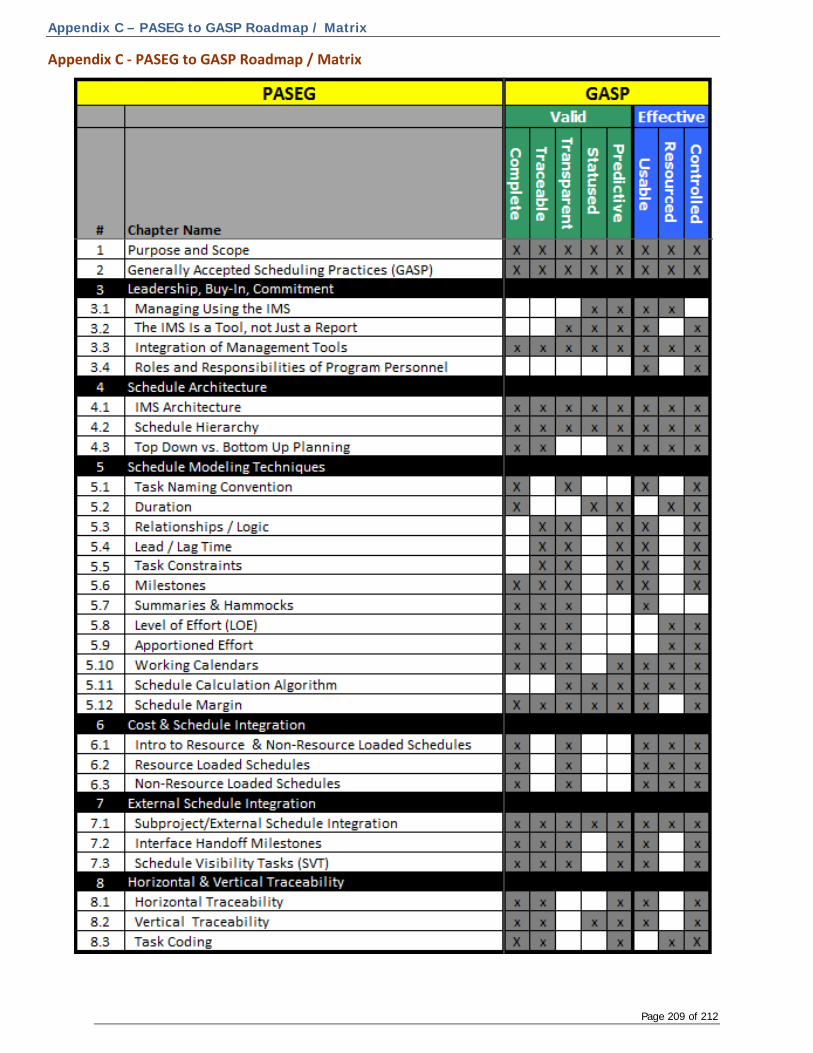
Appendix C – PASEG to GASP Roadmap / Matrix
Page 209 of 212
Appendix C - PASEG to GASP Roadmap / Matrix
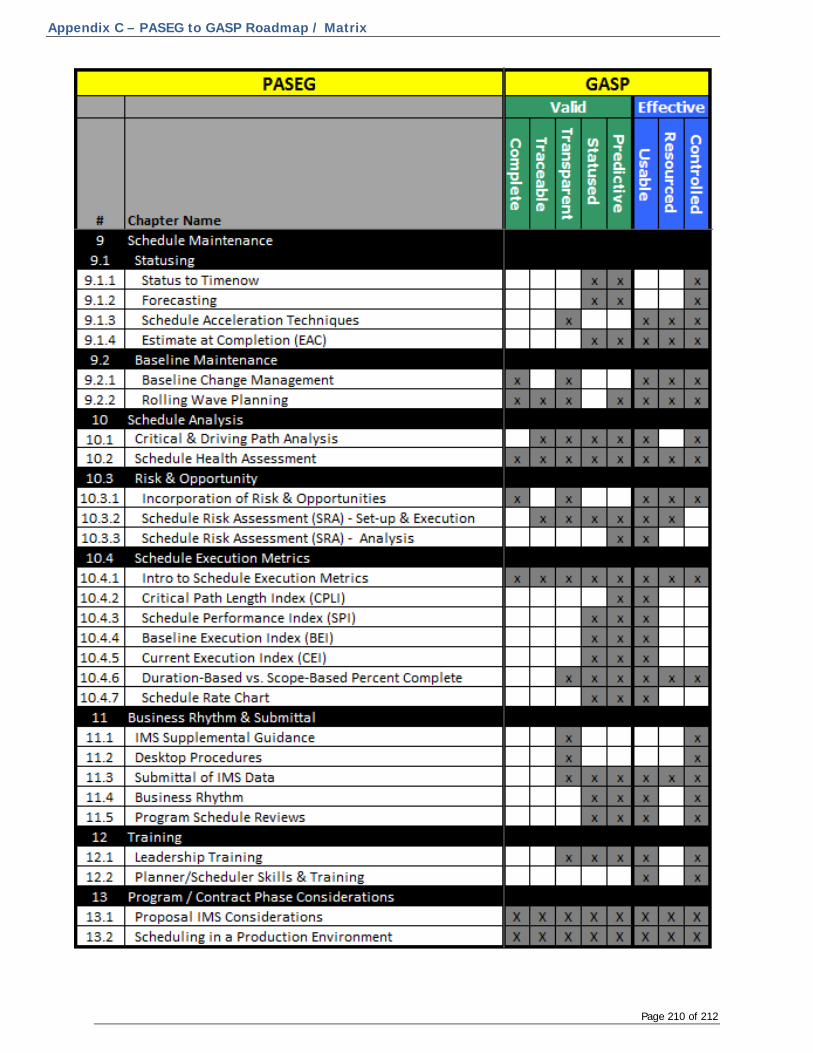
Appendix C – PASEG to GASP Roadmap / Matrix
Page 210 of 212

Appendix D – Credits & Acknowledgements
Page 211 of 212
Appendix D - Credits & Acknowledgements
The following industry subject matter experts were advisors to the PASEG content: AJ Whipple – Bell Helicopter Andrew Uhlig - Raytheon Anthony Claridge - Northrop Grumman Blaine Schwartz - AzTech International Brian Valenti - Rockwell Collins Buck Wilkerson - Humphreys & Associates (rep. Lockheed Martin) [PASEG Content Review Board] Carla Gilhuys – Northrop Grumman Carol Boser - Lockheed Martin [PPSS Management Team] Chris Neffinger –SM&A Christa Martin – Rockwell Collins Craig Cardwell – SM&A Dan Soukup - AzTech International Daniel Roy – SM&A Dave Baum – Lockheed Martin Dave Rutter - AzTech International [PASEG Content Review Board] Dave Treacy - MCRI David Kaser - Raytheon Dennis Daniel – Lockheed Martin Derek Regan – SM&A Diane McCrea - Raytheon Ginny Harvey – Raytheon Gregory Haymond – Pratt & Whitney Hanna Icenogle - Lockheed Martin James Ivie - AzTech International James Rianda - Northrop Grumman Jane Spriggs – Lockheed Martin Jim Lonsdale - Pratt & Whitney Joan Ugljesa – New Vistas Group John Anderson - Lockheed Martin John Santora - Northrop Grumman Jose Otero - Sikorsky Joshua Anderson - Raytheon [PASEG Project Lead] Joy Sichveland - AzTech International Justin Bailes - Raytheon Lee Miller – SM&A Lil Vayhinger - Raytheon [PPSS Management Team Lead] Luis Contreras - AzTech International [PASEG Content Review Board] Marck Wilcox - Rockwell Collins Mark Burch - Boeing [PASEG Content Review Board] Mark Goumas - Sikorsky Michael Watson - Lockheed Martin Mike Assadi - Northrop Grumman Patricia Meyer - Boeing Patricia Tisone – Northrop Grumman Pete Wynne - Lockheed Martin Peter Kubecka - Rockwell Collins P.J. Pietrandrea - Lockheed Martin Raymond Ferrarin - BAE Richard Lane - Lockheed Martin Rick Fellner - Northrop Grumman Robert Karl - Rockwell Collins Robin Steel - Raytheon Scott Gring - Lockheed Martin Steve Palmer - Northrop Grumman Stuart Retter - Bell Helicopter Sung Soon Stultz - Rockwell Collins Susan Parnoff - Sikorsky Sylvia Centeno - Pratt & Whitney Teresa Rudolph - Raytheon The following industry subject matter experts were advisors to the PASEG content (continued):
Appendix D – Credits & Acknowledgements
Page 212 of 212
Tim McLaughlin - Boeing Virginia Harvey - Raytheon Warren Kline - Raytheon Wayne Pettiford - Lockheed Martin William Mountain - Raytheon Yancy Qualls - Bell Helicopter Zach Lindemann - AzTech International Zachary Scoma - Pratt & Whitney The following were Government liaison representatives to the NDIA with respect to the PASEG. Anita Cukr - DAU Beau Willis - Navy Bob Loop – Delta Resource (supporting Navy CEVM) Chris Mushrush - NAVAIR Dave Burgess - NAVAIR Donna Holden - DCMA Eileen Lang - NAVAIR Erik Berg – DCMA Frederick Meyer – USAF Gordon Kranz - PARCA Ivan Bembers - NRO Jason Lee - GAO Jeff Upton - NAVAIR Jesse Stuart - DAU Joe Chang - DAU John Scaparro - NAVAIR Karen Richey - GAO Melissa Slaughter – Delta Resources (supporting Navy CEVM) Mike Beattie - USAF Rebecca Davies - USAF Rob Pratt – Army Shannon House - USAF