Planning for Universal Access in Eastern Indonesia · Eastern Indonesia Asia Clean Energy Forum 6...
15
Planning for Universal Access in Eastern Indonesia Asia Clean Energy Forum 6 June 2017
Transcript of Planning for Universal Access in Eastern Indonesia · Eastern Indonesia Asia Clean Energy Forum 6...

Planning for Universal Access in Eastern Indonesia
Asia Clean Energy Forum
6 June 2017
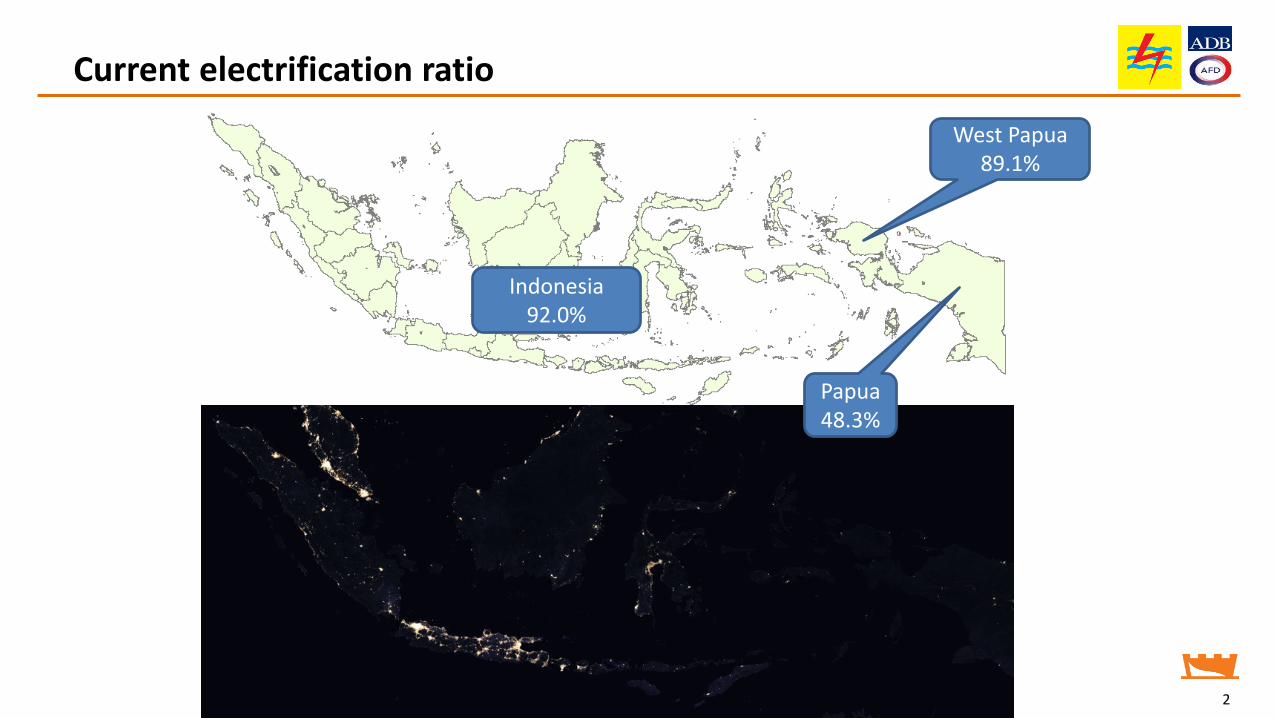
Current electrification ratio
2
Papua48.3%
West Papua89.1%
Indonesia92.0%
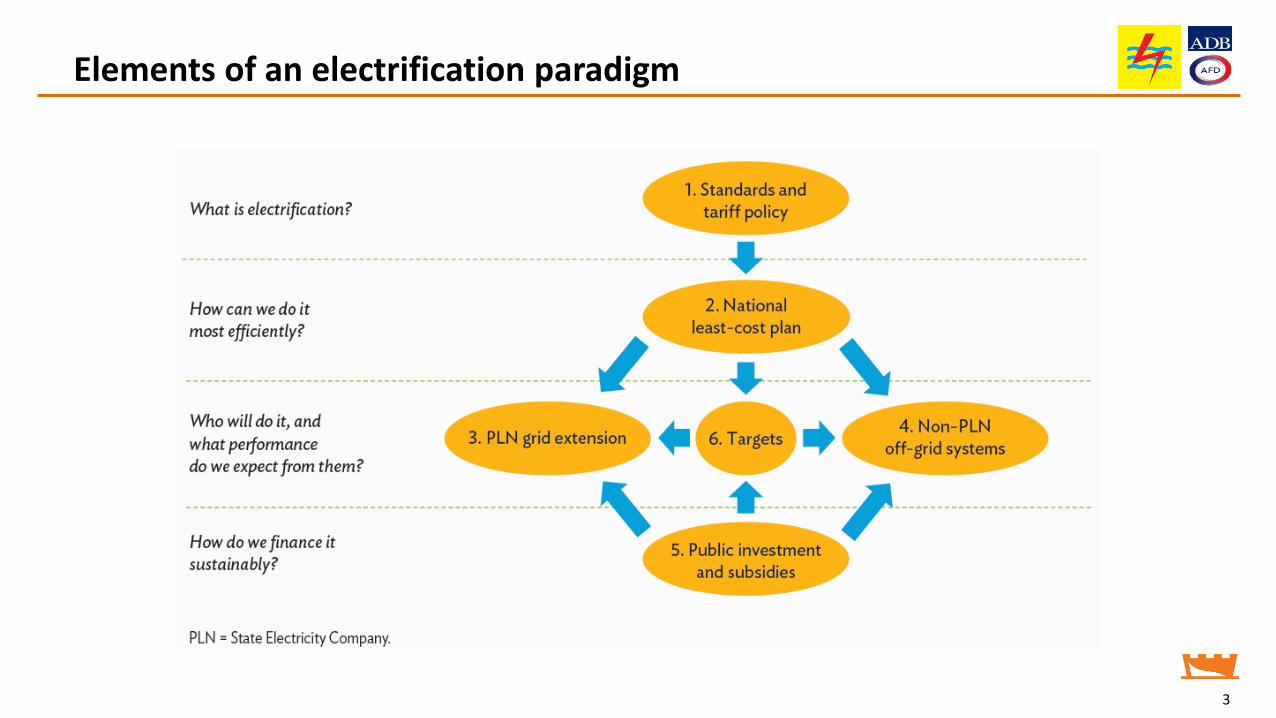
Elements of an electrification paradigm
3

What do we need from an electrification plan?
1. Accuracy
2. Timeliness
3. Coverage
4. Granularity
5. Optimality (least-cost)
6. Funding requirements
4
What infrastructure……should be built where…
….and how much it will cost
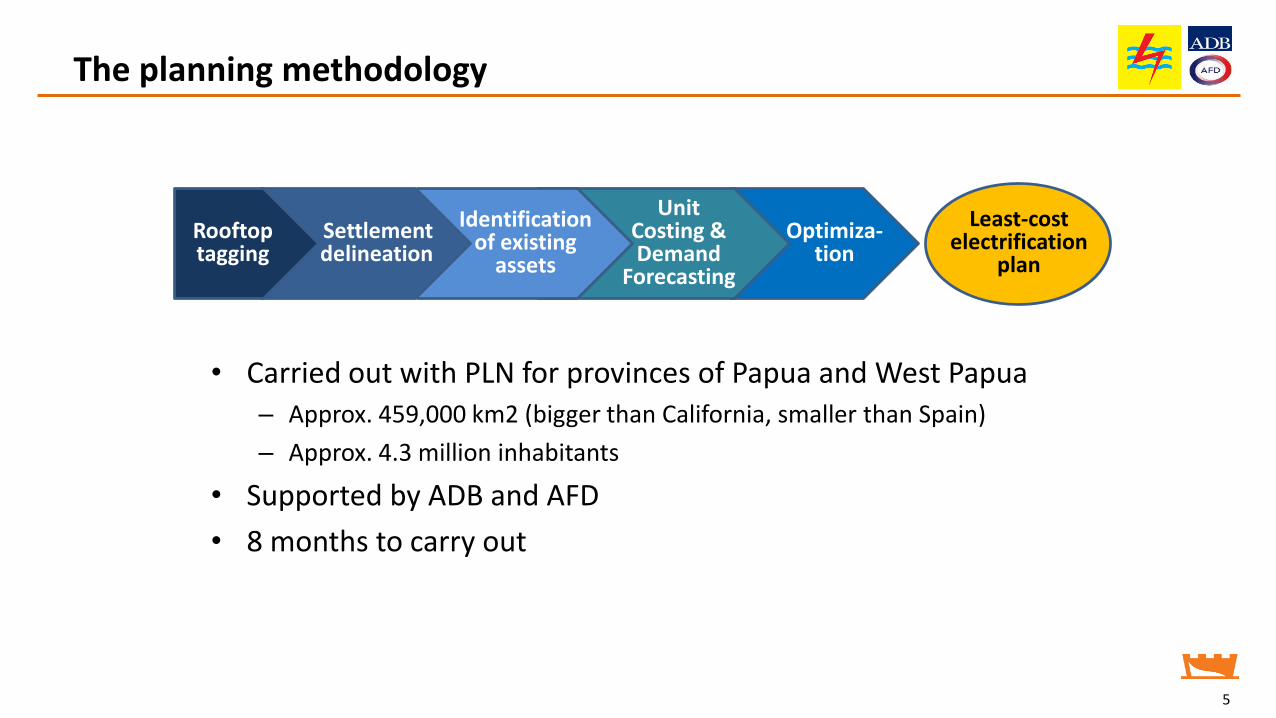
Optimiza-tion
Unit Costing & Demand
Forecasting
Identification of existing
assets
Settlement delineation
The planning methodology
• Carried out with PLN for provinces of Papua and West Papua– Approx. 459,000 km2 (bigger than California, smaller than Spain)
– Approx. 4.3 million inhabitants
• Supported by ADB and AFD
• 8 months to carry out
5
Rooftop tagging
Least-cost electrification
plan
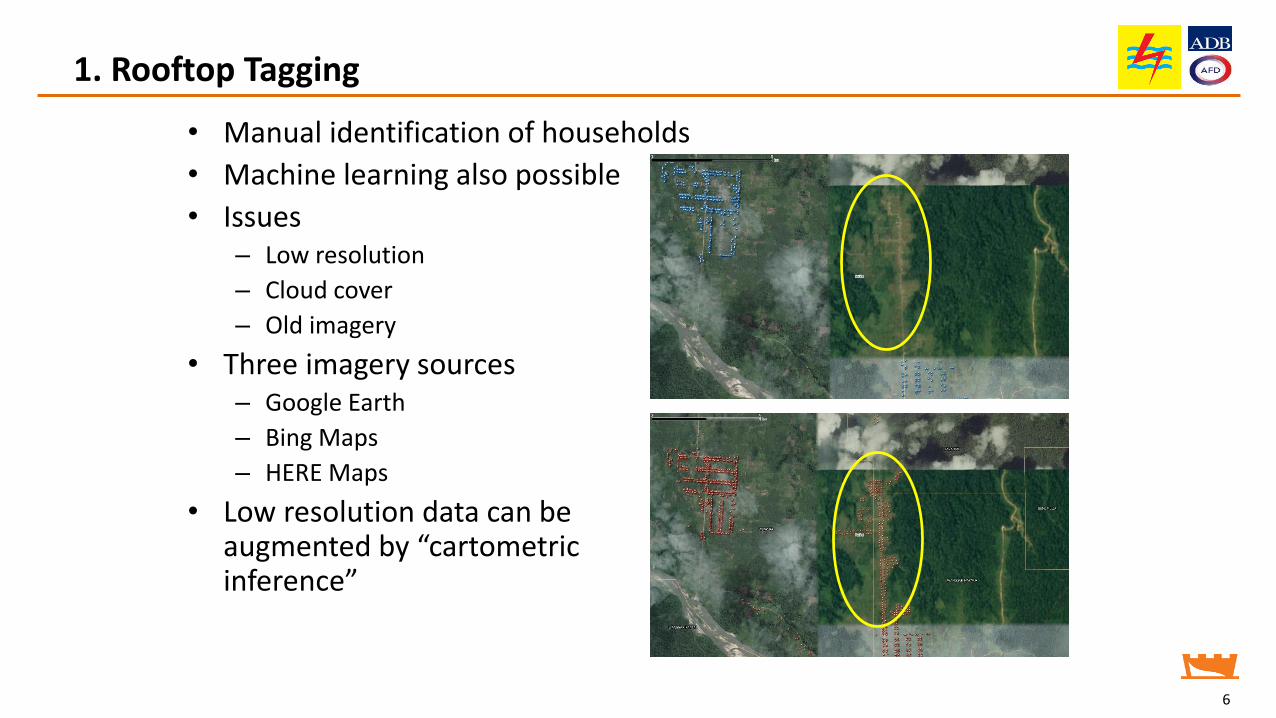
1. Rooftop Tagging
• Manual identification of households
• Machine learning also possible
• Issues– Low resolution
– Cloud cover
– Old imagery
• Three imagery sources– Google Earth
– Bing Maps
– HERE Maps
• Low resolution data can be augmented by “cartometricinference”
6
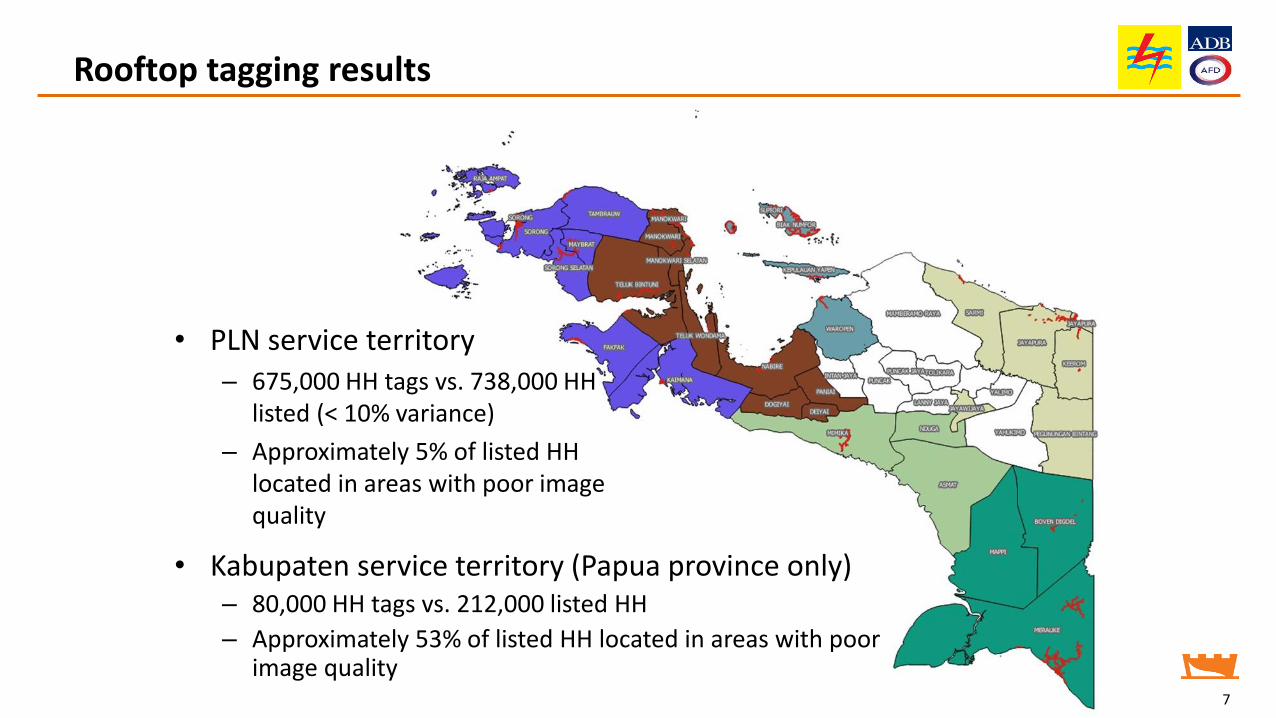
Rooftop tagging results
7
• PLN service territory– 675,000 HH tags vs. 738,000 HH
listed (< 10% variance)
– Approximately 5% of listed HH located in areas with poor image quality
• Kabupaten service territory (Papua province only)– 80,000 HH tags vs. 212,000 listed HH
– Approximately 53% of listed HH located in areas with poor image quality
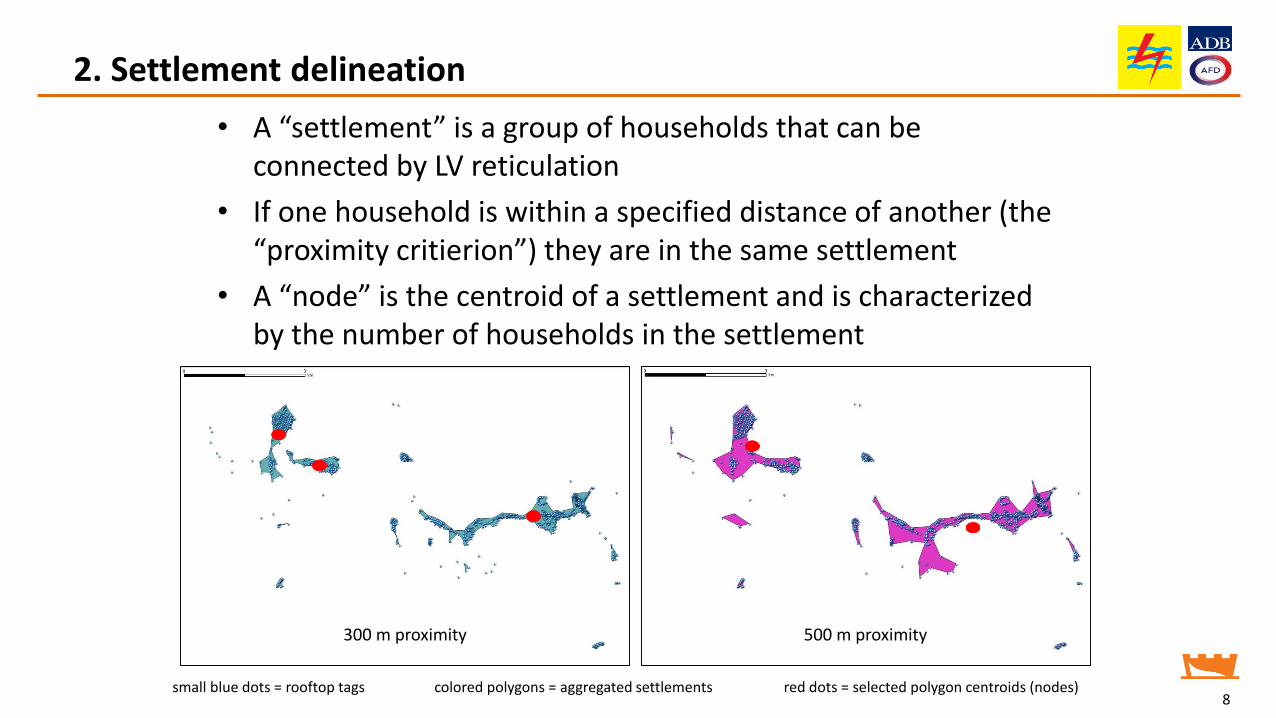
2. Settlement delineation
• A “settlement” is a group of households that can be connected by LV reticulation
• If one household is within a specified distance of another (the “proximity critierion”) they are in the same settlement
• A “node” is the centroid of a settlement and is characterized by the number of households in the settlement
8
300 m proximity 500 m proximity
small blue dots = rooftop tags colored polygons = aggregated settlements red dots = selected polygon centroids (nodes)
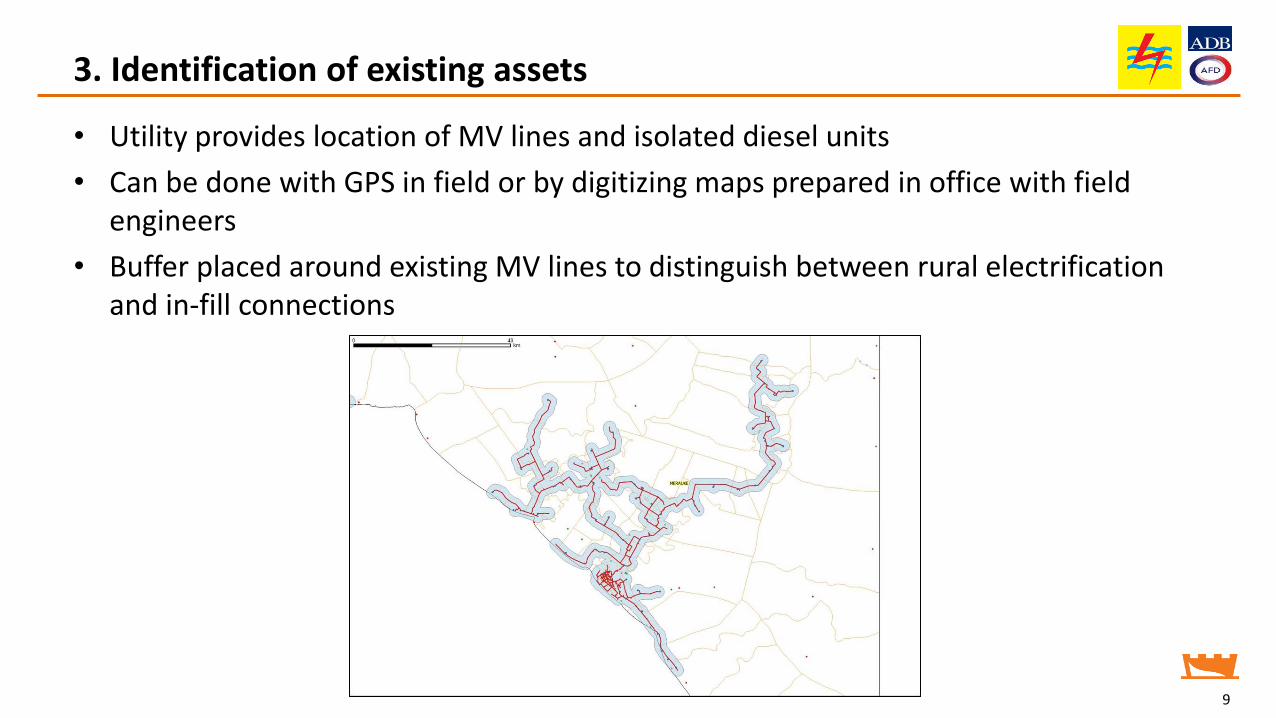
3. Identification of existing assets
• Utility provides location of MV lines and isolated diesel units
• Can be done with GPS in field or by digitizing maps prepared in office with field engineers
• Buffer placed around existing MV lines to distinguish between rural electrification and in-fill connections
9
4. Unit costing & demand forecasting
• Compile unit costs and performance of candidate technologies– Grid extension
– PV mini-grids (other mini-grid technologies could be defined)
– Solar home systems
• Define settlement demand model– Settlement population
– Economic growth
– Population growth
– Based on power sales on existing mini-grids: sales vs. number of consumers
– Other social and commercial infrastructure can be explicitly modeled
10
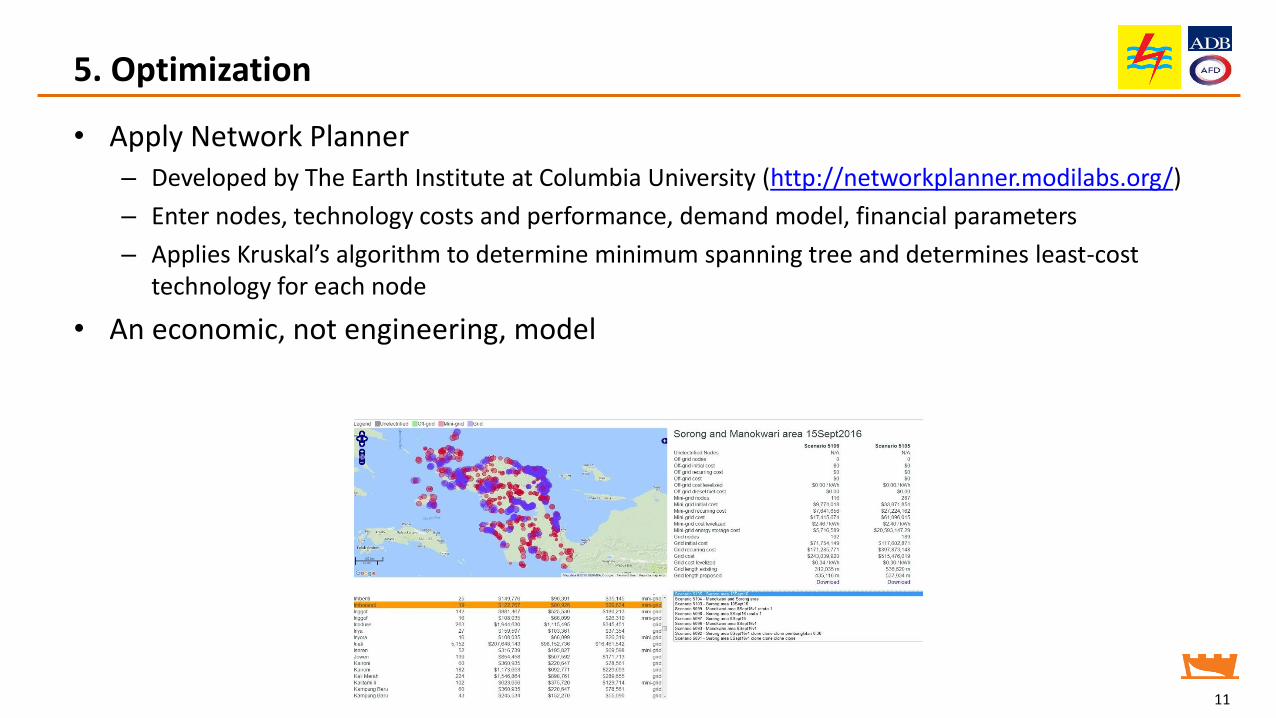
5. Optimization
• Apply Network Planner– Developed by The Earth Institute at Columbia University (http://networkplanner.modilabs.org/)
– Enter nodes, technology costs and performance, demand model, financial parameters
– Applies Kruskal’s algorithm to determine minimum spanning tree and determines least-cost technology for each node
• An economic, not engineering, model
11
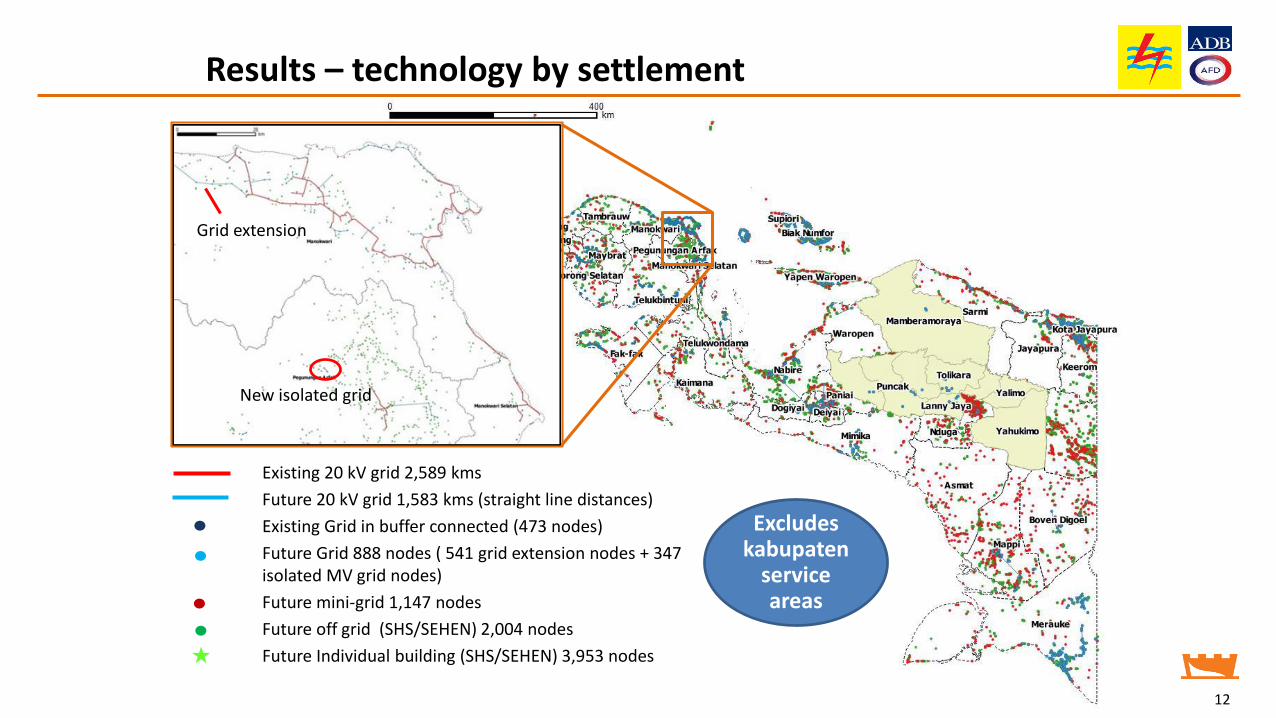
Results – technology by settlement
12
Existing 20 kV grid 2,589 kms
Future 20 kV grid 1,583 kms (straight line distances)
Existing Grid in buffer connected (473 nodes)
Future Grid 888 nodes ( 541 grid extension nodes + 347isolated MV grid nodes)
Future mini-grid 1,147 nodes
Future off grid (SHS/SEHEN) 2,004 nodes
Future Individual building (SHS/SEHEN) 3,953 nodes
Excludes kabupaten
service areas
New isolated grid
Grid extension
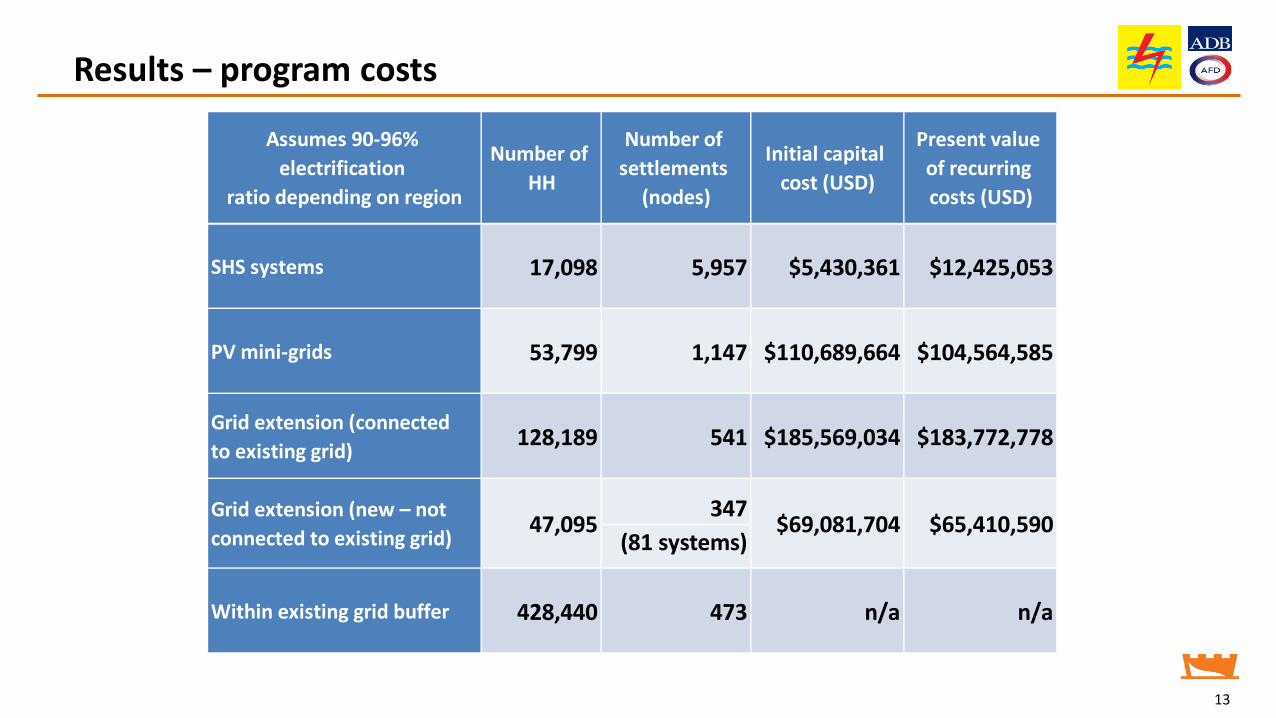
Results – program costs
13
SHS systems 17,098 5,957 $5,430,361 $12,425,053
PV mini-grids 53,799 1,147 $110,689,664 $104,564,585
Grid extension (connected
to existing grid)128,189 541 $185,569,034 $183,772,778
347
(81 systems)
Within existing grid buffer 428,440 473 n/a n/a
Grid extension (new – not
connected to existing grid)47,095 $69,081,704 $65,410,590
Assumes 90-96%
electrification
ratio depending on region
Number of
HH
Number of
settlements
(nodes)
Initial capital
cost (USD)
Present value
of recurring
costs (USD)
Conclusions
• First-order rural electrification plans can be prepared relatively quickly, cheaply and accurately for large areas
• Results must be combined with local knowledge and field studies – “confirmatory studies”
• Additional studies are needed to ensure adequate generation and transmission
14

15
THANK YOU !www.castlerockasia.com