
Planning for the future: identifying conservation priority ...
37
1 Planning for the future: identifying conservation priority areas for Iberian birds under climate change. María Triviño • Heini Kujala • Miguel B. Araújo • Mar Cabeza M. Triviño (Corresponding author) • Miguel B. Araújo Departamento de Biogeografía y Cambio Global, Museo Nacional de Ciencias Naturales, Consejo Superior de Investigaciones Científicas, C/José Gutiérrez Abascal, 2, 28006 Madrid, Spain e-mail: [email protected]; [email protected] M. Triviño University of Jyvaskyla, Department of Biological and Environmental Science, P.O. Box 35, FI- 40014, Jyväskylä, Finland H. Kujala • M. Cabeza Metapopulation Research Centre, Department of Biological and Environmental Sciences, University of Helsinki, P.O. Box 65 (Biocenter III) 00014 Helsinki, Finland M. B. Araújo Center for Macroecology, Evolution and Climate, Natural History Museum of Denmark, University of Copenhagen, Universitetsparken 15, Building 3, DK-2100, Copenhagen, Denmark Rui Nabeiro Biodiversity Chair, University of Évora, 7000-890, Évora, Portugal Accepted for publication in Landscape Ecology, doi: 10.1007/s10980-018-0626-z
Transcript of Planning for the future: identifying conservation priority ...

1
Planning for the future: identifying conservation priority areas for
Iberian birds under climate change.
María Triviño • Heini Kujala • Miguel B. Araújo • Mar Cabeza
M. Triviño (Corresponding author) • Miguel B. Araújo
Departamento de Biogeografía y Cambio Global, Museo Nacional de Ciencias Naturales,
Consejo Superior de Investigaciones Científicas, C/José Gutiérrez Abascal, 2, 28006 Madrid,
Spain
e-mail: [email protected]; [email protected]
M. Triviño
University of Jyvaskyla, Department of Biological and Environmental Science, P.O. Box 35, FI-
40014, Jyväskylä, Finland
H. Kujala • M. Cabeza
Metapopulation Research Centre, Department of Biological and Environmental Sciences,
University of Helsinki, P.O. Box 65 (Biocenter III) 00014 Helsinki, Finland
M. B. Araújo
Center for Macroecology, Evolution and Climate, Natural History Museum of Denmark,
University of Copenhagen, Universitetsparken 15, Building 3, DK-2100, Copenhagen, Denmark
Rui Nabeiro Biodiversity Chair, University of Évora, 7000-890, Évora, Portugal
Accepted for publication in Landscape Ecology, doi: 10.1007/s10980-018-0626-z

2
Abstract
Context Species are expected to shift their distributions in response to global environmental
changes and additional protected areas are needed to encompass the corresponding changes
in the distributions of their habitats. Conservation policies are likely to become obsolete
unless they integrate the potential impacts of climate and land-use change on biodiversity.
Objectives We identify conservation priority areas for current and future projected
distributions of Iberian bird species. We then investigate the extent to which global change
informed priority areas are: (i) covered by existing protected area networks (national
protected areas and Natura 2000); (ii) threatened by agricultural or urban land-use changes.
Methods We use outputs of species distributions models fitted with climatic data as inputs
in spatial prioritization tools to identify conservation priority areas for 168 bird species. We
use projections of land-use change to then discriminate between threatened and non-
threatened priority areas.
Results 19% of the priority areas for birds are covered by national protected areas and 23%
are covered by Natura 2000 sites. The spatial mismatch between protected area networks
and priority areas for birds is projected to increase with climate change. But there are
opportunities to improve the protection of birds under climate change, as half of the priority
areas are currently neither protected nor in conflict with urban or agricultural land-uses.
Conclusions We identify critical areas for bird conservation both under current and climate
change conditions, and propose that they could guide the establishment of new conservation
areas across the Iberian Peninsula complementing existing protected areas.
Keywords Bioclimatic envelope models • Breeding birds • Conservation planning • Land-
use change • Natura 2000 • Portugal • Protected areas • Reserve networks • Spain •
Zonation software.

3
Introduction
Protected areas are a popular planning instrument for conservation of natural ecosystems
and biodiversity. They can be effective, if well managed, at stopping or reducing the
negative effects of surrounding land uses (e.g., Eklund et al. 2011; ter Steege et al. 2015).
However, the effectiveness of existing protected areas at minimising the negative effects of
future climatic and land-use changes on biodiversity has been systematically questioned
(e.g., Hannah et al. 2007; Alagador et al. 2014). The fact that protected areas are fixed in
space makes them likely to undergo changes in their species composition and richness as
climate changes (Hole et al. 2009; Araújo et al. 2011). Such changes in biodiversity are the
result of different types of biological responses to climate change such as species range
expansions, contractions, displacement, or elevational shifts (e.g., Davis and Shaw, 2001;
Forero-Medina et al. 2011; Roth et al. 2014), as well as phenological and behavioural
changes (e.g., Badeck et al. 2004). Even under scenarios of marked global environmental
changes, protected areas are likely to remain important despite turnover in species
composition and richness (Thomas et al. 2012; Thuiller et al. 2014a; Thomas and
Gillingham 2015), because they are often the most pristine habitat in otherwise highly
modified landscape matrices.
The Iberian Peninsula is part of the Mediterranean biodiversity hotspot (Myers et al. 2000)
and harbours as much as half of the European terrestrial vertebrate and plant species
(Araújo et al. 2007) as well as a high proportion of endemic species (Williams et al. 2000).
Such relatively high biodiversity is probably the outcome of several combined factors,
chiefly among them the high environmental and geographical heterogeneity that generates
opportunities for concatenation of niches in relatively small areas (Baselga and Araújo
2010), and the role of Iberia as a glacial refugia for many European species during the
Quaternary cold periods (Hewitt 2000). In addition, the Iberian Peninsula is recognized as
one of the most vulnerable regions to climate change with expected extensive warming and

4
increase of droughts (IPCC 2014). Moreover, the Iberian Peninsula is a highly populated
region with approximately 53 million people and plays a key role in the European
agricultural production (Civantos et al. 2012).
Iberia is covered by an extensive network of conservation areas that includes two major
types: (i) nationally-designated protected areas; and (ii) European Union (EU)-designated
Natura 2000 sites. Hereafter we use ‘conservation area networks’ to collectively refer to
both types of conservation planning designations. The goal of the Natura 2000 network is to
ensure the persistence of some of the most valuable species and habitats at the European
level. It is comprised of Special Areas of Conservation (SACs) designated under the EU
Habitats Directive to conserve rare and vulnerable non-bird animals, plants and habitats,
and Special Protection Areas (SPAs) designated under the EU Birds Directive to preserve
important sites for rare and vulnerable birds. The Iberian Peninsula plays a fundamental role
in the Natura 2000 network. The network covers 27% of the Spanish territory, highest areal
per country contribution across EU member countries (Europarc-España 2014), and 21% of
the Portuguese territory (ICNF 2013). Despite the large extent of the Iberian conservation
area networks, many species are still not covered by these areas. This is especially true for
non-charismatic species groups like lichens or invertebrates which are usually
underrepresented (e.g., Martínez et al. 2006; Araújo et al. 2007; Hernández-Manrique et al.
2012).
Bird species have been the target of multiple climate change impact studies (e.g., Kujala et
al. 2013; Thuiller et al. 2014b). Being a mobile group, birds often respond to climatic
changes by shifting their distributions following climate. For example, Tellería et al. (2016)
showed that some birds in the Iberian Peninsula are already responding to climate change.
However, bird distribution shifts are reportedly lagging behind temperature shifts at the
European level (Devictor et al. 2012). There is a large body of literature showing that
beyond climatic tolerances, bird distributions and behaviour also depend on a variety of

5
factors related to life-history traits, availability of food, habitat and human disturbances, and
the relative role of each of these factors can vary at different spatial and temporal scales
(e.g., Triviño et al. 2013; Howard et al. 2015). For example, within the Iberian Peninsula,
Triviño et al. (2011) showed that, at the spatial scale of 10 x 10 km, models for bird species
fitted with climate data were always improved compared with models fitted with vegetation
or landscape configuration variables. They also found that a large fraction of bird species
would be highly exposed to future environmental changes: under A2 emission scenario 62%
of the species were projected to contract their current distribution, while 38% were
projected to experience range expansions. However, bird species projected to be highly
exposed to future environmental changes in Iberia are, at the same time, less susceptible to
local extinctions because they possess traits that increase their natural resilience (Triviño et
al. 2013). An important question that remains to be answered is whether the current Iberian
conservation area networks are adequate to conserve bird species under climate and land-
use changes and, if not, where future conservation priorities should be.
There are two main strategies to incorporate concern for climate change within spatial
conservation prioritization (Araújo 2009). Firstly, model species range dynamics and
combine the outputs of the models with optimal conservation planning methodologies that
seek to maximize species coverage within conservation areas (for a review see Alagador et
al. 2016). Secondly, focus on geodiversity and climate change metrics as coarse filter
strategy for the identification of climate resilient areas without recurring to complex
modelling of individual species responses to climate change (e.g., Beier et al. 2015; Garcia
et al. 2016). However, any of these approaches generally lacks consideration of the need of
exploring trade-offs between climate change and land-use changes (but see Fordham et al.
2013). Here, we develop an approach whereby spatial conservation priorities are identified
by accounting for projections of individual species distributional shifts under climate
change while addressing threats and opportunities brought by projected land-use changes.

6
We exemplify the approach using birds as focal taxa and the Iberian conservation area
networks as the context in which the conservation planning approach is developed. As first
step we identify optimal conservation areas that maximise representation of both current
and projected future distributions of terrestrial bird species within the Iberian Peninsula.
Following, we ask: (1) what proportion of the identified priority areas are already protected
under existing legislation; (2) what proportion of the identified priority areas is more and
less threatened by projected agricultural or urban land-use changes. With such analyses we
were able to identify the areas suitable for bird conservation under climate change and that
were neither protected nor threatened by current or future land-use change.
Methods
Species and climate data
Assessments were undertaken using baseline and future projected distributions of 168
terrestrial native breeding birds in the Iberian Peninsula. Details of the models are provided
in a previous study (Triviño et al. 2011). Our analyses of bird distributions excluded species
with less than 20 records to avoid problems of modelling species with small sample size
(Stockwell and Peterson 2002). The distributions are based on presence-absence data
extracted from the breeding birds atlases of Spain (Martí and del Moral 2003) and Portugal
(Equipa Atlas 2008), across 5,923 10x10 km resolution grid cells. Baseline and projected
future distributions were modelled using climatic variables (see below) and two modelling
techniques: Random Forests and Boosted Regression Trees. The maximum number of trees
was 700 for Random Forests and 3000 for Boosted Regression Trees. All models were run
using default options of the BIOMOD package (Thuiller et al. 2009). For each time period
the average across the two models was used as the final output since evidence exists that
averaging across model outputs can cancel outliers and improve overall projections (Araújo
et al. 2005).

7
Baseline (period 1971-1990) and future climatic data (period 2051-2080) included three
variables: mean winter temperature (ºC), annual precipitation (mm) and accumulated degree
days (January to August). The baseline climatic data were obtained from the Portuguese and
Spanish meteorological agencies (IM and AEMET, respectively), interpolated to a UTM
10×10 km grid (Araújo et al., 2012). Future climate scenarios from the EU framework
program Assessing Large-scale environmental Risks for biodiversity with tested Methods
(ALARM) were used. The chosen climate scenario was derived from a simulation with the
global climate model HadCM3, using the BAMBU (Business As Might Be Usual) scenario
(which corresponds to A2 SRES) of the ALARM project (see Triviño et al. 2011 for further
details).
We subdivided the 168 breeding bird species into two groups: ‘agricultural’ and ‘non-
agricultural’ species. The information was gathered from a Spanish Ornithological Society
document (SEO/BirdLife, 2010) and complemented it by consultation with experts (see
Appendix S4). In our study, there were 47 species associated with agricultural areas,
representing 28% of the modelled species. Agricultural areas are more predominant in
Natura 2000 sites than in national protected areas (croplands and permanent croplands
represent 15% of the national protected areas whereas they represent almost 24% in Natura
2000, see Table 2).
Conservation areas data
We used two conservation areas datasets: the nationally-designated protected areas network
and the European Union-designated Natura 2000 network (ICNF 2013; MAGRAMA 2013).
We excluded areas that were solely designated by international conventions like UNESCO
World Heritage sites (UNESCO Man and Biosphere reserves and Ramsar Wetlands of
International Importance), because most international conventions have no regulatory

8
power to enforce protection (Jenkins and Joppa 2010). Auxiliary analyses with the excluded
areas are provided in the supplementary material (Appendix S1).
Land-use data
The projected land-use change scenarios were based on the Coordination of Information on
the Environment (CORINE Land Cover 2000; EEA, 2000). CORINE 2000 dataset was used
as a baseline for the downscaling of the future scenarios (2080) at a spatial resolution of 250
meters (see Rounsevell et al. 2006 and Dendoncker et al. 2007 for methodological details).
The forty-four land cover classes from CORINE were aggregated into six classes: urban,
cropland, permanent crops, grasslands, forest and others (for a complete description of the
methodology see Dendoncker et al. 2007, despite in this reference they use the PELCOM
dataset, CORINE 2000 dataset was used for this study). We further aggregated those six
land-use categories into three coarse types (natural, agricultural and urban) that can
reasonably be used as surrogates for threat because the association between land-use
intensification and declines in bird populations has been well documented (e.g., Verhulst et
al. 2004). We define ‘natural’ lands as those classified as natural vegetation (e.g., grasslands
and forests) as well as others categories (e.g., bare rocks and burnt areas). We define
‘agricultural’ lands as those classified as croplands and permanent croplands. To have a
better understanding of the composition of the two agricultural land-use types we calculated
the percentage of surface covered by the land-use categories of CORINE Land Cover 2000
(see Appendix S2). Finally, we define ‘urban’ lands as those as built-up land cover
categories.
Conservation prioritization
We identified areas of high bird conservation priority using the spatial prioritization
software Zonation (Moilanen et al. 2012 and references therein) and accounting for: (i) the
baseline and potential future distributions of all 168 bird species; and (ii) the connectivity

9
between species’ baseline and projected future distributions to facilitate the anticipated
species range shifts under changing climatic conditions similarly to Kujala and colleagues
(2013). Zonation is a conservation support tool that identifies areas that maximize the
representation and habitat quality for multiple species across large regions. It produces a
hierarchical ranking of sites across the entire study area, where increasing rank values
indicate increasing priority for conservation and a relatively small proportion of the top-
ranked sites typically represent most or all biodiversity features and their core habitats (Fig.
1). We used the core area zonation (CAZ) algorithm to determine the conservation value in
each cell. All species were weighted equally and we did not include cost of land to the
analyses. We note that here the term ‘core’ refers to areas of highest value or, as in this
study, areas of highest climatic suitability, within each species distribution, without
reflecting any geographical positioning.
To account for connectivity between baseline and projected future distributions, we used the
‘species interactions’ technique of Zonation, which allows calculation of connectivity
between two distributions (Moilanen and Kujala 2008). This technique is based on the
metapopulation connectivity measure, in which connectivity of any given focal site is
dependent on its distance to other sites, the local value of both focal and other sites, and the
dispersal ability of the respective species (Hanski 1998; Moilanen and Nieminen 2002).
Based on information on observed bird range shifts in the last decades (Brommer and
Møller 2010), we set the dispersal distance of all species to 11 km/decade, corresponding to
a dispersal distance of 77.3 km for the time period considered in our study. We carried out a
sensitivity analysis using different dispersal rates to analyse how dispersal affects the results
(Appendix S3).

10
Fig. 1 Flow chart showing the five spatial conservation prioritization carried out. Modelled
species distribution maps for baseline and future were created using the modelling techniques
Random Forests and Boosted Regression Trees. Connectivity maps were created based on the
baseline and future layers. The rest of the analyses and graphs are based on the top 17% priorities of
each Zonation result.
We used two spatial connectivity measures per species to identify priority areas that
facilitate dispersal to projected future distribution areas. The first connectivity was
calculated from the baseline period to the future period, whereby highest values were given
to areas within baseline distribution that are climatically most suitable for the species and
geographically close to the expected future distribution given species dispersal limitations.
Under climate change, these areas are expected to act as sources from where dispersal to
future distributions takes place (hereafter called ‘source areas’). For the second measure,
connectivity was similarly calculated from future to baseline, and highest values were given
to those highly suitable future areas that are well connected to baseline areas and, thus, are

11
expected to help species reach the core areas of their future distribution (hereafter called
‘stepping stones’).
Hence, for each species, there were four types of distributions relevant for the conservation
prioritization: the modelled baseline distribution, hereafter called ‘baseline cores’ (BC), the
modelled future distribution, hereafter called ‘future cores’ (FC), source areas (S) and
stepping stones (SS). Using Zonation we produced conservation prioritizations for the
Iberian Peninsula across all species by: (i) separately accounting for each of the relevant
distributions per species (hence, four different solutions); and (ii) simultaneously
accounting for all four relevant distributions per species (one solution, hereafter called ‘All
together’, Alt). We assigned to each top priority cell within the ‘All together’ a value from
the previous categories (BC, FC, S or SS) depending on which had the highest average
value across the species. From each of these five prioritization results we selected the
highest 17% ranking areas, corresponding to the Nagoya meeting goal of protecting 17% of
terrestrial ecosystems by 2020 (Convention Biological Diversity 2010). See Fig. 1 for an
illustrative diagram of the prioritization procedure.
Overlap between conservation priorities and conservation area networks
We measure the extent to which the identified bird conservation priorities are protected. We
analysed how well the conservation area networks represented the important areas for birds
by overlapping each conservation network with the identified conservation priority areas.
We calculated three types of measure: (i) the percentage of priority cells that overlap with
protected areas or Natura 2000 sites, (ii) the percentage of cells that overlap more than 50%
and (iii) the mean percentage of overlap area.
We reanalysed the level of protection separately for the two groups of species: ‘agricultural’
and ‘non-agricultural’. We repeated both the spatial prioritization and the percentage of
overlap analyses.

12
Land-use threats and potential for conservation
We used three broad land-use types (natural, agricultural and urban) as a surrogate to the
threats for bird species posed by habitat loss. We considered natural as no threat and the two
other land-use types as threat.
To determine the spatial distribution of land-use change we calculated the difference
between the baseline and future projection in the proportion of area covered by natural,
agricultural and urban areas within each one of the following categories: (i) protected (PAs
and Natura 2000), (ii) non-protected (which refers to all areas outside PAs and Natura 2000
sites) and (iii) identified priority areas (All together, Baseline Cores and Future Cores).
Finally, we identified areas with potential for conservation which are identified as priorities
for bird species conservation under climate change but are neither protected nor projected to
be threatened by agricultural or urban land-use change.
Results
Conservation priorities for Iberian bird species
Models projections showed that bird species generally shift ranges towards mountainous
regions (most future cores are located in the Pyrenees) (Fig. 2). There was high spatial
congruence between conservation priorities identified for ‘all species’ (N = 168) and ‘non-
agricultural species’ (N = 121), although ‘stepping stones’ were notably lacking for the
prioritization undertaken with ‘non-agricultural species’. The spatial distribution of the
conservation priorities for ‘agricultural species’ (N = 47) was more aggregated and compact
across cropland areas (Fig. 2). Sensitivity analyses of how different dispersal rates affected
conservation priorities showed that connectivity was only important for species with
intermediate dispersal rates (50-77.3 km, estimates for the time period considered in our
study). Lower dispersal rates meant that species were unable to track climatic changes,

13
whereas species with higher dispersal rates did not require corridors or stepping-stones to
disperse to future areas of suitable climate (see Appendix S3).
Fig. 2 Top conservation priority areas for Iberian bird species. These include baseline and future
modelled distributions under climate change and the respective connectivity measures for the
estimated mean dispersal distance of 77.3 km. Colours represent the classification of the top 17%
priorities into their relative importance as baseline cores, future cores, sources and stepping stones.
Overlap between conservation priority areas and conservation area networks
The extent to which existing conservation networks covered key priority areas for Iberian
birds under climate change depended on the species pool considered. Across all species,
Natura 2000 sites covered the bird conservation priorities better (23% of mean overlap) than
PAs (19%). However, when agricultural and non-agricultural species groups were analysed
separately, Natura 2000 sites covered priorities of agricultural species better (28%) than

14
those of the non-agricultural group (14%). In contrast, the PAs covered better the priorities
for non-agricultural species (19%) than for agricultural species (12%) (Table 1).
Table 1. Overlap between conservation priority areas and conservation area networks.
Three measures of overlap (proportion of cells with any overlap; proportion of cells with >50%
overlap, and the mean percentage of overlap) between identified conservation priority areas and the
two conservation area networks: nationally-designated protected areas (PAs) and Natura 2000
(Natura). Overlaps are shown for three of the prioritization results (Alt = All together; BC = baseline
distributions only; FC = future distributions only) and for all species and subsets of agricultural and
non-agricultural species.
All species Agricultural species Non-agricultural species
%
cells
% cells
> 50%
Mean %
overlap
%
cells
% cells
> 50%
Mean %
overlap
%
cells
% cells >
50%
Mean %
overlap
Alt 48.0% 18.0% 18.8% 33.9% 11.0% 11.9% 47.2% 18.0% 18.8%
PAs BC 49.0% 18.6% 19.4% 34.6% 10.9% 11.7% 50.7% 19.3% 20.3%
FC 41.0% 14.6% 15.3% 34.0% 14.0% 14.2% 41.1% 14.6% 15.3%
Alt 51.6% 22.2% 22.9% 77.3% 24.8% 27.9% 27.4% 14.0% 14.1%
Natura BC 83.7% 37.3% 39.2% 77.4% 24.8% 27.9% 84.5% 38.6% 40.1%
FC 75.3% 27.8% 29.8% 77.7% 29.4% 31.3% 75.4% 28.1% 30.0%
If we separate the overlap of the two networks, based on the baseline and the future
potential distributions, current conservation networks had a higher overlap with baseline
cores than with future cores (Fig. 3). Under climate change the expected decrease in the
protection of core areas for all and non-agricultural species was higher for the Natura 2000
(9.4% and 10.1% respectively) than for the nationally-designated protected area network
(4.1% and 5.0% respectively) (Table 1). However, agricultural species were projected to
gain protection under climate change both in Natura 2000 (3.4%) and in the nationally-
designated protected area network (2.5%) (Table 1).

15
Fig. 3 Overlap between top conservation priority areas and conservation area networks. The
maps show the overlap between identified priority areas for all species in the baseline (Baseline
cores) and future (Future cores) time period and the two conservation area networks: Protected Areas
(PAs) and Natura 2000 (Natura).
Land-use threats and potential for conservation
Using the three land-use categories (‘natural’, ‘agricultural’ and ‘urban’) to calculate the
spatial distribution of threats, i.e., considering everything not natural as a threat, we found
that half of the non-protected area, and approximately 40% of the identified conservation
priority areas were currently threatened by land-use practices. Within the conservation
networks, the majority of the land is in natural state (76% within Natura 2000 sites and 84%
within PAs), but notably almost one-quarter of the Natura 2000 network is dominated by
agricultural and urban zones. While agricultural lands currently overlap most extensively
with conservation areas, their extent is expected to decrease in the future (Table 2). Urban
areas constitute only a small fraction of current and future threats, but their role is

16
nevertheless expected to increase by the year 2080. Natural forests and grasslands currently
cover over 50% of all analysed areas and their proportion is expected to further increase in
the future. Overall, in all land types (‘protected’, ‘non-protected’, ‘priority areas’) natural
areas are expected to increase whereas agricultural and urban areas are expected to decrease
and remain relatively stable, respectively, by 2080. This change coincides to some degree
with species estimated range shifts, as the future cores are expected to experience the
steepest increase in natural lands (5.1%) and highest decrease in ‘agricultural’ areas (5.2%)
in comparison to the current state of these locations. Despite these favourable
developments, one-third of all identified priority areas are projected to be threatened by
land use in the future (Table 2).
Table 2. Spatial distribution of land-use change.
Natural area is represented by Grasslands, Forests and Others land-use categories; Agricultural area
is represented by Croplands and Permanent Croplands land-use categories and Urban areas is
represented by Urban land-use category. Non-protected refers to all areas outside Protected Areas
(PAs) and Natura 2000 sites.
% Natural area % Agricultural area % Urban area
Zone Area (km2) 2080 Change
2000-2080
2080 Change
2000-2080
2080 Change
2000-2080
PAs 65,771 86.45% 2.02 12.89% -2.20 0.66% 0.22
Natura 2000 155,805 78.73% 2.66 20.89% -2.73 0.39% 0.08
Non-protected 497,302 55.26% 4.74 42.69% -5.00 2.05% 0.26
Conservation priorities
All together 102,800 64.18% 3.01 34.66% -2.99 1.17% -0.01
Baseline Cores 102,800 64.49% 3.30 33.96% -3.20 1.55% 0.10
Future Cores 102,800 66.28% 5.14 32.40% -5.16 1.31% 0.01
When estimating the level of protection and land-use threats for conservation we found only
small differences between the five types of identified conservation priorities. Among all
priority areas, the percentage of protection was lower than 20% and the level of threat posed
by current land-use practices was close to 40%. Over 50% of all identified priority areas

17
were not protected and currently not threatened by land-uses, future cores having the
greatest potential for conservation (55.5%) (Table 3). These areas were mainly located in
mountainous regions like the southern part of the Pyrenees or the Cantabrian as well as in
the southwest of the Iberian Peninsula (Fig. 4).
Table 3. Reclassification of conservation priority areas to show potential for conservation.
‘Protected’: mean average overlap between the priority areas and the nationally-designated protected
area network; ‘Threatened’: percentage of cells of each one of the priority areas that overlap with
agricultural and urban areas from baseline time period; ‘Potential for conservation’: percentage of
cells that are neither protected nor threatened at the baseline time period. Note that numbers in each
row do not necessarily sum up to 100% as the percentage of protected was calculated as the mean
average overlap whereas the percentage of threatened was calculated as the percentage of cells that
overlap with agricultural and urban areas.
Protected Threatened Potential for conservation
Alt 18.8% 38.8% 54.1%
BC 19.4% 38.6% 54.3%
FC 15.3% 38.9% 55.5%
S 18.1% 40.0% 53.2%
SS 17.9% 40.0% 53.1%

18
Fig. 4 Reclassification of top conservation priority areas to show potential for conservation.
The maps show the top conservation priority areas for Iberian bird species reclassified into three
categories: ‘Protected’: priority areas that overlap with the nationally-designated protected area
network; ‘Threatened’: priority areas that overlap with baseline agricultural and urban areas;
‘Potential for conservation’: priority areas that are neither protected nor threatened at the baseline
period. The five panels represent the five different conservation prioritization options.

19
Discussion
We present an approach to identify priorities for climate change adaptation and explore
threats and opportunities posed by land-use changes. Our results highlight a spatial
mismatch between the established Iberian conservation area networks and the identified
priority areas for birds under climate change. We also found that there are several
opportunities to improve the protection of bird species under climate change, as half of the
identified conservation priority areas are currently not protected and do not conflict with
urban or agricultural land-uses. Finally, land-use pressures are predicted to decrease in both
conservation area networks towards the end of the century potentially creating opportunities
to alleviate some of the negative impacts of climate change. Climate change, on the other
hand, will increase the spatial mismatches between established protected areas and the
newly identified priorities, particularly for non-agricultural bird species.
Are conservation priority areas for birds well represented within Iberian conservation
area networks?
Previous studies have shown that Iberian bird species are currently reasonable well
represented within the conservation area networks (Carrascal and Lobo 2003; Araújo et al.
2007). However, when taking into account the needs of birds under climate change we
found that existing conservation networks were insufficient to account for both current and
future potential distributions of these species. Our study highlights that only 19% of the
conservation priority areas, which cover the core climatic conditions of species’ current and
future potential distributions as well as the connectivity between them, are protected. We
also found that the overlap of Natura 2000 sites with both baseline and future conservation
priority areas was higher than for the nationally-designated protected areas. This difference
in coverage can be partly attributed to the larger extent of the Natura 2000 network which is
more than double the size of the nationally-designated protected area network. Another
20
explanation is that Natura 2000 specifically targets bird conservation, as Natura 2000 sites
include Special Protection Areas (SPAs), designated under the Birds Directive (Assunção-
Albuquerque et al. 2012; Regos et al. 2016). On the other hand, the level of protection of
Natura 2000 sites is usually lower than that of protected areas as a wide range of human
activities are allowed within the network. Furthermore, as more flatlands are generally
included in Natura 2000 sites than in protected areas (Araújo et al. 2011), species inhabiting
Natura 2000 network sites are expected to be more vulnerable as proportional range losses
under climate change are greater there (Peterson 2003).
Does the effectiveness of Iberian conservation networks decrease under climate change?
Since conservation networks are generally designed to isolate current species distributions
from existing external threats, it comes with no surprise that they would represent baseline
priority areas better than future ones. This finding is in line with earlier studies that showed
that current protected areas would generally not retain suitable climatic conditions for many
of the species for which they were originally designated under scenarios of climate change
(Araújo et al. 2004; Huntley et al. 2008; Hole et al. 2009; Lung et al. 2014; Garden et al.
2015). Within Iberia the same pattern holds true: future bird priority areas display a small
level of overlay with existing conservation networks owing to projected shifts in the
distributions of Iberian birds as a result of climatic, land-use, vegetation and fire regimes
changes (Triviño et al. 2011; Araújo et al. 2012; Regos et al. 2016). When examining
patterns for species with specific habitat requirements, we found that forest bird species are
expected to be less vulnerable to climate change because models project increases in forest
cover, hence there will be more opportunities for colonisation (Araújo et al. 2008) and
because forests could serve as a possible buffer to the impacts of climate change (Jarzyna et
al. 2016). Species favouring agricultural lands were expected to be able to track climatic
changes, but land-use projections indicate a decrease of agricultural area in the future.
Therefore, while agricultural species seems to have great ability to colonise new areas as

21
they become suitable they will also require active management of the countryside if suitable
habitat is to be maintained for them.
Threats posed by land-use pressures
Our results show that a substantial percentage of conservation priority areas are threatened
by land-use pressures both currently (~40%) and in the future (~30%). Urban areas are
expected to expand in the future whereas agricultural areas are expected to decrease, which
is in line with previous studies (Araújo et al. 2008; Underwood et al. 2009). At the same
time, natural areas are expected to expand, following an increase in forest cover. Indeed, the
Iberian Peninsula is already experiencing large scale forest regeneration due to
abandonment of agricultural areas and this trend is expected to continue (Rey Benayas et al.
2007; Gil-Tena et al. 2009; Álvarez-Martínez et al. 2011). Such changes are likely to favour
expansion of forest bird species, especially forest specialists, but not species associated with
traditional agricultural systems (Gil-Tena et al. 2007). In this study we assumed all
agricultural practices, as identified by CORINE land cover data (Table S4 in Appendix S2),
to be threats to the studied bird species. We acknowledge that not all agricultural species
will be impacted by these practices in the same way: a more realistic approach would
differentiate between traditional and intense agricultural practices. However, in order to
capture the differences between traditional agricultural practices (beneficial for
conservation) and intense agricultural practices a more detailed data on land-use categories
would be needed. In addition, in the Mediterranean region of the Iberian Peninsula fire
plays a key role in the maintenance of bird diversity by enhancement of open habitats and
landscape heterogeneity (e.g., Vallecillo et al. 2008; Regos et al. 2016). We acknowledge
that there are other threats affecting Iberian birds besides climate and land-use changes such
as roads (Torres et al. 2011), poison or human disturbance of nest sites among others
(Madroño et al. 2004). However, these threats are beyond the scope of our study and not
manageable at this spatial resolution.

22
Potential for conservation for Iberian bird species under climate change
The fact that climate change may increase the spatial mismatch between already established
protected areas and conservation priority areas urgently calls for adaptive conservation
measures. A common strategy to reduce the negative impacts of climate change on
biodiversity will certainly include the establishment of new protected areas to increase the
available habitat for species and ensure the existence of suitable pathways for species
dispersal (Heller and Zavaleta 2009; Mawdsley et al. 2009). The large proportion of natural
or semi-natural land within projected important areas for bird conservation that is still not
protected could be viewed as a conservation opportunity. It would probably be cost-efficient
to implement conservation actions on the areas that we identified being of high value for
bird conservation and low conflict with other land-uses. On the other hand, land sharing
(Fischer et al. 2014) could be a good strategy for areas with high conservation value but in
high conflict with other land-uses. Studies, like this one, that combine forecasts of species
range shifts under climate change with spatial conservation planning tools are needed to
respond proactively to the new conservation challenges (Williams et al. 2005; Phillips et al.
2008; Carroll et al. 2010). However, given the many sources of uncertainty and the
complexities, dialogs and compromises encountered in conservation decision making, we
acknowledge that solutions proposed need to be flexible enough, yet highlight important
conservation needs that can easily be accounted for. Finally, we acknowledge that our
approach is centered on a climate adaptation strategy which promotes the conservation of
species. However, there are other approaches for adapting conservation to climate change
that are also worth considering such as identifying spaces of climatic resilience, without the
need of projecting species specific responses (e.g., Beier et al. 2015).

23
Acknowledgments
M.T. thanks Wilfried Thuiller, the participants of the Ibiochange Lab Retreat, the jury of her PhD
defense and people from the Journal Club in Jyväskylä for insightful comments and suggestions.
M.T. also thanks the Metapopulation Research Centre at the University of Helsinki for providing the
supportive environment in which much of this work was developed. We thank two anonymous
reviewers and the associated editor for their helpful comments. M.T. is supported by a FPI-MICINN
fellowship and KONE foundation; H.K. by the LUOVA Doctoral Programme and the Australian
National Environmental Research Program (NERP); M.C. by the Academy of Finland (grant
#257686).
References
Alagador D, Cerdeira JO, Araújo MB (2014) Shifting protected areas: scheduling spatial
priorities under climate change. J Appl Ecol 51:703–713.
Alagador D, Cerdeira JO, Araújo MB (2016) Climate change, species range shifts and dispersal
corridors: an evaluation of spatial conservation models. Methods Ecol Evol 7:853–866.
Álvarez-Martínez JM, Suárez-Seoane S, De Luis Calabuig E (2011) Modelling the risk of land
cover change from environmental and socio-economic drivers in heterogeneous and
changing landscapes: The role of uncertainty. Landsc Urban Plan 101:108–119.
Araújo MB, Nogués-Bravo D, Reginster I, et al (2008) Exposure of European biodiversity to
changes in human-induced pressures. Environ Sci Policy 11:38–45.
Araújo, M.B. 2009 Climate Change and Spatial Conservation Planning. In Spatial Conservation
Prioritization: quantitative methods and computational tools (eds. A. Moilanen, H.
Possingham & K. Wilson), pp. 172-184. Oxford, Oxford University Press.
Araújo MB, Alagador D, Cabeza M, et al (2011) Climate change threatens European
conservation areas. Ecol Lett 14:484–492.
Araújo MB, Cabeza M, Thuiller W, et al (2004) Would climate change drive species out of
reserves? An assessment of existing reserve-selection methods. Glob Chang Biol 10:1618–
1626.
Araújo MB, Guilhaumon F, Neto DR, et al (2012) Biodiversidade e Alterações Climáticas
/Biodiversidad y Alteraciones Climáticas. Ministério do Ambiente e Ordenamento do
Território & Ministerio de Medio Ambiente y Medio Rural y Marino, Lisboa /Madrid

24
Araújo MB, Lobo JM, Moreno JC (2007) The effectiveness of Iberian protected areas in
conserving terrestrial biodiversity. Conserv Biol 21:1423–1432.
Araújo MB, Whittaker RJ, Ladle RJ, Erhard M (2005) Reducing uncertainty in projections of
extinction risk from climate change. Glob Ecol Biogeogr 14:529–538.
Assunção-Albuquerque MJT, Rey Benayas JM, Albuquerque FS, Rodríguez MÁ (2012) The
geography of high-value biodiversity areas for terrestrial vertebrates in Western Europe
and their coverage by protected area networks. Web Ecol 12:65–73.
Badeck F-W, Bondeau A, Böttcher K, et al (2004) Responses of spring phenology to climate
change. New Phytol 162:295–309.
Baselga A, Araújo MB (2010) Do community-level models describe community variation
effectively? J Biogeogr 37:1842–1850.
Beier P, Hunter ML, Anderson M (2015) Introduction to Special Section: Conserving Nature’s
Stage. Conserv Biol 29:613–617.
Brommer JE, Møller AP (2010) Range margins, climate change, and ecology. In: Møller AP,
Fieldler W, Berthlod P (eds) Effects of Climate Change on Birds. Oxford University Press,
Carrascal LM, Lobo JM (2003) Respuestas a viejas preguntas con nuevos datos: estudio de los
patrones de distribución de la avifauna española y consecuencias para su conservación. In:
Ministerio de Medio Ambiente – SEO/BirdLife M (ed) Atlas de las aves reproductoras de
España (ed. by R. Martí and J.C. Del Moral),. pp 651–668, 718–721
Carroll C, Dunk JR, Moilanen A (2010) Optimizing resiliency of reserve networks to climate
change: multispecies conservation planning in the Pacific Northwest, USA. Glob Chang
Biol 16:891–904.
Civantos E, Thuiller W, Maiorano L, et al (2012) Potential impacts of climate change on
ecosystem services in Europe: the case of pest control by vertebrates. Bioscience 62:658–
666.
Convention Biological Diversity (2010) Aichi biodiversity targets of the strategic plan 2011–
2020. http://www.cbd.int/sp/targets/.
Davis MB, Shaw RG (2001) Range shifts and adaptive responses to Quaternary climate change.
Science 292:673–679.
Dendoncker N, Rounsevell M, Bogaert P (2007) Spatial analysis and modelling of land use
distributions in Belgium. Comput Environ Urban Syst 31:188–205.
Devictor V, van Swaay C, Brereton T, et al (2012) Differences in the climatic debts of birds and
butterflies at a continental scale. Nat Clim Chang 2:121–124.
25
Eklund J, Arponen A, Visconti P, Cabeza M (2011) Governance factors in the identification of
global conservation priorities for mammals. Philos Trans R Soc B Biol Sci 366:2661–
2669.
Equipa Atlas (2008) Atlas das aves nidificantes em Portugal (1999-2005). Assírio & Alvim,
Lisboa.
Europarc-España (2014) EUROPARC-España Anuario 2013 del estado de las áreas protegidas
en España.
European Environmental Agency (2000) CORINE Land Cover. European Environmental
Agency, Luxembourg.
Fischer J, Abson DJ, Butsic V, et al (2014) Land Sparing Versus Land Sharing: Moving
Forward. Conserv Lett 7:149–157.
Fordham DA, Akçakaya HR, Brook BW, et al (2013) Adapted conservation measures are
required to save the Iberian lynx in a changing climate. Nat Clim Chang 3:899–903.
Forero-Medina G, Terborgh J, Socolar SJ, Pimm SL (2011) Elevational ranges of birds on a
tropical montane gradient lag behind warming temperatures. PLoS One 6:e28535.
Garcia RA, Cabeza M, Altwegg R, Araújo MB (2016) Do projections from bioclimatic
envelope models and climate change metrics match? Glob Ecol Biogeogr 25:65–74.
Garden JG, O’Donnell T, Catterall CP (2015) Changing habitat areas and static reserves:
challenges to species protection under climate change. Landsc Ecol 30:1959–1973.
Gil-Tena A, Brotons L, Saura S (2009) Mediterranean forest dynamics and forest bird
distribution changes in the late 20th century. Glob Chang Biol 15:474–485.
Gil-Tena A, Saura S, Brotons L (2007) Effects of forest composition and structure on bird
species richness in a Mediterranean context: Implications for forest ecosystem
management. For Ecol Manage 242:470–476.
Hannah L, Midgley G, Andelman S, et al (2007) Protected area needs in a changing climate.
Front Ecol Environ 5:131–138.
Hanski I (1998) Metapopulation dynamics. Nature 396:41–49.
Heller NE, Zavaleta ES (2009) Biodiversity management in the face of climate change: A
review of 22 years of recommendations. Biol Conserv 142:14–32.
Hernández-Manrique OL, Numa C, Verdú JR, et al (2012) Current protected sites do not allow
the representation of endangered invertebrates: the Spanish case. Insect Conserv Divers
5:414–421.

26
Hewitt G (2000) The genetic legacy of the Quaternary ice ages. Nature 405:907–913.
Hole DG, Willis SG, Pain DJ, et al (2009) Projected impacts of climate change on a continent-
wide protected area network. Ecol Lett 12:420–431.
Howard C, Stephens PA, Pearce-Higgins JW, et al (2015) The drivers of avian abundance:
patterns in the relative importance of climate and land use. Glob Ecol Biogeogr 24:1249–
1260.
Huntley B, Collingham YC, Willis SG, Green RE (2008) Potential impacts of climatic change
on European breeding birds. PLoS One 3:e1439.
ICNF (2013) Instituto da Conservação da Natureza e das Florestas
(<http://www.icnf.pt/portal/naturaclas/rn2000/rn-pt/rn-PT> accesed 10/08/2015).
IPCC (2014) Climate Change 2014: Impacts, Adaptation, and Vulnerability. Part A: Global and
Sectoral Aspects. Contribution of Working Group II to the Fifth Assessment Report of the
Intergovernmental Panel on Climate Change. Cambridge University Press, Cambridge and
New York, 1132 pp.
Jarzyna MA, Zuckerberg B, Finley AO, Porter WF (2016) Synergistic effects of climate and
land cover: grassland birds are more vulnerable to climate change. Landsc Ecol 1–16.
Jenkins CN, Joppa L (2010) Considering protected area category in conservation analyses. Biol
Conserv 143:7–8.
Kujala H, Moilanen A, Araújo MB, Cabeza M (2013) Conservation planning with uncertain
climate change projections. PLoS One 8:e53315.
Lung T, Meller L, van Teeffelen AJA, et al (2014) Biodiversity funds and conservation needs in
the EU under climate change. Conserv Lett 7:390–400.
Madroño A, González C, Atienza JC (2004) Libro rojo de las aves de España. Dirección
General para la Biodiversidad -SEO/Birdlife, Madrid.
MAGRAMA (2013) Ministerio de Agricultura, Alimentación y Medio Ambiente (<
http://www.magrama.gob.es/es/biodiversidad/servicios/banco-datos-
naturaleza/informacion-disponible/cartografia_informacion_disp.aspx>).
Martínez I, Carreño F, Escudero A, Rubio A (2006) Are threatened lichen species well-
protected in Spain? Effectiveness of a protected areas network. Biol Conserv 133:500–
511.
Martí R, del Moral JC (2003) Atlas de las aves reproductoras de España. Madrid: Dirección
General de Conservación de la Naturaleza & Sociedad Española de Ornitología.

27
Mawdsley JR, O’Malley R, Ojima DS (2009) A review of climate-change adaptation strategies
for wildlife management and biodiversity conservation. Conserv Biol 23:1080–1089.
Moilanen A, Kujala H (2008) Zonation spatial conservation planning framework and software
v. 2.0.
Moilanen A, Meller L, Leppänen J, et al (2012) Zonation – Spatial conservation planning
framework and software. Version 3.1. User manual. 285 p. Accesible at:
http://www.helsinki.fi/bioscience/consplan/software/Zonation/index.html, Helsinki,
Finland
Moilanen A, Nieminen M (2002) Simple connectivity measures in spatial ecology. Ecology
83:1131–1145.
Myers N, Mittermeier RA, Mittermeier CG, et al (2000) Biodiversity hotspots for conservation
priorities. Nature 403:853–858.
Peterson AT (2003) Projected climate change effects on Rocky Mountain and Great Plains
birds: generalities of biodiversity consequences. Glob Chang Biol 9:647–655.
Phillips SJ, Williams P, Midgley G, Archer A (2008) Optimizing dispersal corridors for the
Cape Proteaceae using network flow. Ecol Appl 18:1200–1211.
Regos A, D’Amen M, Titeux N, et al (2016) Predicting the future effectiveness of protected
areas for bird conservation in Mediterranean ecosystems under climate change and novel
fire regime scenarios. Divers Distrib 22:83–96.
Rey Benayas JM, Martins A, Nicolau JM, Schulz JJ (2007) Abandonment of agricultural land:
an overview of drivers and consequences. Perspect Agric Vet Sci Nutr Nat Resour 2:No.
57.
Roth T, Plattner M, Amrhein V (2014) Plants, birds and butterflies: short-term responses of
species communities to climate warming vary by taxon and with altitude. PLoS One
9:e82490.
Rounsevell MDA, Reginster I, Araújo MB, et al (2006) A coherent set of future land use change
scenarios for Europe. Agric Ecosyst Environ 114:57–68.
Stockwell DRB, Peterson AT (2002) Effects of sample size on accuracy of species distribution
models. Ecol Modell 148:1–13.
Tellería JL, Fernández-López J, Fandos G (2016) Effect of climate change on Mediterranean
winter ranges of two migratory passerines. PLoS One 11:e0146958.
ter Steege H, Pitman NCA, Killeen TJ, et al (2015) Estimating the global conservation status of

28
more than 15,000 Amazonian tree species. Sci Adv 1:1:e1500936.
Thomas CD, Gillingham PK (2015) The performance of protected a reas for biodiversity under
climate change. Biol J Linn Soc 115:718–730.
Thomas CD, Gillingham PK, Bradbury RB, et al (2012) Protected areas facilitate species’ range
expansions. Proc Natl Acad Sci 109:14063–14068.
Thuiller W, Guéguen M, Georges D, et al (2014a) Are different facets of plant diversity well
protected against climate and land cover changes? A test study in the French Alps.
Ecography 37:1254–1266.
Thuiller W, Lafourcade B, Engler R, Araújo MB (2009) BIOMOD - a platform for ensemble
forecasting of species distributions. Ecography 32:369–373.
Thuiller W, Pironon S, Psomas A, et al (2014b) The European functional tree of bird life in the
face of global change. Nat Commun 5:3118.
Torres A, Palacín C, Seoane J, Alonso J (2011) Assessing the effects of a highway on a
threatened species using Before–During–After and Before–During–After-Control–Impact
designs. Biol Conserv 144:2223–2232.
Triviño M, Cabeza M, Thuiller W, et al (2013) Risk assessment for Iberian birds under global
change. Biol Conserv 168:192–200.
Triviño M, Thuiller W, Cabeza M, et al (2011) The contribution of vegetation and landscape
configuration for predicting environmental change impacts on Iberian birds. PLoS One
6:e29373.
Underwood EC, Viers JH, Klausmeyer KR, et al (2009) Threats and biodiversity in the
mediterranean biome. Divers Distrib 15:188–197.
Vallecillo S, Brotons L, Herrando S (2008) Assessing the response of open-habitat bird species
to landscape changes in Mediterranean mosaics. Biodivers Conserv 17:103–119.
Verhulst J, Báldi A, Kleijn D (2004) Relationship between land-use intensity and species
richness and abundance of birds in Hungary. Agric Ecosyst Environ 104:465–473.
Williams P, Hannah L, Andelman S, et al (2005) Planning for climate change: Identifying
minimum-dispersal corridors for the Cape proteaceae. Conserv Biol 19:1063–1074.
Williams PH, Humphries C, Araújo MB, et al (2000) Endemism and important areas for
conserving European biodiversity: a preliminary exploration of atlas data for plants and
terrestrial vertebrates. Belgian J Entomol 2:21–46.
1
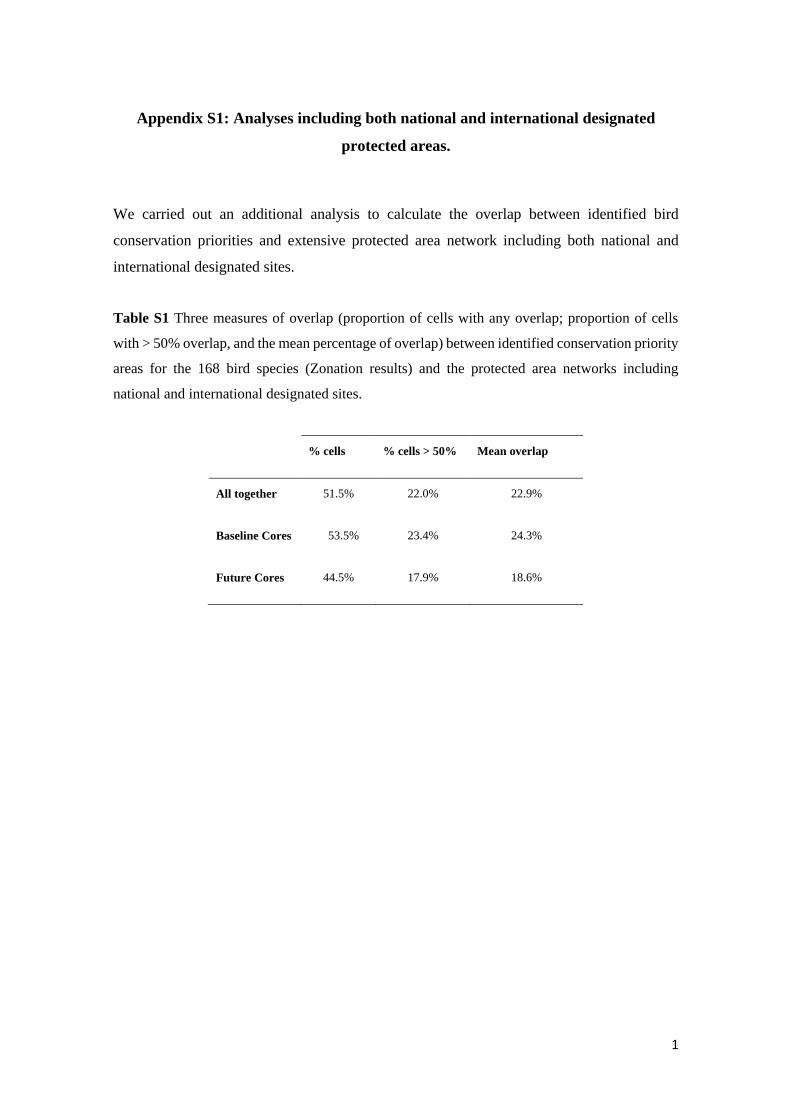
Appendix S1: Analyses including both national and international designated
protected areas.
We carried out an additional analysis to calculate the overlap between identified bird
conservation priorities and extensive protected area network including both national and
international designated sites.
Table S1 Three measures of overlap (proportion of cells with any overlap; proportion of cells
with > 50% overlap, and the mean percentage of overlap) between identified conservation priority
areas for the 168 bird species (Zonation results) and the protected area networks including
national and international designated sites.
% cells % cells > 50% Mean overlap
All together 51.5% 22.0% 22.9%
Baseline Cores 53.5% 23.4% 24.3%
Future Cores 44.5% 17.9% 18.6%
2
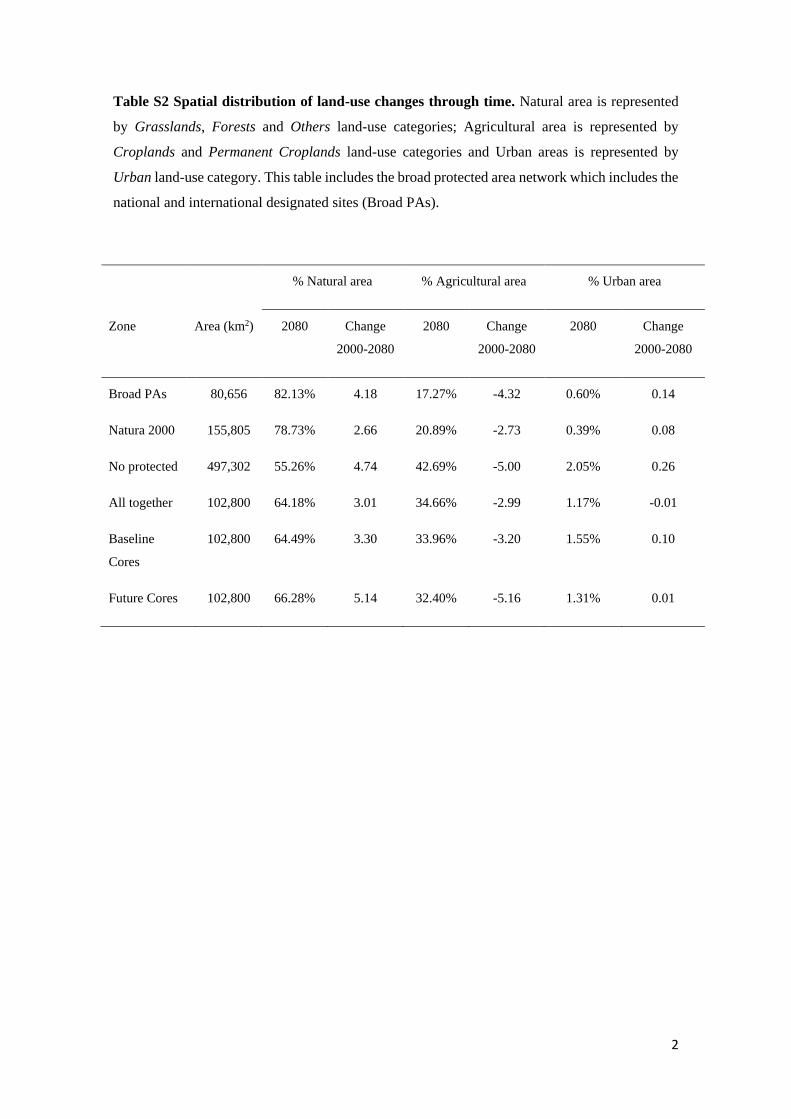
Table S2 Spatial distribution of land-use changes through time. Natural area is represented
by Grasslands, Forests and Others land-use categories; Agricultural area is represented by
Croplands and Permanent Croplands land-use categories and Urban areas is represented by
Urban land-use category. This table includes the broad protected area network which includes the
national and international designated sites (Broad PAs).
% Natural area % Agricultural area % Urban area
Zone Area (km2) 2080 Change
2000-2080
2080 Change
2000-2080
2080 Change
2000-2080
Broad PAs 80,656 82.13% 4.18 17.27% -4.32 0.60% 0.14
Natura 2000 155,805 78.73% 2.66 20.89% -2.73 0.39% 0.08
No protected 497,302 55.26% 4.74 42.69% -5.00 2.05% 0.26
All together 102,800 64.18% 3.01 34.66% -2.99 1.17% -0.01
Baseline
Cores
102,800 64.49% 3.30 33.96% -3.20 1.55% 0.10
Future Cores 102,800 66.28% 5.14 32.40% -5.16 1.31% 0.01

3
Table S3 Spatial distribution of land-use changes in conservation priority areas inside and
outside protected areas through time This table includes the identified conservation priority
areas (‘Alt’: All together; ‘BC’: Baseline Cores and ‘FC’: Future Cores) divided into two subsets:
inside and outside the broad conservation area network (including national and international
areas).
% Natural area % Agricultural area % Urban area
Zone 2080 Change
2000-2080
2080 Change
2000-2080
2080 Change 2000-
2080
Alt (Inside) 92.40% 0.81 7.38% -0.82 0.22% 0.01
Alt (Outside) 57.58% 3.47 41.03% -3.45 1.39% -0.02
BC (Inside) 91.72% 1.15 8.06% -1.14 0.22% -0.01
BC (Outside) 57.86% 3.53 40.27% -3.65 1.88% 0.13
FC (Inside) 93.42% 1.27 6.21% -1.22 0.37% -0.05
FC (Outside) 61.30% 5.83 37.22% -5.85 1.49% 0.03

4
Appendix S2: Detailed composition of agricultural land-use data
To have a better understanding of the composition of the two agricultural land-use types we
calculated the percentage of surface covered by the land-use categories of CORINE Land
Cover 2000.
Table S4: Detailed composition of the two agriculture land-use categories corresponding to the
land-use categories of CORINE Land Cover 2000.
Permanent croplands Percentage of surface
Vineyards 13.97%
Fruit trees and berry plantations 12.12%
Olive groves 27.57%
Annual crops associated with permanent crops 6.05%
Agro-forestry areas 40.29%
Croplands
Non-irrigated arable lands 60.88%
Permanently irrigated land 13.38%
Rice fields 1.03%
Complex cultivation patterns 24.71%

5
Appendix S3: Dispersal sensitivity analyses.
We tested the effect of using different dispersal rates, instead of 77.31 km, on the results of
conservation priority areas. Here we show that connectivity affects the results only at
intermediate levels of dispersal (50-80 km, see also Fig. 4 in the main text). At other dispersal
levels Sources are similar to Baseline Cores and Stepping Stones to Future Cores, essentially
indicating that at low rates of dispersal (10 and 40 km) the species are not able to move far
enough from the core areas in order to make the crossing. Similarly, at high dispersal rates
(90 km) they can cross the distance of baseline and future cores easily and connectivity
between these sites does not have much influence.
To account for connectivity between baseline and projected future distributions, we assume
an average dispersal rate of 11 km per decade for all species, which is derived from recent
observations on bird distribution shifts. However, these shifts have been the response to
milder climatic changes than expected for the end of the century.

6

7

8
Appendix S4: Breeding bird species associated with agricultural areas
List of 47 species associated with agricultural areas from the total of 168 breeding bird species
included in the study. The information was gathered from a document from SEO Bird Life
(SEO/BirdLife, 2010) and complemented by consultation with an expert: Sergio Pérez Gil.
References:
SEO/BirdLife, 2010. Estado de conservación de las aves en España en 2010. SEO/BirdLife,
Madrid.
Common name Scientific name
Skylark Alauda arvensis
Red-legged Partridge Alectoris rufa
Tawny Pipit Anthus campestris
Little Owl Athene noctua
Eurasian Thick-knee Burhinus oedicnemus
Linnet Carduelis cannabina
European Goldfinch Carduelis carduelis
White Stork Ciconia ciconia
Northern Harrier Circus cyaneus
Montagu's Harrier Circus pygargus
Zitting Cisticola Cisticola juncidis
European Roller Coracias garrulus
Jackdaw Corvus monedula
Common Quail Coturnix coturnix
Corn Bunting Emberiza calandra
Rock Bunting Emberiza cia
Cirl Bunting Emberiza cirlus
Yellowhammer Emberiza citrinella
Ortolan Bunting Emberiza hortulana

9
Lesser Kestrel Falco naumanni
Common Kestrel Falco tinnunculus
Crested Lark Galerida cristata
Thekla Lark Galerida theklae
Red-rumped Swallow Hirundo daurica
Red-backed Shrike Lanius collurio
Woodchat Shrike Lanius senator
Calandra Lark Melanocorypha calandra
European Bee-eater Merops apiaster
White Wagtail Motacilla alba
Yellow Wagtail Motacilla flava
Black-eared Wheatear Oenanthe hispanica
Great Bustard Otis tarda
Spanish Sparrow Passer hispaniolensis
Tree Sparrow Passer montanus
Rock Sparrow Petronia petronia
Magpie Pica pica
Pin-tailed Sandgrouse Pterocles alchata
Black-bellied Sandgrouse Pterocles orientalis
Whinchat Saxicola rubetra
African Stonechat Saxicola torquata
European Serin Serinus serinus
Turtle Dove Streptopelia turtur
Spotless Starling Sturnus unicolor
Starling Sturnus vulgaris
Little Bustard Tetrax tetrax
Hoopoe Upupa epops
Northern Lapwing Vanellus vanellus


![box.] Identifying Priority Populations](https://static.fdocuments.in/doc/165x107/626ed434ed7e806a9d0d1da3/box-identifying-priority-populations.jpg)