Planning for Retirement: Are Canadians Saving Enough?actuaries.ca/members/publications/2007/FINAL...
13
Planning for Retirement: Are Canadians Saving Enough? June 2007 Document 207055
Transcript of Planning for Retirement: Are Canadians Saving Enough?actuaries.ca/members/publications/2007/FINAL...
Planning for Retirement:Are Canadians Saving Enough?
June 2007
Document 207055
This study was carried out by the Department of Statistics and Actuarial Science
at the University of Waterloo, under the supervision of Doug Andrews, MBA, FCIA.
The study was made possible through the financial support of the
Canadian Institute of Actuaries.
The project was guided by an advisory team which included CIA members Doug Andrews, MBA, FCIA, Steve Bonnar, B.Math, FCIA
and Robert L. Brown, Ph.D., FCIA.

Will you be financially ready to retire by 2030?If you are considering retiring in 2030, ask yourself the following three simple questions:
1. Do you contribute at least 15 percent of your yearly earnings to a Registered
Retirement Savings Plan?
2. Does your employer sponsor a workplace pension plan?
3. Do you own a home and do you intend to have it paid for by retirement?
If you are 40 years old or over, and have not given much thought to these questions, your retirement
planning picture may be somewhat troubled. While this is not good news, you should know that you
are not alone. Estimates show that two-thirds of Canadians may not be saving at the levels required
to meet required household expenses in retirement.
So says the following study sponsored by the Canadian Institute of Actuaries and carried out this
spring by the University of Waterloo’s Department of Statistics and Actuarial Science.
IntroductionThe tremendous shock that the baby boom generation will have on many parts of society is not some
uncertain, far-off event. The impact is being felt now, as those born in the first year of the boom (1947
in Canada) are nearing retirement. Their influence will be significant and should not be under
estimated. But is this generation, particularly those born in the early to mid ‘60s doing enough to
prepare financially for their retirement years?
The Canadian Institute of Actuaries, in an effort to understand and share the implications of this
group moving into retirement, has worked with the University of Waterloo’s Department of Statistics
and Actuarial Science to assess the financial preparedness of those planning to retire in 2030.
The objective of this study is to raise the awareness of Canadians about the need to save for their
retirement, and the tools they can draw upon in doing so. The research project and the dissemination
of its conclusions provide evidence of the value of actuarial science in decision-making and
long-term planning, and the commitment of the profession to the public interest.
1 CANAD I AN IN S T I TU T E O F ACTUAR I E S
P L A N N I N G F O R R E T I R E M E N T : A R E C A N A D I A N S S A V I N G E N O U G H ?
1. Executive SummaryOur research examined the financial adequacy of retirement preparation for those expected to stop
working in 2030.
Our conclusion: two thirds of Canadian households expecting to retire in 2030 are not saving at
levels required to meet necessary living expenses. Old Age Security (OAS) and the Canada and
Quebec Pension Plans (C/QPP) provide a modest base, and by themselves, are not designed to fill
the gap. Home ownership will help to narrow the gap, but, by itself, won’t be enough. Participation
in a workplace pension plan (RPP), by itself, won’t be enough. And, saving through a Registered
Retirement Pension Plan (RRSP) plays an important role, but is unlikely to fill the gap.
To generate sufficient income in retirement to pay for necessary living expenses, some combination
of these resources will be required.
In reaching this conclusion, our research focused on households with two different income levels:
those earning the Average Industrial Wage (approximately $40,000 in 2005) and those earning twice
the Average Industrial Wage ($80,000).
We first developed a base case scenario that measures the gap between the amount of income that will
be provided by OAS and C/QPP in 2030, and the level of income required to pay for necessary living
expenses in retirement. We used this information to calculate the level of annual savings needed —
from all sources — in order to fill the gap.With that base case in mind, we also looked at what would
happen to the savings targets if home ownership were taken into account, and if the individual retired
at a later age.
According to Statistics Canada, about 9.4 million households — or 70.6 percent — had some form
of pension assets in 2005. In order to take a finer look at what is behind this statistic, we used current
information on retirement plan participation and savings, combined with reasonable economic
assumptions, to develop 72 different household profiles.
For each of the 72 profiles, we identified the main sources of retirement income in 2030, based on
current average levels (using recent historic data and reasonable projection assumptions), and
projected expenses in 2030 for necessary living expenses, based on an analysis of the amount of these
expenses for the years 1998 – 2003 and 2005 and the trend in the data to 2030. These necessary living
expenses are defined as food, shelter, clothing, transportation, health care, energy and taxes. In 2003,
before taxes such expenses averaged $24,909 for a senior one-person household and $43,717 for a
senior two-person household. Tax rates and brackets were adjusted for assumed inflation to 2030,
but were otherwise assumed to remain unchanged. The following table shows the percentage of
income in 2030 that is projected to be required to meet these necessary expenses including taxes.
Table 1. Necessary Expenses As A Percentage of Income In 2030
CANAD I AN IN S T I TU T E O F ACTUAR I E S 2
P L A N N I N G F O R R E T I R E M E N T : A R E C A N A D I A N S S A V I N G E N O U G H ?
Income ofHousehold in 2005
No. in Household(At Retirement)
Expenses as % of2030 Income(Low Inflation)
Expenses as % of2030 Income
(Moderate Inflation)
$40,000 1 42% 32%$40,000 2 76% 60%$80,000 1 21% 16%$80,000 2 38% 30%
Based on this modeling, we were able to identify where gaps between savings and projected expenses
will exist in 2030, should people continue with their current savings pattern between now and then.
We assumed that people would begin saving for retirement approximately 25 years before their
expected retirement date, i.e., starting at age 40. For those who have started saving at an earlier age,
a lesser amount of annual savings will be required in the 25 years prior to retirement to achieve the
required retirement income.
As noted earlier, the income provided by our public pension system (OAS and C/QPP) will not by
itself be sufficient to cover necessary living expenses in retirement. Our analysis shows that for a
household with earnings at the Average Industrial Wage (AIW) ($40,000 in 2005) additional annual
savings are needed. A single person earning $40,000 would need to save 14 percent of their gross
wages every year in order to supplement OAS and C/QPP at levels sufficient to meet necessary living
expenses. Similarly, a couple earning $40,000 would need to save 30 percent of gross wages every year.
Some of the yearly savings targets that are outlined in the report may be beyond the reach of some
households, who may need to consider postponing retirement. Our analysis shows that a 40-year-old
single person earning $40,000 that is saving at a rate of 10 percent of their earnings each year, over a
period of 28 years (and therefore retiring at age 68) should be able to generate sufficient income
to meet necessary living expenses. The yearly savings target rises to 21 percent for a couple whose
household income is $40,000.
For a 40-year-old considering postponing retirement to age 73, our analysis shows that a single
person earning $40,000 that is saving at a rate of 6 percent of earnings each year, over a period of 33
years, should be able to generate sufficient income to meet necessary living expenses. The yearly
savings target rises to 13 percent for a couple whose household income is $40,000.
2. BackgroundThis report examines the financial adequacy of retirement preparation for those individuals expected
to retire in 2030. Households with two different income levels were considered:
• those earning the Average Industrial Wage (AIW), which stood at approximately
$40,000 in 2005; and
• those earning twice the AIW – approximately $80,000.
Different compositions of households were considered, including those with one or two individuals
and one or two income earners.
The sources of retirement income considered were OAS, C/QPP, Registered Pension Plan (RPP)
either defined benefit (DB) or defined contribution (DC), RRSP and home equity. No consideration
was given to other potential sources of income such as non-registered investments, inheritances or
lottery winnings. For each household, all the available sources of retirement income were identified
and the projected level of retirement income was calculated, based on collected data and some
reasonable assumptions. Expenses for necessities were projected to 2030. Estimated income, in 2030,
was then compared to estimated expenses to determine whether there was a gap. If a gap existed, then
the required rate of additional annual savings was calculated in order to eliminate the gap, i.e., so that
projected income would equal projected expenses in 2030.
3 CANAD I AN IN S T I TU T E O F ACTUAR I E S
P L A N N I N G F O R R E T I R E M E N T : A R E C A N A D I A N S S A V I N G E N O U G H ?
Our analysis takes into consideration two different projections for expected inflation (that is, the rate
of increase in the Consumer Price Index) from 2005 to 2030: a low inflation assumption of 1.43
percent per year, and a moderate inflation assumption of 2.53 percent.
For the purpose of the research, it was assumed that all forms of savings would be converted at
retirement into a stream of lifetime income indexed to inflation (an indexed annuity). For example,
home equity would be realized by selling the home and purchasing an indexed annuity. As it is
unlikely that all retirees would consider this to be a desirable option, there is an opportunity for the
development of products that enable retiring Canadians to access some of the equity in their home
without selling it, and to guard against living beyond the extent of available equity.
3. What We ExaminedThe Canadian pension system is built on four pillars:
• Old Age Security, and the Guaranteed Income Supplement (funded through
general tax revenues);
• the Canada Pension Plan/Quebec Pension Plan (funded through contributions by
workers, their employers and the self-employed, and intended to replace about 25
percent of average pensionable earnings up to the Average Industrial Wage);
• private pensions:
• employer pension plans (Defined Benefit and Defined Contribution plans);
• registered retirement savings plans (RRSPs); and
• personal savings.
OAS and C/QPP are not fixed amounts for all persons. OAS is dependent on the period of Canadian
residency and C/QPP are dependent on the number of years of participation in the plan and the level
of earnings while participating. For someone considered to have lengthy participation in both plans,
together, the OAS and C/QPP provide a basic level of income in retirement that is roughly equal to
the Low Income Cutoff, a measure often used to define poverty levels in Canada. As such, these
programs have been designed to provide only a modest base upon which individuals are expected
to build their retirement income through additional, private savings. In our research, we modeled
different periods of participation and earnings history.
As indicated above, our report looks at the financial adequacy of retirement preparation for those
individuals expected to retire in 2030; in other words, to determine the degree to which people are
saving — through various means — to augment what they will receive from Canada’s public pension
system.
We developed a base case scenario — that is, how much income would OAS and C/QPP provide in
2030, and how would this measure up against what would be needed to cover basic necessities? We
then determined for a 40-year-old the savings that would be needed on a yearly basis, for the next 25
years, in order to fill any gap. These annual savings rates are expressed as a percentage of gross wages,
for those households earning the Average Industrial Wage ($40,000) or twice the Average Industrial
Wage ($80,000). As is the case with all of the savings targets contained in this report, they are shown
for two scenarios: low and moderate inflation.
CANAD I AN IN S T I TU T E O F ACTUAR I E S 4
P L A N N I N G F O R R E T I R E M E N T : A R E C A N A D I A N S S A V I N G E N O U G H ?
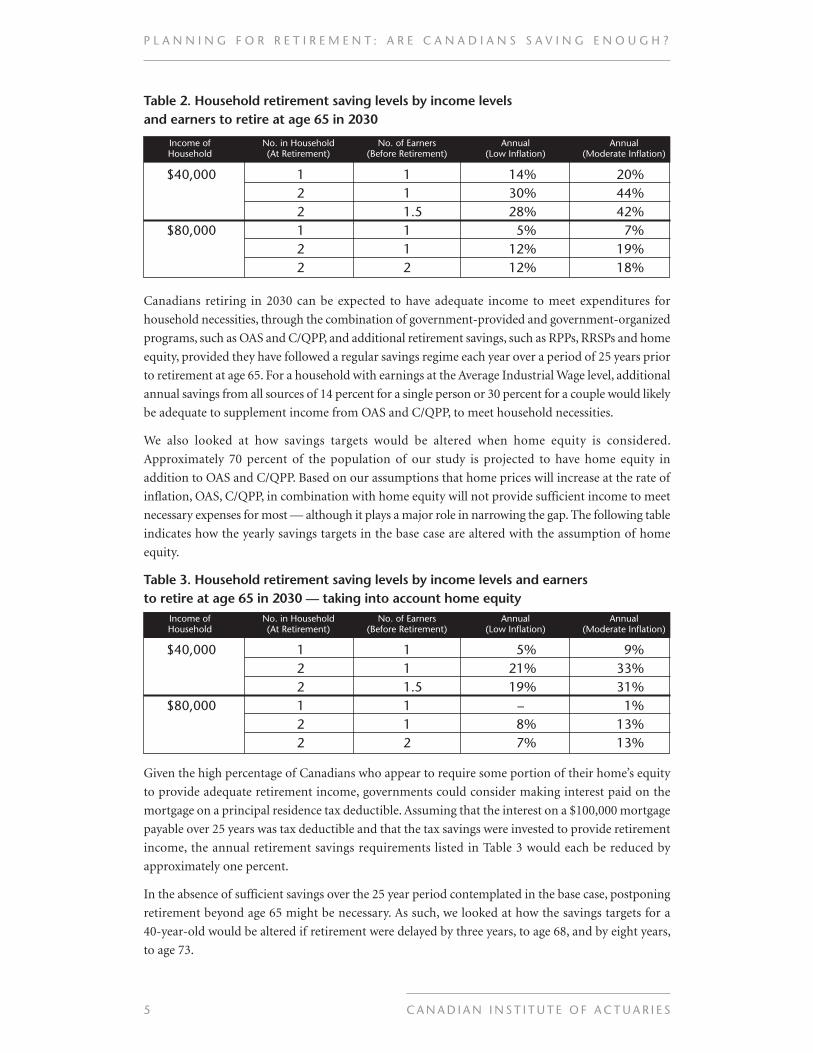
Table 2. Household retirement saving levels by income levelsand earners to retire at age 65 in 2030
5 CANAD I AN IN S T I TU T E O F ACTUAR I E S
P L A N N I N G F O R R E T I R E M E N T : A R E C A N A D I A N S S A V I N G E N O U G H ?
Income ofHousehold
No. in Household(At Retirement)
No. of Earners(Before Retirement)
Annual(Low Inflation)
Annual(Moderate Inflation)
$40,000 1 1 14% 20%2 1 30% 44%2 1.5 28% 42%
$80,000 1 1 5% 7%2 1 12% 19%2 2 12% 18%
Income ofHousehold
No. in Household(At Retirement)
No. of Earners(Before Retirement)
Annual(Low Inflation)
Annual(Moderate Inflation)
$40,000 1 1 5% 9%2 1 21% 33%2 1.5 19% 31%
$80,000 1 1 – 1%2 1 8% 13%2 2 7% 13%
Canadians retiring in 2030 can be expected to have adequate income to meet expenditures for
household necessities, through the combination of government-provided and government-organized
programs, such as OAS and C/QPP, and additional retirement savings, such as RPPs, RRSPs and home
equity, provided they have followed a regular savings regime each year over a period of 25 years prior
to retirement at age 65. For a household with earnings at the Average Industrial Wage level, additional
annual savings from all sources of 14 percent for a single person or 30 percent for a couple would likely
be adequate to supplement income from OAS and C/QPP, to meet household necessities.
We also looked at how savings targets would be altered when home equity is considered.
Approximately 70 percent of the population of our study is projected to have home equity in
addition to OAS and C/QPP. Based on our assumptions that home prices will increase at the rate of
inflation, OAS, C/QPP, in combination with home equity will not provide sufficient income to meet
necessary expenses for most — although it plays a major role in narrowing the gap. The following table
indicates how the yearly savings targets in the base case are altered with the assumption of home
equity.
Table 3. Household retirement saving levels by income levels and earnersto retire at age 65 in 2030 — taking into account home equity
Given the high percentage of Canadians who appear to require some portion of their home’s equity
to provide adequate retirement income, governments could consider making interest paid on the
mortgage on a principal residence tax deductible. Assuming that the interest on a $100,000 mortgage
payable over 25 years was tax deductible and that the tax savings were invested to provide retirement
income, the annual retirement savings requirements listed in Table 3 would each be reduced by
approximately one percent.
In the absence of sufficient savings over the 25 year period contemplated in the base case, postponing
retirement beyond age 65 might be necessary. As such, we looked at how the savings targets for a
40-year-old would be altered if retirement were delayed by three years, to age 68, and by eight years,
to age 73.

CANAD I AN IN S T I TU T E O F ACTUAR I E S 6
P L A N N I N G F O R R E T I R E M E N T : A R E C A N A D I A N S S A V I N G E N O U G H ?
Income ofHousehold
No. in Household(At Retirement)
No. of Earners(Before Retirement)
Annual(Low Inflation)
Annual(Moderate Inflation)
$40,000 1 1 6% 9%2 1 13% 21%2 1.5 12% 20%
$80,000 1 1 2% 3%2 1 5% 9%2 2 5% 8%
For those wishing to retire at age 68, in order to be able to meet necessary expenses, annual savings
for the 28 years (i.e., one still starts to save at age 40) prior to retirement at age 68, should be at
approximately the following levels:
Table 4. Household retirement saving levels by income levelsand earners to retire at age 68 in 2033
Income ofHousehold
No. in Household(At Retirement)
No. of Earners(Before Retirement)
Annual(Low Inflation)
Annual(Moderate Inflation)
$40,000 1 1 12% 17%2 1 26% 39%2 1.5 24% 37%
$80,000 1 1 4% 6%2 1 11% 17%2 2 11% 16%
Income ofHousehold
No. in Household(At Retirement)
No. of Earners(Before Retirement)
Annual(Low Inflation)
Annual(Moderate Inflation)
$40,000 1 1 10% 14%2 1 21% 33%2 1.5 20% 31%
$80,000 1 1 3% 4%2 1 9% 14%2 2 8% 13%
Should the decision be made to delay retirement for eight years, in order to be able to meet household
expenses, annual savings for the 33 years prior to retirement at age 73 should be at approximately the
following levels:
Table 5. Household retirement saving levels by income levelsand earners to retire at age 73 in 2038
Our modeling assumed that investment returns will follow the projected yield curve for Government
of Canada bonds adjusted for the low and moderate inflation assumptions. This suggests that the
required annual savings amounts are conservative estimates. However, it should be remembered that
the investment returns in the model are net of all expenses. By taking more investment risk and earning
potentially higher returns, the required annual savings could reduce.
The following table shows the annual savings, for a 40-year-old, from all sources, for the 25 years
prior to retirement at age 65, to supplement the OAS and C/QPP in order to be able to meet the
necessary expenses, assuming that an investment return of 1 percent more per year could be achieved
(compared to Table 2, which illustrates the base case).
Table 6. Household retirement saving levels by income levels and earners to retireat age 65 in 2030 if investment returns of 1 percent more per year were achieved
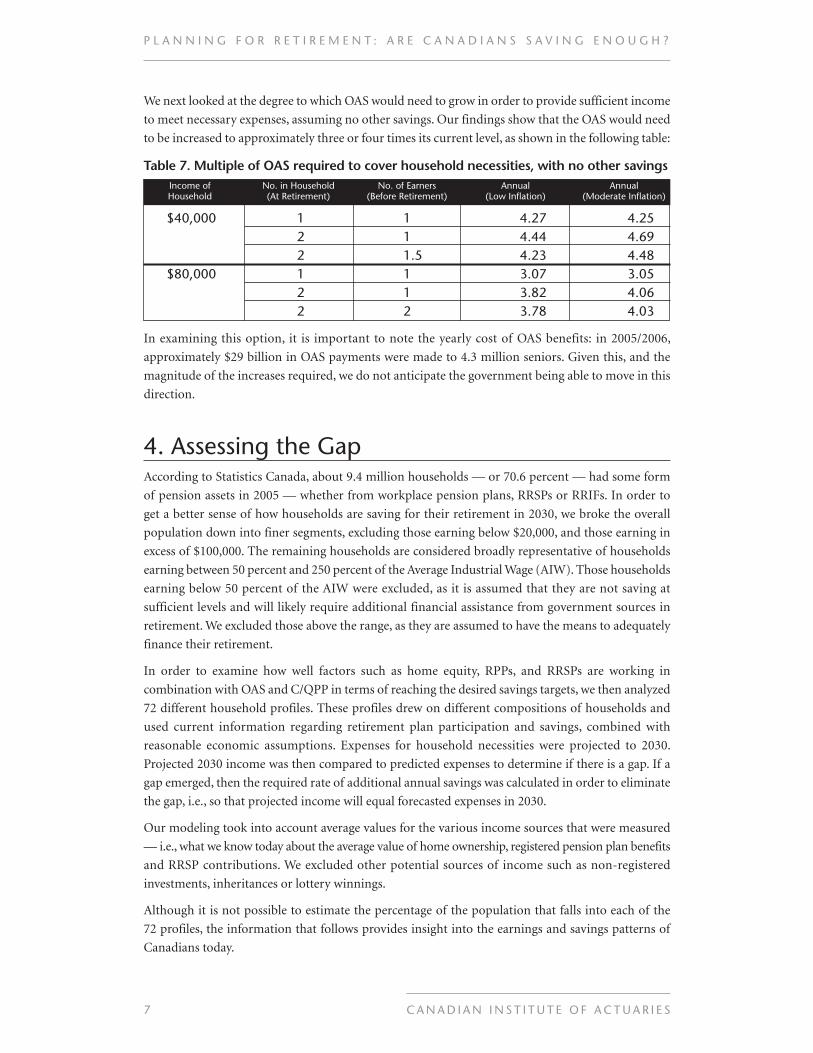
We next looked at the degree to which OAS would need to grow in order to provide sufficient income
to meet necessary expenses, assuming no other savings. Our findings show that the OAS would need
to be increased to approximately three or four times its current level, as shown in the following table:
Table 7. Multiple of OAS required to cover household necessities, with no other savings
7 CANAD I AN IN S T I TU T E O F ACTUAR I E S
P L A N N I N G F O R R E T I R E M E N T : A R E C A N A D I A N S S A V I N G E N O U G H ?
Income ofHousehold
No. in Household(At Retirement)
No. of Earners(Before Retirement)
Annual(Low Inflation)
Annual(Moderate Inflation)
$40,000 1 1 4.27 4.252 1 4.44 4.692 1.5 4.23 4.48
$80,000 1 1 3.07 3.052 1 3.82 4.062 2 3.78 4.03
In examining this option, it is important to note the yearly cost of OAS benefits: in 2005/2006,
approximately $29 billion in OAS payments were made to 4.3 million seniors. Given this, and the
magnitude of the increases required, we do not anticipate the government being able to move in this
direction.
4. Assessing the GapAccording to Statistics Canada, about 9.4 million households — or 70.6 percent — had some form
of pension assets in 2005 — whether from workplace pension plans, RRSPs or RRIFs. In order to
get a better sense of how households are saving for their retirement in 2030, we broke the overall
population down into finer segments, excluding those earning below $20,000, and those earning in
excess of $100,000. The remaining households are considered broadly representative of households
earning between 50 percent and 250 percent of the Average Industrial Wage (AIW). Those households
earning below 50 percent of the AIW were excluded, as it is assumed that they are not saving at
sufficient levels and will likely require additional financial assistance from government sources in
retirement. We excluded those above the range, as they are assumed to have the means to adequately
finance their retirement.
In order to examine how well factors such as home equity, RPPs, and RRSPs are working in
combination with OAS and C/QPP in terms of reaching the desired savings targets, we then analyzed
72 different household profiles. These profiles drew on different compositions of households and
used current information regarding retirement plan participation and savings, combined with
reasonable economic assumptions. Expenses for household necessities were projected to 2030.
Projected 2030 income was then compared to predicted expenses to determine if there is a gap. If a
gap emerged, then the required rate of additional annual savings was calculated in order to eliminate
the gap, i.e., so that projected income will equal forecasted expenses in 2030.
Our modeling took into account average values for the various income sources that were measured
— i.e., what we know today about the average value of home ownership, registered pension plan benefits
and RRSP contributions. We excluded other potential sources of income such as non-registered
investments, inheritances or lottery winnings.
Although it is not possible to estimate the percentage of the population that falls into each of the
72 profiles, the information that follows provides insight into the earnings and savings patterns of
Canadians today.
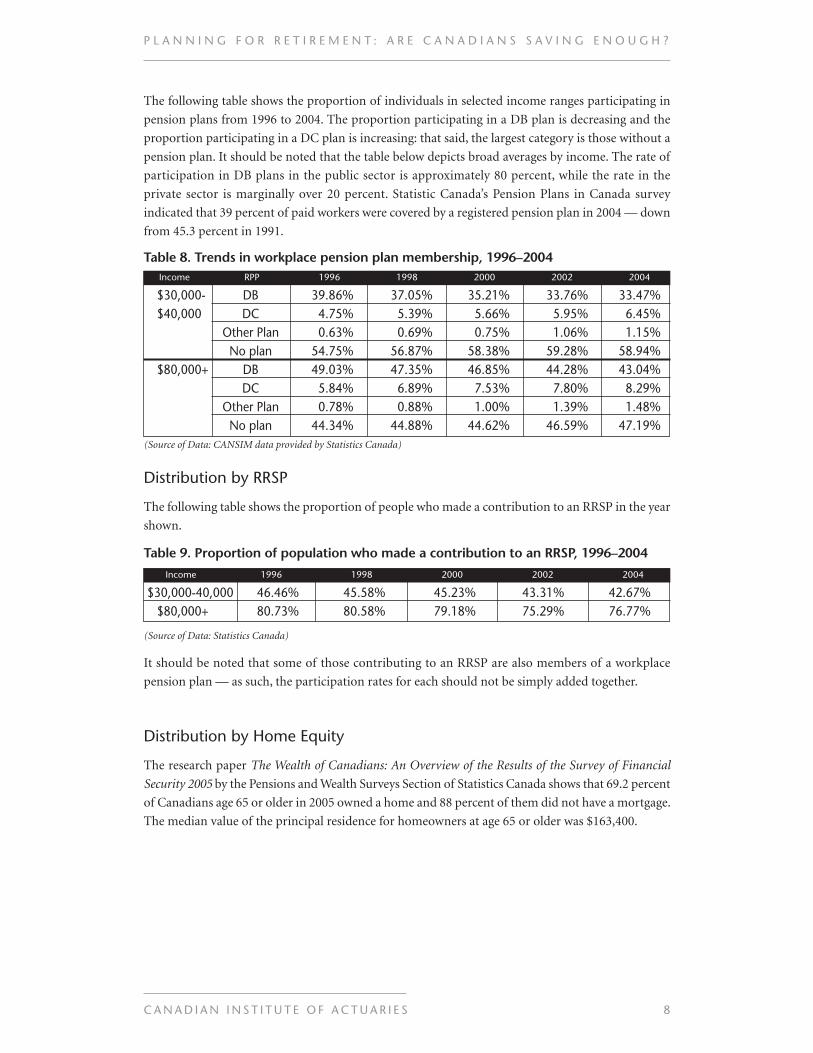
The following table shows the proportion of individuals in selected income ranges participating in
pension plans from 1996 to 2004. The proportion participating in a DB plan is decreasing and the
proportion participating in a DC plan is increasing: that said, the largest category is those without a
pension plan. It should be noted that the table below depicts broad averages by income. The rate of
participation in DB plans in the public sector is approximately 80 percent, while the rate in the
private sector is marginally over 20 percent. Statistic Canada’s Pension Plans in Canada survey
indicated that 39 percent of paid workers were covered by a registered pension plan in 2004 — down
from 45.3 percent in 1991.
Table 8. Trends in workplace pension plan membership, 1996–2004
CANAD I AN IN S T I TU T E O F ACTUAR I E S 8
P L A N N I N G F O R R E T I R E M E N T : A R E C A N A D I A N S S A V I N G E N O U G H ?
Income RPP 1996 1998 2000 2002 2004
$30,000- DB 39.86% 37.05% 35.21% 33.76% 33.47%$40,000 DC 4.75% 5.39% 5.66% 5.95% 6.45%
Other Plan 0.63% 0.69% 0.75% 1.06% 1.15%No plan 54.75% 56.87% 58.38% 59.28% 58.94%
$80,000+ DB 49.03% 47.35% 46.85% 44.28% 43.04%DC 5.84% 6.89% 7.53% 7.80% 8.29%
Other Plan 0.78% 0.88% 1.00% 1.39% 1.48%No plan 44.34% 44.88% 44.62% 46.59% 47.19%
Income 1996 1998 2000 2002 2004
$30,000-40,000 46.46% 45.58% 45.23% 43.31% 42.67%$80,000+ 80.73% 80.58% 79.18% 75.29% 76.77%
(Source of Data: CANSIM data provided by Statistics Canada)
Distribution by RRSP
The following table shows the proportion of people who made a contribution to an RRSP in the year
shown.
Table 9. Proportion of population who made a contribution to an RRSP, 1996–2004
(Source of Data: Statistics Canada)
It should be noted that some of those contributing to an RRSP are also members of a workplace
pension plan — as such, the participation rates for each should not be simply added together.
Distribution by Home Equity
The research paper The Wealth of Canadians: An Overview of the Results of the Survey of Financial
Security 2005 by the Pensions and Wealth Surveys Section of Statistics Canada shows that 69.2 percent
of Canadians age 65 or older in 2005 owned a home and 88 percent of them did not have a mortgage.
The median value of the principal residence for homeowners at age 65 or older was $163,400.

5. What We FoundNot surprisingly, OAS and C/QPP by themselves provide insufficient income to meet the necessary
living expenses. These programs have been designed to deliver income at approximately the Low
Income Cutoff, which is one relative measure used in defining poverty. They have been designed to
provide only a modest level of income.
Our analysis indicates that the following factors are key in determining the degree to which
households can save adequately for their retirement.
Importance of Defined Benefit (DB) Plans
In order to determine the importance of workplace pension plans, we examined the level of benefits
typically provided by a defined benefit plan, and compared this with those provided under a typical
defined contribution plan.We used a final-average-pay plan providing 1.25 percent of earnings up to
the Average Industrial Wage and 2 percent of earnings in excess of the Average Industrial Wage, for
each year of service, as a typical DB pension plan. We used a contribution rate of 5 percent of
each year’s earnings as typical of a DC pension plan. We concluded that a single person who has
participated in a typical DB pension plan for a long period prior to retirement, such as 25 years,
could be expected to have earned sufficient benefits in combination with OAS and C/QPP to meet
household expenses in retirement; however, if only one member of a couple has participated in a DB
pension plan, additional savings will likely be required to meet this threshold.A single person who has
participated in a typical DC pension plan for a similar period could still be expected to need additional
savings in combination with OAS and C/QPP to meet household expenses in retirement. This is also
true even if both members of a couple have participated in a DC plan.
The Role of Home Equity
As our analysis shows, home equity can have a very positive financial impact on the ability of
individuals to narrow the gap between what they will receive from the public pension system, and the
income they will need in order to cover necessary living expenses in retirement. And as discussed
earlier, allowing the interest paid on mortgages to be deductible would further narrow the gap.
Given that approximately 70 percent of the population of our study is projected to have home equity,
it appears that for a significant portion of Canadians, the adequacy of their retirement income will
be dependent on the value of their home’s equity. In a number of ways this makes the retirement
decision a risky one. Property values, on average, have tended to increase over time; however,
individual properties may decline in value.Although the long-term trend in property prices has been
upward, there have been shorter periods of either significant decline or relatively flat prices. Although
purchasing a home by paying a mortgage is a form of regular saving, because of the size of the
mortgage relative to one’s income, there may be little other available income for saving for retirement
in any other vehicle. It is risky to have most of one’s retirement savings in a single investment,
especially an investment that may be illiquid and whose price may fluctuate.
There is considerable speculation on what the impact on house prices will be as the baby boom
generation retires. Some argue that the baby boomers will all wish to sell their houses at about the
same time, driving down prices. This would be cruel irony if those same baby boomers are counting
on the value of home equity to provide adequate income in retirement. Others argue that in major
9 CANAD I AN IN S T I TU T E O F ACTUAR I E S
P L A N N I N G F O R R E T I R E M E N T : A R E C A N A D I A N S S A V I N G E N O U G H ?
urban areas house prices are undervalued, on a global scale, and that there will be continuing
demand to reside in urban areas which will continue to drive house prices upward. Rather than adopt
either of these views, house prices have been projected to increase at the rate of inflation.
The Role of RRSPs
The RRSP is a tax-effective vehicle for retirement saving, for most taxpayers. Contributions to the
RRSP are tax deductible and accumulated funds in the RRSP are not taxed until withdrawn.However,
for low income retirees who receive income-tested government assistance, such as the Guaranteed
Income Supplement, the marginal rate of tax on withdrawals from an RRSP can be very high.
Canadians, on average, have significant amounts of unused RRSP room available for retirement
savings. There is a limit on the amount of new contribution room created for an RRSP each year of
18 percent of the previous year’s earnings (less an adjustment for pension plan participation). Since
18 percent is less than certain of the contribution percentages required in addition to OAS and C/QPP
to meet necessary expenses, as shown in the base case scenario, certain income-family-composition
profiles, if only saving through an RRSP, will not be able to achieve adequate income.
The Overall Picture
It is not known what percentage of Canadians will fall into each income-family-composition profile
in the year 2030. However, based on current data, we estimate that approximately one third of
Canadian households may be saving regularly, from all sources, at the levels in this report stated as
necessary to meet required household expenses, when combined with OAS and C/QPP. The following
tables illustrate two profiles of households with a combination of savings expected to be sufficient to
meet necessary expenses, in combination with OAS and C/QPP.
Table 10. Sample household profiles with sufficient savings
CANAD I AN IN S T I TU T E O F ACTUAR I E S 1 0
P L A N N I N G F O R R E T I R E M E N T : A R E C A N A D I A N S S A V I N G E N O U G H ?
Income ofHousehold
No. inHousehold
(AtRetirement)
No. ofEarners(Before
Retirement)
RetirementAge
InflationAssumption
HomeEquity
PensionPlan
AnnualRRSPContri-bution
$40,000 2 1 68 Low Yes No 14%$80,000 2 1 65 Moderate Yes Yes DB 0%
Income ofHousehold
No. inHousehold
(AtRetirement)
No. ofEarners(Before
Retirement)
RetirementAge
InflationAssumption
HomeEquity
PensionPlan
AnnualRRSPContri-bution
$40,000 1 1 65 Low No No 10%$40,000 2 1 68 Moderate Yes No 10%$40,000 2 2 65 Low Yes 1 Earner 0%
with DB$80,000 2 1 65 Moderate Yes No 10%
It is estimated that two thirds of households are not saving regularly, from all sources, at the levels in
this report stated as necessary to meet household expenses, when combined with OAS and C/QPP. The
following table illustrates four profiles of households with a combination of savings that would not
be expected to achieve the required income necessary to meet household expenses.
Table 11. Sample household profiles with insufficient savings

11 CANAD I AN IN S T I TU T E O F ACTUAR I E S
P L A N N I N G F O R R E T I R E M E N T : A R E C A N A D I A N S S A V I N G E N O U G H ?
ConclusionThe savings targets contained in our base case highlight the urgent need for individuals to save for
their own retirement. To illustrate the magnitude, a single person earning $40,000 needs to save
between 14 to 20 percent of annual earnings to cover non-discretionary expenses in retirement, while
a couple with a combined income of $40,000 needs to save 30 percent or more. These targets are
correspondingly higher if the goal is to have sufficient income to allow for discretionary spending.
The good news is that Canada’s public pension system (OAS and C/QPP) is working as intended —
in fact, the CPP has been put on such a sound footing that it is expected to be financially viable for
the next 75 years. The bad news is that despite the fact that the public system is not designed to do it
all, not enough households are getting that message.
With OAS and C/QPP geared to replacing only about 40 percent of the gross income (at the Average
Industrial Wage) individuals must build upon this modest income through some combination of the
following: workplace pension plans, RRSPs, home ownership, and personal savings.
However, while some are on track, we estimate that about two-thirds of Canadian households are
currently saving at levels that will not generate sufficient income to cover their non-discretionary
expenses in retirement.
Our analysis shows that home ownership and workplace pension plans have the greatest potential to
fill the gap. However, to be a viable retirement savings tool, home equity must be sufficient and be
accessible when it is required to provide retirement income. Similarly, having a workplace pension
plan isn’t necessarily enough — much depends on the plan design, and a defined benefit plan has the
potential to fill more of the gap than a defined contribution plan will.
For public policy makers, these findings suggest the need for greater education about the role that
different savings vehicles can play in generating retirement income, and for consideration of
measures aimed at improving savings levels, such as the deduction of mortgage interest. They also
underscore the desirability of reversing the trend of declining pension plan participation, especially
in defined benefit plans.
Given our findings, the importance of individuals arranging for structured savings over the next 25
years, from a range of sources and at the levels outlined in our base case, cannot be stressed enough.
Project TeamThe research was directed by a project team constituted by the CIA which included CIA members
Doug Andrews, MBA, FCIA, Steve Bonnar, B.Math, FCIA and Robert L. Brown, Ph.D., FCIA.
The research was conducted by the following graduate students in the department of Statistics and
Actuarial Science at the University of Waterloo, under the supervision of Doug Andrews: Chee Wah Chin,
Min Ji, Johnny Li, Yang Liu, Ying Shang, Gang Su, Wei Sun, Jacky Li Wang, Min Yang, Sabrina Yao,
Kui Zhao, Shen Zhao.