Planning & Conducting Management Studies - AFGE171 · DFAS-DE SOP 1100.8 Defense Finance and...
24
DFAS-DE SOP 1100.8 Defense Finance and Accounting Service – Denver Center PLANNING AND CONDUCTING MANAGEMENT STUDIES JUNE 2000
Transcript of Planning & Conducting Management Studies - AFGE171 · DFAS-DE SOP 1100.8 Defense Finance and...

DFAS-DE SOP 1100.8Defense Finance and Accounting Service – Denver Center
PLANNING AND CONDUCTING MANAGEMENT STUDIES
JUNE 2000
DFAS-DE SOP 1100.8JUNE 2000
i
FOREWORD
This Standard Operating Procedure (SOP) outlines policies,responsibilities, and procedures to be used in planning andconducting management studies. It is not all-inclusive, butprovides basic guidance to be used when conducting managementengineering studies to develop manpower staffing standards. Thesteps and techniques presented can be used for any workyeardetermination effort.
This SOP is effective immediately and is applicable to theStudies and Requirements Division (DFAS-DE/CI) and allorganizations at the Denver Center or its Operating Locations(OPLOC) who are the subject of a DFAS-DE/CI management study.
//S//Roxane Nowling
Director for Resource Management

DFAS-DE SOP 1100.8JUNE 2000
iii
TABLE OF CONTENTS
Page
Foreword i
Table of Contents iii
Figures v
Acronyms and Abbreviations vii
CHAPTER 1 - GENERAL INFORMATION
C1.1. Purpose 1-1
C1.2. Applicability and Scope 1-1
C1.3. Policy 1-1
C1.4. Responsibilities 1-1
CHAPTER 2 - GENERAL PROCEDURES FOR CONDUCTING A MANAGEMENT STUDY
C2.1. Phases of a Study 2-1
C2.2. Phase One - Study Planning 2-1
C2.3. Phase Two - Study Familiarization 2-3
C2.4. Phase Three - Data Collection and Measurement 2-3
C2.5. Phase Four - Data Analysis 2-5
C2.6. Phase Five - Final Reporting 2-5
CHAPTER 3 - MEASUREMENT - USE OF SPREADSHEET
C3.1. Standard Spreadsheet 3-1
C3.2. Processing Data Collected To Determine 3-2Staffing Requirements
C3.3. How to Determine Workyears Required 3-2

DFAS-DE SOP 1100.8JUNE 2000
iv
C3.4. Explanation of Manpower Availability 3-2Factor (MAF)
C3.5. Direct and Indirect Workload 3-2
C3.6. Indirect Allowance Factor (IAF) 3-3
C3.7. Additives, Exclusions, and Deviations 3-3
C3.8. Potential Workload Factor (PWLF) Selection 3-3
CHAPTER 4 - DATA ANALYSIS
C4.1. Purpose of Data Analysis 4-1
C4.2. Logic Check 4-1
C4.3. Backlog and Overtime 4-1
C4.4. Correlation and Regression Analysis 4-1
C4.5. Computed vs Measured Hours 4-1
C4.6. Using the Staffing Equation to Calculate 4-2Computed Hours
C4.7. Equation Statistics 4-2
C4.8. Figuring Extrapolation Limits 4-2
C4.9. Coordination of Preliminary Study Results 4-3

DFAS-DE SOP 1100.8JUNE 2000
v
FIGURES
Figure Title Page
3-1 Workload Factors for Accounting Areas 3-4
3-2 Standard Data Collection Spreadsheet 3-5
4-1 Correlation & Regression Analysis 4-4

DFAS-DE SOP 1100.8JUNE 2000
vii
ABBREVIATIONS AND/OR ACRONYMS
ABC Activity Based CostingDFAS-DE Defense Finance and Accounting Service - Denver CenterDFAS-HQ Defense Finance and Accounting Service - HeadquartersIAF Indirect Allowance FactorMAF Manpower Availability FactorMOA Memorandum of AgreementMOU Memorandum of UnderstandingOPLOC Operating LocationOPR Office of Primary ResponsibilityPAT Per Accomplishment TimePOC Point of ContactPWLF Potential Workload FactorRADSS Resource Analysis Decision Support SystemSMA Subject Matter AreaTDY Temporary DutyWLF Workload Factor

DFAS-DE SOP 1100.8JUNE 2000
1-1
C1. CHAPTER 1
GENERAL INFORMATION
C1.1. PURPOSE. This SOP outlines policy, responsibilities, andprocedures for planning and conducting management studiesperformed by the Studies and Requirements Division, Directorateof Resource Management, Denver Center (DFAS-DE/CI). Managementstudies are performed for organizations within the Denver Centerand its OPLOCs.
C1.2. APPLICABILITY AND SCOPE. This SOP applies to allDFAS-DE/CI analysts and their customers. A customer is definedas any organization or function within DFAS-DE or its OPLOCs forwhom the DFAS-DE/CI staff performs a management study.
C1.3. POLICY.
C1.3.1. All management studies done by DFAS-DE/CI analysts forworkyear determination (staffing standards) will follow thestandard methodology presented in this SOP.
C1.3.2. Techniques presented in this SOP will be adapted asnecessary to perform related workyear determination efforts(Activity Based Costing (ABC), A-76, Benchmarking).
C1.4. RESPONSIBILITIES.
C1.4.1. Director of Resource Management, Denver Center.Approves study charter, milestones, study plans, and finalreport.
C1.4.2. Director of Organization Being Studied.
C1.4.2.1. Concurs/nonconcurs with study charter, milestones,and study plans.
C1.4.2.2. Concurs/non-concurs on process descriptions,frequencies, and associated times; concurs/non-concurs on anyrequired changes prior to the change being made.
C1.4.2.3. Concurs/non-concurs on final report.
C1.4.2.4. Implements the recommendations of the study. Ifrecommendations are not implemented, provides justification/rationale for non-implementation.

DFAS-DE SOP 1100.8JUNE 2000
1-2
C1.4.3. DFAS-DE/CI Team Leader.
C1.4.3.1. Prepares all study documents to include studycharter, milestones, final report, and other documents asrequired.
C1.4.3.2. Prepares necessary briefing material and presentsrequired briefings.
C1.4.3.3. Trains team members as necessary.
C1.4.3.4. Assigns work to team members.
C1.4.3.5. Ensures all raw data collected undergoes analysis.
C1.4.3.6. Obtains functional coordination on processidentification and measurement.
C1.4.4. DFAS-DE/CI Team Members. Assist team leader byfacilitating workshops, identifying process improvements, andperforming other assigned work.
C1.4.5. Functional Experts of Organization Under Study.
C1.4.5.1. Participate in workshops held for processidentification and measurement.
C1.4.5.2. Provide suggestions for improvement.
C1.4.5.3. Review process descriptions, frequencies, andassociated times to ensure accuracy.

DFAS-DE SOP 1100.8JUNE 2000
2-1
C2. CHAPTER 2
GENERAL PROCEDURES FOR CONDUCTING A MANAGEMENT STUDY
C2.1. PHASES OF A STUDY. All management studies, regardless ofpurpose, consist of five basic phases. Each phase requiresspecific actions and results in standard products anddeliverables. Each phase is addressed in detail later in thisSOP. The phases are:
C2.1.1. Study planning.
C2.1.2. Study familiarization.
C2.1.3. Data collection/measurement.
C2.1.4. Data analysis.
C2.1.5. Final reporting.
C2.2. PHASE ONE - STUDY PLANNING. Requests for studies maycome from DFAS-HQ, the Director of the Denver Center, theDirector of Resource Management, an OPLOC Director, or theDirector of an organization within DFAS-DE. Regardless of wherethe request originates, the analyst(s) who will perform thestudy will receive the tasking from the Division Chief,DFAS-DE/CI. When you receive a tasking for a study, take thefollowing actions. (NOTE TO DIRECTORS: To request a study inyour organization, send a letter to DFAS-DE/C.)
C2.2.1. Review the Tasking. Be sure you know exactly what youare to do. Make sure you understand:
C2.2.1.1. Why You Are Doing the Study (the Objective). Studiesare done for a variety of reasons. You may be asked to do astudy because of a change in procedures in a particularfunction, making it necessary to assess the workyear impact.Sometimes studies are done to prepare for a realignment orbudget cut. You may be asked to address a specific problem andfind a solution. The objective of the study affects how it willbe done, resources required, time required, travel costs, etc.
C2.2.1.2. Who or What Will Be Studied (the Scope). Determineif you need to look at the overall structure of all DenverCenter OPLOCs, a particular function of a single OPLOC, aDirectorate within the Denver Center, or some other combination.

DFAS-DE SOP 1100.8JUNE 2000
2-2
C2.2.1.3. When the Study Must Be Done (the Timeline).Sometimes studies are done to provide a planning tool foranother major project such as a realignment, or equipmentpurchase. In situations of this type, timing is crucial, andstudy planning must take this into account.
C2.2.1.4. Where the Study Will Be Done. Some studies requireTemporary Duty (TDY) to an OPLOC, several OPLOCs, another DFASCenter, or some other location. Other studies can be completedat DFAS-DE.
C2.2.2. Determine Feasibility Based on Resource Requirements,i.e., Cost, Number of Workyears Required, Etc. After you reviewthe tasking as described above, determine if the study isfeasible. Estimate the cost of the study, paying particularattention to TDY requirements. Estimate the number ofDFAS-DE/CI resources required to perform the study. Determineif the study can be done in the length of time allotted,particularly if the study is being done as a planning tool foranother major project. In effect, you are doing an informalcost/benefit analysis. The information you gather will assistmanagement in determining if the expected benefits to be derivedfrom the study justify the cost. Brief your findings toDFAS-DE/C management.
C2.2.3. Prepare a Study Charter. After you receive approval toproceed with the study from the DFAS-DE/C Director, prepare astudy charter. The charter is used to formally notify theappropriate office(s) of primary responsibility (OPR) of intent.It documents agreement between DFAS-DE/C and the organization(s)being studied on what is to be done, how, when, by whom, etc.Coordinate the charter with the Director(s) of theorganization(s) under study. When agreement has been reached,the Director of the organization under study and the Director ofDFAS-DE/C will sign the study charter. (NOTE: If agreementcannot be reached between the team leader and the Director ofthe organization under study, elevate the issue to DFAS-DE/Cmanagement for resolution.) The study charter will contain thefollowing sections.
- Objectives- Scope- Statement of the situation- Background- Assumptions- Project methodology- Team composition

DFAS-DE SOP 1100.8JUNE 2000
2-3
- Responsibilities- Milestones and time line
C2.2.4. Identify Functional Point of Contact (POC). When youbegin data collection, you will need one POC to serve as aliaison between you and the organization being studied. Thisperson will assist in scheduling workshops and briefings, willidentify subject matter experts for specific processes, willassist in providing resources such as meeting rooms andcomputers, and will provide other assistance of this type. Ifthe organization to be studied does not assign a single POC,request one.
C2.3. PHASE TWO - STUDY FAMILIARIZATION. During this phase,you will research background material. Once you receiveapproval to proceed with the study, learn as much about theorganization to be studied as possible. Good sources ofinformation are pertinent directives, mission statements,Memorandums of Agreement (MOA)/Memorandums of Understanding(MOU), and previous studies. Review personnel data,organizational charts, overtime, backlogs, workload factors, andwork units.
C2.4. PHASE THREE - DATA COLLECTION AND MEASUREMENT. This isgenerally the most time consuming and costly part of the study.It is imperative that enough time be spent on data collection toprovide a reliable product. The value and credibility of theentire study is dependent upon the accuracy of data collection.Generally, data collection consists almost entirely of on-sitevisits at the organization being studied. The on-site visitconsists of four parts - preparation, in-briefing, conductingthe data collection workshops, and out-briefing. The final taskin data collection is obtaining initial concurrence from thestudy location that data was accurately captured.
C.2.4.1. Preparation for the On-Site Visit.
C.2.4.1.1. Be sure you reach agreement with the organizationbeing studied on when the on-site visit(s) will begin. Be assensitive as possible to the customer’s scheduling concernswhile staying within the constraints imposed by your studyschedule.
C.2.4.1.2. If the on-site visit requires TDY, arrange fortravel orders, hotel reservations, car rental, etc.

DFAS-DE SOP 1100.8JUNE 2000
2-4
C.2.4.1.3. Obtain necessary supplies. Be sure you have a largesupply of 3.5" computer disks and a hand-held calculator foreach member of the team.
C.2.4.1.4. Prepare at least one master copy of the Excelspreadsheet you will use for data collection for each member ofthe team. More information on the spreadsheet is provided inChapter 3.
C.2.4.1.5. Prepare materials for in-brief (discussed below).
C.2.4.2. In-Brief. You will probably be required to do two in-briefs, one for the Director, Deputy, and management staff, anda second for employees. It is the Director’s decision onwhether you will brief the workers, but you must be prepared toprovide separate briefings for management and employees. Thefollowing information should be covered in the in-brief; noticethis is the same information you included in the Charter.
- Objectives- Scope- Statement of the situation- Background- Assumptions- Project methodology- Team composition- Responsibilities- Milestones and time line
C.2.4.3. Conducting Data Collection Workshops. The purpose ofdata collection workshops is to develop a process orienteddescription of the work performed in the organization beingstudied. Workshops are a joint effort between functionals andstudy analysts. A standard Excel spreadsheet for collectingdata is used in the workshops. See Chapter 3 for a sample andexplanation of the worksheet.
C.2.4.4. Out-Brief. When your on-site visit is complete, youwill need to out-brief the Director. Generally, this is a veryshort courtesy visit. Express gratitude for hospitality shown,and explain what will happen next in the study. Answer anyquestions he or she may have.
C.2.4.5. Initial Coordination. After you complete datacollection workshops, allow the study location to make a "firstpass review" of the data collected. Obtain written concurrencethat your initial data collection is accurate. Ask them to

DFAS-DE SOP 1100.8JUNE 2000
2-5
verify that all processes were captured, all tasks within theprocesses were documented, and work-counts, frequency, and timeappear to be accurate. Be sure they understand this is raw dataand may require adjustment after data analysis. Assure themthey will have another chance to review and coordinate afterdata analysis is complete.
C.2.4.6. Measurement. Measurement, which consists ofprocessing the data collected in the workshops, is the firststep in determining staffing requirements. Chapter 3 providesinstructions for doing necessary calculations.
C2.5. PHASE FOUR - DATA ANALYSIS. The data analysis phasecontinues the work begun during measurement. During this phase,data collected is validated through intense analysis, andstaffing requirements are established. Chapter 4 providesinstructions for the necessary analysis.
C2.6. PHASE FIVE - FINAL REPORTING. This phase consists ofthree actions:
C2.6.1. Write the final report.
C2.6.2. Submit the report to study locations to obtain finalconcurrence. Final report includes new staffing standards andrequirements. (NOTE: If agreement cannot be reached betweenthe team leader and the Director of the organization understudy, elevate the issue to DFAS-DE/C management forresolution.)
C2.6.3. Forward the report through the Director of ResourceManagement to the Center Director for approval. After youobtain the Center Director’s approval, send the report to thestudy location for implementation. File a copy of the finalreport and all other documents created during the course of thestudy in the office files.

DFAS-DE SOP 1100.8JUNE 2000
3-1
C3. CHAPTER 3
MEASUREMENT - USE OF SPREADSHEET
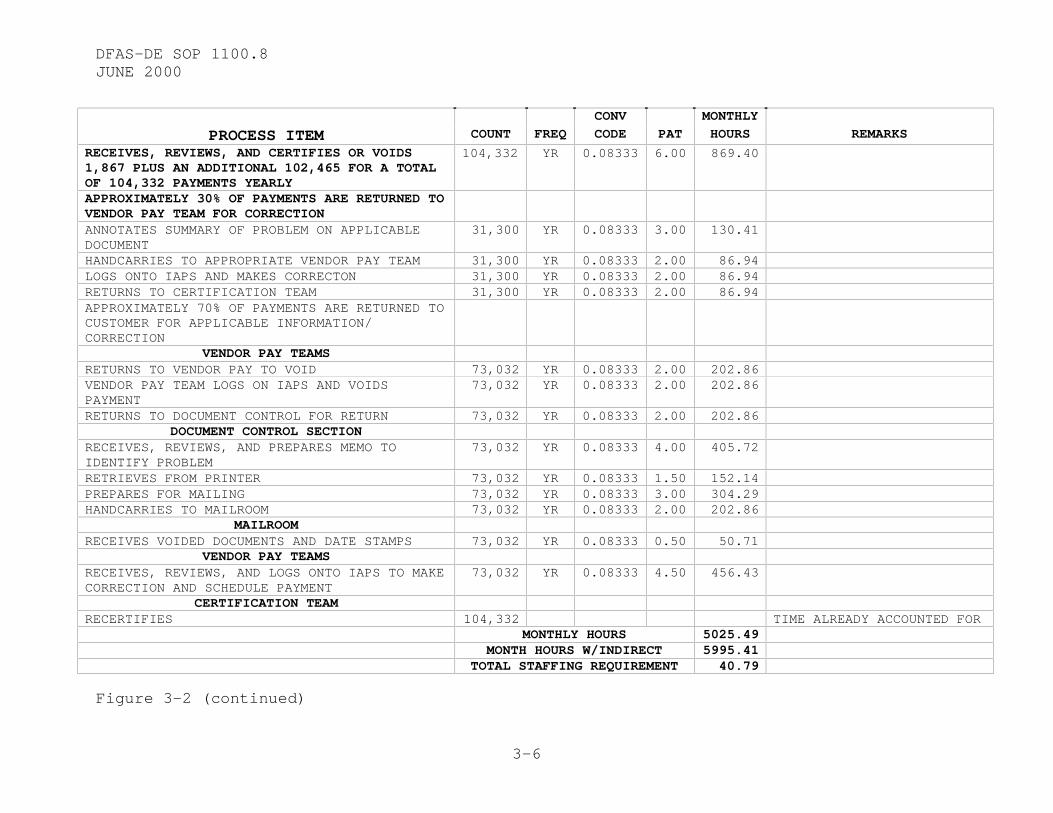
C3.1. STANDARD SPREADSHEET. A standard Excel spreadsheet isused to collect the data used for measurement. See Figure 3-2.The spreadsheet consists of 6 columns labeled Process, Count,Frequency, Conversion Code, Per Accomplishment Time (PAT), andMonthly Hours.
C3.1.1. Process Column. The process column is used to identifythe process and list all tasks associated with the process.
C3.1.2. Count Column. The average number of times the task isperformed during a given time period. All counts will be basedon a year’s data, if available. If a full year is notavailable, use a minimum of 6 months.
C3.1.3. Frequency Column. The time period over which the taskis performed - day, month, week, quarter, or year. For example,a task may be done 2 times (count) a day (frequency; 5 times(count) a month (frequency) etc.
C3.1.4. Conversion Code Column. The conversion code convertsall hours to monthly. For example, if a task is performed oncea year, the count is 1, the frequency is year, and theconversion code is 0.08333 (1/12 = 0.08333). If a task isperformed five times a day, the count is 5, the frequency isdaily, and the conversion code is 20.91.
Codes
Frequency Code
Daily 20.91Monthly 1.000Weekly 4.348Quarterly .3333Yearly .08333
C3.1.5. PAT Column. The average time (in minutes) it takes atrained person to perform the task one time. Do not base thetime on the best performer or the worst, but use an averagebetween the two.
C3.1.6. Monthly Hours. The number of hours per month requiredto perform the task. All times must be converted to monthly

DFAS-DE SOP 1100.8JUNE 2000
3-2
hours which is done automatically by the spreadsheet using thecalculations above (Count X Conversion Code X Time/60 = MonthlyHours).
C3.2. PROCESSING DATA COLLECTED TO DETERMINE STAFFINGREQUIREMENTS. When all processes have been captured on thespreadsheet, you are ready to process the data to make initialprojections for required workyears. Remember, these are initialprojections and may change after data analysis is complete.
C3.3. HOW TO DETERMINE WORKYEARS REQUIRED. Workyears requiredare determined by dividing the monthly hours measured by themanpower availability factor (MAF). The MAF is currently 147.The MAF is explained fully in paragraph C3.4 below.
Example: To determine the number of workyears if 2000monthly hours measured:
2000/147 = 13.610 workyears.
NOTE: Hours measured include direct and indirect.Paragraph C3.6 below explains how to apply the indirectallowance factor (IAF).
C3.4. EXPLANATION OF MANPOWER AVAILABILITY FACTOR (MAF). TheMAF is used to compensate for time spent doing something otherthan the primary mission of the workcenter. A total workyear iscomprised of both available and non-available hours. Bothavailable and non-available hours are considered productivetime, but only available hours are spent performing the missionof the workcenter. Non-available hours are spent away from theworkcenter on activities such as annual leave, sick leave,directors call, additional duties, etc. The MAF, which appliesto both civilian and military workyears, is the differencebetween hours assigned and hours spent on something other thanthe mission of the work center. The calculation is shown below.
167.00 Number of hours an individual is assigned per month-20.00 Number of non-available hours per month147.00 MAF
C3.5. DIRECT AND INDIRECT WORKLOAD. Direct workload is worksupporting the mission of the workcenter. Indirect workload iswork that must be done in the workcenter, but the work does notdirectly support the mission. Supervision, administration,training, meetings, supply, and clean-up are examples ofindirect work. Only direct workload is measured.

DFAS-DE SOP 1100.8JUNE 2000
3-3
(Note: Indirect workload should not be confused with non-available hours.)
C3.6. INDIRECT ALLOWANCE FACTOR (IAF). To compensate forindirect workload, an Indirect Allowance Factor (IAF) is appliedto the total direct hours measured. The IAF for accounting andfinance operations is 19.3%. The example below shows how toapply the IAF to calculate total monthly hours, assuming 100total direct hours were measured.
Step 1. Multiply 100 X 19.3% (100 X .193 = 19.30)Step 2. Add the result to measured hours (100 + 19.30 = 119.30total monthly hours)
C3.7. ADDITIVES, EXCLUSIONS, AND DEVIATIONS. Only similar workis included in standard development for all locations understudy. Work unique to one or several locations is treated as anadditive, exclusion, or deviation to the standard, and onlycredited to that location.
C3.8. POTENTIAL WORKLOAD FACTOR (PWLF) SELECTION. Beforemanpower standards can be developed, you must select theworkload factor that will be used.
C3.8.1. Explanation of Workload Factor. In very simple terms,the workload factor is the basic unit of work performed by abusiness area. For example, in a restaurant, the workloadfactor would probably be the number of meals served. Eventhough there is other work performed in the restaurant (cooking,washing dishes), the amount of work required is dependent on thenumber of meals served. Demand for staffing (waiters, cooks,dishwashers) will go up or down depending on the number of mealsserved.
C3.8.2. Selecting a Potential Workload Factor. Identify whatinput best correlates with the workload performed. Then performCorrelation and Regression Analysis (instructions in Chapter 4)to find the best fit. Figure 3-1 below shows potential WLFs foraccounting areas. (NOTE: These are examples only and notintended to be all-inclusive.)

DFAS-DE SOP 1100.8JUNE 2000
3-4
Subject Matter Area (SMA) WLF
Acquisition Section CPAS Direct DisbursementTransactions
Business Funds Section Total GAFS/BQ & SMAS TransactionsIntergovernmental Section By-others linesMAFR Section For-others linesReceivables Section Accounts Receivable Billings
Figure 3-1. Workload Factors for Accounting Areas
NOTE: The staffing standard equation, developed throughCorrelation and Regression Analysis and based on the WLF, isapplied to measured hours for each process in the subject matterarea to determine required staffing in that area. See Chapter 4for staffing standard equation development.

DFAS-DE SOP 1100.8JUNE 2000
3-5
VENDOR PAY REWORK ANALYSISCONV MONTHLY
PROCESS ITEM COUNT FREQ CODE PAT HOURS REMARKS
INVOICE, RECEIVING REPORT RETURNS, AND VOIDS
MAIL ROOMRECEIVES INVOICES/RECEIVING REPORTS AND DATESTAMPS
93,340 YR 0.08333 0.50 64.82
DOCUMENT CONTROL SECTIONPICKS UP MAIL TIME ALREADY ACCOUNTED FORRECEIVES AND REVIEWS INVOICE/RECEIVING REPORTSFOR APPLICABLE DATA
93,340 YR 0.08333 2.00 259.27
IF PROBLEM NOTED (95%):PREPARES MEMO TO IDENTIFY PROBLEM 88,673 YR 0.08333 3.00 369.46RETRIEVES FROM PRINTER 88,673 YR 0.08333 1.50 184.73PREPARES FOR MAILING 88,673 YR 0.08333 3.00 369.46HANDCARRIES TO MAIL ROOM 88,673 YR 0.08333 2.00 246.30
IF PROBLEM NOT FOUND (5%):PULLS FOLDER AND PLACES INTO DISTRIBUTION BOX 4,667 YR 0.08333 2.00 12.96
VENDOR PAY TEAMSRECEIVES, REVIEWS, AND VALIDATES FOLDER 4,667 YR 0.08333 4.00 25.93IF PROBLEM NOTED (3%)RETURNS TO DOCUMENT CONTROL FOR RETURN 2,800 YR 0.08333 2.00 7.78
DOCUMENT CONTROL SECTIONRECEIVES, REVIEWS, AND PREPARES MEMO TOIDENTIFY PROBLEM
2,800 YR 0.08333 4.00 15.56
RETRIEVES FROM PRINTER 2,800 YR 0.08333 1.50 5.83PREPARES FOR MAILING 2,800 YR 0.08333 3.00 11.67HANDCARRIES TO MAIL ROOM 2,800 YR 0.08333 2.00 7.78IF PROBLEM NOT FOUND (2%)DISTRIBUTES FOR CERTIFICATION 1,867 YR 0.08333 1.00 2.59
CERTIFICATION TEAM
Figure 3-2. Standard Data Collection Spreadsheet
DFAS-DE SOP 1100.8JUNE 2000
3-6
CONV MONTHLY
PROCESS ITEM COUNT FREQ CODE PAT HOURS REMARKS
RECEIVES, REVIEWS, AND CERTIFIES OR VOIDS1,867 PLUS AN ADDITIONAL 102,465 FOR A TOTALOF 104,332 PAYMENTS YEARLY
104,332 YR 0.08333 6.00 869.40
APPROXIMATELY 30% OF PAYMENTS ARE RETURNED TOVENDOR PAY TEAM FOR CORRECTIONANNOTATES SUMMARY OF PROBLEM ON APPLICABLEDOCUMENT
31,300 YR 0.08333 3.00 130.41
HANDCARRIES TO APPROPRIATE VENDOR PAY TEAM 31,300 YR 0.08333 2.00 86.94LOGS ONTO IAPS AND MAKES CORRECTON 31,300 YR 0.08333 2.00 86.94RETURNS TO CERTIFICATION TEAM 31,300 YR 0.08333 2.00 86.94APPROXIMATELY 70% OF PAYMENTS ARE RETURNED TOCUSTOMER FOR APPLICABLE INFORMATION/CORRECTION
VENDOR PAY TEAMSRETURNS TO VENDOR PAY TO VOID 73,032 YR 0.08333 2.00 202.86VENDOR PAY TEAM LOGS ON IAPS AND VOIDSPAYMENT
73,032 YR 0.08333 2.00 202.86
RETURNS TO DOCUMENT CONTROL FOR RETURN 73,032 YR 0.08333 2.00 202.86DOCUMENT CONTROL SECTION
RECEIVES, REVIEWS, AND PREPARES MEMO TOIDENTIFY PROBLEM
73,032 YR 0.08333 4.00 405.72
RETRIEVES FROM PRINTER 73,032 YR 0.08333 1.50 152.14PREPARES FOR MAILING 73,032 YR 0.08333 3.00 304.29HANDCARRIES TO MAILROOM 73,032 YR 0.08333 2.00 202.86
MAILROOMRECEIVES VOIDED DOCUMENTS AND DATE STAMPS 73,032 YR 0.08333 0.50 50.71
VENDOR PAY TEAMSRECEIVES, REVIEWS, AND LOGS ONTO IAPS TO MAKECORRECTION AND SCHEDULE PAYMENT
73,032 YR 0.08333 4.50 456.43
CERTIFICATION TEAMRECERTIFIES 104,332 TIME ALREADY ACCOUNTED FOR
MONTHLY HOURS 5025.49MONTH HOURS W/INDIRECT 5995.41
TOTAL STAFFING REQUIREMENT 40.79
Figure 3-2 (continued)

DFAS-DE SOP 1100.8JUNE 2000
4-1
C.4. CHAPTER 4
DATA ANALYSIS
C4.1. PURPOSE OF DATA ANALYSIS. During the data analysisphase, measured data is subjected to intense analysis to ensureaccuracy and completeness. The staffing standard is establishedduring this phase. Computed hours are calculated based on thestaffing standard, and required staffing for each workloadfactor is determined based on computed hours.
C4.2. LOGIC CHECK. The measured data must pass a logic check.For example, suppose your measurement shows a workcenterrequires 20 workyears to perform the workload. However, theworkcenter has performed the workload with 10 employees for thepast five years. Logic tells you the measurement is suspect.There may be a simple mathematical or typographical error. Ifnot, a work count may have been over-stated or an accomplishmenttime over-estimated. Talk to your POC at the study location tosee if the discrepancy can be identified. If not, considerusing other sources, such as Resource Analysis Decision SupportSystem (RADSS), to get an accurate work count. You may need toactually observe a process being done so it can be timed.
C4.3. BACKLOG AND OVERTIME. Backlog and overtime must beconsidered during the data analysis phase.
C4.4. CORRELATION AND REGRESSION ANALYSIS. The most importanttask during this phase is correlation and regression analysiswhich serves three purposes.
- To prepare the staffing standard equation.- To calculate computed hours based on the staffing standard equation.- To develop equation statistics which show whether deviations in measurement from one study location to another are within expected tolerances.
See Figure 4-1 for a sample of the Correlation and RegressionAnalysis Worksheet and instructions for creating it. Complete acorrelation and regression analysis worksheet for each workloadfactor identified.
C4.5. COMPUTED VS MEASURED HOURS. Measured hours show datacollected from each study location individually. Computed hoursadjust each location’s measured hours based on data collectedfrom all measurement locations. Because computed hours consider

DFAS-DE SOP 1100.8JUNE 2000
4-2
input from several different study locations performing the sametask, they provide a more reliable assessment of how much timeis actually required to perform the task.
C4.6. USING THE STAFFING EQUATION TO CALCULATE COMPUTED HOURS.The staffing equation, developed through correlation andregression analysis, is used to calculate computed hours. Inthe sample shown in Figure 4-1, the equation is Y =3.33+.0844(X). Notice that 3.33 is the Y intercept figured bythe computer and .0844 is the X intercept figured by thecomputer.
Y = Computed HoursX = Workload
The calculations below show how to apply the equation to figureOmaha’s computed hours as shown on the sample worksheet.
Y = 3.33+.0844*(X)Y = 3.33+.0844*(1803)Y = 155.59 (Computed hours)
C4.7. EQUATION STATISTICS. Equation statistics are usefulbecause they provide a scientific method for measuringdeviations. The most important entry in the equation statisticspart of the spreadsheet is the R Square. This statistic, alsoknown as the explained variation, shows whether differences intime required to perform a given task from one OPLOC to anotherare within the expected range. If the R Square is 75% orhigher, differences fall within the expected range and nofurther action is necessary. If the R Square is less than 75%,differences are not within the expected range and you mustdetermine why. An error may have been made in data collection,or there may be a legitimate reason for the difference. Ifthere’s a legitimate reason, you will need to process it as adeviation or variance.
C4.8. FIGURING EXTRAPOLATION LIMITS. After you figure computedhours for all study locations, calculate upper and lowerextrapolation limits. The staffing equation can be used todetermine required staffing until extrapolation limits arereached. If workload volume changes to the point where computedhours exceed or fall below the limits, a new measurement isnecessary. The upper limit is 25% more than the highestcomputed hours and the lower limit is 25% below the lowestcomputed hours.

DFAS-DE SOP 1100.8JUNE 2000
4-3
C4.9. COORDINATION OF PRELIMINARY STUDY RESULTS. After youcomplete data analysis, submit preliminary study results tomanagement at the study location. Address any concerns theyhave, and obtain concurrence. When you receive concurrence, youare ready to write the final report. The final report isdiscussed in Chapter 2. (NOTE: If agreement cannot be reachedbetween the team leader and the Director of the organizationunder study, elevate the issue to DFAS-DE/C management forresolution.)

DFAS-DE SOP 1100.8JUNE 2000
4-4
Correlation and Regression Analysis Worksheet
Subject Matter Area: Customer Service (Air National Guard)Workload Factor: CertificationsSpecial Considerations: None
OPLOC Workload Measured Computed Equation Statistics1 Omaha 1803 160.6 155.59 Multiple R 0.995848411
2 Limestone 2825 230.7 241.88 R Square 0.991714058
3 Dayton 3821 334.21 325.99 Adjusted R Square 0.987571087
4 San Bernardino 4318 365.9 367.95 Standard Error 10.53716165
Observations 4
NOTE: Steps 9 - 12 on the attached procedures showhow to develop a graph showing the relationship ofworkload to staff hours. The graph is normallypresented in this area of the worksheet, but due tosoftware limitations, it cannot be shown here.
Y Intercept 3.339688281
X Variable 0.084440452
Upper Limit 459.94
Lower Limit 116.69
Equation Y=3.33+.0844(X)
Figure 4-1. Correlation and Regression Analysis

DFAS-DE SOP 1100.8JUNE 2000
4-5
PROCEDURES TO PERFORM
CORRELATION AND REGRESSION ANALYSIS
STEP ACTION1 Open Microsoft Excel program
2 Identify Subject Matter Area (SMA), Workload Factor,and any special considerations.
3 Load measurement locations, workload count, andmeasurement hours
4 Select tools, data analysis, and regression
5 Mark Y (measured) input and X (Workload) input
6 Statistics are provided (most important is R square;explained deviation). Also, a-intercept and bvariable are provided to develop equation, i.e., Y =a + b = c
7 Derive computed hours by applying equation
8 Compute extrapolation limits (upper and lowerlimits):
Upper limit = 25% more than highest computed hoursLower limit = 25% less than the lowest computed hours
9 Select CHART WIZARD to develop graph
10 Select line chart
11 Mark data range (measurement locations, workload,measured, and computed columns
12 Identify title, (x) axis, and (Y) axis
13 Print completed excel spreadsheet
Figure 4-1 (Continued)