
Planning and Saving for Retirement Annamaria Lusardi Denit Trust ...
34
1 Planning and Saving for Retirement Annamaria Lusardi Denit Trust Distinguished Scholar and Chair Professor of Economics and Accountancy The George Washington School of Business Academic Director, Global Financial Literacy Excellence Center I would like to thank anonymous referees and Rob Alessie, Patty Anderson, Doug Bernheim, Norman Bradburn, Greg Duncan, Jeff Dominitz, Sven Feldman, Mike Hurd, David Laibson, George Loewenstein, David Loughran, Erzo Luttmer, Bob Michael, Susan Mayer, Matthew Rabin, Jon Skinner, Noriyuki Takayama, Dick Thaler, Steve Venti, Mark Warshawsky, and participants at several seminars and conferences for suggestions and comments. Financial support from the National Science Foundation (grant n. SES 9905453), the National Institute on Aging (grant n. R01-AG13893), and the Boston College Center for Retirement Research is gratefully acknowledged. Any errors are my responsibility.
Transcript of Planning and Saving for Retirement Annamaria Lusardi Denit Trust ...

1
Planning and Saving for Retirement
Annamaria Lusardi
Denit Trust Distinguished Scholar and Chair Professor of Economics and Accountancy The George Washington School of Business
Academic Director, Global Financial Literacy Excellence Center
I would like to thank anonymous referees and Rob Alessie, Patty Anderson, Doug Bernheim, Norman Bradburn, Greg Duncan, Jeff Dominitz, Sven Feldman, Mike Hurd, David Laibson, George Loewenstein, David Loughran, Erzo Luttmer, Bob Michael, Susan Mayer, Matthew Rabin, Jon Skinner, Noriyuki Takayama, Dick Thaler, Steve Venti, Mark Warshawsky, and participants at several seminars and conferences for suggestions and comments. Financial support from the National Science Foundation (grant n. SES 9905453), the National Institute on Aging (grant n. R01-AG13893), and the Boston College Center for Retirement Research is gratefully acknowledged. Any errors are my responsibility.

2
1. Introduction
In the United States and around the world, individuals and their families are
increasingly responsible for securing their own financial well-being. Prior to the 1980s,
many U.S. workers relied for their retirement security mainly on Social Security and
employer-sponsored defined benefit (DB) pension plans. Today, by contrast, Baby
Boomers are increasingly relying on defined contribution (DC) plans and Individual
Retirement Accounts (IRAs) to finance their golden years. Indeed, in 1980, about 40
percent of private-sector pension contributions went to DC plans; by the year 2000,
almost 90 percent of such contributions went to personal accounts—mostly 401(k) plans
(Poterba, Venti, and Wise, 2008). The transition to the DC retirement saving model has
the advantage of permitting more worker flexibility and labor mobility than in the past,
yet it also imposes a greater responsibility on individuals to save, invest, and decumulate
their retirement wealth sensibly. Moreover, as many DB plans have been frozen or
terminated, the individually managed accounts will increasingly become the mainstay of
retirement. For this reason, individuals are increasingly being called to “roll their own”
retirement saving and their financial security in retirement will depend on their own
financial decisions and behavior.
Given this trend toward individual responsibility, in this chapter, I investigate the
extent to which Americans are well equipped to make decisions about their pensions.
Specifically, I study whether older workers have made plans for retirement as well as
examine their retirement savings. The analysis is facilitated by a rich data set covering

3
American adults (50 +)—the Health and Retirement Study— which provides an
extensive set of information not available in other surveys. I show that approximately 30
percent of household heads have done little or no planning for retirement, even though
they are not far away from it. This is an important finding because lack of planning can
be linked to lack of retirement savings; even after accounting for many demographic and
socio-economic characteristics, I find substantially lower savings among households
whose head does not plan as opposed to households whose head has done some planning.
Most importantly, those who do not plan are more likely to face difficulty in retirement.
These findings have implications for both public policy and for employers. The
ageing of the population makes the changes we are witnessing in pension and Social
Security systems likely to stay. Thus, with this new system of self-directed retirement
accounts, policy makers need to make sure that workers are accumulating adequately for
their retirement. Employers as well may play a role in helping workers prepare for
retirement, for example by providing retirement seminars and financial education
programs in the workplace. Finally, having a better understanding of retirement planning
and savings is important not only to advance our knowledge of individual behavior but
also to increase the effectiveness of saving incentives.
The chapter is organized as follows: Section 2 examines the empirical evidence
on planning and the effects of planning on savings. Section 3 describes the empirical
work. Section 4 discusses my findings and the link with financial literacy. Section 5
provides implications for public policy and workplace financial education programs.

4
2. Evidence on planning
The life-cycle permanent income model has been the basis for most of the
research on household saving behavior, including retirement savings. The basic
assumption of this model is that individuals make consumption and saving decisions
considering their lifetime resources; thus, individuals plan ahead, they anticipate the
income decline at retirement and save during the working years to offset it. While Social
Security and DB pensions in the past ensured that workers saved for retirement
throughout their working life, today DC pensions and other self-directed retirement
accounts shifted the responsibility to save and accumulate retirement savings onto
workers. Thus, workers are now in charge of planning and saving for their retirement.
Retirement planning is a complex process; for example, the information required
for making saving decisions is extensive, and rules concerning Social Security and
pensions are elaborate. Little investigation has been done on how households make
saving plans, how they collect the information necessary for making savings decisions,
and whether they have the skills necessary to effectively use that information. Almost all
theoretical frameworks for savings assume that there are no planning costs and no
differences in how individuals access and evaluate information and how they overcome
the difficulties inherent in devising saving plans. However, as argued by Lusardi (1999),
individuals differ in their capacity to plan and differences in devising and carrying out
saving plans can be powerful determinants of wealth holdings.
In this chapter, I use data from the first wave of the U.S. Health and Retirement
Study (HRS), a sample covering respondents 50 and older, to examine the determinants

5
of retirement planning and the effects of planning on wealth accumulation. There are two
main advantages of using the HRS. First, it covers older respondents who are ten to
fifteen years away from retirement and, thus, should be close to the peak of their wealth
accumulation Second, this wave provides information about retirement planning, which is
not present in other data sets and, as will be explained later in the chapter, can be
combined with a rich set of information about the individual and his/her household.
In the HRS, respondents are asked to report how much they have thought about
retirement. Respondents can only choose from four different answers, which are reported
at the top of Table 1. Given the focus on retirement planning, in my empirical analysis I
consider the total sample of HRS households but exclude those households whose
respondents are partially or fully retired and respondents younger than 50 or older than
61.
{Insert Table 1: Who thinks about retirement?}
Table 1 shows that approximately one-third of HRS respondents have ‘hardly
thought’ about retirement. This is a large percentage, considering that many respondents
are only a few years from retirement. Lusardi and Mitchell (2011a) show that this finding
is not specific to the first wave of the HRS, but it is replicated in other years, when
specific modules about retirement planning have been added to the HRS. Moreover, this
finding has been replicated using other data sets (2011c). Table 1 also shows there are
also noticeable differences: Respondents who have not thought about retirement are more
likely to have low educational attainment and to have parents with low educational
attainment, more likely to be single, and less likely to have older siblings (older than age

6
62). Additionally, respondents who have hardly thought about retirement receive the
worst average scores on several cognitive measures. These measures include (1) ability to
think quickly (a score of one means excellent; five means poor); (2) memory, measured
by the number of words a person is able to recall in two subsequent trials (the total
number of words is 20, and the total score therefore goes from 0 to 40); and (3) analogy,
which is measured by the ability to report how some things are alike (there are seven
questions totaling 2 points each for a total score of 14). Respondents who do not plan
receive the worst average scores on all cognitive measures and in particular, on the
analogy question, variables that have not been considered so far in models of saving but
that highlight that the ability to plan may differ widely among individuals.
To pursue this point forward, I examine data from the Survey of Consumer
Finances in a similar time period (1995) on the sources of information individuals use for
making saving and investment decisions. Most respondents cited informal sources, such
as relatives and friends. However, there were again notable differences across levels of
education: Households headed by individuals with higher education (more than a high
school education) rely also on formal sources, such as on planners and brokers, and
accountants and lawyers. Moreover, these respondents rely more often on magazines and
newspapers, again suggesting there are more differences among individuals in the ability
to use and elaborate information than have been incorporated into traditional models of
saving.
Planning efforts can also be influenced by the difficulty of the task and by how
unpleasant it is. Retirement is not a pleasant event for everyone. In fact, some may view

7
it as a time when one is unproductive, lonely, or unhealthy. There is some evidence in
support of this hypothesis in the HRS. Table 2 show a list of unpleasant aspects of
retirement and how much respondents worry about them. For a sizable fraction,
retirement is not necessarily an event to look forward to. Most importantly, the table
indicates that health problems represent a worry for many respondents, and I will try to
use this insight to explain differences in planning behavior.
{Insert Table 2: Some unpleasant facts about retirement}
One of the reasons it is important to study planning is that it correlates strongly
with wealth. In Table 3, I report a simple classification of household net worth across
how much respondents have thought about retirement.1 Two major findings emerge from
this table. First, even though individuals are only ten to fifteen years away from
retirement, many report very low amounts of savings. Second and most importantly,
respondents who have ‘hardly’ thought about retirement have median wealth holdings
that are almost half the size of those who have thought ‘a little’ or ‘a lot’ about
retirement, and many households in the former group report negative or little savings.
{Insert Table 3: Thinking about retirement and savings}
It is not easy to interpret this evidence and whether there is a causal relationship
between wealth and retirement planning, a topic which will be addressed in the next
section.
3. Explaining planning and household savings
One of the advantages of using the HRS is that it provides extensive information
8
on individual respondents. Below, I examine four sets of information not available in
many other surveys that can offer additional insight into household saving behavior and
accumulation patterns.
1) Expectations about the future: Saving is inherently related to the future. Thus,
it is critically important to account for future expectations. HRS respondents are asked
about the probability of four key future events: that home prices will increase more than
will the general price level, that Social Security will become less generous, that they will
live to 75 and 85, and that they will lose their job in the next year. These are critically
important variables to explain differences in saving, as well as different saving motives.
For example, I use the information on the probability of job loss to construct a measure of
income variation.2 If households have a precautionary saving motive, they care not only
about the decline in income at retirement, but also about risk. Precautionary motive is
important and is another potential explanation for the lack of a long planning horizon.
2) Past economic circumstances: Respondents are asked about negative economic
shocks such as whether they have been unemployed or had difficulty meeting financial
needs. They are also asked about positive shocks: have they received inheritances, money
from insurance settlements or money from relatives and friends. These negative and
positive shocks can be another important explanation for the empirically observed
differences in wealth holdings close to retirement.
3) Preferences: Another, not yet well explored, way in which households can
differ is preferences. While it is hard to measure individual preferences, parameters such
as the risk aversion coefficient or the rate of time preference play a pivotal role in many

9
models of intertemporal optimization. To construct proxies for the coefficient of risk
aversion, I use the analysis provided in Barsky, Kimball, Juster and Shapiro (1997) on
willingness to gamble. I also use data on smoking, drinking, caring about one’s health
and exercising regularly to proxy for rate of time preference and/or individual
heterogeneity. Demographic variables such as education, race and country of origin that
could be related to rate of time preference are also included in the empirical estimation
(Lawrance 1991).
4) Pension and Social Security wealth: Using the HRS, it is possible to link to
respondent Social Security records to calculate Social Security wealth. For households
that have not authorized that access, Social Security wealth data has been imputed.3 This
information, combined with self-reported pension information,4 enables me to rely on a
complete measure of household wealth accumulation.
This rich set of data allows me to study the determinant of savings and, in
particular, whether planning plays a role in explaining savings, even after accounting for
the many variables that can explain savings. In the empirical work I consider several
measures of savings (all of them normalized by dividing by permanent income).5 To
construct the final sample for my empirical work, I deleted those respondents who do not
report information on the set of variables described above. The self-employed are not
asked many of the questions about subjective future probabilities and they are deleted
from the sample. Since the distribution of the ratio of savings to permanent income is so
wide, I trim it and exclude the top and bottom 1 percent.
I consider a large set of controls in my empirical regressions. Among the set of

10
explanatory variables, I consider not only age and age squared to capture the hump-
shaped profile of wealth holdings, but also some simple demographics such as total
number of children, number of children living at home, gender, race, country of birth,
marital status and education that can account for heterogeneity in tastes. I also include
dummies for region of residence. Permanent income is included among the regressors to
account for nonhomothetic preferences. I also account for health status, past shocks,
proxies for risk aversion and impatience, and expectations about the future using the
variables explained in the previous section. Additionally, I account for both Social
Security and pension wealth (these variables, as the left-hand side variable, are divided
by permanent income).
As illustrated in Table 3, respondents who have ‘hardly thought’ about retirement
represent a large group of the population and stand out in terms of savings. I have thus
defined a simple planning dummy that takes the value of one if respondents have ‘hardly
thought’ about retirement. Thinking about retirement is one indicator for retirement
planning, but I can use additional planning information available in the HRS to construct
an index that measures a series of activities relating to retirement planning. I construct
this index as follows: I assign points to respondents depending on how much they have
thought about retirement (‘hardly thought’ about retirement = 1 point; ‘a lot’ of thought
about retirement = 4 points), and I add points for each additional planning activity as
follows: 1 point if respondents have asked the Social Security administration for a
benefits calculation, another point if they ever attended a retirement seminar. In the
empirical regressions reported below I use both indicators of planning.

11
In performing the empirical work, I cannot simply regress saving on whether
households have planned for retirement since planning can be a choice variable.
Additionally, the variables measuring planning are themselves proxies and may be
affected by measurement error.6 I address these problems by performing Instrumental
Variables (IV) estimation.
As argued in the previous sections, search and psychological costs can affect
planning. I use the age of siblings to proxy for these costs. One simple and inexpensive
way to learn is through the experience of siblings, particularly older siblings who may
already have experience with retirement and savings. Table 1 shows that respondents
with older siblings are more likely to think about retirement and the evidence from the
SCF tells us that relatives and friends are often consulted about financial decisions. Since
birth order may capture specific personality features (some have argued that a first born is
less likely to rebel), and there can be interaction and learning from members of the family
other than the eldest siblings, I have also used the age of siblings of the respondent’
spouse. Inclusion of this variable could also keep the problem of genetic transmission of
preferences from being an issue. 7
The instrument I use is the difference between the age of the oldest sibling in the
family (considering both respondent and his/her spouse) and the age of the respondent.
(This difference is set to zero for respondents without siblings or with only younger
siblings). Note that the age difference is not small. For respondents with older siblings,
the difference is six years on average. Additionally, many HRS households have siblings
who have passed the retirement age (older than 62); thus, the potential for learning is

12
present. I also use the number of older siblings to capture the interaction and learning
potential and the difference squared to capture potential nonlinearities. Lastly, since the
number of siblings could proxy for inheritances, I also add a control variable for whether
at least one parent is still alive.
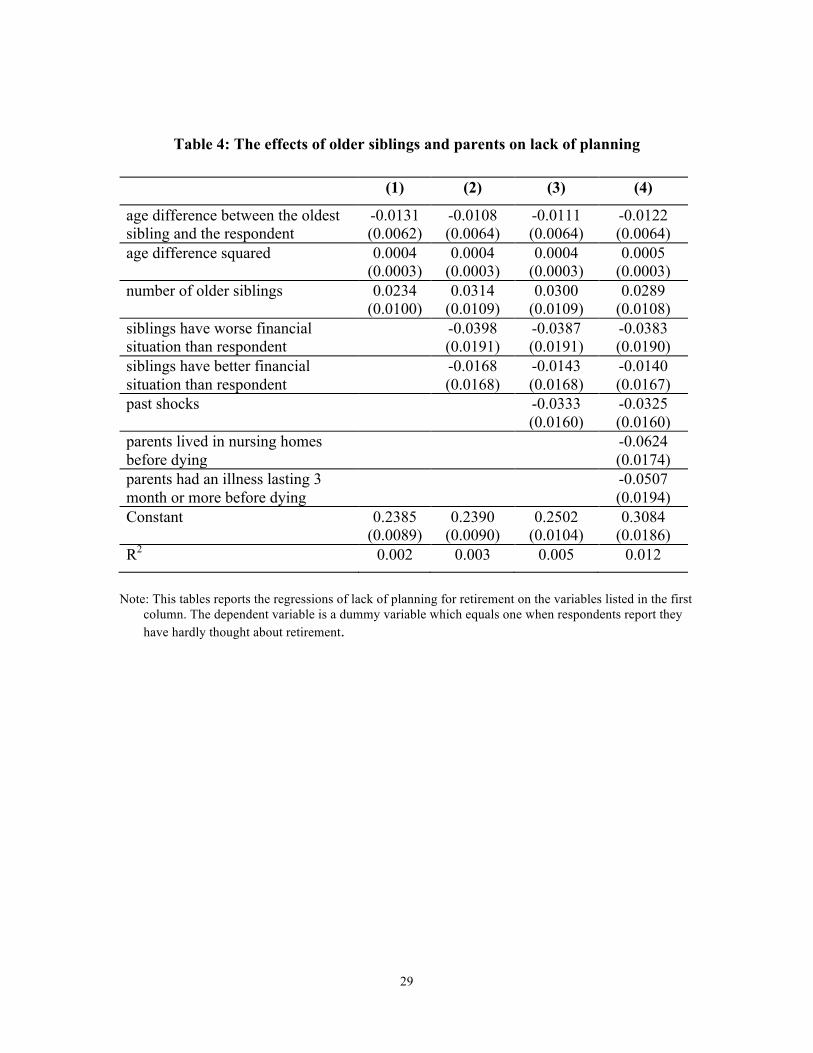
In Table 4 (column 1), I report the results of regressing the simple dummy for not
thinking about retirement on these variables. The age difference is a good predictor for
planning; respondents with older siblings are more likely to think about retirement. The
table also shows that respondents who have older siblings in worse financial condition
than their own are more likely to plan for retirement (see Table 4, column 2). Thus, in
addition to getting information about retirement from older siblings, one can also learn
from their mistakes. Moreover, witnessing the financial difficulties of siblings perhaps
diminishes the reluctance to undertake an unpleasant task. These variables remain
significant even when accounting for the large set of controls used in the regressions.
Apart from the experience of siblings, individuals can learn from their own past
experiences. HRS respondents are asked whether ‘in the last 20 years there were any
really large expenses or events that have made it very difficult to meet your financial
goals.’ Interestingly, respondents who experienced past shocks are much more likely to
plan for retirement (Table 4, column 3). Past events can provide valuable information
and, in particular, can provide incentives for putting effort into an unpleasant task. This
finding holds true in different time periods and when using different data sets (Lusardi
and Mitchell 2011c). Note, however, that I cannot use past shocks as instruments, as past
events can have a direct effect on wealth. Households that experienced past shocks could
13
have suffered a substantial drain of resources and may therefore display lower wealth
holdings than households who did not experience those shocks. Thus, past shocks are
also used as controls in the second stage regressions.8
{Insert Table 4: The effects of older siblings and parents on lack of planning}
As mentioned before, some of the psychological costs associated with planning
might be the negative associations with or fears about retirement. As reported in Table 2,
health is the concern about retirement cited most often by respondents. One way to
capture these costs is to use information about respondent’s parents. Respondents may be
afraid of being unhealthy after retirement if their parents have been unhealthy. Not only
can illness be genetically transmitted, but the health problems of a parent can be very
painful experiences. The HRS provides information about whether the mother/father of
the respondent (and spouse) had an illness lasting three months or more during the last
year she/he was alive, and whether they ever lived in nursing homes. The health
experience of parents, while causing worry and making planning more unpleasant, can
also provide information on the costs one may incur after retirement. Thus, the sign of
these variables is ambiguous ex-ante. The empirical evidence shows that, consistent with
the evidence from negative shocks, respondents whose parents suffered health problems
before dying or lived in nursing homes are more likely to think about retirement, further
indicating that painful events induce individuals to put effort into planning for
retirement.9
Information about siblings and parents continues to maintain predictive power
even after accounting for the other economic variables listed above. The predictive power

14
of the instruments is not very high, but the F-test on the excluded instruments rejects the
hypothesis that the instruments are not jointly significant. To increase the predictive
power, I have used additional information about siblings, such as whether siblings are
female, have a house, and are employed. Additional demographic information about
siblings (whether they are married, have children, etc.) has been used to perform checks
and sensitivity analysis using different sets of instruments. The instruments appear to be
valid; the test of overidentifying restrictions is not rejected (see last row of Table 5). Even
though this test may have low power, it reports additional evidence in favor of the chosen
specification and the set of instruments.
I perform the empirical estimation using two measures of savings: total net worth
and financial net worth. In the latter I exclude housing (and other real estate) equity,
vehicles, and business equity since it is not clear that these assets are meant to support
retirement consumption. I use a large set of explanatory variables and indicators for
retirement planning (the dummy for not thinking about retirement is used in columns 2–5
in Table 5, the index for retirement planning is used in columns 6–9).
{Insert Table 5: Explaining household savings}
The most important result of these regressions is that households who have not
thought about retirement end up having much lower savings than households who have
thought (a little or a lot) about retirement. The dummy for lack of planning is negative
and statistically significant. The index for planning shows a similar effect. Respondents
who have taken steps toward retirement planning accumulate more wealth. Thus,
planning continues to have an effect, even after accounting for many of the variables that
15
can explain saving behavior. The estimates indicate very large effects: Respondents who
do not plan have approximately half the savings of respondents who have done some
planning.
3.1 Reduced-form estimation
Since there are concerns about IV estimation when instruments are weak, in this
section I opt for a very simple estimation method. Rather than instrumenting for
planning, I use these variables directly in the savings regressions. If the experience of
older siblings or past shocks induce households to plan for retirement, I should be able to
directly capture this effect by inserting these variables in place of the planning variables.
In Table 6, I report the empirical estimates of regressing total and financial net worth
over permanent income on the set of variables mentioned before (same as in Table 5) and
the variables directly proxing for planning. For brevity, I report only the estimates of the
latter group of variables.
{Insert Table 6: Explaining household savings}
The age difference between the oldest sibling and the respondent is significantly
and positively related to wealth.10 Each additional year of age difference, by increasing
the opportunity for learning, increases the ratio of net worth over permanent income by
0.0208, which represents a 1 percent increase over the median ratio. The estimates for
financial net worth are much smaller and less statistically significant. When accounting
for the financial condition of siblings (better or worse than the respondent), I again find
that witnessing siblings in bad financial condition leads households to accumulate more

16
wealth. Estimates are statistically significant and sizable for both total and financial net
worth. Similarly, households accumulate more wealth when they witness their parents (in
particular, their mother) spend time in a nursing home before death. All of these variables
are jointly significant, particularly when considering net worth.
This is a robust finding. As mentioned previously, these regressions include a
very rich set of controls. The planning cost variables are unlikely to proxy, for example,
for individual longevity, past shocks, or family characteristics since I already account for
these variables in the estimated regressions. I also account for Social Security and
pension wealth—data that are often missing from other data sets on saving and which can
provide some rationale for why so many respondents do not plan for the future (i.e., they
expect to rely on pensions or Social Security). The reduced-form estimates confirm the
finding that information and learning costs affect the saving behavior of many US
households.
3.2 The consequences of planning: Evidence from retirees
The previous estimates show that individuals who do not plan for retirement end
up accumulating less wealth than individuals who do. Does this have consequences?
While planning is found to affect wealth, it could be that households who do not plan still
manage a comfortable retirement. HRS offers evidence to bear on this issue from
respondents who are partially or fully retired, reporting how much they had thought about
retirement before it was upon them and how satisfied they are with their retirement.
As in the sample of non-retired respondents, a large proportion of retirees had not

17
thought about retirement (520 out of 1172 observations). Table 7 shows that a large
proportion of the respondents who had not thought about retirement (43 percent) rate
retirement as not at all satisfying. At the other extreme, a large majority of respondents
who had thought a lot about retirement (68 percent) rate retirement as very satisfying.
{Insert Table 7. Retirement and planning}
Additionally, more than 54 percent of respondents who had not thought about
retirement rate the retirement years as ‘not as good’ as the years before retirement, while
a much smaller fraction of respondents choosing the ‘not as good’ rating had thought (a
little or a lot) about retirement. While only suggestive, this evidence shows that non-
planning households may not experience a comfortable retirement.
4. Discussion
This empirical analysis suggests is that it is too simplistic to assume that there are
no costs associated with saving decisions and retirement planning. Search costs, as well
as psychological costs, do exist and may even be sizable for some households, for
example, those with low education. These costs can be an important impediment to
retirement planning and to savings. In several other studies, I have also shown that,
financial literacy is a strong determinant of retirement planning. For example, Olivia
Mitchell and I designed a module for the 2004 HRS on financial literacy and planning
and we showed that those who know about interest compounding, inflation and risk
diversification are much more likely to plan for retirement and to accumulate wealth
(Lusardi and Mitchell 2011a, and the references therein). This module was subsequently
18
added to the 2009 National Financial Capability Study and using these more recent data,
we found again a very strong link between financial literacy and planning (Lusardi and
Mitchell, 2011c). There are several channels through which financial literacy, by making
people plan for retirement, can affect wealth holdings. One channel is via investing in
higher return assets, and there is evidence that those with higher financial literacy are
more likely to invest in stocks (van Rooij, Lusardi and Alessie 2011). Another channel is
better debt management (Lusardi and Tufano 2009), which also results in higher net
returns. Moreover, as suggested by Ameriks, Caplin and Leahy (2003), those who plan
may be better able to keep consumption low because they regularly monitor their budget.
One question that arises is how large must planning costs be to prevent so many
individuals from planning for retirement? Models taken from the psychology literature
suggest that even small costs can have large effects (Akerlof 1991, Laibson 1997,
O’Donoghue and Rabin 1999).
This work also provides suggestions to help explain the rapid decline in the US
personal saving rate during the 1990s. Many saving theories have been unable to account
for this decline. Some researchers have argued that people who grew up during the Great
Depression learned to be more frugal and financially savvy than those who grew up in
more recent (and more affluent) eras. While this explanation is often mentioned in
macroeconomics, very few studies have provided empirical evidence to support this
claim.11 However, this work does offer support for that argument. First, this paper shows
that saving behavior can be influenced by experiences of others, in particular, by
experiences of family members. Second, it shows that saving behavior is particularly

19
influenced by negative shocks. This may help to model more explicitly why some cohorts
behave differently than others.
The narrow age group in my sample does not allow me to pursue formal testing,
but other works that rely on larger samples strongly support my findings. Shea (2002)
finds that individuals who experienced, as children, their father being displaced from a
job have more wealth as adults than do individuals with otherwise similar fathers who do
not experience job loss. This reinforces the idea that children learn from the experience of
parents and in particular from negative shocks. Similarly, Cox, Ng and Waldkirch (2003)
find that children whose parents experience a large drop in consumption upon retirement
tend to subsequently reduce their own pre-retirement consumption. This again suggests
that parents’ experiences can reinforce their adult children’s motivation to save.
My findings also help explain another puzzle in the saving literature; i.e., the
enormous differences in wealth holdings we observe across education groups, as
documented by Bernheim and Scholz (1993) and Hubbard, Skinner and Zeldes (1995).
Households whose head has low educational attainment are less likely to plan, and this
may explain why such households accumulate little wealth. My findings also suggest that
removing obstacles to planning can be an effective way to stimulate savings, particularly
among low education households, as shown in Lusardi (2002), as will be discussed in
more detail in the next section.
5. Implications for public policy and workplace financial education programs
Individuals are increasingly in charge of their financial security after retirement.
The analysis reported in this paper warns there are real dangers in shifting the

20
responsibility to save onto workers without assessing whether they are equipped to make
those decisions. In fact, many workers and particularly those with low education and with
low financial literacy do not consult with others than family and friends, do not collect
information, and do not plan for retirement even when they are only ten to fifteen years
away from it. Thus, left on their own, workers may end up accumulating inadequate
savings for their retirement.
Both the government and employers have started to promote financial education
programs. Most large firms, particularly those with DC pensions, offer some form of
education program (Bernheim and Garrett, 2003). The evidence on the effectiveness of
these programs is so far rather mixed but points to positive effects. For example,
Bernheim and Garrett (2003), Lusardi, (2002, 2004) and Clark and D’Ambrosio (2008)
all find an effect of retirement seminars and workplace financial education programs on
savings. Other papers, such as Duflo and Saez (2003), find more modest effects of
education programs. However, this study also documents the importance if peer effects;
as described in this paper as well, individuals rely on the behaviors of those around them
to make financial decisions.
To help reduce planning costs, Lusardi, Keller and Keller (2008) devised a
planning aid to be distributed to new hires during employee orientation to help employees
enroll in supplementary retirement accounts. The planning aid displays several critical
features. For example, it breaks down the process of enrolling in supplementary pensions
into several small steps, describing to participants what they need to do to be able to
enroll online. Moreover, it provides several pieces of information that are needed to make

21
decisions about how much to contribute to those accounts. This simple intervention had
large effects; those who were exposed to the planning aid doubled their participation in
supplementary retirement accounts.
Another way to promote retirement planning is to promote financial literacy. As
mentioned earlier, many studies show that those who have higher financial literacy are
more likely to plan for retirement and more likely to accumulate higher amounts of
wealth. This finding has now been reproduced in many countries (Lusardi and Mitchell,
2011b). There is evidence that improving financial literacy can promote retirement
planning. In an experiment on a representative sample of the US population, individuals
were exposed to five short videos explaining in simple terms the concepts of interest
compounding, inflation, risk diversification, tax-favored assets, and employer matches.
Compared to a control group, those who were exposed to these informational videos were
found to have increased their knowledge and their capacity to answer hypothetical
questions about saving decisions. While these videos were targeted to the young, older
respondents who viewed them also increased knowledge and capacity to correctly answer
questions concerning saving decisions (Heinberg, Hung, Kapteyn, Lusardi, and Yoong,
2010).
Evidently, consumers require additional support for old-age retirement planning
and saving. As old-age dependency ratios rise across the world, and as government-
managed pay-as-you-go social security programs increasingly confront insolvency, these
issues will become increasingly important. So the crucial challenge is how to equip a
wide range of households with the necessary tools so they can build better retirement

22
plans and execute them.
References
Akerlof, G. (1991), ‘Procrastination and obedience,’American Economic Review Papers
and Proceedings, 81, 1–19.
Ameriks, J., A. Caplin and J. Leahy (2003), ‘Wealth accumulation and the propensity to
plan,’Quarterly Journal of Economics, 68, 1007–1047.
Barsky, R., M. Kimball, T. Juster and M. Shapiro (1997), ‘Preference parameters and
behavioral heterogeneity: An experimental approach in the health and retirement
survey,’ Quarterly Journal of Economics, 62, 537–579.
Bernheim, D. and D. Garrett (2003), “The Effects of Financial Education in the Workplace:
Evidence from a Survey of Households,” Journal of Public Economics, 87, 1487-1519.
Bernheim, D. and J. K. Scholz (1993), ‘Private saving and public policy,’ in James
Poterba (ed.), Tax Policy and the Economy, Cambridge, MA: MIT Press, 73–110.
Browning, M. and A. Lusardi (1996), ‘Household saving: Micro theories and micro
facts’, Journal of Economic Literature, 34, 1797–1855.
Clark, R., and M. D’Ambrosio (2008). Adjusting retirement goals and saving behavior:
The role of financial education. In Overcoming the Saving Slump: How to Increase
the Effectiveness of Financial Education and Saving Programs, edited by A. Lusardi.
Chicago: University of Chicago Press, 237-256.
Cox, D., S. Ng and A. Waldkirch (2004), ‘Intergenerational linkages in consumption

23
behavior,’ Journal of Human Resources, 39 (2), 355–381.
Duflo, E. and E. Saez (2003), “The Role of Information and Social Interactions in
Retirement Plan Decisions: Evidence from a Randomized Experiment,” Quarterly
Journal of Economics, 118, 815-842.
Gustman, A. and T. Steinmeier (2004), ‘What people don’t know about their pensions
and Social Security: An analysis using linked data from the Health and Retirement
Study,” in W. Gale, J. Shoven and M. Warshawsky (eds.), Public Policies and
Private Pensions, Washington, DC: Brookings Institutions, 57-119.
Heinberg, E., A. Hung, A. Kapteyn, A. Lusardi, and J. Yoong (2010). “ Five steps to
planning success.” Rand Working Paper No. WR-790-SSA, 2010.
Hubbard, G., J. Skinner and S. Zeldes (1995), ‘Precautionary saving and social
insurance,’ Journal of Political Economy, 103, 360–399.
Laibson, D. (1997), ‘Golden eggs and hyperbolic discounting,’ Quarterly Journal of
Economics, 112, 443–478.
Lawrance, E. (1991), ‘Poverty and the rate of time preference: Evidence from panel
data,’ Journal of Political Economy, 99, 54–77.
Lusardi, A. (2004), “Savings and the Effectiveness of Financial Education,” in O.S.
Mitchell and S. Utkus (eds.), Pension Design and Structure: New Lessons from
Behavioral Finance, Oxford: Oxford University Press, 157-184.
Lusardi, A. (2002), ‘Preparing for retirement: The importance of planning costs’,
National Tax Association Proceedings, 148–154.
Lusardi, Annamaria (1999), “Information, Expectations, and Savings for Retirement,” in

24
H. Aaron (ed), Behavioral Dimensions of Retirement Economics, Washington, D.C.:
Brookings Institution Press and Russell Sage Foundation, 81–115.
Lusardi, A. (1998), ‘On the importance of the precautionary saving motive’, American
Economic Review Papers and Proceedings, 88, 449–453.
Lusardi, A., P. Keller, and A. Keller (2008). New ways to make people save. A social
marketing approach. In Overcoming the Saving Slump: How to Increase the
Effectiveness of Financial Education and Saving Programs, edited by A. Lusardi,
Chicago: University of Chicago Press, 209–236.
Lusardi, Annamaria, and Olivia S. Mitchell (2011a), “Financial Literacy and Planning:
Implications for Retirement Wellbeing,” in O. S. Mitchell and A. Lusardi (eds.),
Financial Literacy: Implications for Retirement Security and the Financial
Marketplace. Oxford: Oxford University Press, 17–49.
Lusardi, A. and O.S. Mitchell, (2011b), ‘Financial literacy around the world: an
overview,”Journal of Pension Economics and Finance, 10, 497–508.
Lusardi, A. and O.S. Mitchell, (2011c), ‘Financial literacy and retirement planning in the
United States,”Journal of Pension Economics and Finance, 10, 509–525.
Lusardi, A. and Tufano, P. (2009), ‘Teach workers about the peril of debt,’ Harvard
Business Review, 22–24.
O’Donoghue, T. and M. Rabin (1999), ‘Doing it now or later’, American Economic
Review, 89, 103–124.
Shea, J. (2002), ‘Childhood deprivation and adult wealth’ Mimeo, University of

25
Maryland.
van Rooij, M., Lusardi, A. and Alessie, R. (2011), ‘Financial literacy and stock market
participation,’ Journal of Financial Economics, 101, 449–472.
Venti, Steven and David Wise (2001), ‘Choice, chance, and wealth dispersion at
retirement’, in S. Ogura, T. Tachibanaki and D. Wise (eds.), Aging Issues in the
United States and Japan, Chicago: University of Chicago Press, pp. 25–64.

26
Table 1: Who thinks about retirement?
How much have you thought about retirement?
A Lot Some Little Hardly at all
Total Sample
Characteristics
Less than high school 0.20 0.13 0.22 0.32 0.22 High school 0.38 0.35 0.37 0.37 0.37
More than high school 0.42 0.52 0.40 0.31 0.41 Family has high education 0.45 0.53 0.46 0.40 0.45
Married 0.64 0.68 0.61 0.53 0.61 N. of siblings older than 62 0.23 0.28 0.22 0.19 0.23
Ability to think quickly 2.29 2.20 2.25 2.42 2.30 Memory 12.9 13.8 12.9 12.6 13.1 Analogy 6.32 7.00 6.40 5.80 6.35
N. of observations 1,331 1,039 681 1,438 4,489
Note: This table reports the characteristics of respondents across different responses to the question: ‘How much have you thought about retirement?’ All figures are weighted using survey weights. Data is from the 1992 HRS.

27
Table 2: Some unpleasant facts about retirement
The prospect of illness & disability
Not doing anything productive
Being bored
Missing people at
work Worry a lot 0.23 0.12 0.09 0.07
Worry somewhat 0.29 0.17 0.16 0.23
Worry a little 0.26 0.19 0.17 0.29
Worry not at all 0.22 0.52 0.58 0.41
Note: This table reports the fraction of households according to how they rated the unpleasant facts about retirement listed in the first row. The data is from the 1992 HRS and all figures are weighted using survey weights.

28
Table 3: Thinking about retirement and savings
How much have you thought about retirement?
Percentile A lot Some A little Hardly at all
5 0 2,010 -120 -500
25 41,300 50,500 28,500 8,800
50 116,200 128,000 92,000 60,000
75 241,000 266,800 208,000 147,000
90 437,000 474,500 485,700 346,500
95 636,500 752,000 1,009,000 613,350
Mean
(Std. Dev.) 224,252
(504,987) 239,298
(422,639) 245,304
(638,957) 165,367
(448,924) N. of obs 1,331 1,039 681 1,438
Note: This table reports the distribution of total net worth across different responses to the question: ‘How much have you thought about retirement?’ All figures are weighted using survey weights.
29
Table 4: The effects of older siblings and parents on lack of planning
(1) (2) (3) (4)
age difference between the oldest sibling and the respondent
-0.0131 (0.0062)
-0.0108 (0.0064)
-0.0111 (0.0064)
-0.0122 (0.0064)
age difference squared 0.0004 (0.0003)
0.0004 (0.0003)
0.0004 (0.0003)
0.0005 (0.0003)
number of older siblings 0.0234 (0.0100)
0.0314 (0.0109)
0.0300 (0.0109)
0.0289 (0.0108)
siblings have worse financial situation than respondent
-0.0398 (0.0191)
-0.0387 (0.0191)
-0.0383 (0.0190)
siblings have better financial situation than respondent
-0.0168 (0.0168)
-0.0143 (0.0168)
-0.0140 (0.0167)
past shocks -0.0333 (0.0160)
-0.0325 (0.0160)
parents lived in nursing homes before dying
-0.0624 (0.0174)
parents had an illness lasting 3 month or more before dying
-0.0507 (0.0194)
Constant 0.2385 (0.0089)
0.2390 (0.0090)
0.2502 (0.0104)
0.3084 (0.0186)
R2 0.002 0.003 0.005 0.012
Note: This tables reports the regressions of lack of planning for retirement on the variables listed in the first
column. The dependent variable is a dummy variable which equals one when respondents report they have hardly thought about retirement.

30
Table 5: Explaining household savings
Lack of planning dummy Planning index Total Net Worth Financial Wealth Total Net Worth Financial Wealth Coeff. Std. err Coeff. Std. err Coeff. Std. err Coeff. Std. err Planning -2.3044 1.1005 -1.4086 0.5583 0.9018 0.4241 0.5584 0.2161 excellent health 0.5644 0.1820 0.1862 0.0923 0.6246 0.1961 0.2244 0.0999 very good health 0.1592 0.1616 0.0808 0.0820 0.2513 0.1715 0.1379 0.0870 good health 0.1689 0.1620 0.0992 0.0822 0.2483 0.1787 0.1490 0.0911 permanent inc./1000 -0.0275 0.0074 -0.0103 0.0038 -0.0341 0.0093 -0.0144 0.0047 past unemployment -0.1081 0.1030 0.0036 0.0523 -0.1500 0.1070 -0.0223 0.0546 past shocks -0.5783 0.1113 -0.3149 0.0565 -0.5906 0.1159 -0.3232 0.0591 received inheritances 0.5708 0.1278 0.2061 0.0648 0.5132 0.1386 0.1701 0.0706 money from relatives 0.5673 0.1840 0.1812 0.0934 0.4626 0.2049 0.1156 0.1044 money from insurance 1.0065 0.2216 0.5459 0.1124 1.0610 0.2289 0.5796 0.1166 high risk aversion 0.0441 0.1540 -0.0779 0.0781 0.0550 0.1590 -0.0704 0.0810 medium risk aversion 0.0687 0.1881 -0.1126 0.0954 0.0584 0.1934 -0.1192 0.0985 moderate risk aversion 0.1140 0.2142 -0.0501 0.1087 0.1733 0.2310 -0.0119 0.1177 variance of income 0.0032 0.0062 0.0030 0.0032 0.0031 0.0064 0.0029 0.0033 prob. live to 75 0.2201 0.1910 0.0749 0.0969 0.1705 0.1874 0.0454 0.0955 prob. SS less generous -0.0846 0.1594 0.0221 0.0809 -0.1583 0.1707 -0.0238 0.0870 prob. house price up -0.0898 0.1681 -0.1082 0.0853 -0.1190 0.1695 -0.1256 0.0864 prob. help family 0.0866 0.1534 0.0220 0.0778 0.0669 0.1583 0.0096 0.0807 Bequests 0.9879 0.0980 0.2772 0.0497 0.9437 0.1063 0.2495 0.0542 can rely on help -0.0108 0.0963 0.0104 0.0489 0.0021 0.0979 0.0181 0.0499 parent alive -0.1351 0.1090 -0.0609 0.0553 -0.1772 0.1137 -0.0870 0.0580 Smoker -0.2991 0.1107 -0.0914 0.0561 -0.3059 0.1127 -0.0952 0.0574 heavy drinker -0.2607 0.2234 -0.0589 0.1133 -0.3499 0.2414 -0.1150 0.1230 no regular exercise -0.1356 0.1016 -0.0414 0.0516 -0.0917 0.1096 -0.0140 0.0559 talk to doc about health 0.1595 0.1283 0.0790 0.0651 0.1021 0.1443 0.0424 0.0735 pension/ perm income 0.0729 0.0305 0.0117 0.0155 0.0323 0.0463 -0.0138 0.0236 SS wealth/perm inc. 0.0803 0.0234 0.0118 0.0119 0.0802 0.0240 0.0118 0.0122 Constant 1.9407 6.5397 2.5168 3.3177 -2.5367 6.4063 -0.2231 3.2651 Adjusted R2 0.0700 0.0100 0.0210 0.0009 P value of overid. test 0.232 0.909 0.299 0.953
Note: This table reports instrumental variables regressions of total and financial net worth over permanent income on the variables listed in the first column. Even though not reported, regressions include several demographic variables. Refer to the text for a complete list of the variables and a list of the instruments used in the estimation. Two indicators of planning are used in the estimation: a dummy variable, which equals one if respondents have hardly thought about retirement, and an index for planning.

31
Table 6: Explaining household savings
(1) (2) (3) (4) Total net worth
age difference between the oldest sibling and the respondent
0.0208 (0.0113)
0.0192 (0.0116)
0.0196 (0.0116)
0.0195 (0.0116)
siblings have worse financial situation than respondent
0.3521 (0.1622)
0.3468 (0.1622)
0.3458 (0.1624)
siblings have better financial situation than respondent
-0.0855 (0.01442)
-0.0841 (0.1442)
-0.0848 (0.1443)
mother lived in nursing homes before dying
0.2391 (0.1453)
0.2412 (0.1459)
father lived in nursing homes before dying
-01.280 (0.1495)
-0.1252 (0.1505)
parents had an illness lasting 3 months or more before dying
-0.0196 (0.1167)
F-test of joint significance (p. value)
3.16 (0.0239)
2.57 (0.0251)
2.14 (0.0456)
Financial net worth
age difference between the oldest sibling and the respondent
0.0078 (0.0055)
0.0068 (0.0057)
0.0069 (0.0057)
0.0070 (0.0057)
siblings have worse financial situation than respondent
0.1555 (0.0795)
0.1555 (0.0796)
0.1593 (0.0796)
siblings have better financial situation than respondent
-0.0204 (0.0707)
-0.0204 (0.0707)
-0.0178 (0.0708)
mother lived in nursing homes before dying
0.0314 (0.0713)
0.0235 (0.0716)
father lived in nursing homes before dying
-0.0512 (0.0733)
-0.0618 (0.0738)
parents had an illness lasting 3 months or more before dying
0.0734 (0.0572)
F-test of joint significance (p. value)
2.15 (0.0920)
1.42 (0.2130)
1.46 (0.1883)
Note: These tables report OLS estimates of total net worth and financial net worth over permanent income on the variables listed in the first column. Even though not reported, regressions include many variables. Refer to the text for a complete list of the variables used in the regressions.

32
Table 7. Retirement and planning How much have you thought about
retirement?
A lot Some A little Hardly at all
How has your retirement turned out to be?
Very satisfying 0.68 0.50 0.35 0.22
Moderately satisfying 0.28 0.41 0.46 0.35
Not at all satisfying 0.04 0.09 0.19 0.43
How is your retirement compared to the years just before you retired?
Better 0.57 0.44 0.35 0.18
About the same 0.22 0.31 0.36 0.24
Not as good 0.11 0.15 0.22 0.54
Retired less than 1 year ago 0.10 0.10 0.07 0.04
N. of observations 343 217 92 520
Note: This table reports the fraction of respondents according to how they have rated retirement and how much they have thought about retirement. Data is from the 1992 HRS.

33
1 Total net worth is defined as the sum of checking and savings accounts, certificate of deposits and other
short-terms assets, bonds, stocks, other assets, housing equity, other real estate, IRAs and Keoghs, business
equity, and vehicles minus all debts.
2See, also, Lusardi (1998).
3I thank Alan Gustman and Thomas Steinmeier for providing the imputed Social Security wealth data. For
more information on pension and Social Security wealth in the HRS, see Gustman and Steinmeier (2004).
4For a detailed explanation of the construction of the pension data, see Venti and Wise (2001).
5Permanent income is constructed by regressing total household income on a set of demographic and firm
characteristics. I use age and age squared, sex, race, marital status, region of residence, education and
occupation dummies and those dummies interacted with age. I also use dummies for whether the
respondent works in a small firm (fewer than 20 employees), whether the respondent belongs to a union
and whether he/she works part time. In addition, I use the expectations of losing the job in the current year,
the expectations that health problems will limit the work activity in the next 10 years and dummies for
whether income will go up or down in the following year. See also Lusardi (1998).
6 Which may derive from ambiguity in interpreting the question and/or mis-classification in picking the
appropriate answer.
7One might argue that respondents with older siblings also have older parents. There is some (suggestive)
evidence in the savings literature that households that lived through the Great Depression have different
preferences than younger generations. In particular, they are supposed to be thriftier and more alert to risk.
Those households could have passed those preferences down to their children. As discussed in Browning
and Lusardi (1996), this finding is still very controversial. Additionally, given the relatively narrow age
range of respondents, it is doubtful that differences in preferences across adjacent generations are so large.
Furthermore, given the way I have defined it, respondents could have older siblings simply because the
siblings of the spouse are older.

34
8It is useful to note that in the regressions of household savings on the large set of variables mentioned
before, the empirical estimates for past shocks become more negative when accounting for whether
households have thought about retirement.
9 Since I account for the current health status of the respondent and the subjective probability of living up to
age 75 in the regressions, these variables are not likely to account for individual longevity.
10 In this case, the variable is simply the difference between the age of the oldest sibling and the age of
respondents. Thus, it takes positive values when the sibling is older than the respondent and negative values
when the sibling is younger. This eases the interpretation of the empirical estimates. In addition to the same
set of variables reported in Table 5, the estimates reported in Table 6 account also for the number of
younger and older siblings.
11 See the discussion in Browning and Lusardi (1996).