Plankton Survey System - Great Lakes Environmental ... · c. ope and Zooplankton Net Data...
7
Plankton Survey System S. A. Ruberg, H. A. Vanderploeg, 1. F. Cavaletto, G. A. Lang, 1. R. Liebig, T. C. Miller NOANGre.t Lakes Environmental Research Laboratory 2205 Commonwealth Blvd. Ann Arbor, MI 48105 M. Agy Cooperative Institute for Limnology and Ecosystems Research University of Michigan Ann Arbor, MI 48105 Abstract - The Plankton Survey System (PSS), developed at the National Oceanic and Atmospheric Administration's (NOAA) Great Lakes Environmental Research Laboratory (GLERL), has been designed to collect high temporal and spatial resolution marine environmental data in three dimensions. The system has proven effective in providing valuable survey information before, during and after sediment re-suspension events in Lake Michigan in support of GLERL's NOAAINSF funded Episodic Events Great Lakes Experiment (EEGLE) program. The PSS is a towed multi-sensor platform capable of measuring turbidity, chlorophyll a, photosynthetically active radiation (PAR), conductivity, temperature, and zooplankton spatial distributions. All sensors are integrated using a serial data interface. All data are goo-referenced and registered with time, depth, and vehicle pitch, roll, and speed information. A deck unit supplies power for the underwater vehicle components and provides interfaces for data collection and system monitoring. System software provides real-time display of all marine environmental measurements and vehicle status. Zooplankton spatial and individual size distributions are measured using an optical plankton counter (OPC). The Ope measures particle size distributions (0.25 - 14mm) using an LED array and a photodiode receiver. Deflections caused by particles crossing the LED generated light beam (4x20xlOO mm) are detected by the receiver and digitized. Present work is focused on moving the OPC beyond use as merely a survey tool to calibrating the instrument using laboratory and field measurements. Laboratory calibration plans include the use of specified particles to establish a reference and subsequent investigations using live zooplankton samples. A range of issues involving the implications of variations in zooplankton body characteristics on OPC detection thresbold, turbidity on OPC signal-ta-noise ratio, tow vehicle orientation and vehicle and Ope channel turbulence will also be investigated. \ MTS 0-933957-28-9 l. INTRODUCTION The NOANGLERL Plankton Survey System (PSS) provides continuous, high-resolution temporal and spatial measurements in support of the EEGLE project in the southern basin of Lake Michigan [l] . Post-processing of the large data sets supplied by the PSS allows visualization of physical and biological parameters on a large geographic scale. The GLERL PSS design is based on an eXlsnng system developed by C. Taggart, Dalhousie University, Halifax, NS and by W. G. Sprules at the University of Toronto, Ontario [2]. The PSS optical plankton counter (OPC), used for zooplankton counting and sizing in the PSS, was originally developed at the Bedford Institute of Oceanography [3] in the early 1980's and is now manufactured by Focal Technologies, Inc., Dartmouth, NS. The UT system uses a type IT OPC with a 0.4x2x2Scm measurement beam while GLERL systems utilizes the smaller type 2T system with O.4x2XIOcm measurement area to reduce the likelihood of coincidence counting in fresb water where zooplankton densities are greater. II. SYSTEM DESCRIPTION A. The Plankton Survey System The NOANGLERL PSS is capable of measuring multiple pbysical and biological parameters and registers all data spatially and temporally. Parameters measured with general specifications include: OPC-ZT Zooplankton size, range: Light attenuance: Flow: Depth/pressure: '. 1899 0.25-14 mm 0-250 0.10-7.9 mls 0-350 m (O-SOOpsi)
-
Upload
dinhkhuong -
Category
Documents
-
view
217 -
download
0
Transcript of Plankton Survey System - Great Lakes Environmental ... · c. ope and Zooplankton Net Data...

Plankton Survey System
S. A. Ruberg, H. A. Vanderploeg, 1. F. Cavaletto, G. A. Lang, 1. R. Liebig, T. C. Miller NOANGre.t Lakes Environmental Research Laboratory
2205 Commonwealth Blvd. Ann Arbor, MI 48105
M. Agy Cooperative Institute for Limnology and Ecosystems Research
University of Michigan Ann Arbor, MI 48105
Abstract - The Plankton Survey System (PSS), developed at the National Oceanic and Atmospheric Administration's (NOAA) Great Lakes Environmental Research Laboratory (GLERL), has been designed to collect high temporal and spatial resolution marine environmental data in three dimensions. The system has proven effective in providing valuable survey information before, during and after sediment re-suspension events in Lake Michigan in support of GLERL's NOAAINSF funded Episodic Events Great Lakes Experiment (EEGLE) program.
The PSS is a towed multi-sensor platform capable of measuring turbidity, chlorophyll a, photosynthetically active radiation (PAR), conductivity, temperature, and zooplankton spatial distributions. All sensors are integrated using a serial data interface. All data are goo-referenced and registered with time, depth, and vehicle pitch, roll, and speed information. A deck unit supplies power for the underwater vehicle components and provides interfaces for data collection and system monitoring. System software provides real-time display of all marine environmental measurements and vehicle status.
Zooplankton spatial and individual size distributions are measured using an optical plankton counter (OPC). The Ope measures particle size distributions (0.25 - 14mm) using an LED array and a photodiode receiver. Deflections caused by particles crossing the LED generated light beam (4x20xlOO mm) are detected by the receiver and digitized. Present work is focused on moving the OPC beyond use as merely a survey tool to calibrating the instrument using laboratory and field measurements.
Laboratory calibration plans include the use of specified particles to establish a reference and subsequent investigations using live zooplankton samples. A range of issues involving the implications of variations in zooplankton body characteristics on OPC detection thresbold, turbidity on OPC signal-ta-noise ratio, tow vehicle orientation and vehicle and Ope channel turbulence will also be investigated.
\
MTS 0-933957-28-9
l. INTRODUCTION
The NOANGLERL Plankton Survey System (PSS) provides continuous, high-resolution temporal and spatial measurements in support of the EEGLE project in the southern basin of Lake Michigan [l]. Post-processing of the large data sets supplied by the PSS allows visualization of physical and biological parameters on a large geographic scale.
The GLERL PSS design is based on an eXlsnng system developed by C. Taggart, Dalhousie University, Halifax, NS and by W. G. Sprules at the University of Toronto, Ontario [2]. The PSS optical plankton counter (OPC), used for zooplankton counting and sizing in the PSS, was originally developed at the Bedford Institute of Oceanography [3] in the early 1980's and is now manufactured by Focal Technologies, Inc., Dartmouth, NS. The UT system uses a type IT OPC with a 0.4x2x2Scm measurement beam while GLERL systems utilizes the smaller type 2T system with O.4x2XIOcm measurement area to reduce the likelihood of coincidence counting in fresb water where zooplankton densities are greater.
II. SYSTEM DESCRIPTION
A. The Plankton Survey System
The NOANGLERL PSS is capable of measuring multiple pbysical and biological parameters and registers all data spatially and temporally. Parameters measured with general specifications include:
OPC-ZT
Zooplankton size, range: Light attenuance: Flow: Depth/pressure:
'.
1899
0.25-14 mm 0-250 0.10-7.9 mls 0-350 m (O-SOOpsi)

OS200 ern (Ocean Sciences, San Diego, CAl
Conductivity: Temperature: Depth: Fluorometer (Chelsea Mk IV)
0.5-65 mS -2-35 deg C 0-3000 m
• - Chlorophyl a 0.01-100 ugll PitchIRoll: +1-70 deg PAR (Biosphericallnstruments, San Diego, CAl - solar irradiance, max 1.5-2.0EI7 quanta/cm21s
Referencing fig. I , the OS200 CTD functions as the analog sensor interface while the OPC handles
I GPS
PC1 ~ PC2
OPC DECK SENSOR UNIT ~ DAS MONITOR
\ 4 conductor row cable ,-----------_._- _ ... _- --_. __ .. _ .. ...... __ ., FISH
,..----,
OS2OO CTD
! ~ ______ . . ... _____ ____ --.-J Fig. I Simplified block diagram.
data collection and data transmission. The OS2OO is designed with a 16-bit analog-to-digital (AID) converter allowing the addition of sensors in a very straightforward manner through a 6-channel interface. Signals from the pitch, roll, PAR, and fluorometer sensors are interfaced with the CTO AID converter. All data collected by the OS2OO are converted to a serial ASCII fonnat and interfaced to the OPe. Serial data is sent from the OS2OO to the OPC using frequency shift keyed modulation of a 25kHz carrier frequency to transmit the data over a conducti ve tow cable to the deck tmit on the surface. The data is then demodulated by the deck tmit where it is displayed/stored on a laptop PC. The DOS-based Lab Windows data acquisition software was designed by Focal TechnolQgies for the OPe. The software provides a histogram display of size-binned zooplankton counts or a real-time display of counts per second and a light attenuance plot. .A Win98-based user interface has been developed to display ··CTO AID channels such as PAR, chlorophyll fluorescence, and temperature data. All instrumentation is mounted on a I meter EndecoNSI V-Fin.
B. Optical Plankton Counter (OPC)
Zooplankton spatial and individual size distributions are measured using the OPe. The system has been designed to provide real-time measurements of zooplankton size and density at a spatial resolution not possible with net sampling. The measurement technique implemented in the OPC is based on particle perturbations of a light beam where previous automated zooplankton detection systems were based on the Coulter counter principle [4). The instrument counts and sizes particles (0.25 - 14mm) using an LED array and a photodiode receiver. Deflections caused by particles crossing the LED generated light beam (O.4xIOcm) are detected by the photodiode, passed through an inverting amplifier, and digitized using a 12-bit AID converter (0-4095 voltage levels). This deflection voltage, or digital size (DS) [5], is converted to an equivalent spherical diameter (ESD) using a calibration table that resides in the PC data acquisition system software. The equation governing the conversion from OS to ESD can be modified to reflect specific zooplankton body shape characteristics. A volumetric measurement of zooplankton concentrations is calculated using the flow rate from a General Oceanic. mechanical flow meter mounted external to the measurement channel.
III. SYSTEM OPERATION
The PSS hardware and software have been used on 25 separate cruises in Lake Michigan from 1998-2000, covering 130 transects, and has generated close to 200 data sets during the southern Lake Michigan EEGLE project. PSS data sets were collected along transects (fig. 2) at Racine, Chicago, Gary, New Buffalo, St. Joseph and Muskegon and compared to discrete plankton net tows collected at depths of 15, 45, and 80-110 meters along the transect.
The PSS was installed and operated on several different research vessels of varying size during the EEGLE project The system's small size (I meter v-fin) and weight (156Ibs.) allow for case of transport and installation. Data acquisition and monitoring of data collection has been straight-forward and reliable. System serup and operation is achieved with windows-based data acquisition and monitoring programs and the entry of data acquisition commands through a DOS terminal interface to the OS-200 CTD.
The PSS is operated at 3-5 lets. in a tow-yo fashion using a winch to payout cable until a specific depth is achieved and the instrument is then retrieved to the surface. This method results in a sinusoidaJ depth profile as the instrument package is towed along a specified heading. OPC data collection ...... observed to be affected by v-fin pitch angle and water turbidity. When compared to zooplankton net data, the OI'C generally provides higher estimates of zoopla.n\ctOll population numbers and biomass. These factors will be exarnilj.ed in greater detail below.
1900

Loc:otion of fZGLE Tn:lnHC:CS", T!i97-2000
6,GQry I I I I I I I I I I I o 100 M>
Fig. 2. EEGLE Study Area: Southern Lake Michigan
A. Pilch Angle
A difference in zooplankton counts on the upcast vs. the downcast was observed during data collection. In some cases 20% fewer counts are registered on the upcast when the v-fin is traveling at higher speed. The greater pitch angle in relation to the ¥-fin trajectory angle causes the Ope flow to shear as the instrument package is towed. A potential solution to this problem would be to provide an independent control of the OPC pitch to maximize flow in the channel.
Flow measurement could also contribute to the difference. This parameter is currently measured external to the OPC channel. In-channel flow measurement is currently under development by Focal Technologies as it will provide a more reliable estimate for volumetric calculations.
B. Turbidity effects
OPC counts were observed to decrease at the very high lUlbidity levels seen during Lake Michigan sediment plume events. Based on laboratory analysis of water samples collected during field operations and on transmissometer readings, the counts appear to be affected when total suspended matter exceeds 20 mgll. This corresponds to OPC light attenuance readings of LA>195. As LA approaches a reading of 220 (-30 mgll TSM), Ope counts approach zero.
Zooplankton net data collected during this transect appear to be independent of lUlbidity.
The OPC was modified to obtain higher output power from the LED array to reduce the effects of high lUlbidity on data collection. While the OPC has been operated in plume events with elevated TSM levels since this modification, data has not been collected during a sediment re-suspension event with TSM levels exceeding 20 mgll.
10
Fig. 3. Zooplankton Counts and Turbidity
c. ope and Zooplankton Net Data
Zooplankton net tows were collected by vertical hauls
of a metered 15311J11 mesh zooplankton net (O.5m diameter) from two meters above the bottom to the surface. In the laboratory, at least 600 animals were cOWlted and identified for each replicate net tow. A volumetric calculation of population density and biomass obtained from ope COWlIS, size and flow meter data on the final upcast of the transect at the 45m St. Joseph station is plotted with zooplankton net data in figs. 4 and 5.
1901
Zoopl_nkton Abundance 1999
25000 ,--------r !2oooo g 15000 +-----• 10000 h_-II---n~ ~5OOO
o Feb Mar Apr Jun Jul Sep Dec
• Net
DOpe
Fig. 4. ,Zooplankton Abundance - ope and Nets
'.

In general, the OPC resulted in significantly higher estimates than net tows for zooplankton counts and biomass in the wintertspring months and, with exception of July, closer correlation in the latter part of the year. There are a nwnber of variables that can affect the outcome of accurate measurements when using the OPC such as coincidence counting [6] and v-fin turbulence effects including those already discussed. Likewise the traditional method of data collection using the plankton net tow can present uncertainty
Zooplankton Biomass 1999
OOr----------------------.
i 60 1---,,..----,
-; 40 t--=--t 1---- --'
j 20 III o
Feb Mar Apr Jun Jul Sep Dec
Fig. 5. Biomass - OPC and Nets
.Net
Dope
in obtaining accurate measurements due to sample extrusion and net clogging. In the case of the 1531lID net used for this inter-comparison, it is possible that zooplankton close to the lower edge of the OPC detection range of 250llID have a small enough body diameter to be pushed through the net mesh. Since many freshwater copepods have a body length to diameter ratio of 3: I. zooplankton in the <4001lID ESD size range could be counted by the OPC but be extruded through the sampling net. In the latter part of the year, individual zooplankton may be larger in size and not as easily extruded through the net.
V. DATA POST-PROCESSING
Raw PSS data is converted into two file types for further analysis. The "text" file contains individual zooplankton lengths and weights per half second ofPSS tow, and is useful in size-frequency analyses. The "chan" file contains the same information, but is first binned into three size categories (e.g. O.25-0.5mm, O.5-1.0mm, 1.0-4.0mm), and is useful in community structure analyses. Also included in both file types are the GPS coordinates, OPC depth, flow rate, and measures of light attenuance, water temperature, chlorophyll fluorescence, and (more recently) PAR. IDL (Interactive Data Language, www.rsinc.com) programs were developed to read either "text" file or "chart" file PSS data, perform all necessary conversions and analyses, and generate various products. These products include time series of PSS depth, flow rate and pitch and roll, as well as spatial distributions of PSS depth, fluorescence, water temperature, light attenuance, PAR, zooplankton counts and zooplankton biomass. In addition, a nearest neighbor technique was used to contour the above parameters as functions of depth and distance from shore (figs. 7 and 8).
VI. CONCLUSION
High resolution temporal and spatial data collection using the PSS in conjunction with a visualization approach to data post-processing provides valuable large scale observations of marine environmental systems. Towing the multi-sensor system during coastal sedimept plwne events (fig. 6) has provided insight in to the physical and biological characteristics of this episodic event in southern Lake Michigan and resulted in additional research projects.
'.
1902
Fig. 6. Sediment Re-suspension Event
'"
Coas1Wcteh C9a071,t J.IC1 (D/'Z/~
.10 011 19:00Z 1fOIIoII.-14
: .00
"r---~~~--------~------~~------~"
..
Fig. 7. SI. Joseph, MI Transect - March 1998
,.. ,. 1.-'
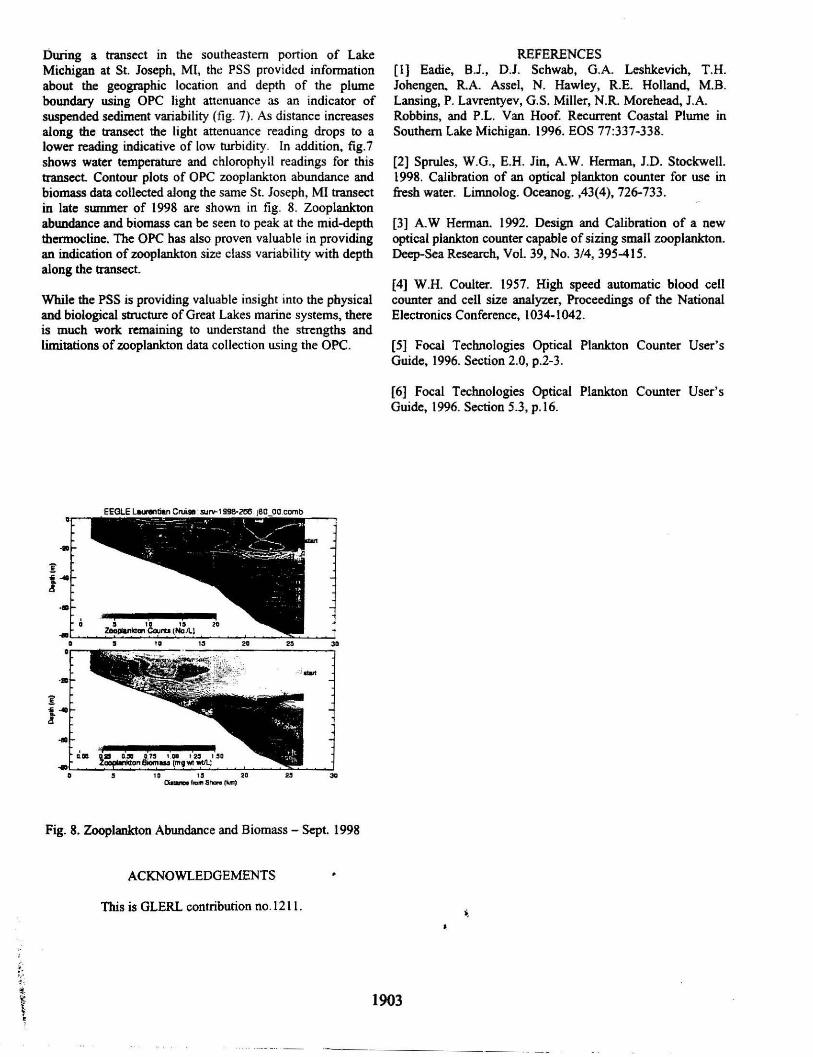
During a transect in the southeastern portion of Lake Michigan at St. loseph, MI, the PSS provided infonnation about the geographic location and depth of the plume boundary using OPC light attenuance as an indicator of suspended sediment variability (fig. 7). As distance increases along the transect the light attenuance reading drops to a lower reading indicative of low turbidity. In addition, fig.7 shows water temperature and chlorophyll readings for this transect. Contour plots of OPC zooplankton abundance and biomass data collected along the same St. Joseph, MI transect in late summer of 1998 are shown in fig. 8. Zooplankton abundance and biomass can be seen to peak at the mid-depth thermocline. The OPC has also proven valuable in providing an indication of zooplankton size class variability with depth along the transect.
While the PSS is providing valuable insight into the physical and biological structure of Great Lakes marine systems, there is much work remaining to understand the strengths and limitations of zooplankton data collection using the OPe.
Fig. 8. Zooplankton Abundance and Biomass - Sept. 1998
ACKNOWLEDGEMENTS
This is GLERL contribution no.121!.
REFERENCES [I] Eadie, B.J., 0.1. Schwab, G.A. Leshkevich, T.H. lohengen. R.A. Assel, N. Hawley, R.E. Holland, M.B. Lansing, P. Lavrentyev, G.S. Miller, N.R. Morehead, 1.A. Robbins, and P.L. Van Hoof. Recurrent Coastal Plume in Southern Lake Michigan. 1996. EOS 77:337-338.
[2] Sprules, W.G., E.H. lin, A.W. Hennan, J.D. Stockwell. 1998. Calibration of an optical plankton counter for use in fresh water. Limnolog. Oceanog. ,43(4), 726-733.
[3] A. W Herman. 1992. Design and Calibration of a new optical plankton counter capable of sizing small zooplankton. Deep-Sea Research, Vol. 39, No. 3/4, 395-415.
[4] W .H. Coulter. 1957. High speed automatic blood cell counter and cell size analyzer, Proceedings of the National Electronics Conference, 1034-1042.
[5] Focal Technologies Optical Plankton Counter User's Guide, 1996. Section 2.0, p.2-3.
[6] Focal Technologies Optical Plankton Counter User's Guide, 1996. Section 5.3, p.16.
•
1903


OCEANS 2001 MTSIIEEE CONFERENCE PROCEEDINGS
,PUBLISHED BY: OCEANS 2001 MTSIIEEE
CONFERENCE COMMITTEE
Responsibility for the contents rests upon the authors, and not upon the Marine Technology Society, the InsliMe of Electrical and Electronics Engineers/Oceanic Engineering Society, or its members and
Holland Publications.
Copies of the OCEANS 2001 MTSIlEEE Proceedings are available from:
The Marine Technology Society 1828 L Street, N.W., Suite 906
Washington, DC 20035 202-775-5966
and The IEEE Service Center 445 Hoes Lane, POB I33l Piscataway, NJ 08854-1331
1-800-701-4333
All rights including translations, are reserved by the Marine Technology Society and the Institute of Electrical Electronics Engineers/Oceanic Engineering Society. For copying, reprint, or republications permission, write to Publications Manager, MTS 1828 L Street, N.w., Suite 906, Washington, DC 20036 or IEEE Copyright Manager, IEEE Service Center, 445 Hoes Lane, POB 1331, Piscataway, NJ 08854-1331. Copyright and Reprint Permission: Abstracting is permitted with credit to the source. Authorization to photocopy items for internal or personal use, or the internal or person use of specific clients, is granted, provided that the per-copy fee indicated in the code is paid through the Copyright Clearance Center, 222 Rosewood Drive, Danvers, MA 01923.
AU rigbts reserved. Copyrigbt C> 2001
by Tbe Marine Tecbnology Society
ISBN: 0-933957-28-9 (softbound)
ISBN: 0-933957-29-7 (CD-ROM)
IEEE Catalog Number: 01CH37295
ISBN: 0-7803-7290-5 (Microficbe)
CD-ROM Layout and Replication by: Holland Enterprises
Book Layout and Printing by: Holland Publications
1782 Solana Glen Escondido, CA 92026-1858
Phone: 760-743-8486 Fax: 760-743-5758 '.
E-mail: [email protected]