PLANKTON PATCHINESS. Physical processes implicated in patchiness Diffusion-related processes Patches...
43
PLANKTON PATCHINESS
-
Upload
thomasine-harvey -
Category
Documents
-
view
231 -
download
3
Transcript of PLANKTON PATCHINESS. Physical processes implicated in patchiness Diffusion-related processes Patches...

PLANKTONPATCHINESS

Physical processes implicated in patchiness
Diffusion-related processesPatchesFilamentsTuring MechanismPlankton waves
Lateral stirringEarly observations of phytoplankton spectraPhysical turbulenceExplaining phytoplankton spectraZooplankton and spectraPitfalls of spectral analysisBiological forcing at intermediate scales
Vertical-horizontal coupling


Platt, 1972 Powell et al., 1975

K.L.Denman, 1976
Limited range where Chl and “passive” T are correlated
~10-100m to ~100-1000km
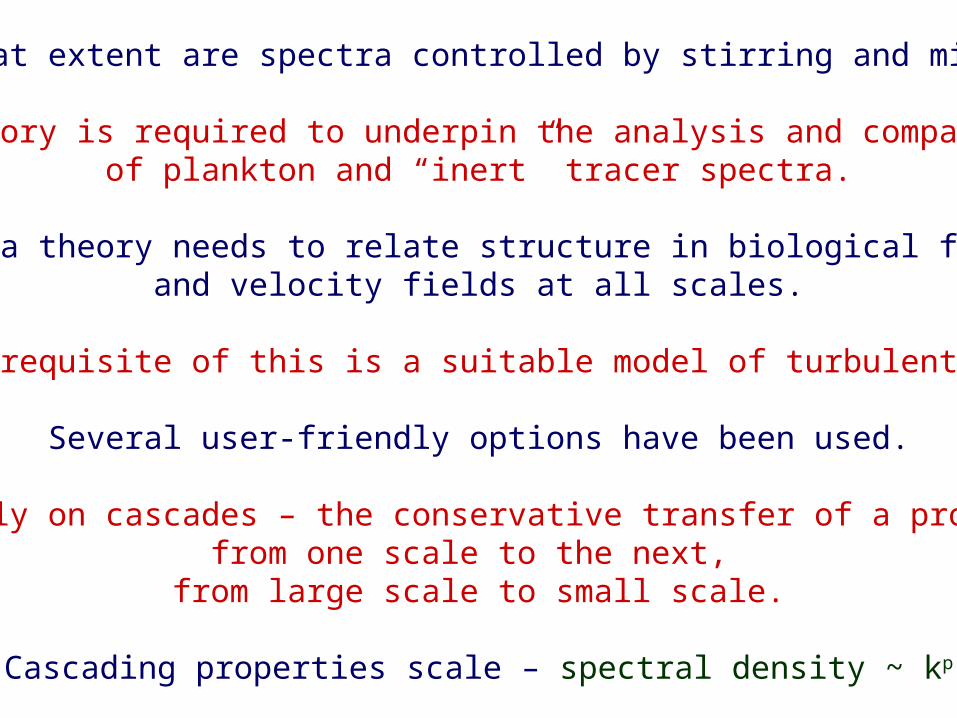
To what extent are spectra controlled by stirring and mixing?
A theory is required to underpin the analysis and comparisonof plankton and “inert” tracer spectra.
Such a theory needs to relate structure in biological fieldsand velocity fields at all scales.
A pre-requisite of this is a suitable model of turbulent flow.
Several user-friendly options have been used.
All rely on cascades – the conservative transfer of a property from one scale to the next,
from large scale to small scale.
Cascading properties scale – spectral density ~ kp

Commonly used turbulence models
Range: >1kmCascading property: enstrophy
(square of vorticity)Spectral slope: -1
Two-dimensional turbulence
Three-dimensional turbulence
Range: <1kmCascading property: energySpectral slope: -5/3

Motivation:- simplest option- “cascade” paradigm easy to apply to tracers-“agreement” with observations- if know what inert tracer should do, easy to diagnose when biology is dominant effect
Drawbacks:- far from clear that any are accurate models- unlikely that cascading range exists in practice- forcing only at large scale


Critical scale
Numerous independent derivationsCorrsin, 1961Denman and Platt, 1976Denman et al., 1977Powell and Okubo, 1994
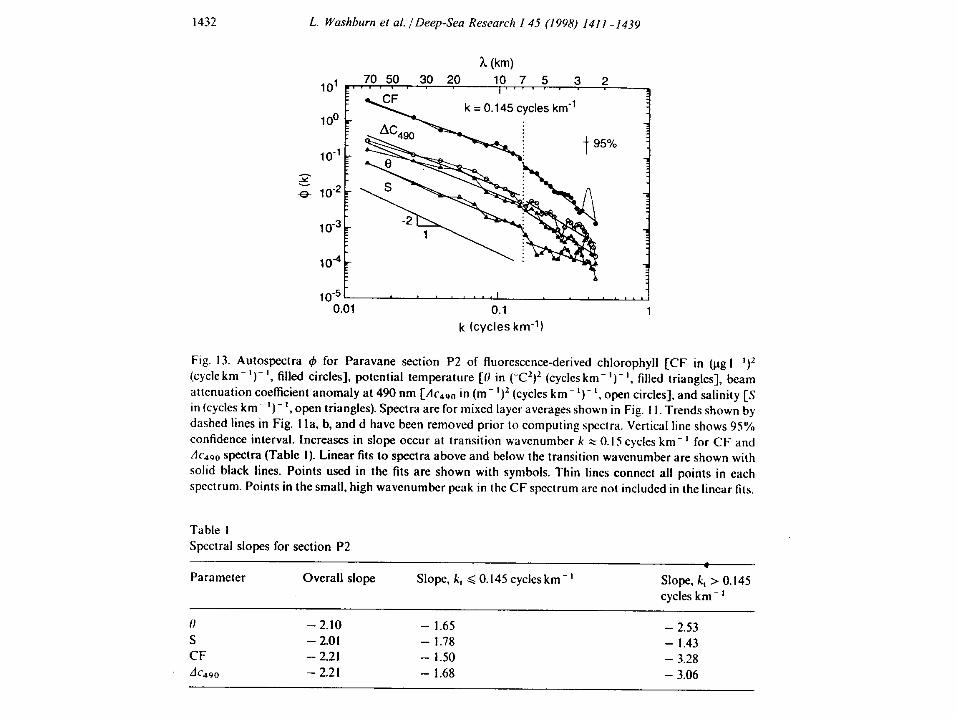
Different formulation for critical scaleFasham, 1978
kc=() KiSS scale
kc~0.2-20kmPhysically controlled at smaller scalesBiologically controlled at larger scales

Spectra can vary with time
“…the fact that the spectra of these twovariables [chlorophyll and temperature]have the same slope cannot be used toinfer that the chlorophyll distribution iscontrolled physically rather than biologically.”
M.J.R.Fasham (1978)

Antony von Leeuwenhoek, 1632-1723
“Passing just lately over thislake…I took up a little of it in a glass phial; and examiningthis water next day, I found…very many little animalcules. These animalcules had diverscolours…and the motion of most of these animalcules was so swift, and so various upwards, downwards and round about that ‘twas wonderful to see.”
7 September 1674

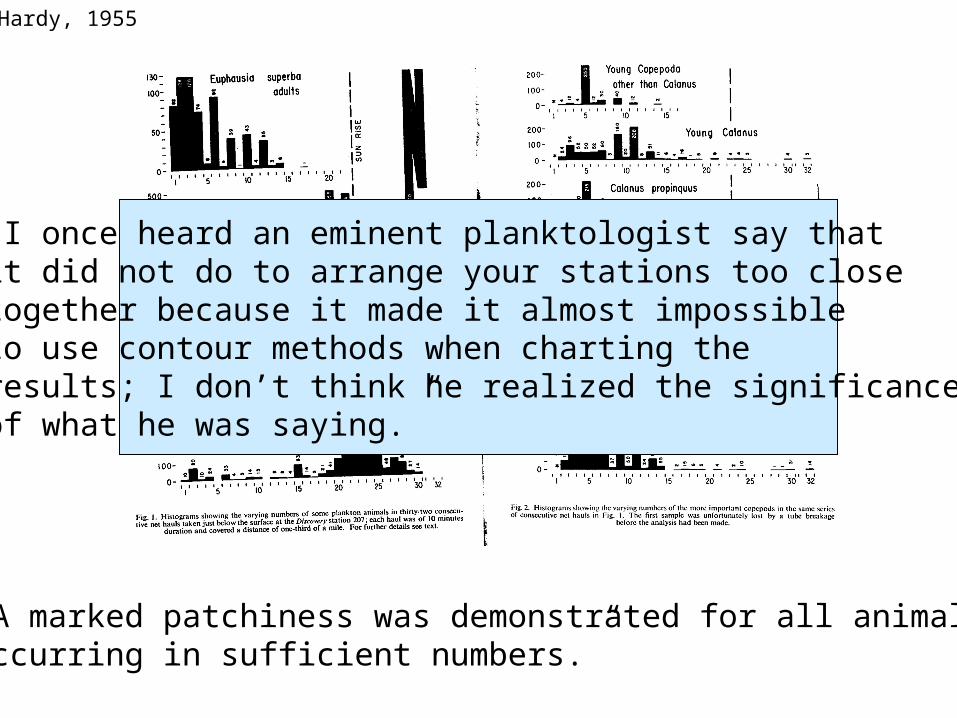
Hardy, 1955
“A marked patchiness was demonstrated for all animalsoccurring in sufficient numbers.”
“I once heard an eminent planktologist say thatit did not do to arrange your stations too closetogether because it made it almost impossible to use contour methods when charting the results; I don’t think he realized the significanceof what he was saying.”

Mackas and Boyd, 1979
Tsuda et al., 1993
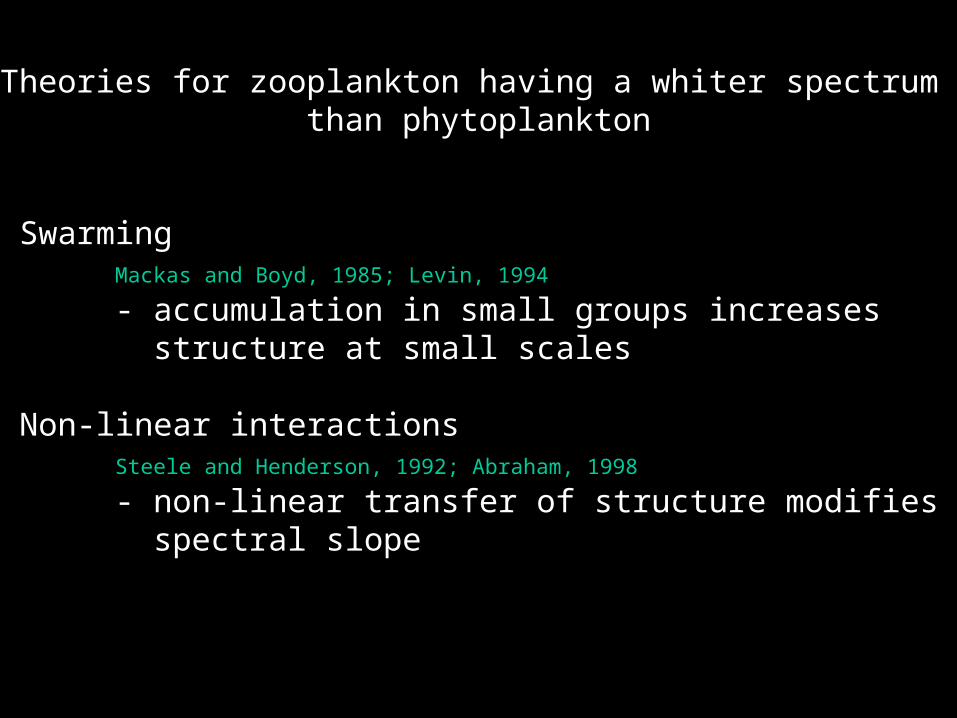
Theories for zooplankton having a whiter spectrum than phytoplankton
SwarmingMackas and Boyd, 1985; Levin, 1994
- accumulation in small groups increases structure at small scales
Non-linear interactionsSteele and Henderson, 1992; Abraham, 1998
- non-linear transfer of structure modifies spectral slope
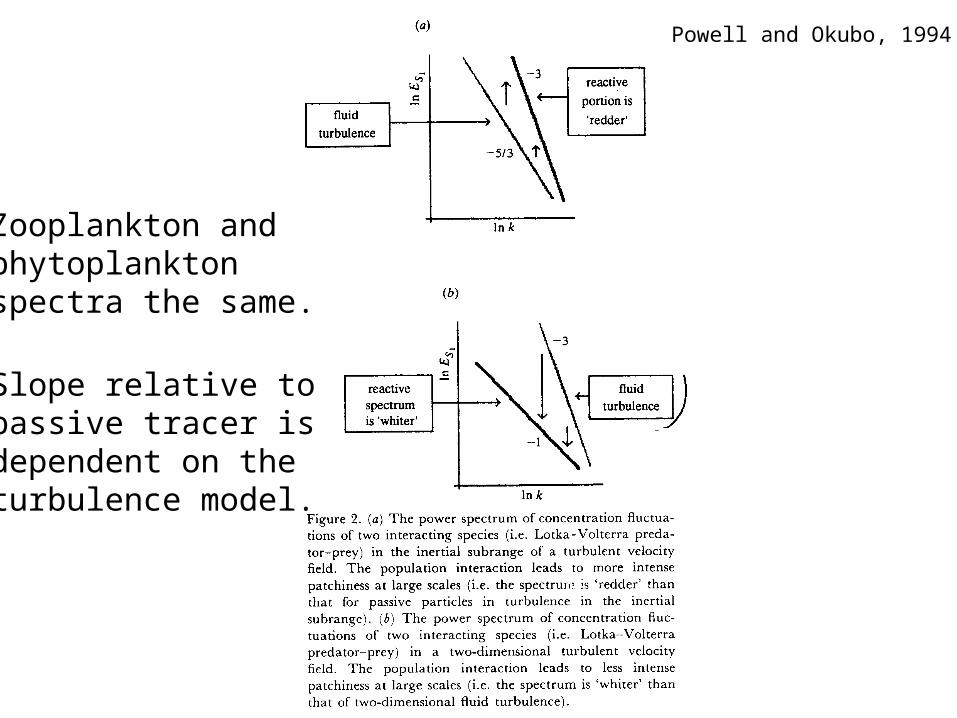
Zooplankton and phytoplanktonspectra the same.
Powell and Okubo, 1994
Slope relative topassive tracer isdependent on theturbulence model.
“Do any generalities emerge from our studies ofthe modifications that biological processes make to the patchiness imposed by solely physical processes?
“…one might also expect that several biologicalmechanisms might lead to the same (or very similar) spatial patterns in the plankton.”
Powell and Okubo, 1994
We answer no.”

Denman and Platt, 1975

Star and Cullen, 1981
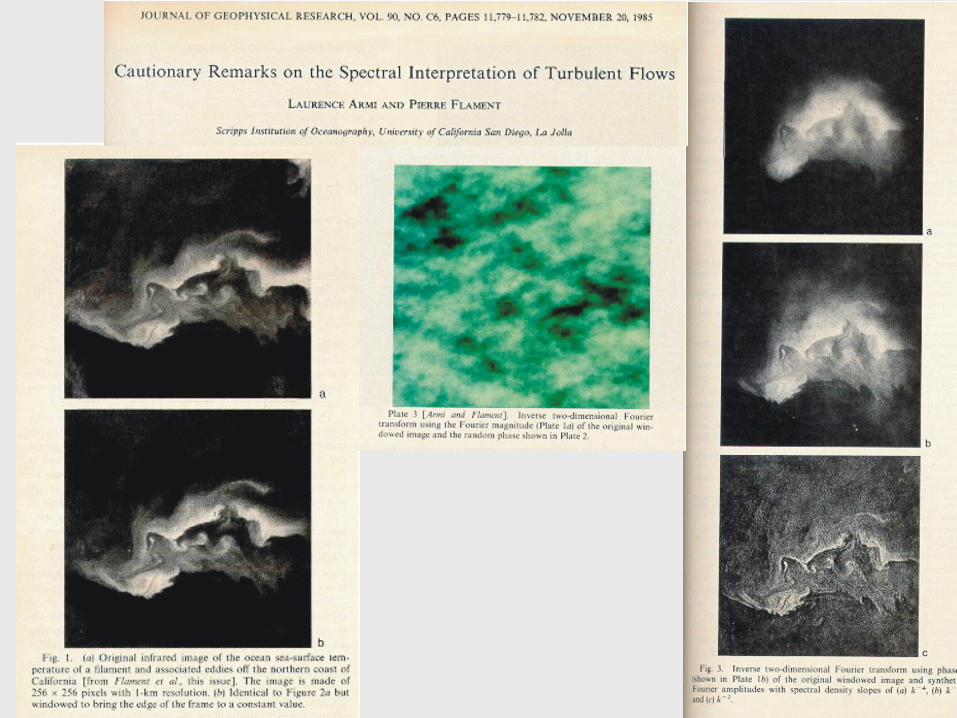

SPECTRA ARE TOO BLUNT A TOOL

Majority of patchiness models assume physicalforcing of biology is restricted to large scale.
Convenient as this assumption is common to theparadigm of cascading in the turbulence models they use.
Numerous observations indicate that physicalforcing of biology occurs at all scales, however.
- from 100km to 1km- upwelling very strong at fronts and eddies

Martin, Richards and Fasham (2001)

“…clear evidence of avariance input atwavelengths between15 and 35km…”

Martin and Richards (2001)
Horizontal velocity Vertical velocity


Early attempts to include mesoscale forcing
Fasham, 1978white noise forcing on growthP/ t = P + 2P/ x2 + E(x,t)
Powell and Okubo, 1994assumed spectrum for forcingpower spectra ~ k-1
Neither explicitly link forcing to flow
Need for explicit models(?)

Smith et al., 1996
Explicit biological forcingthrough…
Light - depth of mixed layer
Nutrients - mixed layer deepening
20km resolution

29% inc.
208% inc.139% inc.

Physical processes implicated in patchiness
Diffusion-related processesPatchesFilamentsTuring MechanismPlankton waves
Lateral stirringEarly observations of phytoplankton spectraPhysical turbulenceExplaining phytoplankton spectraZooplankton and spectraPitfalls of spectral analysisBiological forcing at intermediate scales
Vertical-horizontal coupling

dept
hEffective horizontal diffusivity
is a function ofvertical diffusivity and shear
Vertical diffusivity is a function of
stratification
KiSS length may vary with location
Taylor Dispersion

ZOOPLANKTON DIEL VERTICAL MIGRATION
Range: up to 500m
Rate: 50-200m/day
Causes: predator evasion,ultraviolet light evasion

Riley, 1976
Requires: - depth-varying velocities - zoo spend longer at depth - initial patchiness in zoo

Evans, 1978

Rovinsky et al., 1997

SUMMARY
Huge range of ways stirring and mixing caninteract with biological processes to produce
plankton patchiness.
Still no general, multiscale theory of patchiness,or concensus on whether one exists.
Need for better observations to constrainmodels.
Need for better techniques to analyse observations.