Planet Earth Autumn 2010
36
The impact of impacts n Where is North? n Tracking our ancestors n The carbon age www.planetearth.nerc.ac.uk Autumn 2010 Jobs for the buoys
-
Upload
natural-environment-research-council -
Category
Documents
-
view
220 -
download
1
description
Planet Earth is a free magazine aimed at non-specialists with an interest in environmental science.
Transcript of Planet Earth Autumn 2010

The impact of impacts n Where is North n Tracking our ancestors n The carbon age
wwwplanetearthnercacuk Autumn 2010
Jobs for thebuoys
Editors Adele Rackley 01793 411604 admpnercacuk Tom Marshall 01793 442593 thrsnercacuk
Science writer Tamera Jones 01793 411561 tanenercacuk Design and production Candy Sorrell cmsonercacuk
Available as an e-magazine at wwwnercacukpublicationsplanetearth
ISSN 1479-2605
NERC scientists we want to hear from youPlanet Earth is always looking for interesting NERC-funded science for articles and news stories If you want to see your research in the magazine contact the editors to discuss Please donrsquot send in unsolicited articles as we canrsquot promise to publish them We look forward to hearing from you
Planet Earth is the quarterly magazine of the Natural Environment Research Council It aims to interest a broad readership in the work of NERC It describes new research programmes work in progress and completed projects funded by NERC or carried out by NERC staff Some of this work may not yet have been peer-reviewed The views expressed in the articles are those of the authors and not necessarily those of NERC unless explicitly stated Let us know what you think about Planet Earth Contact the editors for details
Front cover Autonomous buoy see page 22
10 The impact of impacts Could sulphide deposits help find life on Mars
12 Current thinking Fine-tuning ocean observations
14 Agave ndash biofuel of the future New energy crops for arid climates
16 Where is North Tracking the shifts in the Earthrsquos magnetic field
18 Reading naturersquos barcode River sediments and climate history
20 The carbon age How a new portable sensor is shedding light on the carbon cycle
22 COVER STORY Jobs for the buoys New tools to monitor the English Channel
24 Tracking our ancestors Fossil footprints reveal how we evolved
26 Hot off the press Hands-on geologists make miniature planets
28 When politics and science come face to face From Ethiopian volcanoes to Westminster
Contents FEATURES
Planet EarthAutumn 2010
30
16
30 Mysteries of the blue ocean Not a watery desert after all
32 Website rocks Geology for the people
24
Planet Earth Autumn 2010 1
THE CONSEQUENCES OF CLIMATEGATE
The consequences ofClimategateT
he reviews of the Climategate affair which centred on emails taken from the University of East Angliarsquos
Climate Research Unit (CRU) have submitted their findings and enough time has passed that we can reflect on these events and what we should learn from them
Itrsquos worth pointing out that all three inquiries have exonerated CRU researchers of any serious misconduct There were problems with working practices at the CRU but its scientistsrsquo professional integrity was fully confirmed and the inquiries found no evidence of research being manipulated to support the idea that human activities are changing the climate
Itrsquos clear that the supposed scandal got much more attention from the media than the conclusions of the independent reviews Some members of the public who havenrsquot followed the story closely may have been left with the impression of serious wrongdoing where there was none
There is no doubt the affair has reduced public trust in climate science and climate scientists Itrsquos important that scientists regain this trust In part this will involve trying harder to communicate what we do more clearly But we also need to be more willing to engage in debate with critics and to demand that the so-called sceptics make it clear what credible published evidence they have to back up their assertions ndash usually there is little or none
Too often researchers have left the scepticsrsquo claims unchallenged and this has made it seem that there is genuine doubt over whether or not the climate is changing and that scientists have no answers to the charges made against them
Alan Thorpe Chief Executive NERC
Some of these reflect misconceptions about what science is like Research involves a huge amount of challenge from peers it is not a cosy club ndash more like a bear pit The climate scientists themselves are sceptics By contrast many self-proclaimed sceptics seem willing to accept anything they read that downplays the evidence of human-induced climate change or casts climate science in a bad light no matter how thin the evidence for it is
The fact that this material nevertheless gets spread so widely is largely due to the vast number of blogs and other websites now covering the subject We know the blogosphere will continue to exist and be influential and in many ways this surge of interest in climate science is a healthy development But not all claims are equally credible
Without professional quality control we can have no basis for establishing new knowledge ndash and yes professional here means other trained scientists Some people have challenged the principle of peer review in which new research is evaluated by other scientists with expertise in the same field They argue it leads to group-think and the suppression of dissenting views But the peer-review process is at the heart of how we test the credibility of new science It is also central to how research councils decide what to fund Without it society has no way of telling good science from bad
The problem again is trust ndash people have to be confident in the scientists doing the peer reviewing One way of rebuilding this trust is for researchers to do more to engage the public with their work
Taxpayers pay for most of the science NERC funds so they have a stake in the results and we have a duty to communicate the science in an accessible way at all stages in the process
Scientific data should be openly available after the researchers have had a reasonable period ndash normally two years from the end of data collection ndash in which to examine their results and draw inferences NERC runs several data centres
where we require our researchers to place their data for general access We are doing more than ever to get the scientists whose work we fund to think harder about how that work will benefit society as a whole And we are making unprecedented efforts to involve the public in our science from the start through dialogue to inform the research process
Itrsquos also vital that scientists get better at dealing with the media Journalists said the science community went silent when Climategate broke Maybe so but perhaps this was partly because scientists saw at once that the story wasnrsquot really about science at all but about particular scientists and how they conducted their research Many in the research community didnrsquot feel comfortable commenting on that
This may be understandable but unfortunately it meant that vital points were missing from the
ensuing media debate For example it was not emphasised that the CRU data is only a small part of climate science albeit an important one and that no mistakes had been found in the published work based on it This made it easy for the opponents of global warming to blow the CRU emails out of all proportion and portray all climate science as flawed
The mediarsquos default option still seems to be a one-on-one
confrontation between scientist and sceptic as if the evidence for both positions was similar in quantity and quality And too often the same few scientists are asked for interviews again and again it would be better if the public could see the true diversity of the research community Scientists must do more to communicate the fact that research is a human activity subject to human emotions and failings They also need to get better at putting their points across in plain succinct English
These changes are badly needed because we have much further work to do to communicate the complexities and uncertainties of climate science Climategate has been a difficult experience for many in the field but perhaps if it helps bring about changes in areas like these the affair may turn out to have served a useful purpose after all
Research involves a huge amount of challenge from peers it is not a cosy club ndash more like a bear pit
2 Planet Earth Autumn 2010
NewsDAILY UPDATED NEWS wwwplanetearthnercacuk
Chemicals make young burying beetles beg for food
ITrsquoS NOT just birds that respond to the begging cries of their offspring Burying beetles do too But burying beetle larvae grow up in complete darkness and canrsquot see their parents ndash so how do they know when to beg
It turns out they are responding to chemicals on the motherrsquos body
Burying beetles are so named because they lay their eggs in the soil near the carcass of a small bird or mammal which theyrsquove buried to provide food for their larvae
But sometimes this rotting flesh isnrsquot enough for the hungry larvae which beg their parents for regurgitated carrion
lsquoWe wanted to understand what the costs of begging to burying beetle larvae were To do this we had to stimulate beggingrsquo explains Dr Per Smiseth from the University of Edinburgh who led the research published in Behavioral Ecology
When they put a dead burying beetle parent next to its offspring they were surprised to see the larvae begged for hours They
couldnrsquot have been relying on behavioural cues which led the researchers to think the trigger may be chemical
lsquoIn the same beetle therersquos some evidence that females discriminate between their male partner and intruders because of differences in the hydrocarbons in the insectsrsquo cuticlesrsquo says Smiseth
So the researchers washed some female parents in a solvent to strip the hydrocarbons away and found that larvae begged less towards these washed parents than toward unwashed females
lsquoWersquore not sure at the moment exactly what the chemical is but we think itrsquos probably hydrocarbonrsquo says Smiseth
The researchers are keen to take their work further lsquoWe want to see if therersquos a difference between males and females Females are the primary care-givers but larvae might respond to males in the same way they respond to females We just donrsquot know right nowrsquo adds Smiseth
SCIENTISTS have shown for the first time that wild banded mongooses pass foraging traditions down to the next generation
Individual mongoose pups learn one of two different foraging techniques from an older relative called an escort Once pups learn a technique they stick to it throughout their lives say the researchers
Therersquos growing evidence to show that culture is not exclusively human For example chimps use twigs to fish for ants and orangutans use sponges to soak up water
But until now therersquos been no evidence to show that these methods are passed on to the next generation through cultural transmission
lsquoYou need experiments to see how the techniques are passed onrsquo explains Dr Corsin Muumlller He was a member of the University of Exeter when he authored the research published in Current Biology but is now at the University of Vienna
While studying wild banded mongooses in Queen Elizabeth Natural Park Uganda Muumlller noticed that mongooses use one
Kinder Eggs throw light on mongoose traditions
of two techniques to crack foods with a hard shell They either use their teeth or hurl them at a hard surface
To test whether techniques would be passed on to pups Muumlller filled Kinder Egg plastic containers with rice and fish
With no pups around the scientists gave adult mongooses the filled Kinder Egg and saw that some used the biting technique to open it and some used the throwing technique Others used both
Then the researchers allowed the pups to watch their escorts open the Kinder Egg
When the pups had reached juvenile age Muumlller and his team tested their responses to a filled Kinder Egg and found that the young mongooses copied the technique they saw their escorts use And they continued to use this technique as adults
lsquoWhatrsquos interesting is that when people think about traditions they usually think about one population showing one type of behaviour But what wersquove shown is that there are two behavioural variants in the same grouprsquo says Muumlller
Planet Earth Autumn 2010 3
Sign up for email news alerts
NewsSigns of asteroid impact turn out to be fungusTINY black spheres previously seen as evidence that a catastrophic asteroid impact caused a little ice age are actually charred fungus according to new research
So ideas about what caused the Younger Dryas stadial a cold period which began around 12900 years ago need to be revised
The impact theory was partly based on the discovery of carbon lsquospherulesrsquo tiny black spheres up to a millimetre across that were found in sediment layers deposited around this time Researchers have argued that these formed in the intense heat of wildfires triggered when a comet or asteroid either hit the Earth or exploded in its atmosphere
These fires supposedly raged across vast areas stretching from coastal California across North America to Europe The idea was that only these continent-wide infernos could have created carbon spherules in such numbers and only an asteroid impact could have ignited such a conflagration
But a recent paper in Geophysical Research Letters suggests that the spherules are really just fungal sclerotia ndash compact balls of hardened tissue produced by certain fungi These are common worldwide in both modern and ancient soils
The 12900-year-old spherules found in Californian sediment samples have indeed been blackened by fire But through experiments in the lab the research team showed that they had only been exposed to comparatively low temperatures
The reflectivity of the spherulesrsquo glossy black surface suggests they couldnrsquot have been higher than around 450degC A continent-wide conflagration would almost certainly be far hotter ndash perhaps 800degC ndash and would have destroyed the sclerotia or at least burned out their distinctive honeycomb-like
internal structurelsquoThey are clearly fungal from
their morphologyrsquo comments Professor Andrew C Scott a palaeobotanist at Royal Holloway University of London lead author of the paper
Earthrsquos oldest mantle discoveredSCIENTISTS have found rocks formed from what they think may be Earthrsquos oldest mantle reservoir ndash a 45-billion-year-old remnant of the primordial material that made up the planet not long after it condensed out of clouds of space dust
The discovery published in Nature has important implications for our understanding of the Earthrsquos early history
lsquoThis is such an exciting discovery because this mantle reservoir could well be parental to all of the mantle reservoirs we recognise today in volcanic rocks around the worldrsquo says Dr Pamela Kempton one of the paperrsquos
Warmer climate may have wiped out the cave lion
CAVE LIONS probably became extinct across Europe and Asia 14000 years ago because a warmer climate drastically reduced the availability of their favourite hunting grounds
As the climate warmed around 14700 years ago forests and shrubs steadily replaced the open steppe-like environment that had dominated for thousands of years reducing the amount of clear space for the lion to hunt in
The cave lion roamed the plains of Europe northern Asia and Alaska and north-west Canada from around 60000 years ago until about 14000 years ago
From the numerous fossils dated from the same period scientists know that the lionrsquos preferred prey were probably bison reindeer horse giant deer and musk ox
Before this research many scientists thought the cave lion (Panthera spelaea) may have died out because it slowly ran out of food after its prey went extinct
lsquoWersquove pretty much ruled this out nowrsquo explains Professor Tony Stuart from Durham University who led the research
Most of the cave lionrsquos likely prey survived for thousands of years after the cave lion went extinct
Stuart and his colleague Professor Adrian Lister from Londonrsquos Natural History Museum report in Quaternary Science Reviews how they compiled 111 carbon dates of cave lion bones or teeth from museums in Europe Russia and North America
Their results suggest the cave lion went extinct around about the same time across Europe and northern Asia The most recent date came from a cave lion skeleton found in France which died about 14141 years ago
They found the youngest bones from Alaska and the Yukon region dated back to 13300 and 13800 years ago
Other researchers have argued that the arrival of humans on the cave lionrsquos patch may have contributed to its extinction but so far therersquos no strong evidence for this
lsquoWhat is clear is that as the climate changed the environment this had a big effect on everythingrsquo says Stuart
authors who analysed some of the rock samples while at the NERC Isotope Geosciences Laboratory in Keyworth She has since moved to become Head of Research at the Natural Environment Research Council
The 60-million-year-old rocks found on Baffin Island and West Greenland in the Canadian Arctic preserve the chemical signature of the mantle reservoir deep within the Earth from which they formed
How this remnant of primordial mantle has persisted since the planet formed is a mystery but one possibility is that the reservoir is kept isolated at the centre of an eddy in the mantle like the still air in the eye of a very slow hurricane
The research also suggests the Earth may have started to take on its present form earlier than previously thought The rocks have higher ratios of the element neodymium (Nd) than chondrites ndash stony meteorites that are believed to represent the same kind of material the Earth formed out of These higher ratios were produced by the radioactive decay of an isotope of samarium that became extinct within a couple of hundred million years after the Earth formed so this difference must have arisen very early in the planetrsquos history
This could mean that the assumption that the Earth formed out of similar stuff to chondritic meteorites is wrong ndash meaning we need to rethink large areas of geology
Or it could mean that the Earth began to differentiate ndash to change from a mass of primordial matter into a more structured form with crust mantle and core ndash very early in its history
The creation of a crust and core would have depleted the mantle of certain elements This is the explanation the researchers favour If we assume the early Earth began this irreversible differentiation within the first hundred million years or so of its life we can explain the discrepancy between chondrites and todayrsquos mantle
4 Planet Earth Autumn 2010
NewsDAILY UPDATED NEWS wwwplanetearthnercacuk
IN JUNE scientists unveiled the most detailed map yet of the Earthrsquos gravity using data generated by the European Space Agencyrsquos GOCE satellite launched in March 2009
GOCE stands for Gravity field and Ocean Circulation Explorer The satellite flies in the edge of the Earthrsquos atmosphere at a height of 2549km and measures tiny differences in gravity at many points around the Earth
The map shows the Earthrsquos lsquogeoidrsquo ndash or which parts of our planet have a greater gravitational pull than others because of the different rocks theyrsquore made of
If you turned this map into a globe it would look like a partially blown-up football with peaks representing strong gravity and troughs showing weaker gravity But if you placed a much smaller ball anywhere on this squashy football it wouldnrsquot move ndash even if it was on a slope ndash because gravity would be exactly the same all over it
Because the Earth is the shape of a squashed ball gravity is stronger at the poles than at the equator
Most detailed map of Earthrsquos gravity revealed
Before GOCE was launched scientists knew that gravity is stronger around Greenland than around the Indian Ocean for example
But lsquothe current geoid models are largely based on ground measurements which of course is difficult in inaccessible parts of the planetrsquo says Dr Helen Snaith from the National Oceanography Centre in Southampton
So the new map is telling scientists much more about places where itrsquos difficult to do ground research like the Himalayas the Andes and Antarctica
The geoid model that GOCE has generated also represents the shape the worldrsquos seas would be if there were no winds tides or currents This means scientists can subtract the geoid from real measurements of sea-surface height
to work out how winds tides and currents affect ocean circulation
lsquoUntil now the best maps we had were on the 400 to 500 kilometre scale GOCErsquos resolution is focused down to 150 kilometres Most ocean currents are around this width or smaller so wersquore going to get a lot more detail about currents with this maprsquo explains Snaith
ESA - GOCE High Level Processing Facility
MAN-MADE plastics have found their way to the most remote and inaccessible waters in the world off the coast of Antarctica
The seas around continental Antarctica are the last place on Earth scientists have looked for plastic mainly because theyrsquore so difficult to get to
lsquoWe were going to the Amundsen Sea onboard the RRS James Clark Ross to collect biological specimens for the first time ever and were well placed to look for plastics at the same timersquo explains David Barnes from the British Antarctic
Plastics found in the seas around AntarcticaSurvey who led the research
Barnes linked up with other researchers from Greenpeacersquos MV Esperanza and ice patrol vessel HMS Endurance to look for one of the most abundant and persistent scourges of the global ocean ndash floating debris They found that plastic rubbish was most common compared with debris made from metal rubber or glass
They report in Marine Environmental Research how they found fishing buoys and a plastic cup in the Durmont DrsquoUrville and Davis seas of east Antarctica and fishing buoys and plastic packaging from the Amundsen Sea
in western Antarctica They found no evidence of
natural debris like branches shells or plants
There are no scientific research stations or other bases anywhere near the Amundsen Sea suggesting the plastic debris must have got there via ocean currents
The researchers also sampled seabed sediments around Antarctica for minute degraded plastics
Plastic fragments have found their way as far as South Georgia in the South Atlantic so the researchers were surprised to find no evidence of fragments in seabed
sediments around the continent lsquoThe possibility of tiny pieces
of plastic reaching the seafloor is especially worrying because the continental shelves around Antarctica are dominated by suspension feeders which are essentially at the bottom of the food chainrsquo says Barnes
lsquoBut whatrsquos really worrying about plastics getting to Antarctica apart from aesthetics is the fact that they can carry non-native animals We donrsquot have this problem in Antarctica yet but with warming seas they stand a much better chance of survivingrsquo he adds
Planet Earth Autumn 2010 5
Sign up for email news alerts
NewsMost detailed map of Earthrsquos gravity revealed
MAORI warriors use the haka to bond before battle Now it seems that birds also demonstrate bonding behaviour when they think they might have trouble with the neighbours
Scientists know that social birds become closer immediately after conflict with other groups but until now little was known about how the risk of future conflict influenced animal behaviour
Dr Andy Radford of the University of Bristol studied green woodhoopoes to see if they acted differently when faced with possible territorial conflict
These birds live in small groups in permanent territories conflict between groups is frequent close to territorial boundaries and allopreening ndash when one bird preens another ndash is an important part of group behaviour The groups typically consisted of a dominant breeding pair and up to six subordinate lsquohelpersrsquo
Radford watched the birds in the river valleys of the Eastern Cape Province South Africa He noted the length of periods of self-preening and allopreening which individuals in the group were involved and where in the territory the birds were when the preening took place
His results published in Biology Letters show that both the frequency of allopreening within the group and the amount of time the birds spent doing it increased when the group was at the edge of its territory where conflict with neighbouring groups is likelier
Radford found the biggest increase was in the amount of preening given by the dominant birds to the helpers in the group
This lsquoaffiliativersquo behaviour is likely to reassure subordinates
Birds strengthen social bonds when they sense trouble
and increase closeness within the group ensuring the birds all stick together if battle ensues
Surprisingly when this behaviour was observed there had been no visual or vocal evidence of other woodhoopoe groups for at least an hour This suggests that rather than bonding in response to an immediate threat the birdsrsquo behaviour was in anticipation of a possible future threat
lsquoIt would be wrong to say this behaviour is firm evidence for forward planning in birdsrsquo says Radford lsquobut it is very exciting to have seen this link between potential intergroup conflict and current intragroup behaviour in the wildrsquo
Chris van Rooyen
HUMAN females arenrsquot the only ones to go through menopause ndash some whale species also go through a similar lsquochangersquo and the unique structure of human and whale societies might be responsible say scientists
Short-finned pilot whales stop breeding when they get to around 36 years but can live until theyrsquore 65 Killer whales stop having young when they reach about 48 years of age but often live up to 90 years
This is in line with the so-called grandmother hypothesis which suggests that by stopping having children early and then helping their existing offspring survive and reproduce women still benefit by helping to pass on their genes
Among our ancestors a woman would move to wherever her mate lived Initially shersquod be completely unrelated to members of her new lsquogrouprsquo and so would have no incentive to help them reproduce But by having children as she aged she became more related to them
Then it made evolutionary sense to stop having children and help her younger relatives bring up their children
Among mammals however itrsquos unusual for the female to move away from the family she was born into ndash itrsquos usually the male that leaves his family group
Mammals with this type of social structure donrsquot go through a menopause but continue breeding until they die Elephants for example breed well into their sixties
lsquoWe were puzzled by this and wanted to understand why you donrsquot get grandmothers in other long-lived cooperative speciesrsquo says Dr Rufus Johnstone from the University of Cambridge lead author of the research which is published in the Proceedings of the Royal Society B
Johnstone and his colleague Dr Michael Cant from the University of Exeter describe how they applied a model of relatedness ndash or kinship dynamics ndash to the two species of whale which go through menopause They found a similar pattern of increased relatedness with age to the one seen in humans
In killer and pilot whale societies both males and females stay with their family groups but males leave temporarily to mate with females from other family groups called pods
This means that females are born into a pod which doesnrsquot contain their father But as they get older and have young of their own they become more related to other pod members So it makes sense for older female pilot and killer whales to stop breeding and instead help the younger members of their families raise their offspring
lsquoThis helps explain why of all the long-lived mammals menopause has only evolved in humans and toothed whalesrsquo says Johnstone
lsquoIt would be good to look into the social structures of whale species we donrsquot know much about to see how well our theory stacks uprsquo he adds
Unique social structures could explain the menopause
6 Planet Earth Autumn 2010
NewsDAILY UPDATED NEWS wwwplanetearthnercacuk
out of the way
These results are particularly significant
because they show the AMOC overshooting to well beyond its present-day state And when overshoots occur the effects on surface temperature are extreme
And such extreme changes arenrsquot just geological phenomena lsquoHumans were around in north-west Europe when some of these events happenedrsquo Barker adds lsquoIrsquod love to know what they made of such massive climate changersquo
MOST SCIENTISTS think that fluctuations in ocean circulation are linked to changes in climate Now theyrsquove found evidence linking those fluctuations to temperature increases so extreme they can end an ice age
The Atlantic Meridional Overturning Circulation (AMOC) carries tropical surface waters northwards and brings cold North Atlantic deep water (NADW) southwards to mix with deep waters originating in the Antarctic When ocean circulation is strong heat is moved efficiently from the tropics to the poles When circulation is weak the poles become colder
Scientists think that during particularly cold periods in the last ice age (so-called Heinrich Stadial events) the AMOC weakened significantly A stronger AMOC is
Ocean circulation is a key factor in deglaciation
temperature changes observed in the surface ocean and in ice cores from Greenland Their results are published in Nature Geoscience
The radiocarbon content and preservation of carbonate shells in the sediments indicate that the waters over the sample site during the B-A period have all the characteristics of NADW This suggests an overshoot did happen because it means that NADW was carried much deeper than normal pushing the older southern waters
associated with warmer phasesA team of researchers led by
Dr Stephen Barker from Cardiff University believe the link is so strong that deglaciation may only happen when the AMOC shifts from weak to strong
Models predict that when the AMOC strengthens after an interval of weak circulation it doesnrsquot just return to its lsquonormalrsquo extent but it gets stronger than before ndash it lsquoovershootsrsquo
These changes can have extreme effects During the Boslashlling-Alleroslashd (B-A) warm phase 14600 years ago temperatures rose by 9degC over the course of just a few decades
To find evidence that this increase was indeed linked to an overshoot the scientists looked at a sediment core from the South Atlantic Ocean and related changes in the core to the abrupt
BIRDS prefer conventionally grown grain over organic when given the choice This doesnrsquot mean that organic foods are bad say researchers the birds probably just find the more protein-rich conventional seed more satisfying
The findings come from the first of a set of long-term experiments by Dr Ailsa McKenzie of Newcastle University
lsquoThe difference between organic and conventionally grown seeds is not a matter of taste ndash it takes time for the birds to tell one from the otherrsquo she says
McKenzie and Newcastle colleague Dr Mark Whittingham offered a group of 12 canaries a choice of organic and conventionally
grown wheat seeds then patiently counted how many times the birds pecked at each bowl
lsquoOverall the birds preferred conventional grain over organicrsquo says McKenzie During the experiment the canaries chose the non-organic wheat 66 per cent of the time As the days passed and the birds learned the difference between the two foods their preference for conventional wheat increased
Over the next two winters they repeated the experiment in 47 gardens across Newcastle-upon-Tyne and Northumberland measuring how much organic and non-organic grain was eaten daily from two feeders As before the birds preferred the conventionally grown seed
But how do the birds tell the difference between grain from
organic farms and wheat grown with the help of fertilisers and pesticides
lsquoItrsquos not the taste because the preference takes time to developrsquo says McKenzie So it must be something innate to the grain Wheat from conventionally fertilised crops often has more protein lsquoIt is likely that after a while the birds begin to sense that conventional wheat has more proteinrsquo she says adding that maybe they find this protein-rich diet more satisfying
To test if the birds can learn to spot high-protein wheat the team went back to the lab They chose two types of wheat grown in the same conventional farm but
treated with different amounts of fertiliser The only difference between these types of non-organic grain was that the over-fertilised crop had more protein
lsquoThe canaries ate less low-protein than high-protein wheat throughout the trialrsquo says McKenzie who reported the results in the Journal of the Science of Food and Agriculture
Birds prefer non-organic wheat
Planet Earth Autumn 2010 7
Sign up for email news alerts
News
THE LAST ICE AGE came to a stop soon after carbon dioxide levels in the atmosphere started to rise about 18000 years ago
Now researchers have found the possible location of a carbon dioxide leak from the Southern Ocean around Antarctica that helped speed up the process
lsquoThe Southern Ocean is one of the areas where deep and cold water surfacesrsquo explains lead author Dr Luke Skinner an earth scientist from the University of Cambridge lsquoThis deep water is rich in carbon dioxide which can be released when the water comes in contact with the atmospherersquo
lsquoOur results show that during the last ice age around 20000 years ago carbon dioxide dissolved in the deep water circulating around Antarctica was locked away for two or three times longer than todayrsquo says Skinner
The findings published in Science are the first direct evidence that the time carbon spends in the deep ocean increased substantially during the last glacial period This helped to keep atmospheric carbon dioxide levels low and the world in a deep freeze
Skinner and colleagues discovered the link in the shells of tiny bottom-dwelling micro-organisms called foraminifers
They compared the carbon-14 in the shells which was absorbed from the water where the foraminifers lived with the carbon-14 in the atmosphere at the time The difference let the team work out how long the CO2 in the deep water had been locked away from the atmosphere
lsquoWe found that water sitting deep in the Southern Ocean was older during the last ice agersquo says Skinner This confirms the suspicion that ocean circulation drives at least part of the changes in atmospheric carbon dioxide between glacial and interglacial times
But the mechanisms for this are still uncertain lsquoOur guess at this point is that changes in sea-ice extent were crucial in letting the winds stir up the ocean around Antarctica and effectively lift water to the sea surface as a resultrsquo Skinner says
Ocean currents ended last ice age
Ecologist snaps up photography prizesCardiff Universityrsquos Adam Seward has won two of the five awards in this yearrsquos British Ecological Society photographic competition
Adam was doing fieldwork in Fair Isle when he took the photographs of a puffin (Fratercula arctica) and wheatears (Oenanthe oenanthe) to scoop the Ecology in Action and Student categories NERC supported his visit to Britainrsquos most remote inhabited island as part of his PhD
No stranger to photographic fame Adamrsquos work has been widely published and he was highly commended in the prestigious European Wildlife Photographer of the Year competition in 2009
Bioblitz on into autumnBuilding on the success of the summer Bioblitz events the Bristol Natural History Consortium (BNHC) is coordinating a further series of mini events on university campuses around the country and NERC scientists will be on hand to help Details are on the BNHC website wwwbnhcorgukhomebioblitz and you can keep up to date on Twitter BioBlitzUK and Facebook BioBlitzUK
Snakes in dramatic declineSnake populations around the world have declined sharply over the last 22 years and Britainrsquos smooth snake Coronella austriaca is among the species showing the sharpest drop Scientists think a change in habitat quality ndash like a reduction in the prey available ndash rather than habitat loss could be to blame
lsquoItrsquos too coincidental for snakes from so many countries to be going through the same steep decline There has to be a common causersquo says Dr Chris Reading from the Centre for Ecology amp Hydrology who led the research published in Biology Letters
Open DataFrom January 2011 NERC will make the environmental data in its Data Centres freely available without restrictions on use This is to increase the openness and transparency of the research process and to encourage the development of new and innovative uses for these data To help support this NERC will require environmental data collected from the activities it funds to be made openly available within two years of their collection
These are just a couple of the changes that NERC will make with the introduction of its new Data Policy The policy will be launched in October and will come into force in January 2011 See the NERC website wwwnercacuk for more information
In brief
8 Planet Earth Autumn 2010
NewsDAILY UPDATED NEWS wwwplanetearthnercacuk
NEW IMAGES of the Gamburtsev Subglacial Mountains (GSM) were presented at the International Polar Year conference in Oslo in June showing the features of this enigmatic mountain range in unprecedented detail
Scientists from the British Antarctic Survey (BAS) were part of the seven-nation Antarcticarsquos Gamburtsev Province project (AGAP) which has completed an airborne survey of 20 per cent of this previously unexplored area
The images clearly show the GSMrsquos high-relief alpine-style landscape and the profiles show that the valleys were carved by rivers as well as ice
lsquoItrsquos likely that the valleys were initially eroded by rivers which points to the fact that the mountains were there long before the ice began to form about 35 million years agorsquo says Dr Kathryn Rose of BAS lsquoAs temperatures fell glaciers formed on the highest peaks and followed the path of the existing drainage systemrsquo
But the fact that the mountain peaks have not been eroded into plateaus suggests the ice sheet could have formed relatively quickly
Amazingly the radar also showed therersquos liquid water under the ice Scientists had to endure surface temperatures of around -30degC during the survey but the temperature under the ice is as high as -2degC
lsquoThis is because the ice acts like a blanketrsquo says BASrsquos Dr Tom Jordan It traps geothermal heat and its immense pressure causes
Antarcticarsquos enigmatic Gamburtsev Subglacial Mountains unveiled
water to melt at lower temperatures than it does at the surface so the water can exist as liquid at the base of the ice
Studying this subglacial environment will help scientists understand how the regionrsquos climate has changed ndash and how the ice has responded ndash over tens of thousands of years
lsquoMeltwater from one place is moving through the system and seems to be freezing back onto the base of a different part of the ice sheet This new process hasnrsquot been taken into account in previous ice-sheet studiesrsquo adds Jordan
Another key finding is that the mountains are not volcanic The researchers found signs of ancient tectonic fabric ndash areas of rock that have been pushed together or slid past each other
Today the GSM arenrsquot close to the edge of a tectonic plate so these readings provide important clues to their age lsquosignificantly more than 500 million years oldrsquo says Jordan
Old males rule the roost even as sex-drive fadesreproductive success like sperm count sex drive and how well old roostersrsquo sperm swim
lsquoWe wanted to find out how different components of male reproductive success affect roostersrsquo overall fertility as they age But also how this impacts on females within groupsrsquo explains Dean
The researchers found that compared with their younger competitors older roosters had a lower sex drive were more likely to fire blanks and produced fewer sperm of lower quality
But they were surprised to find that if old roosters were faced with just a few young competitors in groups with plenty of females they were just as likely to rule the roost as younger males And in groups
OLD MALE chickens can still rule the roost even when their sex drive and ability to fertilise eggs nose-dive with age
This leads to disastrous results for hens Being monopolised by an impotent rooster means theyrsquoll lay many more infertile eggs than if theyrsquod mated with a younger model
lsquoWhat wersquore seeing is an evolutionary battle between whatrsquos good for roosters and whatrsquos good for hensrsquo says Dr Rebecca Dean from Oxford University co-author of the study published in Current Biology
Dean and her co-authors looked at a natural population of domestic chickens (Gallus gallus domesticus) to study various components of
dominated by an old rooster females lay lots of infertile eggs
When there are plenty of young males around though old roosters were much less likely to become dominant
lsquoTo females dominant roosters suggest good genes But the fact that they can still be dominant while being infertile is bad news for hensrsquo says Dean lsquoAt the moment we donrsquot know if females can detect whether or not older roosters are infertilersquo
What isnrsquot clear is whether hens get any benefit at all from mating with older males
lsquoThere are still many questions wersquore keen to answerrsquo says Dean
Perspective view of GSMrsquos peaks and valleys
Planet Earth Autumn 2010 9
Sign up for email news alerts
News
THE REMAINS of whatrsquos thought to be the oldest house in Britain have been found at Star Carr near Scarborough near traces of an ancient lake
Archaeologists at the Universities of York and Manchester say the 35m-diameter circular dwelling dates from at least the early mesolithic period ndash 8500BC It was last used just after the last ice age when glaciers had retreated from much of Europe but sea levels hadnrsquot yet risen enough to cut Britain off from the Continent
The house is older than the previous record-holder at Howick in Northumberland by at least 500 years
The people who lived there were hunter-gatherers pioneers who were colonising this landscape not long after the glaciersrsquo retreat had made it habitable again
lsquoThis changes our ideas of the lives of the first settlers to move back into Britain after the end of the last ice agersquo says Dr Chantal Conneller of the University of Manchester one of the directors of the project lsquoWe used to think they moved around a lot and left
Africarsquos national parks not working properly
Archaeologists find Britainrsquos oldest house
little evidence Now we know they built large structures and were very attached to particular places in the landscapersquo
She adds that her whole team of 12 people managed to squeeze into the space available so it could have sheltered a relatively large group
Excavations also revealed a wooden platform or trackway that could have let people cross the boggy terrain to reach the lake Itrsquos made from wood that could be as much as 11000 years old
The archaeologists found 18 post holes around the edge of the house which probably held vertical posts supporting its roof and a central fireplace This kind of structure or larger versions of it is common 500-1000 years later but this is the first known example from the early mesolithic
The archaeologists think there could be more structures nearby English Heritage has signed an agreement with the farmers who own the land at Star Carr to help protect the remains It is now investigating whether a larger-scale dig is needed to recover more information before itrsquos lost for ever
Artistrsquos impression of mesolithic hunter-gatherers at a temporary camp near Star Carr From an original drawing by Alan Sorrell
NUMBERS of zebras giraffes lions and other large mammals have plummeted by a staggering 59 per cent across Africarsquos national parks since the 1970s according to the first-ever study of the parksrsquo effectiveness The likeliest explanation is over-hunting and changing habitats both of which are driven by fast-expanding human populations
Africarsquos national parks cover five million square kilometres and are meant to play a vital role in defending some of the best-known species on the planet But until now no one has looked in detail at whether or not they work
Ian Craigie who led the research during his PhD at the University of Cambridge and colleagues from the Zoological Society of London collected data for 583 mammal populations from 78 Protected Areas They found
the steepest declines in large mammals in western Africa while the only region in which populations grew was in the south of the continent Their report is published in Biological Conservation
lsquoSouthern African parks are much better funded than parks across the rest of Africa They have more staff and so are better at defending against poachers and other threatsrsquo explains Craigie lsquoTherersquos generally a good correlation between good management and a lower risk of threats like huntingrsquo
Craigie is keen to emphasise that lsquomany creatures like rhino and wild dog only exist in the national parks If it wasnrsquot for these parks the situation might be far worsersquo
lsquoIn most parks managers know their jobs They know whatrsquos happening but they donrsquot have the resources to deal with itrsquo he adds
The impact of impacts
Disaster movies like Deep Impact with comets colliding catastrophically with Earth inevitably involve the extinction of lsquolife as we know itrsquo And just ask
the dinosaurs how big an influence meteorite impacts have on survival prospects on our planet But that doesnrsquot mean that all life is destroyed by impacts Far from it ndash our recent research is providing evidence that some bacteria may actually thrive in the thermal spring systems these events leave behind
These bugs leave behind distinctive chemical traces and we may be able to find similar traces in the impact craters of Mars Discussions are under way to develop instruments for future Mars landers to do just that
The Haughton impact crater lies in the wilderness of the Canadian High Arctic on Devon Island ndash the largest uninhabited island on Earth Nearly 40 million years ago a meteorite two kilometres across crashed into Earth leaving behind a 23km-wide crater in the bedrock and causing serious damage over an area of 50km2 It melted stone and formed what are known as impact lsquobrecciasrsquo ndash a tell-tale pattern of smashed rocks
In fact the movies exaggerate only slightly These asteroids do strike with enormous speed (more than 10km a second) On impact much of this energy dissipates into the rocks around as heat generating temperatures of thousands of degrees centigrade The rocks the meteorite encountered were mainly ancient carbonates around 470 million years old but they also contained thick beds of sulphate salts called gypsum These are the remnants of ancient seas and lakes that dried up of which there are many examples through geological time
The sulphates around the Haughton crater were broken up and even melted by the impact In some areas they were dissolved by the scalding water circulating around the newly formed underground fractures and voids ndash a natural mechanism called a hydrothermal system that cools the Earth after such events This system lasted for around 10000 years ndash
In remotest Arctic Canada scientists are discovering that life can exploit the harshest of conditions on our planet ndash not the Arctic winter but the aftermath of a massive meteorite collision Could traces of life be found in this sort of area on Mars too Adrian Boyce and John Parnell tell us more
Fragments of rock in the soil zone Haughton impact structure where iron sulphides are weathered to rusty-
coloured sulphate minerals Analysing these is valuable as an analogue for exploration on the highly oxidised martian
surface where sulphates are widespread
10 Planet Earth Autumn 2010
Planet Earth Autumn 2010 11
this sounds a long time to us but in geological time is just the blink of an eye
The occurrence of sulphate also sparks an intriguing possibility Sulphate is at the heart of one of the oldest and most important biological metabolic functions on Earth ndash bacterial sulphate reduction Just as we metabolise oxygen and organic matter to produce carbon dioxide so sulphate-reducing bacteria (SRB) metabolise sulphate and organic matter and produce hydrogen sulphide a chemical with a characteristic rotten-egg smell that makes it a favourite ingredient in stink bombs
Of microbes and meteoritesSRB can live only where there is no oxygen so they are generally found in soils mud on the seabed or even deep in the Earth in what scientists have called the deep biosphere Wherever therersquos sulphate organic matter and no oxygen yoursquore likely to find SRB activity ndash even at extreme temperatures
Much of the hydrogen sulphide they produce escapes into the atmosphere but some of it combines with iron in the surrounding rocks and mud to produce iron sulphide minerals Most commonly these are pyrite ndash foolrsquos gold ndash but also another compound called marcasite Both minerals are abundant in cracks and fissures in the Haughton impact breccia deposited by the flowing hydrothermal waters
However there are other natural processes that can make iron sulphides with no need for living things So how could we tell that SRB were responsible if all this happened many millions of years ago
We looked at the precise chemical make-up of 25 samples of iron sulphide from all over the crater and found a distinctive chemical signature very different from that which can arise without the presence of life
Atoms of the same chemical element come in different varieties called isotopes All atoms of an element have the same number of protons ndash thatrsquos why theyrsquore the same element But the number of neutrons in the atom varies Some kinds of sulphur have more neutrons than others and we found that the split between different sulphur isotopes in the Haughton crater sulphides could have arisen only through the activity of microbes
SRB much prefer the slightly lighter sulphur-32 isotope to the heavier sulphur-34 variety so the sulphides they produce contain lots more sulphur-32 than sulphur-34 This isnrsquot the case with sulphides that form naturally So therersquos little chance this isotopic signature could have been produced by a non-biological process ndash the difference between the starting sulphates and the eventual sulphides is just too great
Furthermore we have found that when this lsquobacteriogenicrsquo sulphide is oxidised back to sulphate by exposure to the weather at the surface there is very little change from the original sulphide isotopic value This means that even these sulphate minerals retain the tell-tale sulphur isotopic signature after weathering
Among those planetary bodies nearby which are thought most likely to harbour life are Mars and Europa one of Jupiterrsquos moons It also seems that their surfaces are rich in sulphates left behind from the gases given off by
ancient volcanoes This abundance has fuelled speculation that simple life on Mars could set energy from the transformation of sulphur compounds ndash sulphur metabolisms are thus a credible component of life on Mars
Areas of Mars that are thought to be rich in sulphate have already been identified as priority targets in the search for life Our new observations of widespread sulphide precipitation mediated by bacteria in impact breccias in a sulphate-rich terrain indicate that martian sulphur minerals in impact crater settings should be strong candidates for sulphur isotopic analysis and that the next missions to return to Mars should aim to gather such samples
A programme has also started to develop a mass spectrometer system to do the analysis via laser-based instruments on a lander It may be that the answer to the question of whether there is life out there could be just a laser zap away
MORE INFORMATIONDr Adrian Boyce is manager of the NERC Isotope Community Support Facility at the Scottish Universities Environmental Research Centre Professor John Parnell is Chair in Geology and Petroleum Geology at the University of Aberdeen Email aboycesuercglaacuk
FURTHER READINGParnell J Boyce A et al (2010) Sulfur isotope signatures for rapid colonization of an impact crater by thermophilic microbes Geology 38 271-74
THE IMPACT OF IMPACTS
Researchers carry out sampling in the Haughton impact structure breccias
Detlev Van Ravenswaay Science Photo Library
12 Planet Earth Autumn 2010
When we think about the oceans and their role in Earthrsquos climate we tend to think of big features like the Gulf Stream and the impact of Arctic melt water But oceanographers know that the devil is in the detail Roz Pidcock tells us how her research expedition to Iceland took ocean observation to new depths
Green plants are the basis of the food chain in the ocean just as they are on land Microscopic floating algae called phytoplankton photosynthesise
and remove carbon dioxide (CO2) from the atmosphere just like the plants in your garden This makes them important for regulating climate because as the phytoplankton die and sink down to the bottom they transfer carbon from the surface ocean to the deep sea where it can be stored away for many thousands of years But what controls this photosynthesis One important factor is how much of the main nutrient for phytoplankton growth ndash nitrate (NO3) ndash is available in the water
Phytoplankton live in about the top 50 metres of the water column ndash typically the depth to which sunlight penetrates When they grow in very large numbers such as in spring when therersquos plenty of light and food around they can quickly use up all the readily available nitrate Thatrsquos where my fieldwork comes in
I am studying ocean features called eddies and filaments Eddies are circular rotating currents up to 100 kilometres (around 60 miles) wide which are found throughout the worldrsquos oceans They usually form where two bodies of water with different densities meet for example in the north-west Pacific where the cold Oyashio current coming down from the Arctic meets the warmer Kuroshio current flowing in from the south
Giant stirring spoonsEddies act like giant spoons stirring up the water to depths of hundreds of metres As eddies turn ribbon-like filaments form at their edges just like you see when you stir milk into a cup of tea These filaments can be stretched many tens of kilometres in length but may be just 1000 metres across The longer they stretch the narrower they become
Eddies and filaments can be very efficient at supplying nitrate to phytoplankton because their horizontal circulation is accompanied by vertical motion that brings deep water up to the surface Because it has been below the sun-lit layer and beyond the reach of the phytoplankton this water is high in nitrate
Computer models and observations have shown that eddies can contribute a significant amount of the total nutrients needed each year in some parts of the ocean And over the last decade as models have become more refined they have begun to show that the filaments may be at least as important as the eddies
Clever computer models are all very well but actual observations of nutrient supply within filaments are in short supply This is partly because of the limited sensitivity of the equipment available to measure nitrate and also because until recently most in-situ studies have focused just on the eddies So in summer 2007 we set off towards Iceland aboard RRS Discovery to try to redress the balance
Current thinkingFine-tuning ocean observations
Eddies and filaments in the Iceland BasinWe took two crucial pieces of kit with us one of which ndash an ultra-violet (UV) nitrate sensor ndash had been specially developed at the National Oceanography Centre in Southampton Nitrate absorbs UV light at certain wavelengths so by shining it through the water and measuring how much comes out the other side we can calculate how much nitrate is present But until now nitrate sensors have only really been effective where concentrations are high and where changes in concentration are sharply contrasted (for example as you move away from high-nutrient coastal water into the open ocean)
But filaments involve much smaller changes in concentration and appear and disappear relatively quickly over short distances Small concentration differences are still important as they may contribute to significant vertical transport of nitrate when combined with fast upward movement of water So we developed the SUV-6 a nitrate sensor that uses a series of prisms rather than fibre optics making it about ten times more sensitive than its predecessors
The SUV-6 was deployed within our other piece of equipment ndash SeaSoar This small computer-controlled vehicle was towed behind Discovery carrying a number of different sensors It travelled repeatedly in V-shaped profiles from the surface to a specified depth
Planet Earth Autumn 2010 13
CURRENT THINKING
and back up again measuring temperature salinity chlorophyll fluorescence oxygen and light intensity every second SeaSoar has been used many times to survey the physical characteristics of eddies but this was the first time it had carried a nitrate sensor that could also take accurate measurements every second at the same time as the physical measurements We were very excited about what it might reveal
Despite giving up a large part of our survey time to avoid a lively tropical storm we identified our target a pair of eddies each about 50 kilometres in diameter We could see on satellite images that there were several filaments associated with this eddy pair We towed SeaSoar along nine parallel tracks each around 100 kilometres long which crossed the eddies from east to west Four days later at the end of the survey we had a very detailed 3-D picture of the temperature and salinity of the eddies and after some complex calculations we
When two currents (in this case the Oyashio and Kuroshio currents) collide they create eddies Phytoplankton become concentrated along the boundaries of these eddies tracing out the motions of the water
Norm
an KuringMODISN
ASA
could tell how the water was moving how fast and how much vertical water movement was taking place
But the really good bit came when we looked at the simultaneous nitrate measurements from the SUV-6 These enabled us to calculate the amount of nitrate being transported at every point in our 3-D grid For the first time instead of just using a few individual profiles to infer nitrate transport over the whole eddy we
were able to work with a continuous dataset meaning our calculations were far more accurate than has been possible in the past
These unique results mean we can investigate how the nitrate moves around
relative to different parts of the eddy ndash its spatial variability And because we carried out four similar surveys over the course of four weeks we can also study the temporal variability ndash how the spatial patterns change with time
We can also calculate the overall nitrate transport at a particular depth for the whole eddy feature to see if there is an overall upward or downward flux or movement of nitrate and how big it is This is important to understand how the eddy feature as a whole contributes to phytoplankton growth in the upper sunlit layer
of the ocean Finally and most excitingly for us we can make an accurate assessment of the vertical movement of nitrate associated with any point inside a filament to test the modelsrsquo suggestion that transport within filaments is just as important as within the main eddy
So what nextWe are still analysing the results from our trip to the Iceland Basin But we already know for sure that integrating SUV-6 into SeaSoar has created a powerful tool for studying the role of eddies and filaments in supplying nutrients to ocean plants
More surveys like ours will dramatically increase our understanding of oceanic processes Direct observations of eddies and filaments will help make ocean models increasingly realistic and improve our understanding of the role of oceans in climate-change predictions
FURTHER INFORMATIONRoz Pidcock is a PhD student at the National Oceanography Centre in Southampton Email remp103nocsotonacukwwwnocacuk
FURTHER READINGPidcock R et al A novel integration of an ultra-violet nitrate sensor on-board a towed vehicle for mapping open ocean submesoscale nitrate variability Journal of Atmospheric and Oceanic Technology August 2010
SeaSoar on deck
Eddies can contribute a significant amount of the total nutrients needed each year in some parts of the ocean
14 Planet Earth Autumn 2010
Traditionally grown for tequila and fibre agave could also become an important source of energy in the dry regions where it thrives Andrew Leitch Theodosios Korakianitis and Manuel Robert describe their teamrsquos efforts to investigate this plant grouprsquos energy potential
The trend towards replacing fuels derived from oil with cleaner renewable ones generated from living organisms is a very attractive proposition but itrsquos full of potential problems that need to be addressed in detail
Recent events in the Gulf of Mexico make biofuels even more relevant in the light of the environmental problems associated with the oil industry But we need to make the new methods as efficient and environmentally friendly as possible and to find the right strategy for different regions of the world so that new fuels are economically competitive
Producing new fuels locally would reduce the very high costs of transporting them from one place to another and the risks of contaminating the environment Also crops used to produce biofuels must not affect the production of food or alter its markets This has already happened to Zea mays (maize) production in the Americas where demand for maize as a biofuel food and fodder crop led to higher prices
All this means we will need more than one strategy to satisfy an energy-hungry world while taking account of the threat of climate change the market laws of price competition and the specific needs of different countries Agaves could play an important role
For many years these plants have been a source of products including sugars for producing alcoholic drinks like tequila and hard fibres such as henequen and sisal for making products including ropes twine and bags But these same raw materials could become an important source of biofuels whether bioethanol or biodiesel
Agaves are perennial plants that produce large leaves in a rosette form Their size and lifespan vary enormously between species from 20 to 200cm in height and between 8 and 30 years old Cultivated agaves
AGAVEBiofuel of the future
Russell GordonDAS FOTOARCHIVStill Pictures
Planet Earth Autumn 2010 15
AGAVE ndash BIOFUEL OF THE FUTURE
benefit from adequate water from rain but most are well adapted to arid conditions and tolerate high temperatures and water shortages This means they can be grown on land that would not be suitable for other purposes and where soils are easily degraded by disturbance
It is not clear whether these plants can become an economically competitive alternative source of biofuels but their biomass and growth characteristics make it worth looking into the possibility particularly given the dry conditions that climate change may create in many parts of the world
How to exploit the plant depends on the type of agave and the final product aimed for Alcohol is made by fermenting the sugars stored in the plantrsquos lsquobolersquo or stem after many years of growth while biodiesel could be produced using fast pyrolysis burning the biomass harvested regularly from fibrous agave leaves
The most efficient alcohol-producing agave is Agave tequilana Weber best known as the blue agave from which tequila is made The industry generates an average of 120 tons of boles per hectare every six years from which 20000 litres of tequila (46 per cent alcohol) are produced
One of the most important questions is how to transport the raw material to the processing plants This calls for small facilities near the industryrsquos centres of operation This is nothing new in Germany hundreds of small plants that make methane from agricultural waste are being strategically placed near farms and the production facilities of companies that use fast pyrolysis to generate crude biodiesel are all found near where the crops are grown
Agaves produce considerable biomass though not nearly as much as annual crops A key advantage would be that no new planting is needed and it takes relatively little work to maintain existing or new plantations
It is also possible to use waste leaves left by the tequila industry or the stems and short fibre
discarded during henequen or sisal production This might not generate very much biodiesel but it would not require any extra expenditure on establishing and running new plantations or on fuel to move products long distances
Another alternative for biofuel production has already been implemented in Tanzania ndash a plant that makes biogas from the controlled fermentation of the liquid waste generated when leaves are decorticated ndash their outer layers removed and their fibres extracted The gas methane is burnt on site to generate electricity This in turn powers the decorticating plant and the small town nearby Any that is left over is sold to the national network
The best fuel will be suitable for combustion engines We now need to examine different species and varieties of agave to determine how best to produce biofuels for this use We will soon be seeking funding to let us select fuel production processes engine materials and fuel mixtures suitable for combustion engines taking into consideration engine performance and the emissions of agave-derived biofuels
Improving the cropThe main problem when considering agaves for industrial purposes is that they have not been studied in detail There are many taxonomical studies classifying different agave species according to where they fit into the wider group but only a small number of papers have been published on functional aspects of their biology such as genetics biochemistry and physiology
We have made a start on this study by analysing the genome organisation of commercially grown agave species and generating physical and genetic maps These maps can be used to find agave lines most suitable for using targeted breeding to create new varieties with particular desired characteristics using strategies already well
developed in breeding new varieties of other crops
However most agaves spread vegetatively through rhizomes ndash underground root-stalks This is an advantage when producing planting material as this can be done simply by taking cuttings But it presents us with a challenge for genetic improvement as itrsquos hard to combine the genes of two different plants by breeding them So far the only successful
Ron GilingLineairStill Pictures
Russell GordonDAS FOTOARCHIVStill Pictures
programme to genetically improve agaves was carried out in Tanzania during the first half of the twentieth century Then it took George Lock around 30 years to produce a family of hybrids that produce long fibre We hope to make progress more quickly than that
New more efficient and faster-growing varieties will be needed and we plan to use new molecular techniques such as the use of genetic markers to help selectively breed plants with desired characteristics together with new methods to grow plant tissues efficiently These advances will shorten the time needed to generate new plant materials A programme for the genetic improvement of Agave tequilana using these techniques is already under way in Mexico However much more work is needed
The best way to use agaves will depend on the special circumstances of the place where they will be grown and a combination of options may be called for However since agaves have not been genetically improved in a consistent way the most important initiative to consider is a large-scale long-term programme for the selection and generation of new agave types that will be more suitable for biofuel production
Even using the best modern genetic techniques this process of selective breeding will be long and difficult But in the end it could provide us with new and useful sources of renewable carbon-neutral energy that can thrive in hot dry conditions It could be grown across large tracks of land that currently have little agriculture or only subsistence farming and often limited conservation value This means the industry doesnrsquot just offer cleaner energy it could also bring wealth to people who suffer from extreme poverty
MORE INFORMATIONAndrew Leitch is Professor of Plant Genetics and Theodosios Korakianitis is Professor and Chair of Engineering both at Queen Mary University of London Dr Manuel Robert is a member of the biotechnology department of the Centro de Investigacioacuten Cientiacutefica de Yucataacuten in Mexico Email arleitchqmulacuk talexanderqmulacuk or robertcicygmailcom
FURTHER READINGKorakianitis T Namasivayam A and Crookes RJ (2010) Natural-gas fueled spark-ignition (SI) and compression-ignition (CI) engine performance and emissions Progress in Energy and Combustion Science doi101016jpecs201004002
Robert ML Lim KY Hanson L Sanchez-Teyer F Bennett MD Leitch AR and Leitch IJ (2008) Wild and agronomically important Agave species (Asparagaceae ) show proportional increases in chromosome number genome size and genetic markers with increasing ploidy Botanical Journal of the Linnean Society 158 215-22
Harvesting agave leaves on a sisal plantation in Tanzania
16 Planet Earth Autumn 2010
To find your way using a magnetic compass with a map you need to know the difference between magnetic north and map north This difference is called
lsquogrid magnetic anglersquo and in the UK it is derived from a model of the Earthrsquos magnetic field which is updated every year The variation
To go north you just follow your compass towards magnetic north right Not quite Geophysicists have to work hard so we can continue to navigate with map and compass Susan Macmillan and Tom Shanahan describe how the UK magnetic repeat station network helps
in grid magnetic angle reflects changes in the Earthrsquos magnetic field arising from sources in the Earthrsquos fluid outer core We donrsquot yet understand these changes well enough to make good forecasts so we need to monitor them continuously
Some of the data we need has been provided by an important UK-wide network of magnetic survey stations that has been operating since the
early 20th century At these lsquorepeat stationsrsquo very
accurate measurements are made of the magnetic
field strength and direction over a
whole day
every few years at exactly the same place The readings are influenced by different sources of magnetism (see explanations to the right) and all these need to be carefully considered when making and processing magnetic field observations
For example in the UK the horizontal direction of the main field is currently changing by about 02deg each year But we can also see this much variation between sites just a few metres apart because of variations in the crustal fields Taking repeated measurements at exactly the same spot lets us measure the core magnetic field signal without the risk of distortions from changes in the crustal field
Likewise variations in the magnetosphere surrounding the Earth cause the overall magnetic field to fluctuate by about 02deg each day in the UK and by considerably more during a magnetic storm During a storm in October 2003 the magnetic field direction was observed in the UK to change by over 5deg in six minutes Fortunately these variations are short-lived compared to those from the core We measure them at the three UK magnetic observatories and can then subtract them from the repeat station data
Having processed and modelled the data
Where is North
The Earthrsquos magnetic field The magnetic poles are shown as red lines Magnetic field lines (orange) can be seen emerging from the south magnetic pole and converging at the north magnetic pole which is offset from the geographic north pole (blue lines) by eleven degrees Mark GarlickScience Photo Libarary
PasiekaScience Photo Libary
Planet Earth Autumn 2010 17
WHERE IS NORTH
MAGNETIC FIELD SOURCES
n The Earthrsquos magnetic field mostly arises
from the motions of fluid in the Earthrsquos
outer core region and changes slowly
with time
n Weaker fields from magnetic material
in local rocks (the lsquocrustal fieldrsquo) vary
significantly over the surface of the Earth
ndash often aiding geological interpretation ndash
but not so much with time
n The Earthrsquos magnetosphere ndash where the
planetrsquos magnetic field interacts with
charged particles from space ndash causes
variations in the observed magnetic field
These are affected by the Sunrsquos activity
and are relatively rapid compared to those
from the core
we can update the magnetic charts We can see that the correction we need to apply to a compass bearing to convert it to a map bearing ndash and vice versa ndash varies both in space and in time The models are then used to supply the Ordnance Survey with the magnetic north data they need for their maps
East is least west is bestThe earliest observations of the geomagnetic field in the UK were made in and around London in the late 16th century At that time magnetic north was east of map north However it was not until the early 20th century that we had a genuine repeat station network covering the whole of the UK with sites that could be revisited at regular intervals
Several magnetic surveys were made before this though Perhaps the most noteworthy were the efforts of Major Edward Sabine between 1834 and 1838 At that time magnetic north was more than 20deg west of map north Later he was to declare that this survey lsquodeserves to be remembered as having been the first complete work of its kind planned and executed in any country as a national work coextensive with the limits of the state or country and embracing the three magnetic elementsrsquo
Sabine also pointed out that such surveys are able lsquoby their repetition at stated intervals to supply the best kind of data for the gradual elucidation of the laws and source of the secular change in the distribution of the Earthrsquos magnetismrsquo These early magnetic surveys were major undertakings given the delicate but sizeable instruments available at that time and the challenges of travelling across the country
Nowadays the instruments used are a lsquofluxgate-theodolitersquo allowing us to measure the direction of the magnetic field and a lsquoproton precession magnetometerrsquo for measuring its strength We determine the direction of true north using a north-seeking gyroscope Each site is marked by a buried slab of concrete and detailed site plans allow us to set up our equipment in exactly the same place each time
The data we get from these stations can also help us understand the crustal magnetic field By measuring the magnetic field at the same locations very accurately over long periods of time we should be able to distinguish between the different types of crustal magnetisation This can be either lsquoremanent magnetisationrsquo which is lsquoembeddedrsquo in rocks
when they form or lsquoinduced magnetisationrsquo which rocks take on when exposed to the Earthrsquos ambient magnetic field
As the core field changes with time there should also be small changes in the crustal magnetic field if there is induced magnetisation present ndash although detecting these very small signals in measurements that contain signals from a variety of sources is quite a challenge
But for the foreseeable future the main and most crucial application of the data is likely to be navigation Yoursquoll be making use of magnetic field data next time you use a map and compass to find the next destination However itrsquos also used whenever something needs to be set up to point in a precise direction with the help of a compass This includes everything from aligning sundials and satellite dishes to making sure mosques face towards Mecca
MORE INFORMATIONDr Susan Macmillan and Tom Shanahan are members of the BGS geomagnetism team Email smacbgsacuk or tjgsbgsacuk
FURTHER READINGJackson A Studies of crustal magnetic anomalies of the British Isles Astronomy amp Geophysics 2007
18 Planet Earth Autumn 2010
The sediment left behind by rivers forms a unique record of the climate written in sand and gravel But wersquore only starting to understand how to examine it in detail Arjan Reesink reports on words of river history that have never been read before
Reading naturersquos barcode
As rivers gradually shift across the landscape over decades and centuries they leave behind deposits of sand and gravel with a remarkable diversity
of internal layering The texture of these river deposits is dominated by inclined layers of sediment sorted according to size by the action of the water
Donrsquot be tempted to believe this is all just plain sand Repeated sorting and re-sorting of the sand ultimately builds a vast record of river history cryptically written in a natural barcode that has been the same since the dawn of time Can we decipher the response of rivers to climate change from this barcode
Mostly hidden from sight by the water ripples dunes and sandbars slowly migrate downstream over riverbeds The downstream slopes of these features on the river bed get
steeper and steeper until they collapse under their own weight Miniature avalanches of sand generate thin inclined layers as each feature advances along the river bed
Until recently noone was crazy enough to count these avalanches as well as the little ripples that migrate over the edge of larger dunes But the exercise pays off little ripples generate their own unique pattern as they tumble over the edge of the larger dune slope And it isnrsquot just ripples tumbling over the edge of dunes Many different types sizes and shapes of bedforms ndash features of the riverbed landscape ndash are found superimposed on one another Each combination of bedforms can be produced only by a limited set of flow conditions and each such combination has its own signature Changes in river flow are recorded as changes in the layering of the sediment
Histories of climatic change are found in river deposits just as the effects of ice ages are found in deep ice cores Theyrsquore just a bit smaller
Exposed dunes on a bar in the Paranaacute River Argentina
Planet Earth Autumn 2010 19
READING NATURErsquoS BARCODE
The climate controls each riverrsquos temperament and behaviour and this is one of the reasons why we need to understand climate change Rivers in flood are serious natural hazards and the number and size of floods change with the climate Sure we can use temperature and precipitation data and make models of how river discharge and behaviour will change But why donrsquot we look more carefully at the river records themselves
If climate controls a riverrsquos behaviour and this in turn controls the riverrsquos sedimentary record then river records are proxies of the ancient climate Histories of climatic change are found in river deposits just as the effects of ice ages are found in deep ice cores Theyrsquore just a bit smaller
Many paleoclimatologists spoiled with deep-sea lake and ice cores would argue the archive preserved in rivers is incomplete and fragmented Honestly do I dare compare river deposits to ice cores Of course no records of temperatures over thousands of years will be identified from river deposits The information in river beds is more subtle than that If ice cores are like a chronological story river deposits are more like jumbled-up words and torn-out pages If it really was easy it would have been done already
The careful experimentation needed to start translating the barcode means long hours spent in a gloomy basement with air compressors air-pumps and propeller-pumps singing in deafening harmony Circulating water and sand in an experimental setting allows us to observe and measure river processes without having to wait for the right flow conditions
Testing the validity of these experimental results requires going outside and shovelling
Different types of strata in a single trench through a sandbar on the South Saskatchewan River CanadaDifferent types of strata exposed by scraping the surface of a bar on the Paranaacute River Argentina
truckloads of sediment from natural rivers The sedimentary structures can be seen in rock cliffs but are easier to place in the context of the landscape when they are exposed by trenches dug in river bars The coarser sand crumbles faster as the trench face dries and this makes the structures visible The fieldwork thus ranges from making sketches in a local quarry in a sunny breeze to drop-offs on a sandbar hours from civilization in the middle of the Cumberland Marshes a blank spot on the Canadian map Good data often come from the strangest places
Decoding the river bedWhat new knowledge has this given us By carefully controlling the flow of water in an experimental setting we have developed a dictionary to let us translate these natural barcodes For example we now know that ripples on dunes form layers with reasonably constant cross-sections that are separated by thin fine-grained layers Ripples exist on dunes only in very gentle flows when turbulence only occasionally affects the sediment
In real life this means that ripples exist on dunes in a very narrow range of flow conditions and when dunes are being replaced by ripples after the peak of a flood has passed Ripple-on-dune layering tells us about how the river has flowed A set of a single dune with evidence of superimposed ripples represents a short segment of time it is like a single word describing a historical event
On a larger scale we can look at the inclined layers along the length of sandbars to describe their history of movement Dunes form on bars and bars move fast when there is a lot of water flowing in the river Ripples form on bars and
bars move more slowly in medium flows And during low flows bars emerge and water flows around them reshaping their edges Repeated floods eventually create recurring cycles of structures So sets formed by sandbars are like pages of text describing historical events
We have only just begun to realise that we can get detailed information from river deposits It is almost as if we have never read the contents of the chapters only the summaries We inferred the contents from these summaries but were we right
River deposits are built through cycles of repeated sorting of sediment driven by dynamic interactions between the flow of water and the river bed and ultimately subject to the riverrsquos temperament They are the product of changes in their environment and as such make up a vast record of information about the ancient climate It is cryptically written in a natural barcode but it is there for anyone who wants to translate it Besides now being able to read naturersquos barcode the most illuminating aspect of this study is perhaps the realisation that science can still be pushed forward simply using a shovel
MORE INFORMATION Dr Arjan Reesink is currently a post-doctoral researcher on NERCrsquos Rio Paranaacute project at the Universities of Brighton and Birmingham Email ajhreesinkbrightonacuk
The Rio Paranaacute project focuses on the dynamics of one of the worldrsquos largest rivers see also wwwbrightonacukparana
20 Planet Earth Autumn 2010
When I tell people I do research in a radiocarbon laboratory a common response is lsquoOh right like radiocarbon dating the Turin
shroudrsquo Radiocarbon dating is a valuable technique for dating objects of historical and archaeological importance but itrsquos also a powerful tool in the quest to understand our environment In particular because it deals with an isotope of the element carbon radiocarbon analysis can tell us about processes that are fundamental both to life on Earth and to our climate
Radiocarbon analysis was pioneered over 60 years ago and the technique continues to be improved At the NERC Radiocarbon Facility (Environment) in East Kilbride we have come up with new techniques for collecting CO2 for radiocarbon analysis This is the story of these new sampling systems some of their applications and the insights they have provided
CO2 is important to many processes that occur on Earth a component of our planetrsquos atmosphere and in terms of climate change one of the most important greenhouse gases
Plants use CO2 from the atmosphere for growth through photosynthesis Most of the CO2 they absorb will at some stage return to the atmosphere but crucially the time it spends
In a radiocarbon laboratory in Scotland researchers came up with a new portable kit to sample carbon dioxide using a clay sieve Mark Garnett tells us how theyrsquove taken this technique to some remote places and how itrsquos shedding new light on CO2
The carbon age
The new portable equipment
locked away can vary from less than a day to millions of years For example carbon fixed by a plant during photosynthesis will cycle through it very rapidly and may be returned to the atmosphere as the plant lsquobreathesrsquo Alternatively carbon that sits in a plantrsquos tissues is likely to end up in the soil when the plant dies and depending on the rate of decomposition it can stay there for decades or even millennia In extreme cases some carbon fixed by plants millions of years ago is only now being released as we burn fossil fuels
The rate that carbon cycles through these various routes before returning to the atmosphere as CO2 has a critical influence on its concentration in the atmosphere This is because the amount of carbon in the Earthrsquos atmosphere (mostly as CO2) is small compared to that in the oceans and on land
This is where radiocarbon dating comes in It tells us how long carbon has remained in a particular pool (soil for example) and therefore the rate that it cycles through that pool Measuring the radiocarbon in the CO2 leaving the carbon pool can show us directly the average age of the gas entering the atmosphere
All this is possible because carbon naturally occurs in three slightly different forms (isotopes) Two are lsquostablersquo while the third ndash radiocarbon ndash is lsquounstablersquo because itrsquos
Planet Earth Autumn 2010 21
THE CARBON AGE
radioactive and decays as it emits radiation So its concentration declines over time relative to its stable counterparts and measuring the relative proportions of the carbon isotopes in a material forms the basis of carbon dating
In addition nuclear weapon tests in the mid-20th century produced a rapid but temporary global increase ndash a lsquospikersquo ndash of radiocarbon in the atmosphere which can be tracked throughout the carbon cycle This spike lets us date very recent materials which canrsquot be done using conventional carbon dating
Our challenge was to develop a sampling system that researchers could use in remote field sites Although a few milligrams of carbon are enough for analysis in most cases the concentration of CO2 in the actual samples is extremely small ndash typically a suitable sample would require 5-10 litres of air Transporting such volumes in gas sample bags or glass flasks would be impractical Alternative methods such as cryogenic purification ndash where CO2 is separated from other gases in air by cooling in liquid nitrogen at -196degC ndash are also impractical not to mention potentially hazardous in the field
Sieving the carbonThanks to earlier work by researchers at the East Kilbride lab we knew the key was a zeolite molecular sieve Zeolite is a rather unimpressive looking clay material which has remarkable properties Firstly it contains a uniform network of tiny pores which allow small molecules (including CO2) to pass through but exclude larger molecules Secondly at room or field temperatures this molecular sieve attracts certain molecules to its surface ndash a process called adsorption ndash and the type we use strongly adsorbs CO2 This means that when we pump air through the molecular sieve all the CO2 is trapped within its pores Crucially for a system that has to be used in the field it has a high surface area so only a small amount of molecular sieve is needed to collect a suitable sample When heated to several hundred degrees celsius back in
the lab the sieve releases the stored gas These characteristics make it ideal for our purposes
Our system also uses an infra-red gas analyser which measures CO2 concentration in the air being sampled so we can estimate when a big enough sample has been collected It needs no external power supply and can be easily transported and operated by one person
Developing the system has had huge benefits For example in the NERC-funded International Polar Year ABACUS project it was used to work out the age of CO2 produced from decomposing soil in birch forest and tundra heath (where cold temperatures prevent tree growth) To collect the samples required daily hikes over many miles of tundra and sampling chambers had to be tied down to cope with the high winds and exposed conditions (fortunately they escaped the attention of the numerous passing reindeer) Results showed that although these soils contain carbon that is hundreds of years old most of the CO2 emitted from the soil surface had been fixed from the atmosphere within the last decade or so There was also evidence for much faster carbon cycling in the forest compared with the tundra heath This will have implications for the overall rate of carbon emissions if forest replaces heath in these regions which may be occurring due to global warming
The system has also helped investigate CO2 emissions from UK peatlands which contain vast stores of carbon One surprise was that deep-rooted plants act as conduits for greenhouse gases dissolved deep in the peat We know that plants like sedges help transport methane to the peat surface but it was news to scientists that they provide a similar service for CO2 thatrsquos hundreds of years old And by connecting the sampling system to a floating chamber we managed to collect and date CO2 coming from the surface of peatland streams Surprisingly radiocarbon results show that this CO2 can be ancient derived either directly from deep bedrock weathering or potentially from
CO2 taken in by plants more than a thousand years ago
As if this isnrsquot enough a whole new range of possible applications have emerged since we developed the technique so it could also be used as a lsquopassive samplerrsquo This means that we simply rely on the CO2 moleculesrsquo own kinetic energy to get them to the molecular sieve ndash no pump required So the sieve only needs to be exposed to the atmosphere being sampled to get sufficient CO2 before itrsquos returned to the lab for analysis This is particularly helpful in remote and inaccessible locations ndash for example in Arctic Sweden we managed to collect CO2 from underneath the snow during winter for the first time ndash completing a whole yearrsquos sampling without a break The soil carbon emitted during the winter (a significant proportion of the annual total) proved to be of a similar age to emissions during the growing season
This isnrsquot the end of the story though There are even more possibilities for applying both sampling systems and the study of fossil-fuel emissions could be a particularly fruitful one Because of its extreme age there is no radiocarbon in fossil fuel so if we canrsquot detect any radiocarbon our samples must be very old (at least 50000 years old) Our sampling methods could be used to quantify how much of the CO2 in the atmosphere comes from fossil fuel helping us understand the impact of fossil-fuel burning on global warming It could also be used to test for CO2 leakage from carbon capture and storage facilities helping maximise the contribution they make to reducing our carbon emissions
FURTHER INFORMATIONDr Mark Garnett is deputy head of the NERC Radiocarbon Facility (Environment) hosted by the Scottish Universities Environmental Research Centre East Kilbride email mgarnettnercrclglaacuk
Development of the sampling system was supported by the NERC Radiocarbon Facility and a NERC CEH studentship (Susie Hardie) based at the Scottish Universities Environmental Research Centre East Kilbride and CEH Lancaster
Sampling chambers had to be tied down to cope with the high winds and exposed conditions
The carbon age
Collecting soil respired carbon dioxide from Arctic tundra for radiocarbon analysis
David BarrettAlamy
22 Planet Earth Autumn 2010
Jobs for the
Scientists have been sampling the English Channel for more than a century investigating its biology and chemistry and monitoring its tides and currents
The Channel is a complex environment yet in many ways is representative of coastal seas around the UK The western Channel off Plymouth is especially interesting as it is here that oceanic and coastal waters meet ndash an ideal area to monitor long-term changes brought about by rising sea temperatures for example or shorter term as the seasons come and go Such information helps us understand the health of the sea how it behaves and what affects it But getting the information has never been straightforward
Until recently the only way we could collect data was to visit the sampling sites on our research vessel to take a range of physical measurements such as temperature salinity and optics or to obtain biological samples directly from the water for analysis back at the laboratory At best we managed this on a weekly basis but itrsquos a highly weather-dependent activity so there were no guarantees And while such long-term data has proved invaluable in helping us understand longer-term trends and
Two bright yellow 7m-tall buoys bristling with sensitive instruments are providing scientists with an unprecedented amount of detail about the English Channel Dr Tim Smyth manager of the data buoy project at Plymouth Marine Laboratory (PML) tells Kelvin Boot about his favourite new toys
buoys
Planet Earth Autumn 2010 23
JOBS FOR THE BUOYS
Jobs for the therefore large-scale changes in the Channel it left a serious gap in our understanding of what is happening on a daily or even hourly timeframe
The deployment in 2009 of our two shiny new buoys at the imaginatively named sampling sites L4 and E1 marked a significant advance in both the quality of the information and the ease with which we could get it The buoys are autonomous ndash they send us their data automatically almost as soon as itrsquos recorded enabling us to fill in the gaps between the weekly boat-collected samples
The buoys are part of the Western Channel Observatory which combines routine in-situ sampling with modelling and remote sensing Between them they cover a range of conditions At around 7 nautical miles off Plymouth L4 is close enough to shore to tell us about inputs from the local estuaries E1 is sampling in very different conditions 25 nautical miles offshore on the open continental shelf where there is more of an oceanic character so the two datasets provide a comparison of the impact and timings of any changes taking place
So apart from being new what makes these buoys so special They carry an impressive array of equipment powered by a combination of solar and wind energy This variety of instrumentation ndash which wersquoll look at later ndash and their flexibility make the buoys unique But their other star quality is their ruggedness This is crucial because conditions in the English Channel are harsh with waves up to 6m strong winds and a high volume of boat traffic In short itrsquos hostile and busy causing serious logistical problems for long-term buoy deployments
Standard environmental monitoring buoys used around the world would simply not be up to it so we went back to the drawing board to create something new We worked with Plymouth company Hippo Marine to design and build the new buoys to withstand the Channelrsquos tough conditions while enabling the equipment to take the sensitive measurements needed Integral to the design is a lsquomoon poolrsquo ndash an enclosed column of water at the centre of the buoy which enables the instruments to be lowered into the sea and remain submerged and working while being completely protected
Each of the buoys weighs around 35 tonnes and requires 6 tonnes of anchorage to keep it in place To add to the challenge they also have to be kept on station and facing in a constant direction to ensure the solar panels are oriented efficiently and the optics equipment is unshaded
It hasnrsquot all been plain sailing We really were
at the mercy of the elements when it came to getting the buoys to their stations and on more than one occasion the deployment mission had to be aborted as the weather deteriorated Tethering the buoys was also quite a challenge ndash the possibility of a 7m buoy running amok in one of the worldrsquos busiest shipping lanes was not to be contemplated lightly as wersquod learned from experience Even with all its heavy-duty tethering the L4 buoy decided to make a break for a nearby beach during a test run in 2008 Following this the entire system was refined and improved so our buoys can hopefully stand up to anything the Channel will throw at them in the years to come
Down to the detailWe can use the long-term data collected by boat to establish a baseline for studying how humans are affecting the oceans and the planet through climate change For example changes in temperature affect ocean chemistry and cause variations in the make-up of the biota ndash the plant and animal life With the buoys now fully operational we also have high-frequency small-scale data which lets us look at short-term changes and see how they in turn affect the longer-term trends All this gives us a much greater understanding of our coastal waters
Take plankton blooms for example which can appear within hours and spread and die within days Blooms are important because they may concentrate food fish for example which could be a boon to fishermen ndash or concentrate toxins ndash lsquored tidesrsquo that are a threat to shellfisheries So we need to understand what causes these blooms and why a particular species appears one year and maybe not the next
Small changes in the physics or chemistry of the sea may hold some of the answers but it is likely to be a complex combination of factors Our sensors are measuring temperature salinity nitrate levels sediment concentrations
and chlorophyll They also measure coloured dissolved organic material which can lsquostainrsquo the water reducing the amount of light available for photosynthetic phytoplankton and interfering with satellite readings of things like sea-surface temperature and phytoplankton concentration Therersquos even a weather station and camera on board By studying these factors we can begin to understand how changes in the environment temperature and nutrient availability for example affect the marine ecosystem on an hourly basis giving us the potential for predicting the onset of phytoplankton blooms
The L4 buoy has already given us information on the influence on phytoplankton of fresh- water surges resulting from flood conditions in the River Tamar These lsquofresheningrsquo events brought extra nitrates into the sea from river run-off and resulted in blooms at a time when conditions were otherwise unsuitable for accelerated plankton growth Wersquod had our suspicions about this for many years but until now had not been able to recover any evidence on our weekly sampling visits
Put this small-scale detail together with PMLrsquos expertise in ecosystem modelling remote sensing and our existing weekly in-situ observations and you get some very useful insights into what is happening in the English Channel This level of detail will directly support decisions about the sustainable management of our coastal and shelf waters Not only that but as different questions about the chemistry and physics of the sea arise and new methods of study are developed our buoys are flexible enough to accommodate new instruments to provide the data needed to respond
One could be forgiven for thinking that the data buoysrsquo hourly readings combined with broad-scale satellite readings would make boat visits redundant This is not the case we still need other readings and water samples for analysis in the lab because the deeper water column still eludes the satellites and the data buoysrsquo instruments But before 2009 we had only part of the story now we have boat buoy and satellite working together to give us the complete picture
FURTHER INFORMATIONThe buoys were funded through NERCrsquos Oceans 2025 initiative which is implemented through seven leading UK marine centres wwwoceans2025org
Dr Tim Smyth is manager of the data buoy project at PML Email tjsmpmlacuk Kelvin Boot is science communicator at PML Email kelotapmlacuk
Western Channel Observatorywwwwesternchannelobservatoryorguk
The possibility of a 7m buoy running amok in one of the worldrsquos busiest shipping lanes was not to be contemplated lightly
24 Planet Earth Autumn 2010
A key part of being human is our lsquobipedalrsquo posture ndash we walk upright on two legs The development of bipedalism was a critical stage in our
evolution Another was the later transition from early habitual bipeds such as Australopithecus africanus made famous by the skeleton lsquoLucyrsquo to more modern humans like Homo erectus and Homo sapiens which were and are endurance walkers and runners
Our ancestorsrsquo ability to walk efficiently influenced how they foraged and hunted for food how they gathered raw materials for tools and how they migrated across the globe But despite more than a century of research our understanding of the modern foot is still relatively poor and our knowledge of our ancestorsrsquo feet is even more uncertain
The foot is a complex structure of 22 bones held in place by a lattice of soft tissue It interfaces with the ground to create pressures which decelerate balance and accelerate the body during walking and running Little wonder this complex machine has not given up its secrets easily
Fossil foot bones are rarely found with skeletons of known species and the fossil record is fragmentary When we do find part of one of our ancient ancestorsrsquo feet it has usually been badly chewed by scavengers And fossil foot bones rarely give a definite indication of how our early ancestors walked since they act
through a series of complicated soft tissues which are rarely preserved ndash from ligaments to the outer skin ndash so they interact only remotely with the ground
Fossilised motionWe believe human footprints provide a better record of our ancestorsrsquo feet than foot bones ndash a record of lsquofossilised motionrsquo formed as they walked across soft ground The prints directly record the forces our forebears applied to the ground to balance and propel their bodies
Our team is a collaboration between field
scientists at Bournemouth University led by Professor Matthew Bennett who have expertise in excavating and recording footprints and experts in biomechanical modelling at the University of Liverpool under Professor Robin Crompton Our goal is to meld field science with computational analysis and simulation to reveal the fossilised motion of our ancestors
Until relatively recently human and
animal footprints were thought to be rare in the geological record ndash freak occurrences of sedimentary preservation with each one holding a rare glimpse of locomotive behaviour But wersquore coming to realise that footprint sites probably arenrsquot so scarce itrsquos just that they havenrsquot been properly identified and analysed before
The oldest and most famous ancient footprints are at Laetoli in Tanzania made some 375 million years ago by an ancestor similar to lsquoLucyrsquo (Australopithecus africanus) Last year we published in Science details of the
second-oldest human footprint site found in northern Kenya dating from 15 million years ago
We think these footprints were made by Homo erectus one of the first of our ancestors capable of long-distance walking and running Comparing these sites and prints will help us understand the transition in locomotive
style between species of Australopithecus and Homo There are also other more recent human footprint sites around the world and lots still to be discovered with prints made by Homo sapiens in diverse settings like coastal mudflats caves and layers of volcanic ash
These sites help us understand the data on lsquofossil locomotionrsquo from ancient footprints For example some team members have just
We believe that human footprints provide a better record than foot bones of our ancestorsrsquo feet
Tracking our ancestors
New techniques let scientists analyse ancient footprints to understand how our forebearsrsquo physiques and lifestyles changed over time Matthew R Bennett Robin Huw Crompton and Sarita Amy Morse describe recent breakthroughs in the science of fossilised movement
Planet Earth Autumn 2010 25
TRACKING OUR ANCESTORS
lateral thinking and realised that methods used to analyse chemical patterns in the brain are also ideal for comparing footprints They have developed a new approach which lets us calculate an lsquoaveragersquo footprint from a whole trail and then compare it statistically to other print populations
This lets us objectively compare prints made by different species at different times and helps develop models of how human locomotion has evolved For example the technique has helped resolve a 30-year debate over the Laetoli footprints showing they were made not by a creature that walked with bent hips and knees but by a more modern version with a gait not so far from our own
Studying these footprints has greatly improved our knowledge of our ancestors We can more accurately place them on the map chronologically see what fauna they interacted with ndash even make them walk through computer modelling We canrsquot research our forebearsrsquo feet directly but our work may ultimately mean the prints they left behind are just as good
MORE INFORMATIONMatthew Bennett is Professor of Environmental amp Geographical Sciences at Bournemouth University Robin Huw Crompton is Professor in the Institute of Ageing and Chronic Disease at the University of Liverpool Sarita Amy Morse is a student of the anthropology department at Rutgers State University of New Jersey Email mbennettbournemouthacuk
returned from Namibia where one of the richest footprint sites in the world recently came to light The site contains many human trails and a plethora of animal prints including elephants giraffe buffalo cattle goatssheep and a range of birds The site is in a large dune field and each day the team used quad bikes to reach it ndash a former mudflat over which the dunes have migrated The footprint surfaces are only exposed for a few years at a time as they are revealed and then covered again by the mobile dunes
The sitersquos age will not be known until the results of our dating programme are completed later this year and it is probably only a few thousand years old But it contains important information to help us interpret ancient footprints since the prints reveal the subtle influence of the surface they are made in In one case there is a trail of more than 70 prints formed by an individual walking across a shallow channel and mudflat The individual prints vary in their anatomy and with the type of sediment they were made in particularly its moisture content Adding sites with different properties to our database of knowledge is crucial if we want to understand the patterns of foot pressure caused by different styles of locomotion and foot anatomy The team will also be returning to northern Kenya and the second-oldest footprint site in the coming year to continue excavating these ancient prints
3-D scans of a human footprint from Formby UK (left) c3500 years old and one of the prints from the quarry at Valsequillo Central Mexico
Matthew Bennett and the team scanning footprints at Ileret Kenya
Capturing the information held in a footprint has long involved casting it in a medium like latex or plaster a destructive process that does not readily provide quantitative data that we can analyse objectively Our team has pioneered the use of an optical laser scanner to capture footprints in the field Mounted on a custom-made rig which controls light and dust levels the laser scanner provides digital elevation models of individual prints that are accurate to less than a millimetre The scans record each print preserving them for the scientific community even if these fragile sites with their prints erode in future More importantly the scans provide the basis for statistical analysis of print anatomy
One of our goals is to develop objective methods for interpreting footprints First we needed to be able to tell for sure whether or not a mark in the ground is really a human footprint Working at controversial sites in Mexico and closer to home in South Wales we have developed a simple numerical test using scans of footprints of various ages and species formed in different materials
Objectivity is critical especially as prints within a single trail may vary from one another we need a way of effectively determining what the mean print looks like eliminating the bias associated with the interpretation of individual prints Professor Cromptonrsquos team did some
Professor Bernie Wood carefully fits a tiny sliver of sample material into a giant piece of machinery hulking to one side of his lab tucked towards the
rear of Oxford Universityrsquos Earth Sciences faculty building
Itrsquos a delicate business One mistake and hersquoll know about it only when he removes his sample several hours later and finds something broke under the strain
Wood and his team want to understand problems like how the Earth and the other planets of the solar system formed and how our planetrsquos core then separated from its silicate mantle when the planet was still young
They go about finding out by feeding mineral samples into huge machines to compress them Biggest of all is the multi-anvil press it applies hundreds of thousands of times the pressure at the Earthrsquos surface for several hours while creating scorching heat with an electrical current
Itrsquos a unique custom-built piece of kit As well as replicating the conditions deep inside the Earth it can supply enough pressure to turn graphite into diamond There are only a few working in the UK ndash apart from the one at Oxford there are others in earth sciences departments at Bristol UCL Edinburgh and Cambridge
The team makes a lot of its own equipment Experimental petrologists have to be good in the workshop their equipment needs bespoke components that you canrsquot buy on the high street and the whole team can wield a mean lathe when the situation calls for it lsquoWe build
Hot off the pressSigns of the forces that shaped the Earthrsquos surface are all around us to the trained eye each rocky outcrop tells a story about how the landscape developed over millions of years But when it comes to understanding whatrsquos going on in the hot depths hundreds of kilometres below or how the planet first condensed out of celestial dust things get trickier Tom Marshall reports
26 Planet Earth Autumn 2010
Planet Earth Autumn 2010 27
HOT OFF THE PRESS
most of the parts for our machines ourselvesrsquo says postdoctoral researcher James Tuff lsquoThis is very much hands-on make-your-own-rocks geologyrsquo
At the heart of the press is a cubic arrangement of tungsten carbide cubes ndash the lsquoanvilsrsquo Each is missing a corner Powdered samples are encased in an octahedral medium designed to transmit pressure and fitted with a tiny graphite or semi-conducting heating element together with a thermocouple that records what happens as the heat and pressure mount the octahedron fits snugly into the gap left at the centre of the cube of cubes by their missing corners
Once activated the hydraulic press bears down with a load of up to 1000 tonnes and the anvils transmit this load into the sample along each of its faces Itrsquos compressed from all sides at once while an electric current heats up the furnace element to thousands of degrees A thick outer metal ring would protect those nearby if anything gave way under the titanic pressure
Once pressurised each sample may be left for several hours then allowed to decompress to relieve the pent-up stress within the anvils Sometimes everything works sometimes the heating element burns out or one of the anvils breaks or something else goes wrong and everything must be repeated But this kind of work known as experimental petrology has laid the foundations on which much of our modern understanding of geology is built
Professor Woodrsquos grouprsquos current research is to recreate the conditions under which Earth accreted ndash formed out of clouds of dust in space ndash as well as those still found deep beneath our feet with a combination of precision engineering and brute force
Seismologists can tell a lot about the Earthrsquos interior from how sound moves through it and we get clues to its chemical make-up from samples brought to the surface by drilling or tectonic movements But experimental petrology is the only way to test theoretical models of the deep Earth and understand how minerals behave in extreme conditions
lsquoThe deepest borehole we have (Russiarsquos Kola superdeep borehole) only goes down about 12kmrsquo explains postdoctoral researcher Jon Wade lsquoBut the mantle begins far beneath that and the core-mantle boundary doesnrsquot start until 2900km down So our knowledge of the deep Earth is mostly inferred from seismic data or from rare rocks brought to the surface by tectonic and volcanic activity Using experimental techniques we can often test many of these inferencesrsquo
The team use their press to simulate conditions down to around 660km deep ndash around where the upper and lower mantles meet At this depth the pressure is around 20 gigapascals ndash some two hundred thousand times the pressure at the surface ndash and the temperature around 2000degC
Other presses exist that can simulate even deeper conditions but at these depths the discipline comes up against the physical limits of the materials lsquoThe problem is that to work with reasonable samples at this kind of depth you need an absolutely enormous pressrsquo Wood explains lsquoBeyond certain depths you just canrsquot build a machine that can compress the sample
enoughrsquo Alternative approaches like using diamond anvils can take more pressure but have their own drawbacks
Little planetsOne of the greatest challenges for experimental petrologists is understanding how the Earth formed and how the elements were divided between its core mantle and crust
We know the overall chemical make-up of the Earth itrsquos similar to the mix of elements found in meteorites known as carbonaceous chondrites These are made of the same primitive stuff that formed all the solar systemrsquos planets
But the breakdown of the Earthrsquos mantle doesnrsquot match that of the meteorites ndash for instance in comparison to chondrites Earthrsquos silicate mantle has less iron and nickel
Thatrsquos because the elements in the material of the primitive Earth were divided up unequally when it separated into its present parts Rock-loving or lsquolithophilersquo elements were concentrated disproportionately in the silica-rich mantle while metal-loving lsquosiderophilersquo elements mostly ended up in the iron core
More than 99 per cent of the Earthrsquos total gold supply is locked up in its core for example This is why gold is so rare and valuable Otherwise there would be enough in the upper Earth to cover the planetrsquos surface to a depth of nearly half a metre
This process is called lsquopartitioningrsquo and scientists are striving to understand the chemical and thermodynamic processes involved They rely on the decay of radioactive elements into other lsquodaughterrsquo elements with differing preferences for either the rocky mantle or metallic core to shed light on the timescales over which the planet formed But to test how element partitioning varies within a growing planet experimentally takes huge temperatures and pressures Hence the presses
Experimental data has let Wood and his team build models that simulate partitioning far more accurately than was previously possible By running experiments and carefully controlling pressure and temperature they can begin to understand the conditions under which the Earthrsquos core must have formed
lsquoYou donrsquot get the current concentration of say nickel and cobalt unless you assume
equilibration of metal and silicate at very high temperatures and pressuresrsquo Wade says lsquoSo we know that the core and mantle must have reached equilibrium at the base of an ocean of
magma around 700 kilometres deeprsquoThe results donrsquot just apply to Earthrsquos history
they shed light on how all planets formed condensing out of clouds of gas and gradually separating into core mantle and crust Samples go into the press as homogeneous powder under the forces and temperatures they face there they swiftly divide into their component parts forming metallic core and silicate mantle lsquoWe want to find the effects of temperature pressure and chemistry on the components of planetary formationrsquo says Wood
lsquoEach sample we work with is like a simulated planet a few millimetres acrossrsquo explains Tuff lsquoYoursquove got a metallic core surrounded by silicates and wersquore subjecting them to conditions that they may well have experienced when the Earth was being formedrsquoBrandon Alm
sistockphotocom
False-colour image of the results of a run on the multi-anvil press at pressures equivalent to 800km beneath the Earthrsquos surface taken using a scanning electron microscope The circular shape in the middle is perovskite a silicate mineral thought to be dominant in the lower mantle the yellow spots are iron
Each sample we work with is like a simulated planet a few millimetres across
Relations between the worlds of science and politics are rarely straightforward Former NERC policy intern David Ferguson (above) tells us just how tricky and how important the relationship can be
When politics and science come face to faceP
olicy-makers want definite answers scientists prefer probabilities the evidence says one thing the political ideology another Such scenarios are all
too common The recent volcanic ash crisis is a good example of scientific advice being subject to intense outside pressures and also how such advice can have profound economic and social implications
Science-based high-tech industries are increasingly important to the UK economy How far is the government responsible for developing such sectors How can they know which fields will be economic winners Where is the dividing line between the responsibilities of the public and private sectors in creating the technology and jobs of tomorrow
The House of Commons Select Committee on Science and Technology (SampT) is one of the main forums where questions like these are publicly debated The committee comprises a cross-party group of UK MPs with a broad remit to investigate scientific issues across government and it often acts as referee to public disputes on scientific issues The committeersquos regular public meetings routinely bring together research scientists policy-makers and regulators who give their views and account for their actions on an array of science-related topics As a NERC PhD policy intern at Westminster I recently got the chance to experience the committeersquos work at first hand
You might reasonably ask why anyone would swap their research into volcanism in northern Ethiopia for a suit and the corridors of Whitehall But Irsquove always been interested in what happens to science beyond the laboratory door When the NERC parliamentary internship came up I grabbed the chance to see for myself Fortunately the Ethiopian volcanoes at least stayed quiet while my attention was diverted
Both houses of Parliament have to scrutinise the governmentrsquos activities and one of the key tools in this work is the select committee a subject-specific group of Members with statutory powers to investigate and question government ministers and public figures on their policies actions and intentions
The SampT Committee tackles a particularly large array of subjects from the fiscal management of UK research councils and the licensing of stem-cell research to the culture of lsquoevidence-based policyrsquo within Whitehall ndash any topic with a scientific dimension is open to its investigation Without firm ties to any one government department the committee is free to navigate almost the entire policy landscape
While I was in Westminster I took part in a number of inquiries including several ad hoc investigations launched in response to emerging events Some of these were particularly relevant to NERC science such as the impact of potential spending cuts on UK research budgets the global regulation of geoengineering (an inquiry held jointly with a US Congress committee) and the disclosure of emails from the Climatic Research Unit at the University of East Anglia (the so-called lsquoClimategatersquo affair)
The focal point of a committeersquos weekly diary is the evidence session During these public meetings witnesses come to Westminster to answer questions and make statements Over the course of my three-month internship more than 35 witnesses appeared in front of the SampT Committee representing a cross-section of those who fund regulate use and carry out science
The sessions varied from information-gathering to direct interrogations of someonersquos actions or views and the tone differed accordingly It was fairly common to have some
28 Planet Earth Autumn 2010
Planet Earth Autumn 2010 29
WHEN POLITICS AND SCIENCE COME FACE TO FACE
quite animated exchanges ndash though these were mostly reserved for sparring with politicians well versed in the artful avoidance of difficult issues I quickly learned that a hostile question can be very effective against a seasoned government minister but is liable to send most (though not all) academics into a rambling panic
The evidence from these sessions forms the basis of the committeersquos reports official documents published by the House of Commons and presented to the government which has an obligation to respond As my internship coincided with the last months of the parliamentary session there was a push to achieve as much as possible before the election For the committee and its staff this meant a non-stop schedule of drafting reports public evidence sessions press briefings and often-lengthy private meetings to debate the details of inquiries and their final reports
One of my main tasks was to help draft a report on the committeersquos impact since its inception in 1966 The Legacy Report was the last report published by the committee before the 2010 general election Facing an uncertain future the committee was understandably keen to highlight the benefits of its work I had to trawl the parliamentary archives for committee documents and talk to former members to get their perspective which gave me a great overview of the contribution the committee has made
During all this I still found time to lsquotweetrsquo updates on my Westminster life (on the lsquomicro-bloggingrsquo website Twitter) Though I did have to exercise a certain degree of discretion to avoid breaking press embargoes or breaching
the trust of being included in private parliamentary discussions
Beyond their primary responsibilities NERC interns are also encouraged to experience as much of Westminster life as possible and have access to most of the Westminster estate Between committee meetings and report writing I managed to
fit in a visit to a theatrical Prime Ministerrsquos Questions several science-policy related debates and seminars held around Westminster a tour up the clock tower (with earplugs included) to hear Big Ben strike midday and plenty of Westminsterrsquos favourite pastimes ndash spotting famous MPs and ministers in the canteen and coffee shop and guessing the party affiliation of groups of young researchers in the House of Commons bar
How will science scrutiny fare in the new Parliament When the House of Commons is disbanded prior to a general election so too are all of its attendant committees and they like their respective members have no guarantee of surviving the electoral process As my internship came to an end the committee members and their staff had no idea if the final report of that parliamentary session would also be the committeersquos very last
As it turned out the committee was re-established and is now chaired by Labour MP Andrew Miller As it retains only one of its former members though itrsquos likely to have a very different character from its predecessor
Therersquos a huge and under-exploited opportunity for research scientists to get out of the lab
My experience has certainly broadened my perspective on the role of science in wider society and the value of original research in developing good policy Equally enlightening was seeing how scientific research can become highly politicised ndash as with climate science currently Such debates need engaging and charismatic scientists who can clearly communicate the scientific viewpoint
I also saw that therersquos a huge and under-exploited opportunity for research scientists to get out of the lab Anyone can submit written evidence to a parliamentary committee inquiry and those with relevant expertise may be invited to give evidence directly to Parliament If scientists donrsquot speak up on issues relevant to them someone else can and probably will
FURTHER INFORMATIONDavid Ferguson is a volcanology student at the Department of Earth Sciences University of Oxford Email davidfergusonearthoxacuk
Thanks to Chris Tyler Xameerah Malik and Glen McKee at the House of Commons and to NERC for funding the internship
Life in the oceans evokes a plethora of images ndash from whales and shoals of tropical fish to spectacular coral reefs and even monsters of the deep But although these might be the most amazing and colourful of marine spectacles it is the abundant microscopic life
beneath the waves that ultimately drives all the biogeochemical cycles of the oceans and hence of our planet
The sunlit portion of the ocean the so-called photic zone is where carbon is lsquofixedrsquo ndash turned into an organic form that living things can use ndash by photosynthesis so it is critical to the global carbon cycle At the core of the marine food chain tiny phytoplankton fated to move around the globe at the whim of ocean winds and currents are the major fixers of carbon dioxide (CO2) levels of which have increased markedly over the last 100 years because of human emissions To get an idea of how important these organisms are on a global scale remember that 40 per cent of the CO2 fixed on Earth occurs in marine systems and 75 per cent of this is fixed in the open ocean
We should remember that this is just the current thinking though Up until the late 1970s the open oceans were thought of as biological deserts and we knew little of the abundance and diversity of microbes that are now known to exist there Within the last 30 years we have identified and characterised the two main genera of cyanobacteria Prochlorococcus and Synechococcus often misleadingly called lsquoblue-green algaersquo because they photosynthesise like plants Because of this we have begun to radically rethink how marine food webs function
Depending on the exact structure of this picophytoplankton community (that is phytoplankton a few micrometres (μm) in size) and its diversity the oceanrsquos whole food web may shift from one state to another For example dominance of the very small Prochlorococcus (06μm) may indicate that mineral elements are being recycled very efficiently and that very little organic carbon is sinking down from sunlit waters while dominance of the larger Synechococcus (1μm) may show that more organic carbon is sinking because mineral nutrients are being recycled less efficiently
Scientists used to think the open ocean was a watery desert Now wersquore starting to understand the diversity of life there and the profound influence it has on our climate Types of plankton that were once dismissed turn out to play a vital role in the carbon cycle Dave Scanlan and Mike Zubkov explain
Mysteries of the
30 Planet Earth Autumn 2010
blue ocean
Microscope image of a 3μm alga of the class Prymnesiophyceae Green areas are caused by genetic markers tailored to this group the cellrsquos nucleus fluoresces red
Planet Earth Autumn 2010 31
MYSTERIES OF THE BLUE OCEAN
Peeking into the microbial black boxUntil now these cyanobacteria have been thought to dominate carbon fixation in the open ocean However the photic zone also has a high biomass of small eukaryotic phytoplankton ndash that is photosynthesising plankton with a complex cellular structure ndash which are capable of CO2 fixation The eukaryotic phytoplankton community has long been a lsquoblack boxrsquo ndash we have known little of its composition or of its contribution to CO2 fixation It is only by determining how much CO2 these different groups fix into biomass that we can get a full understanding of the Earthrsquos carbon cycle
Ascertaining this contribution has been a thorny problem for biological oceanographers for decades However using flow cytometry ndash a technique borrowed from medical research that can physically separate (and hence lsquosortrsquo) cells
based on their size and fluorescence properties ndash we have now been able to measure how much CO2 is being fixed by different phytoplankton groups
Analysing samples collected from surface waters during a research cruise aboard RRS Discovery in the subtropical and tropical north-east Atlantic Ocean we discovered that eukaryotic phytoplankton actually fix significant amounts of CO2 contributing up to 44 per cent of the total despite being a thousand times less abundant than cyanobacteria This is probably because eukaryotic phytoplankton cells although still small are considerably bigger than cyanobacteria
Two groups of eukaryotes were distinguished by flow cytometry lsquoEukArsquo cells being more abundant but smaller than lsquoEukBrsquo cells Molecular techniques revealed that EukB were mostly photosynthetic organisms called prymnesiophytes most of which have never been cultured in the laboratory Many of these are probably previously unknown species These prymnesiophytes accounted for as much as 38 per cent of CO2 fixation in the (sub)tropical north-east Atlantic Ocean off the coast of
west Africa This suggests they play a key role in global CO2 fixation though this needs to be confirmed by widespread sampling from other parts of the worldrsquos oceans ndash our Atlantic Meridional Transect research is under way
One of the best-known prymnesiophytes is Emiliania huxleyi a species that can form extensive blooms in some regions and is characterised by its chalk-like shell of calcium carbonate the so-called coccolith The prymnesiophytes we observed in our study however are likely not calcified as shown both by examination under the microscope and by flow cytometry This reinforces the idea that these prymnesiophytes include previously undiscovered groups
It is likely that some of the organic carbon of these prymnesiophytes and other eukaryotic phytoplankton eventually sinks down from
the photic zone to the deep ocean rather than being returned to the atmosphere as CO2 Given their clear importance in this marine lsquobiological carbon pumprsquo it is crucial that we discover the factors that control the growth of small eukaryotes in the oceans
Certainly being able to make more accurate predictions of the effects of global warming on our planet will probably depend on what we learn about carbon cycling by these organisms Mathematical models for predicting CO2 drawdown by the oceans are currently quite simple yet the biology may be much more complicated
For instance it is wrong to assume that the salty waters of the sea are uniform throughout Light penetrates only the top 200 metres of the ocean and during the summer months the water column becomes stratified separating the nutrient-rich deeper waters from the wind-mixed surface layer
Microbial activity quickly depletes the nutrients in the surface waters and specific niches become defined surface waters that are high in light but low in nutrients and deep waters that have little light but are rich in nutrients We now know that such environments favour specific genotypes or lsquoecotypesrsquo that are adapted for life in these different niches and have different cell-specific CO2 fixation rates We need to take this into account when evaluating the oceanrsquos CO2 sequestration and productivity
The future offers much Picophytoplankton
Picophytoplankton may not be the most visible of the searsquos inhabitants but they are vital fuelling much of the global marine production of biomass
Mysteries of the
may not be the most visible of the searsquos inhabitants but they are certainly vital fuelling much of the global marine production of biomass Indeed it was not so long ago that oceanographers missed these tiny cells simply because they were too small to be caught in the large pore-size meshes traditionally used to collect phytoplankton samples But without them the oceans really would be watery deserts and our world would be a very different place Just how important they really are may become even more apparent in the coming years
MORE INFORMATION Dave Scanlan is Professor of Marine Microbiology at Warwick University Professor Mike Zubkov is a member of the marine biogeochemistry and ecosystems group at the National Oceanography Centre Email djscanlanwarwickacuk or mvznocsotonacuk
FURTHER READINGJardillier L Zubkov MV Pearman J Scanlan DJ (2010) Significant CO2 fixation by small prymnesiophytes in the subtropical and tropical northeast Atlantic Ocean The ISME Journal International Society for Microbial Ecology doi101038ismej201036
A water sampler being launched from the RRS Discovery
32 Planet Earth Autumn 2010
Launched in early December 2009 OpenGeoscience is unique It gives visitors access to their choice of a wide range of geological data searchable maps high quality photographs Key Stage 1-3 resources in-house software applications and an open archive of
BGS reports and published papers Whatrsquos more for most users itrsquos freeThe sitersquos flagship is access to street-level-resolution geological mapping
for the whole of the UK ndash the first service of its kind in the world Visitors can access the maps through a purpose-built lsquoUK geology viewerrsquo which allows them to zoom into their area of interest and view the geology against a topographical (landscape) map or satellite image backdrop Click on the map and detailed geological information will appear before your eyes More technical users can export the dataset to a KML file (a file type used to display geographic data in a geo-browser) and look at it on GoogleEarth or view it as a web map service
The image library ndash GeoScenic ndash has more than 50000 modern and historical images from BGSrsquos archives which you can search by theme collection or even the name of your town or village Itrsquos proving extremely popular with teachers as a way of illustrating their lessons
Then therersquos the lsquopopular geologyrsquo resources which include BGSrsquos highly successful schools seismology project and a rsquodownload and cut-outrsquo model of the ash-producing Icelandic volcano Eyjafjallajoumlkull
While itrsquos simple for the user therersquos some sophisticated software working hard behind the scenes Because the maps can be delivered via KML files and web map services itrsquos possible to lsquomashrsquo them with data from entirely different sources Mash-up applications have real scientific value A good example is the recent map of the land-cover history and surface geology of East Anglia since the Domesday Book which was based on BGS superficial and offshore geology selected land-cover data administrative and geographic boundaries from Ordnance Survey OpenData and global coastline data from the US National Oceanic and Atmospheric Administration (see wwwgiscloudcommap3186medieval-fenlandsland-cover-history)
Website rocksGeology for the people
Need information about the Earth beneath your feet Seeking nourishment for budding young scientific minds Looking
for photos of the landscape around you Now therersquos one place to find them all the British Geological Surveyrsquos lsquoOpenGeosciencersquo website Richard Hughes sells it to us
The response to OpenGeoscience has been astonishing The launch got widespread media coverage ndash even knocking the Copenhagen climate summit off the BBC Science and Environment websitersquos top spot at one point On launch day our map server was delivering over 1000 files per second and the BGS website received three times its regular traffic during that month But why
There are lots of reasons some of them fairly obscure to the average visitor The geospatial information industry likes it because web mapping demonstrates the usefulness of web standards applications The European Commission approves because it complies with the INSPIRE environmental information directive now part of UK law The research and education sectors like it because of the free resources it puts at their disposal Dr Steve Drury Senior Lecturer in Remote Sensing at the Open University foresees the website will become lsquoa kind of ldquoGoogleRockrdquo for a great many peoplersquo
The public likes OpenGeoscience because it brings information about UK geology into their homes in a way thatrsquos just not been possible before
And BGS likes OpenGeoscience too The website has raised the visibility of BGS and NERC science and thatrsquos always a good thing But its success also demonstrates that therersquos a nation of users out there hungry for online information about their lsquoplacersquo Try it for yourself and find out whatrsquos beneath your feet
FURTHER INFORMATIONRichard Hughes is Director of Information and Knowledge Exchange at BGS Email rahbgsacuk
Access OpenGeoscience at wwwbgsacukopengeoscience and tell us what you think Email usingbgsdatabgsacuk
Planet Earth Autumn 2010 33
Screen shots from the GeoScenic website at
wwwbgsacukopengeoscience
wwwgiscloudcommap3186medieval-fenlandsland-cover-history
WEBSITE ROCKS
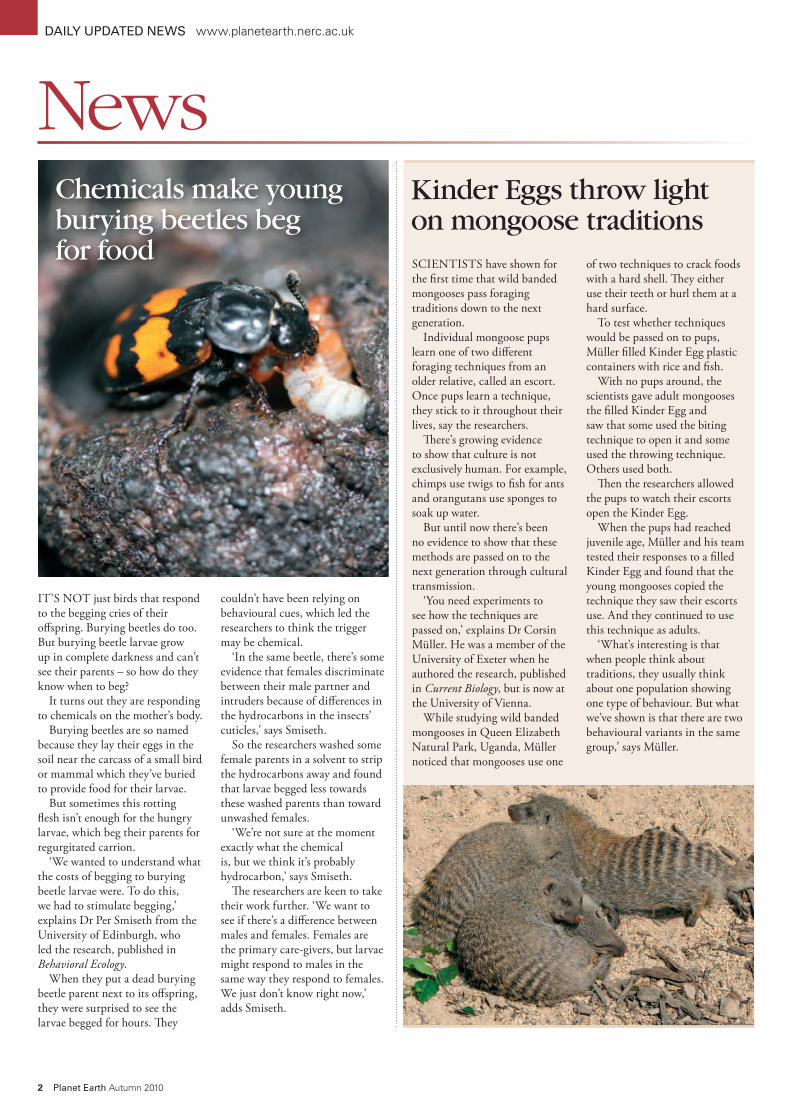
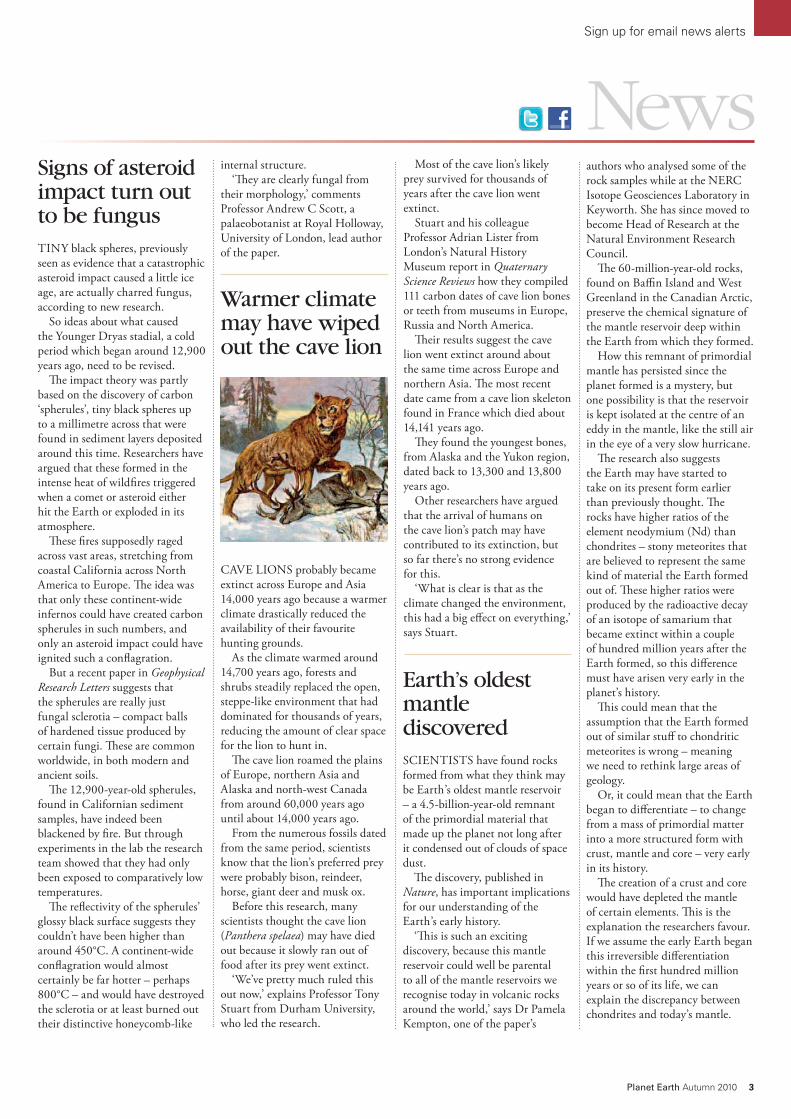
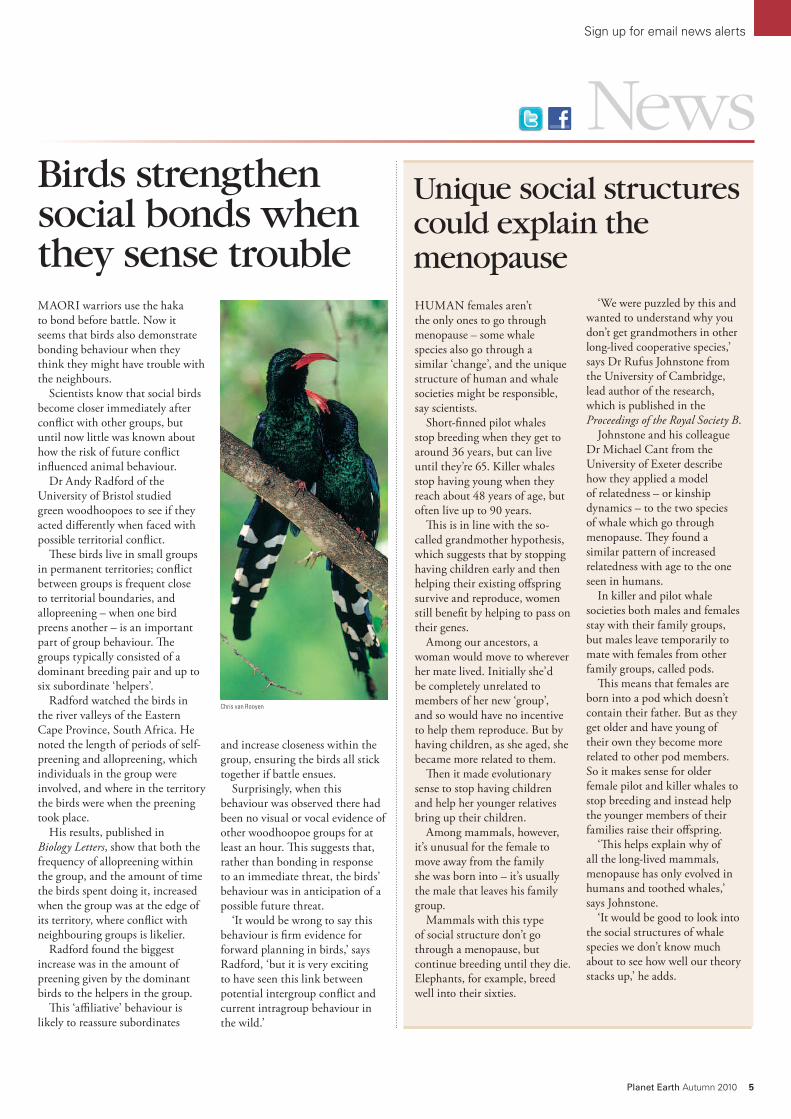
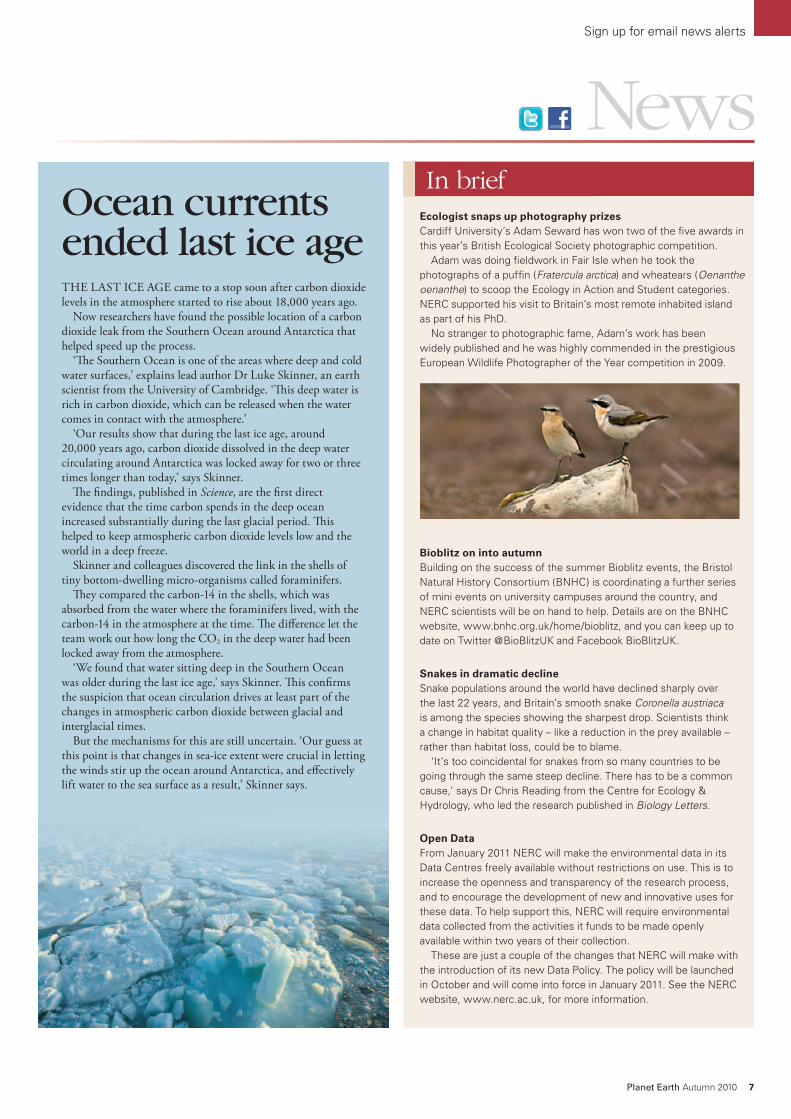
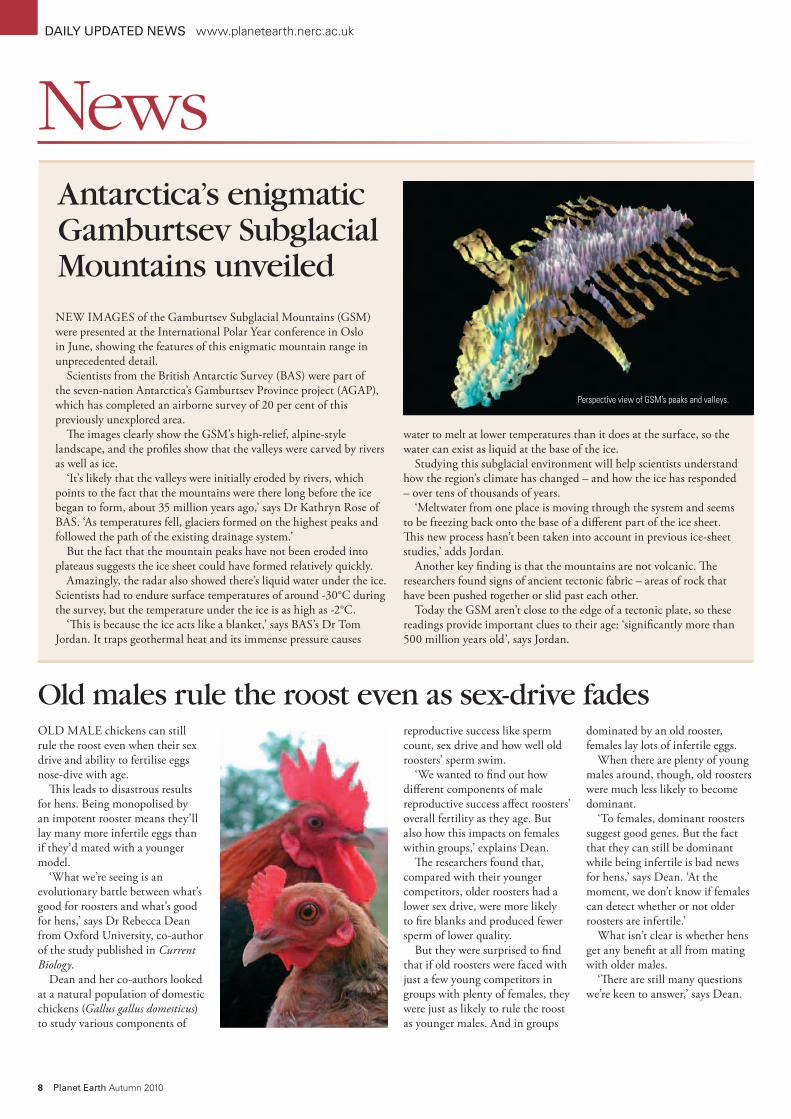
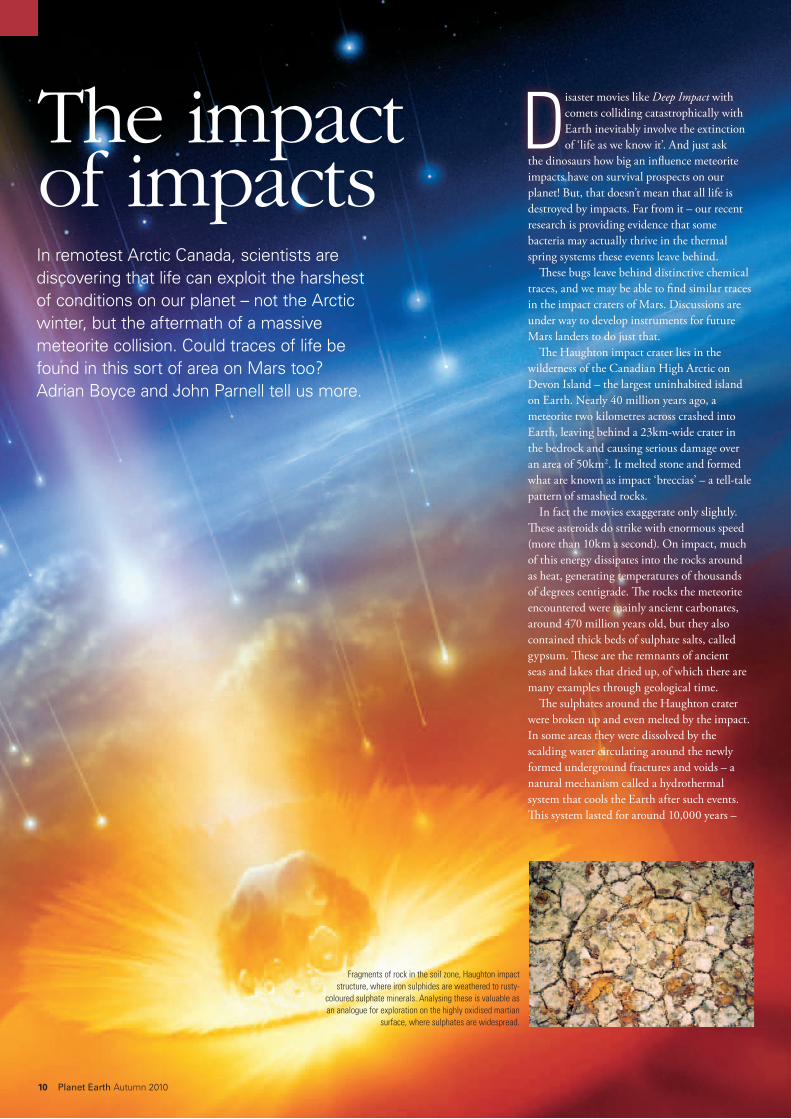
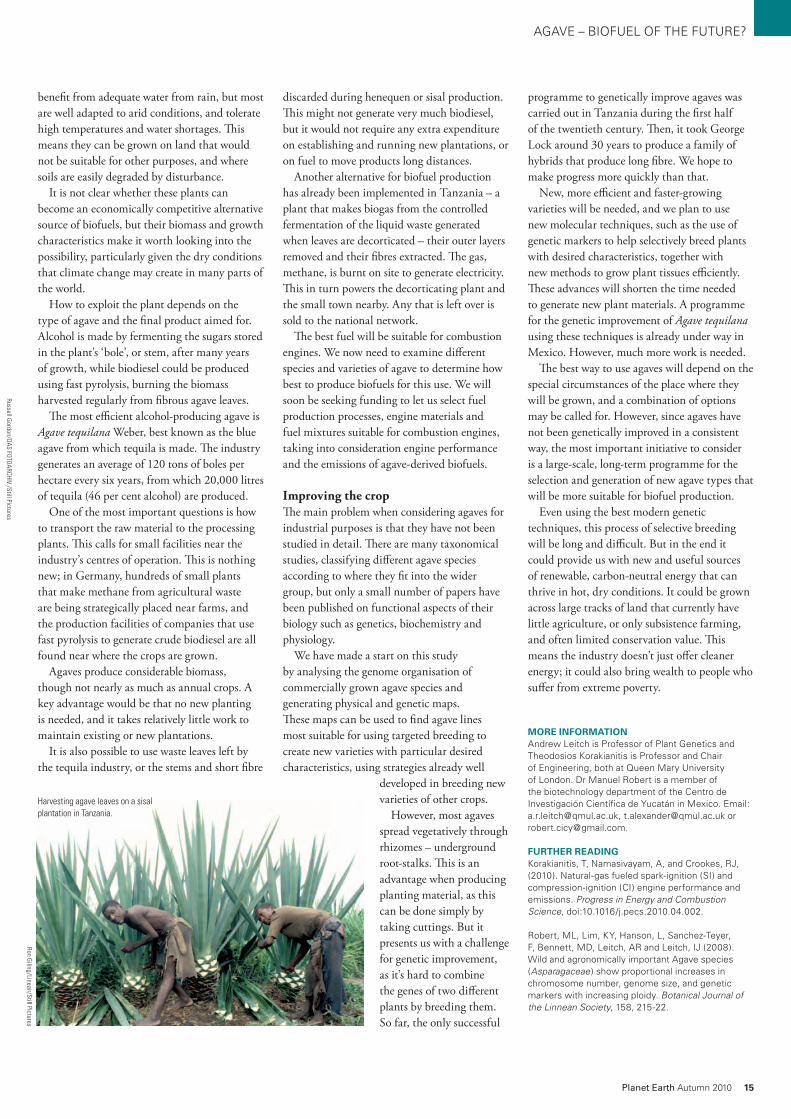
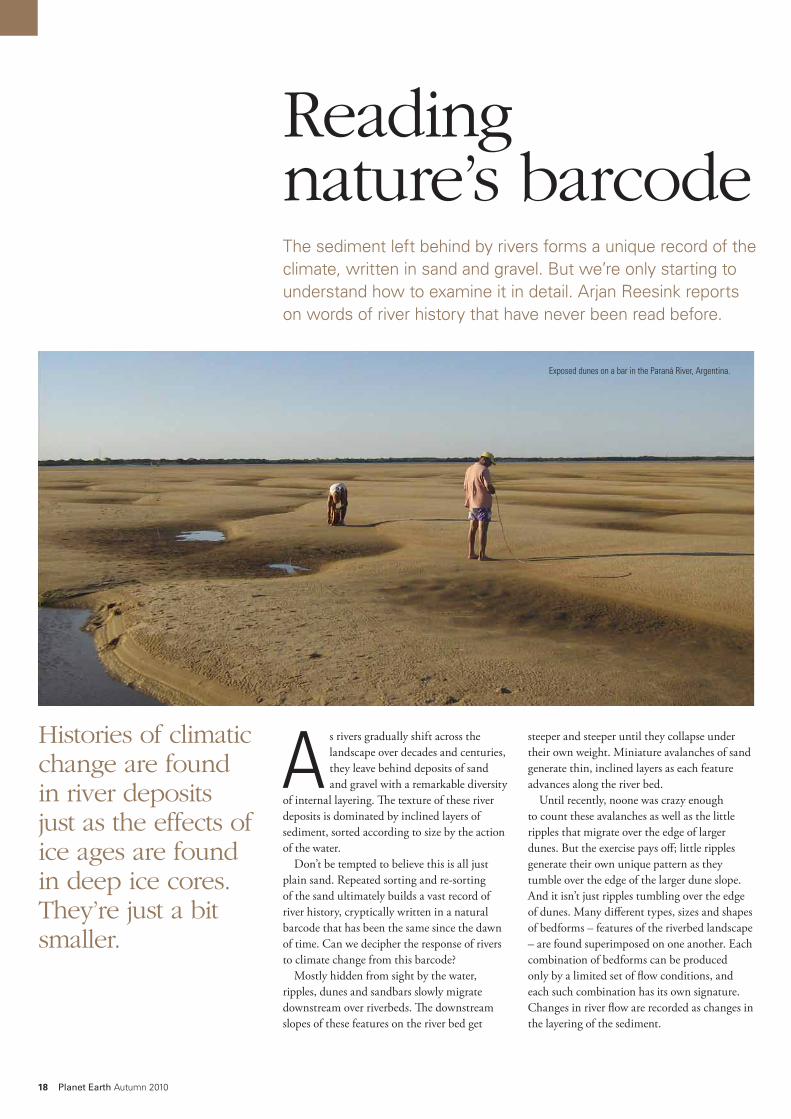
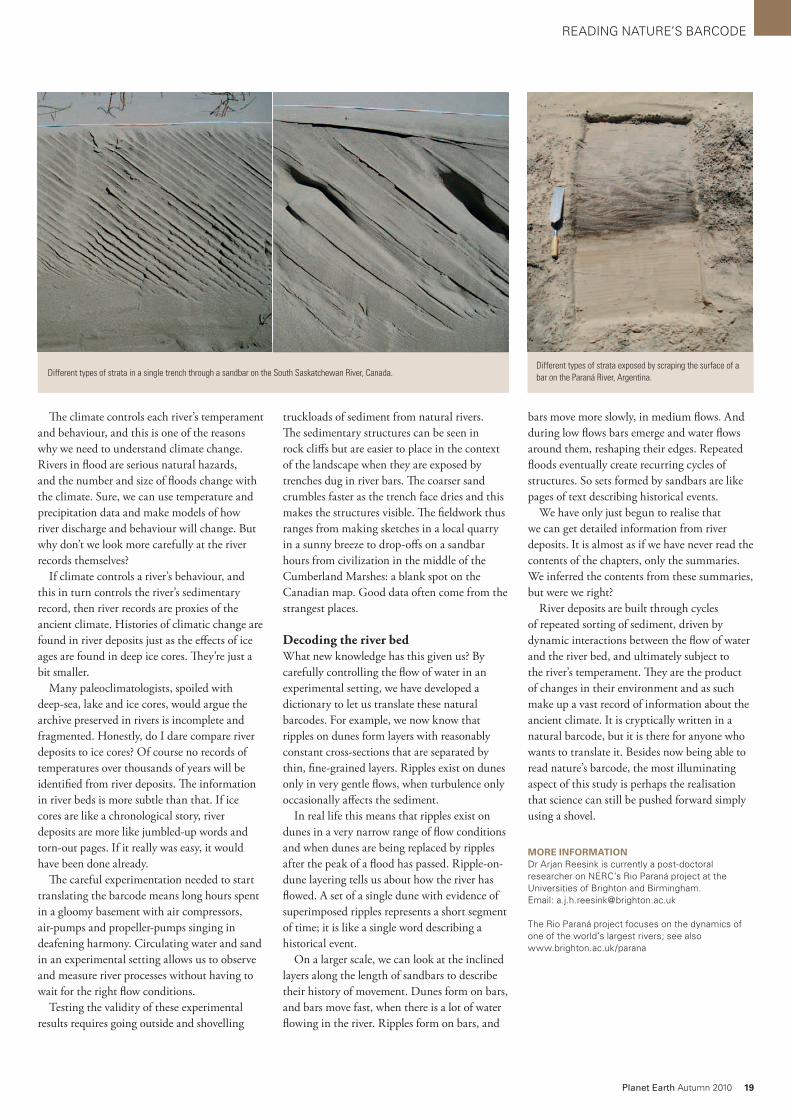
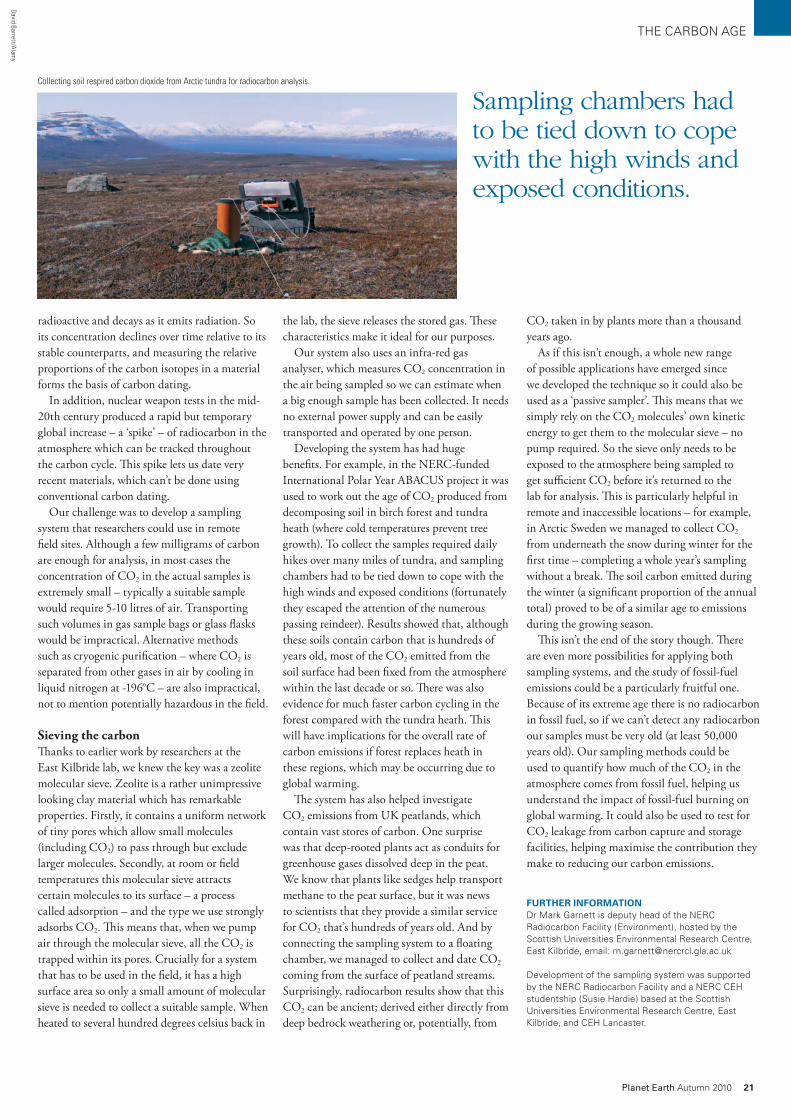
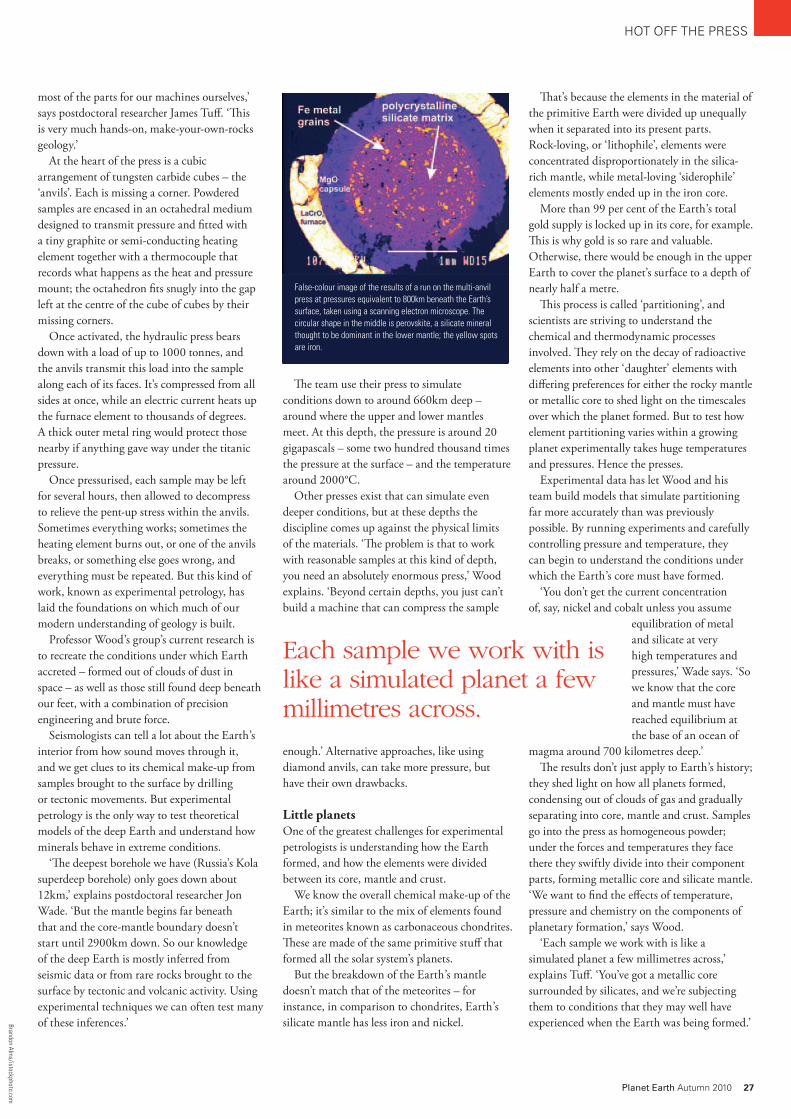
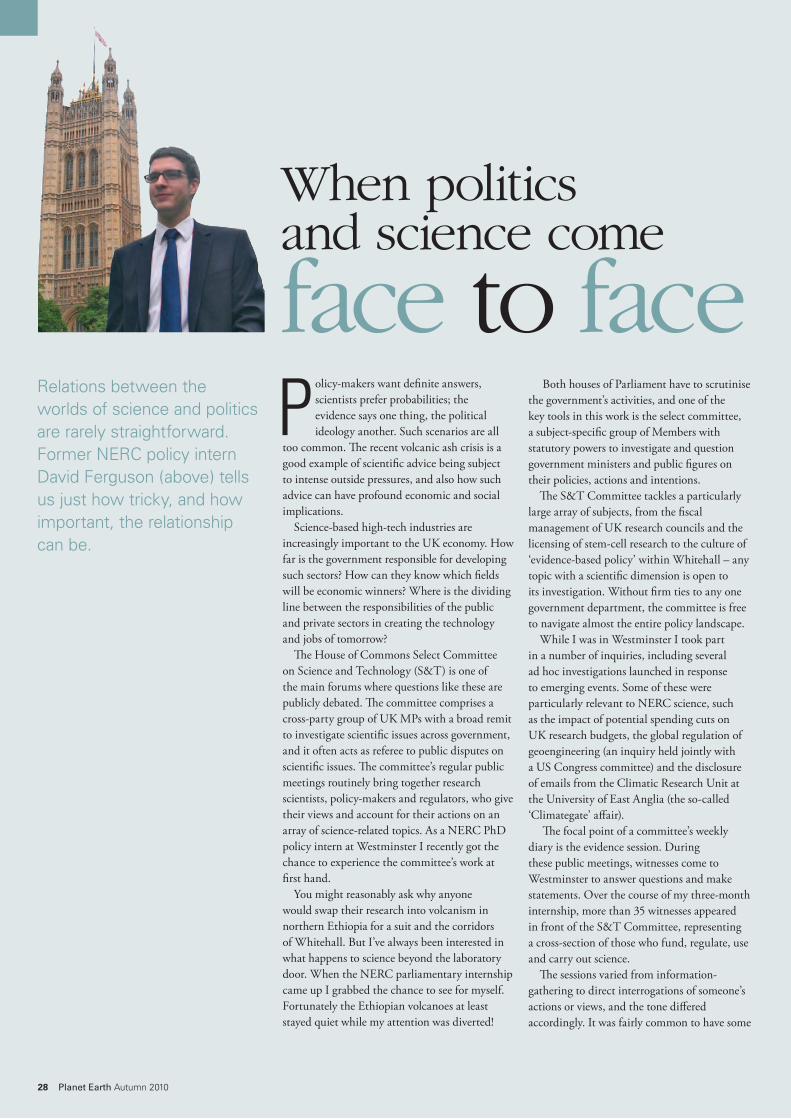
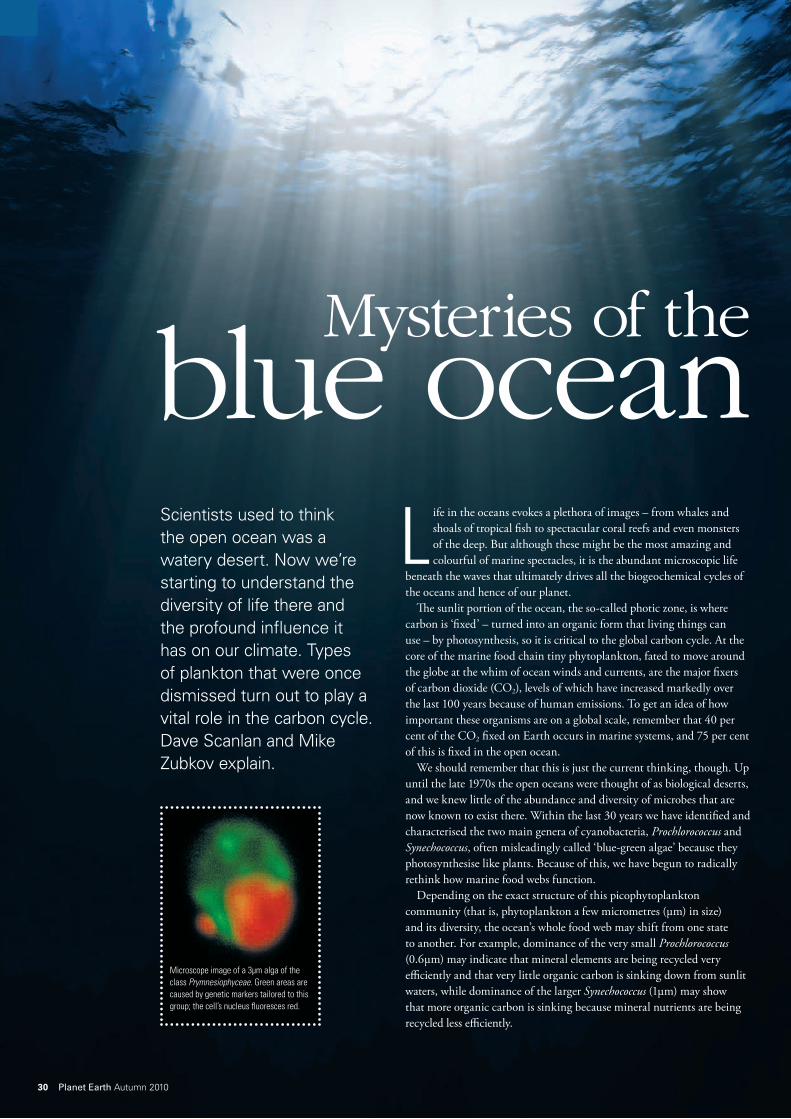
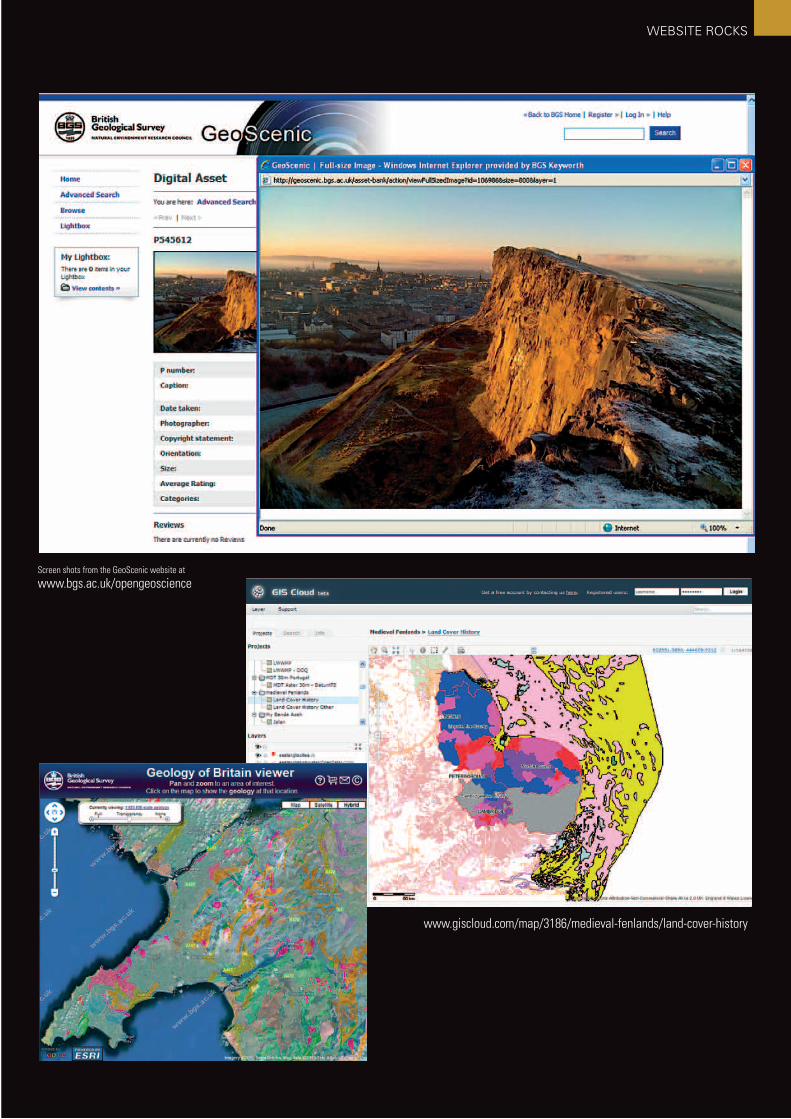
Planet Earth Autumn 2010 33
Screen shots from the GeoScenic website at
wwwbgsacukopengeoscience
wwwgiscloudcommap3186medieval-fenlandsland-cover-history
WEBSITE ROCKS