Plan Section 2.0 State West Virginia
16
Plan Section 2.0 State West Virginia Section 2.0 - 1 2.1 Individuals Most in Need Adult Basic Education ( ABE) in West Virginia has been on the forefront o f many initiatives throughout the co untry and cont inues to serve a leadership role for new mandates in the fields of learning disabilities, technolog y, distanc e learning, market ing, curriculum develo pment and workplace education. In the past, ABE programs were offered to assist adults in mastering the skills necessary to successfully complete the General Educational Development exam (GED). This was the ultimate goal, and the success of the program was determined by the number of graduates. Today, adults need more than just a high school diploma to compete in the workforce and become productive citizens in society. Today’s workplace presents numerous opportunities and challenges for adults in West Virginia. Employers need workers with both strong basic skills and the ability to adapt to change. Today’s families are faced with multiple responsibilities as they addre ss their children’s ed ucational needs a s well as their own. Special po pulatio ns, such as the homeless, elderly, and incarcer ated, must deal with additional challenges in or der t o lead safe and productive lives. To effectively serve the basic educational needs of these diverse groups, a learning system that is flexible and responsive is necessary. A statewide needs assessment was conducted to ensure that the delivery system responds to the needs of those individuals who need adult education and literacy services the most. Needs Assessment
Transcript of Plan Section 2.0 State West Virginia
Plan Section 2.0State West Virginia
Section 2.0 - 1
2.1 Individuals Most in Need
Adult Basic Education (ABE) in West Virginia has been on the forefront of many
initiatives throughout the country and continues to serve a leadership role for new mandates in the
fields of learning disabilities, technology, distance learning, marketing, curriculum development
and workplace education. In the past, ABE programs were offered to assist adults in mastering
the skills necessary to successfully complete the General Educational Development exam (GED).
This was the ultimate goal, and the success of the program was determined by the number of
graduates. Today, adults need more than just a high school diploma to compete in the workforce
and become productive citizens in society. Today’s workplace presents numerous opportunities
and challenges for adults in West Virginia. Employers need workers with both strong basic skills
and the ability to adapt to change. Today’s families are faced with multiple responsibilities as they
address their children’s educational needs as well as their own. Special populations, such as the
homeless, elderly, and incarcerated, must deal with additional challenges in order to lead safe and
productive lives. To effectively serve the basic educational needs of these diverse groups, a
learning system that is flexible and responsive is necessary. A statewide needs assessment was
conducted to ensure that the delivery system responds to the needs of those individuals who need
adult education and literacy services the most.
Needs Assessment
Plan Section 2.0State West Virginia
Section 2.0 - 2
Stat istics were compiled from the National Adult Literacy Survey; the West Virginia
Report Card (prepared by the Department of Education); Ready for What? (report compiled by
the WV Business and Educat ion Alliance); Kids Count (prepared by Kids Count Foundation);
Literacy Counts (prepared by the Governor’s Council on Literacy); West Virginia Women in
Perspective (compiled by the WV Women’s Commission); the Domestic Violence Coalition; WV
Department of Health and Human Resources; Department of Labor; US Census Bureau Current
Report Survey, 1997; and information obtained from various other state agencies.
The process for determining adults most in need and those hardest to serve included the
compilation of county statistics in the following categories:
C percentage of undereducated adults;
• families below poverty level;
• high school dropouts; and
C number of people without a high school diploma who meet these criteria:
1. receive public assistance;
2. are unemployed;
3. are single parents; and
4. have a disability that limits their choice of jobs.
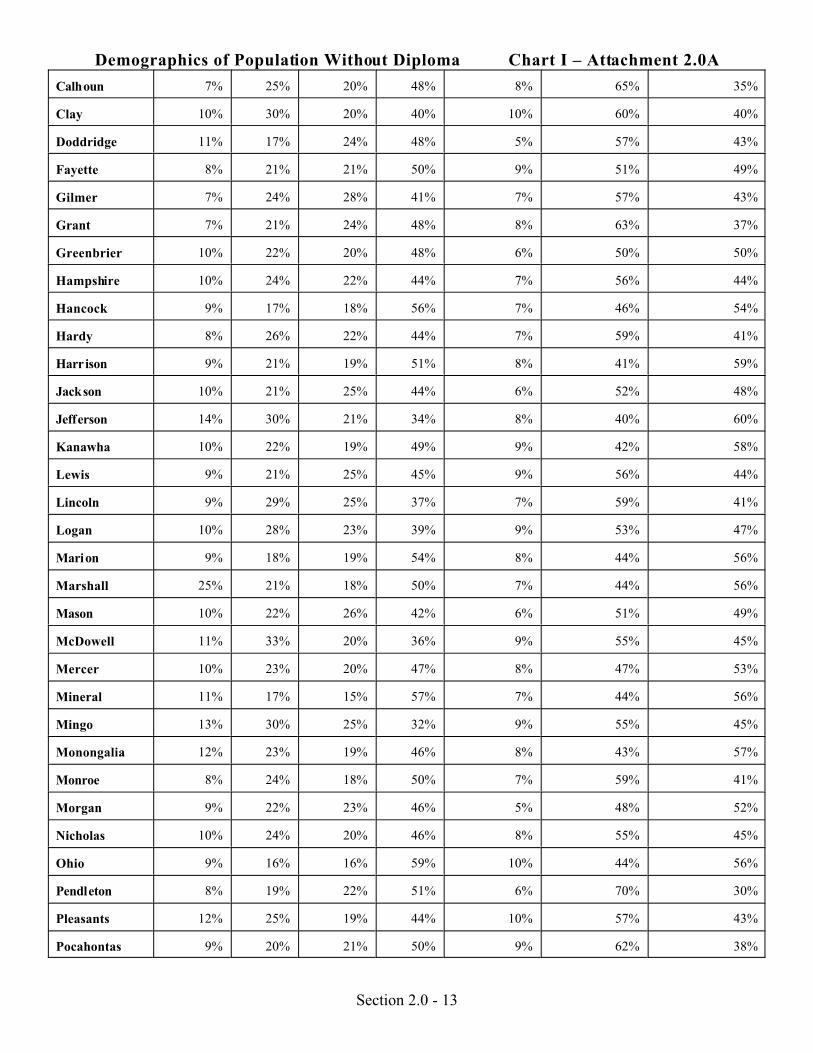
Chart I (Attachment 2.0 A) reveals these statistics per category. In addition, the needs
Plan Section 2.0State West Virginia
Section 2.0 - 3
assessment included analyses of criminal offenders in correctional institutions, specific age groups
with limited education, individuals with limited English proficiency, homeless adults,
undereducated workforce, and race and gender characteristics of adults without a diploma. The
availability of public transportation and daycare was also analyzed in the assessment to assist in
determining needed support services. Detailed information on these areas is given below.
The last step in assessing the educational needs of West Virginia adults included
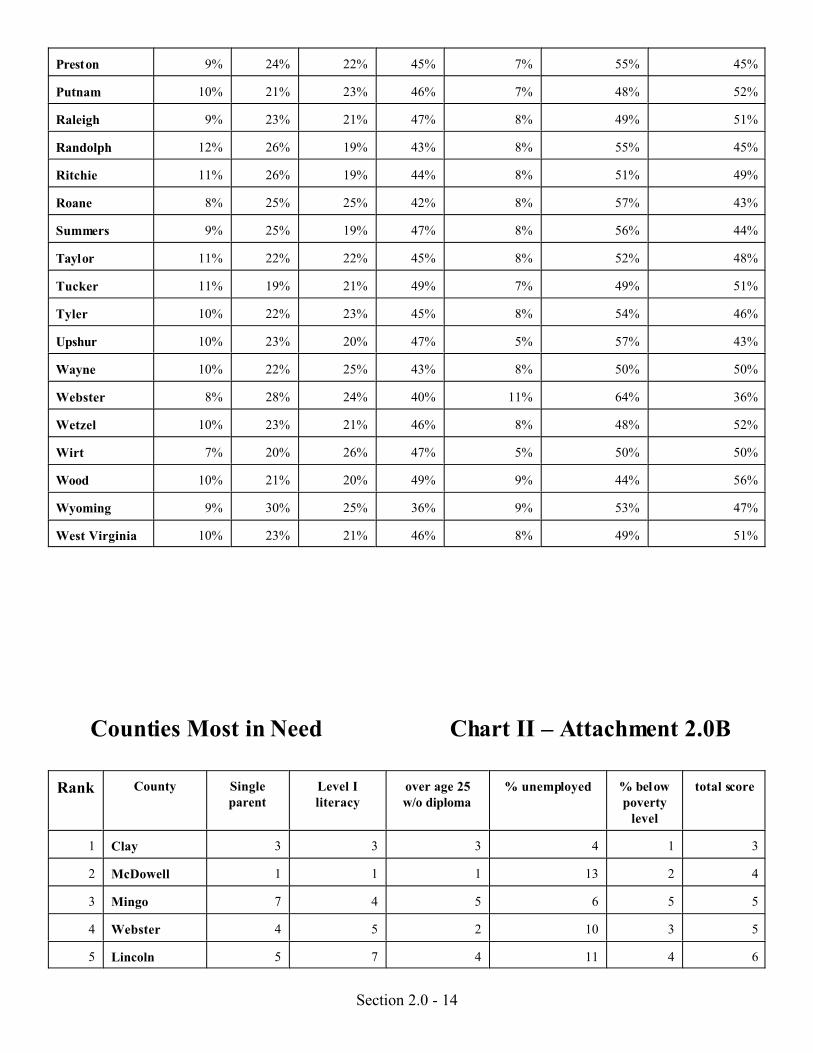
identifying those counties most in need of services based upon the needs assessment. Chart II
(Attachment 2.0 B) indicates the counties in order of need based upon the major areas revealed in
the needs assessment. These areas are unemployment rate, percentage of adults without a high
school diploma, percentage of those functioning at literacy level 1, percentage of single parent
households without a diploma, and the percentage of families below poverty level.
2.2 Populations
2.2.1 Low income adult learners who are educationally disadvantaged
According to data collected from the National Adult Literacy Survey, 20 percent of the
adult population in West Virginia performed at Level 1 (the lowest literacy level) and Census
Bureau statistics indicate that 33 percent of the adult population lack a high school diploma. The
State’s unemployment rate in 1998 was 5.9 percent. Statistics reveal that 17.5 percent of families
in the State live at or below poverty level, and 31 percent of these individuals have completed less
Plan Section 2.0State West Virginia
Section 2.0 - 4
than 12 years of formal education.
According to information released from the Department of Health and Human Resources
on November 5, 1998, there were 185,231 open assistance groups (families) receiving medical
cards, food stamps, Temporary Assistance to Needy Families, transportation and emergency
assistance within the State of West Virginia.
2.2.2 Individuals with disabilities
More than 130,000 adults have been identified as having a health condition lasting six
months or longer which limits the amount of work they can do or their job choice. Of this
number, 70,367 do not possess a high school credential and 23.8 percent of the 70,367 live at or
below poverty level. In 1990, the five States with the highest rates of work limitation were West
Virginia, Kentucky, Arkansas, Mississippi, and Louisiana. The states/districts that rank the
highest on the rate of both mobility and self-care difficulty were Mississippi, Alabama, West
Virginia, District of Columbia, and Arkansas.
Of the adult population within West Virginia, 1.8 percent have been diagnosed with a
developmental disability. By Federal definition, this means any individual who incurred a
functional disability prior to the age of 21. This includes all adults who have been diagnosed as
mentally retarded and those who have little or no functional life skills who need long-term or
lifetime support services.

Plan Section 2.0State West Virginia
Section 2.0 - 5
Nationally, the President’s Committee on Employment for People with Disabilities has
estimated that 1 - 14 percent of adults in the workplace have learning disabilities. Department of
Labor research suggests that between 50 - 80 percent of students in basic skills programs (those
reading below the 7th grade level) probably have learning disabilities and that there is a high
correlation between learning disabilities and functional illiteracy, especially among economically
disadvantaged. Given these factors, the report estimates that 15 - 23 percent of all JTPA IIA
participants may have learning disabilities and that 25 - 40 percent of all adults on public
assistance may have learning disabilities.
2.2.3 Single parents and displaced homemakers
An analysis of single parent households revealed that 22 percent of the households in West
Virginia have only one parent present. Of this group, 44 percent of the single fathers and 39
percent of the single mothers did not complete high school.
Information obtained in July, 1998 indicates that, of the total workforce (822,400), there
are approximately 55,000 (6.6 percent) displaced workers within West Virginia, including
those who are classified as long-term. When separat ing the long term individuals (approximately
10 percent), 48,000 (5.8 percent of total workforce) displaced workers remain who can be
retrained for the workforce.
According to the WV Department of Labor, statistics compiled in 1997 reveal that there

Plan Section 2.0State West Virginia
Section 2.0 - 6
are 44,787 displaced homemakers within West Virginia. These are women who previously had no
need or desire to enter the workforce but who now find work outside the home a necessity due to
divorce, death of a partner, the changing economy, or self-satisfact ion.
2.2.4 Individuals with limited English proficiency
A total of 17,497 adults within West Virginia were identified as having limited proficiency
in English. Of this number, 8,750 have a high school credential while 8,747 do not. Other data
obtained reported that 1,974 had limited or no ability to speak English, while 15,523 were able to
speak English very well. Although these numbers are relatively small, there has recently been an
influx of new international businesses into West Virginia including Toyota Motor Manufacturing
and NGK Spark Plug Manufacturing that have a high proportion of limited English proficient
employees. Further growth of this target population is anticipated during the next five years.
2.2.5 Criminal offenders in correctional institutions
In the West Virginia correctional system, there are currently 4,560 inmates (information
compiled November, 1998) over the age of 18 who are serving time within regional jails and State
penitentiaries. Data collected during the past two years indicates that 2,298 (50.4 percent) of
these inmates do not possess a high school credent ial.
2.2.6 Homeless adults
While it is difficult to obtain “hard” data on the number of homeless people within the

Plan Section 2.0State West Virginia
Section 2.0 - 7
State, information obtained indicates that 484 individuals are living in emergency shelters or are
visible in street locations. Information obtained from the Domestic Violence Coalition cited a
total of 21,067 adults being served or housed within domestic violence shelters throughout the
State.
2.2.7 Individuals without high school diplomas within specific age groups
An analysis of various age populations revealed that those over the age of 60 were most in
need of educational services (45 percent statewide) because they lacked more formal education
than other groups. Over 12,000 elderly adults reside in nursing homes, an important site to be
targeted for life skill instruction.
The second highest age group in need was the 45-59 year old group (34 percent
statewide). This statistic is impacted by the fact that many West Virginians who were once active
and successful in the labor market are finding themselves out of work due to closure of coal mines
and other traditional businesses along with the replacement of manpower by technology in many
occupations. Displaced homemakers also make up a significant portion of this age group.
Another growing population requiring ABE services is the 16-to-18 year old resident. In
1988, the West Virginia Legislature enacted Senate Bill 14 that stated, “. . . the Department of
Motor Vehicles shall deny a license or instruction permit for the operation of a motor vehicle to
any person under the age of 18 who does not at the time of application present a diploma or other

Plan Section 2.0State West Virginia
Section 2.0 - 8
certificate of graduation. . . or documentation that the person is enrolled and making satisfactory
progress in a course leading to a ...GED from a State approved institution....” The influx of this
age group within certain ABE programs, coupled with court-ordered youth, has occurred since
the passage of this Bill.
2.2.8 Undereducated workforce
In 1995, the West Virginia Education Fund conducted a study of what West Virginia
employers, higher education, and students believe high school graduates should know and be able
to do. Ready for What? reveals that “. . . business and higher education require many similar
skills and recommend that writing skills should be developed to clarify communication and
thought; math skills should focus on application, measurement, and relationships; and students
currently lack the skills of resume writing and self-promotion, in part because they do not
understand the needs of the workplace. Personal attributes and values figure prominently in what
customers now require and expect of new employees and post-secondary students.”
The growth of ABE’s Workplace Education Program in recent years documents the need
to provide on-site, contextualized programs to assist existing workers upgrade and retool their
basic skills. Service-related companies are replacing the State’s traditional coal mining and labor-
intensive industries. Technology and down-sizing are requiring an increase in multi-crafted
employees. To participate competitively in the global marketplace, West Virginia companies need

Plan Section 2.0State West Virginia
Section 2.0 - 9
workers with strong skills in math, communicat ions, technical reading, adaptability, problem-
solving, organizational management and teamwork.
2.2.9 Race and gender characteristics of individuals without a high school diploma
Further analysis of the adult population with less than 12 years of formal schooling reveals
that 52 percent of these are females and 48 percent are males while 97 percent are white, 2.6
percent are black, and 0.4 percent are of other ethnic origin.
2.2.10 Transportation and daycare needs
Inspection of transportation and daycare needs revealed that only 28 of the 55 West
Virginia counties have public transportation available and that only a total of 294 licensed daycare
facilities are currently operating within the State.
2.3 Analyses of the findings
Analyses of the needs assessment findings indicate the following key factors:
• Multiple and flexible learning opportunities must be available for unemployed adults that
provide contextualized, work-based instruction that allow the learners to see the immediate
transfer of basic skills to the workplace. Full implementation of West Virginia’s ABE
WorkSCANS curriculum and accompanying certificates of mastery are vital to this factor.
• Coordination of support services, particularly transportation and child care, is necessary to
assist adult learners in maintaining regular attendance.
Plan Section 2.0State West Virginia
Section 2.0 - 10
• Increased options for distance learning need to be made available to permit adults otherwise
unable to attend traditional classes an opportunity to participate.
• The Workplace Education Program needs to continue services to existing businesses to assist
employers in having trained and adaptable employees who are equipped with skills needed for
global competition.
• Staff Development programs must continue to provide training on serving adults with special
learning needs and with physical limitations in order to enable programs to recognize and
make appropriate, reasonable accommodations when necessary.
C Specialized programs for the State’s aging population need to be developed that cater to
their unique needs, i.e. health and safety issues.
C Specialized programs, that integrate social, parenting, and academic skills, for the State’s
single parent population need to be expanded.
C Programs must address the unique needs of out-of-school youth through coordination
with Title I of the Workforce Investment Act.
C Correctional education programs must continue to address the basic skills needs of the
incarcerated to reduce recidivism.
C Intense marketing efforts must be continued to increase awareness and availability of
services. Marketing must be viewed as an investment and not a cost.
Plan Section 2.0State West Virginia
Section 2.0 - 11
C Family literacy programs need to be expanded to provide greater opportunities for parents
to become active partners with their children in the educational process.
C The State must be ready to respond to the likely demand for English literacy classes for
limited English proficient adults by providing trained instructors and appropriate
resources.
C Collaborative programming must continue with State agencies, literacy programs, and
community-based organizations to provide the most efficient and convenient resources for
the customers.
To address these multiple needs, adult educators within West Virginia have created a
process for developing a more concise, unified, and effective educational system for adult
learners. Through coordinated efforts with the Governor’s Council on Literacy, the Human
Resource Investment Council, the Governor’s Cabinet on Children and Families, Even Start, Head
Start, public libraries, WV Development Office, Department of Health and Human Resources,
Bureau of Employment Programs, and multiple State partners, ABE is committed to “Serving
Adults...Showing Results.” The remaining sections of this State Plan will illustrate the process,
programs, and activities through which ABE will endeavor to achieve this goal.
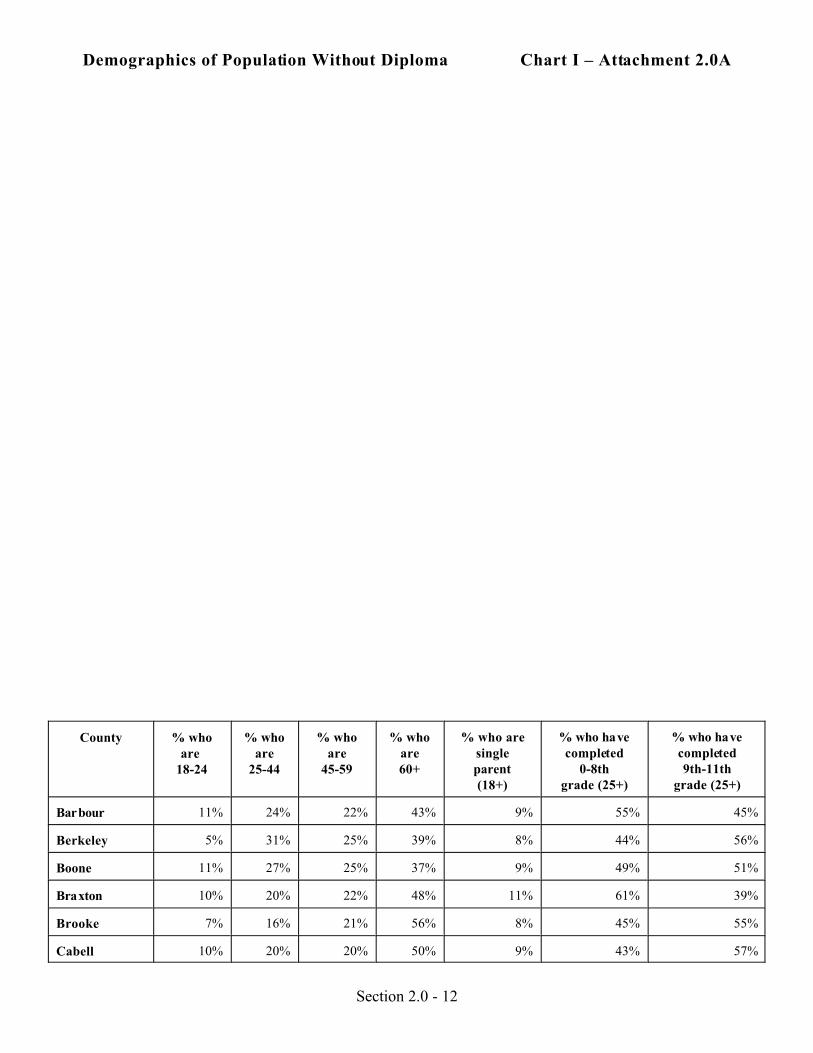
Demographics of Population Without Diploma Chart I – Attachment 2.0A
Section 2.0 - 12
County % whoare
18-24
% whoare
25-44
% whoare
45-59
% whoare60+
% who aresingleparent(18+)
% who havecompleted
0-8thgrade (25+)
% who havecompleted9th-11th
grade (25+)
Barbour 11% 24% 22% 43% 9% 55% 45%
Berkeley 5% 31% 25% 39% 8% 44% 56%
Boone 11% 27% 25% 37% 9% 49% 51%
Braxton 10% 20% 22% 48% 11% 61% 39%
Brooke 7% 16% 21% 56% 8% 45% 55%
Cabell 10% 20% 20% 50% 9% 43% 57%
Demographics of Population Without Diploma Chart I – Attachment 2.0A
Section 2.0 - 13
Calhoun 7% 25% 20% 48% 8% 65% 35%
Clay 10% 30% 20% 40% 10% 60% 40%
Doddridge 11% 17% 24% 48% 5% 57% 43%
Fayette 8% 21% 21% 50% 9% 51% 49%
Gilmer 7% 24% 28% 41% 7% 57% 43%
Grant 7% 21% 24% 48% 8% 63% 37%
Greenbrier 10% 22% 20% 48% 6% 50% 50%
Hampshire 10% 24% 22% 44% 7% 56% 44%
Hancock 9% 17% 18% 56% 7% 46% 54%
Hardy 8% 26% 22% 44% 7% 59% 41%
Harrison 9% 21% 19% 51% 8% 41% 59%
Jackson 10% 21% 25% 44% 6% 52% 48%
Jefferson 14% 30% 21% 34% 8% 40% 60%
Kanawha 10% 22% 19% 49% 9% 42% 58%
Lewis 9% 21% 25% 45% 9% 56% 44%
Lincoln 9% 29% 25% 37% 7% 59% 41%
Logan 10% 28% 23% 39% 9% 53% 47%
Marion 9% 18% 19% 54% 8% 44% 56%
Marshall 25% 21% 18% 50% 7% 44% 56%
Mason 10% 22% 26% 42% 6% 51% 49%
McDowell 11% 33% 20% 36% 9% 55% 45%
Mercer 10% 23% 20% 47% 8% 47% 53%
Mineral 11% 17% 15% 57% 7% 44% 56%
Mingo 13% 30% 25% 32% 9% 55% 45%
Monongalia 12% 23% 19% 46% 8% 43% 57%
Monroe 8% 24% 18% 50% 7% 59% 41%
Morgan 9% 22% 23% 46% 5% 48% 52%
Nicholas 10% 24% 20% 46% 8% 55% 45%
Ohio 9% 16% 16% 59% 10% 44% 56%
Pendleton 8% 19% 22% 51% 6% 70% 30%
Pleasants 12% 25% 19% 44% 10% 57% 43%
Pocahontas 9% 20% 21% 50% 9% 62% 38%
Section 2.0 - 14
Preston 9% 24% 22% 45% 7% 55% 45%
Putnam 10% 21% 23% 46% 7% 48% 52%
Raleigh 9% 23% 21% 47% 8% 49% 51%
Randolph 12% 26% 19% 43% 8% 55% 45%
Ritchie 11% 26% 19% 44% 8% 51% 49%
Roane 8% 25% 25% 42% 8% 57% 43%
Summers 9% 25% 19% 47% 8% 56% 44%
Taylor 11% 22% 22% 45% 8% 52% 48%
Tucker 11% 19% 21% 49% 7% 49% 51%
Tyler 10% 22% 23% 45% 8% 54% 46%
Upshur 10% 23% 20% 47% 5% 57% 43%
Wayne 10% 22% 25% 43% 8% 50% 50%
Webster 8% 28% 24% 40% 11% 64% 36%
Wetzel 10% 23% 21% 46% 8% 48% 52%
Wirt 7% 20% 26% 47% 5% 50% 50%
Wood 10% 21% 20% 49% 9% 44% 56%
Wyoming 9% 30% 25% 36% 9% 53% 47%
West Virginia 10% 23% 21% 46% 8% 49% 51%
Counties Most in Need Chart II – Attachment 2.0B
Rank County Singleparent
Level Iliteracy
over age 25w/o diploma
% unemployed % belowpoverty
level
total score
1 Clay 3 3 3 4 1 3
2 McDowell 1 1 1 13 2 4
3 Mingo 7 4 5 6 5 5
4 Webster 4 5 2 10 3 5
5 Lincoln 5 7 4 11 4 6

Section 2.0 - 15
6 Calhoun 16 13 10 1 6 9
7 Braxton 2 12 9 9 16 10
8 Logan 10 8 8 14 10 10
9 Wyoming 6 9 6 21 9 10
10 Boone 8 10 7 23 11 12
11 Roane 11 18 14 5 12 12
12 Barbour 19 14 16 7 8 13
13 Summers 18 2 15 18 19 14
14 Fayette 17 6 12 24 14 15
15 Gilmer 20 15 13 22 7 15
16 Pocahontas 14 24 20 2 23 17
17 Lewis 21 23 24 16 18 20
18 Nicholas 22 17 19 27 13 20
19 Ritchie 31 25 21 8 15 20
20 Mason 33 20 22 15 17 21
21 Grant 9 32 17 26 42 25
22 Raleigh 29 11 27 34 27 26
23 Wirt 35 na 37 3 30 26
24 Monroe 27 21 25 40 25 28
25 Randolph 30 28 35 20 28 28
26 Tucker 15 30 33 17 43 28
27 Doddridge 41 22 31 33 20 29
28 Pleasants 13 39 41 25 33 30
29 Wayne 32 26 30 38 22 30
30 Preston 23 40 26 35 32 31
31 Taylor 39 29 36 29 21 31
32 Greenbrier 47 19 28 28 40 32
33 Hardy 12 35 11 52 48 32
34 Mercer 37 16 29 47 29 32
35 Upshur 50 42 34 12 24 32
36 Wetzel 34 46 46 19 26 34
37 Hampshire 25 33 23 55 39 35
38 Pendleton 28 38 18 51 38 35

Section 2.0 - 16
39 Tyler 24 41 42 32 37 35
40 Jackson 36 43 38 36 31 37
41 Harrison 42 36 43 31 36 38
42 Morgan 45 45 32 45 54 38
43 Marion 48 37 44 30 34 39
44 Cabell 46 31 48 46 35 41
45 Marshall 49 44 45 37 41 43
46 Kanawha 50 27 50 48 44 44
47 Berkeley 40 49 40 44 52 45
48 Brooke 38 47 47 42 53 45
49 Jefferson 26 51 39 54 55 45
50 Hancock 54 34 49 43 50 46
51 Wood 44 52 53 39 47 47
52 Putnam 43 54 52 49 51 50
53 Mineral 52 50 51 41 49 49
54 Monongalia 51 53 54 53 46 51
55 Ohio 53 48 55 50 45 50