PLAN IMPLEMENTATION AND PUBLIC SECTOR...
94
89 CHAPTER 3 PLAN IMPLEMENTATION AND PUBLIC SECTOR OUTLAYS 3.1 EVALUATION OF PLAN PROGRAMMES The Programme Evaluation Organisation, Planning Commission undertakes evaluation of central and centrally sponsored schemes to assess their physical and financial performance, the efficacy of the implementation/delivery mechanisms and impact on the beneficiaries. The findings of the evaluation studies are made available to the implementing ministries and the concerned subject divisions of Planning Commission for mid-course corrections in design and implementation, to the researchers and general public through publications, seminars and the print media for generating informed debate on the nature and efficiency of public spending. 2. The Approach Paper to the Tenth Five Year Plan has made use of the results of evaluation studies and suggested various steps for improving the performance of programme formulation and implementation which, inter-alia, included convergence & weeding out of plan schemes, detailed monitoring and impact studies of state sector projects, removal of mismatch between the large number of schemes & monitoring capacity and project approach with time bound targets for monitoring, mid-term evaluation and detailed impact studies of CSS. 3. The strategy proposed above would definitely contribute to efficiency in resource use and improved performances of plan programmes. To make evaluation, an effective tool for this, capabilities of evaluation organisations will have to be enhanced. This, however, requires greater flow of physical and financial resources to the Evaluation Organisations established in various States/UTs and at Central level. 4. Accordingly, an attempt is being made to improve the infrastructure of PEO and to associate NGOs/Research Institutes so as to enable it to respond to the increasing demand for evaluation and to discharge other related responsibilities. In recent times, apart from conducting evaluation studies, PEO have undertaken other activities which, inter alia, include: organising training programmes for its staff members in reputed institutions (IIPA, NIRD), increased interaction with the state level evaluation organizations, Internet/NICNET connectivity to PEO field units to increase the speed of transmission and processing of data. Working Group For The Tenth Five Year Plan 5. In pursuance of the decisions taken in the internal meeting held on 21.8.2000 under the chairmanship of the Secretary, Planning Commission, a Working Group on
Transcript of PLAN IMPLEMENTATION AND PUBLIC SECTOR...

89
CHAPTER 3
PLAN IMPLEMENTATION ANDPUBLIC SECTOR OUTLAYS
3.1 EVALUATION OF PLAN PROGRAMMES
The Programme Evaluation Organisation, Planning Commission undertakes evaluationof central and centrally sponsored schemes to assess their physical and financialperformance, the efficacy of the implementation/delivery mechanisms and impact on thebeneficiaries. The findings of the evaluation studies are made available to the implementingministries and the concerned subject divisions of Planning Commission for mid-coursecorrections in design and implementation, to the researchers and general public throughpublications, seminars and the print media for generating informed debate on the natureand efficiency of public spending.
2. The Approach Paper to the Tenth Five Year Plan has made use of the results ofevaluation studies and suggested various steps for improving the performance ofprogramme formulation and implementation which, inter-alia, included convergence &weeding out of plan schemes, detailed monitoring and impact studies of state sectorprojects, removal of mismatch between the large number of schemes & monitoring capacityand project approach with time bound targets for monitoring, mid-term evaluation anddetailed impact studies of CSS.
3. The strategy proposed above would definitely contribute to efficiency in resource useand improved performances of plan programmes. To make evaluation, an effective tool forthis, capabilities of evaluation organisations will have to be enhanced. This, however,requires greater flow of physical and financial resources to the Evaluation Organisationsestablished in various States/UTs and at Central level.
4. Accordingly, an attempt is being made to improve the infrastructure of PEO and toassociate NGOs/Research Institutes so as to enable it to respond to the increasing demandfor evaluation and to discharge other related responsibilities. In recent times, apart fromconducting evaluation studies, PEO have undertaken other activities which, inter alia,include: organising training programmes for its staff members in reputed institutions (IIPA,NIRD), increased interaction with the state level evaluation organizations, Internet/NICNETconnectivity to PEO field units to increase the speed of transmission and processing ofdata.
Working Group For The Tenth Five Year Plan
5. In pursuance of the decisions taken in the internal meeting held on 21.8.2000 underthe chairmanship of the Secretary, Planning Commission, a Working Group on

90
Strengthening Monitoring and Evaluation System for Social Sector Development Schemesduring the Tenth Five Year Plan was constituted on 30.10.2000 under the chairmanship ofSecretary, Planning Commission. The Working Group has submitted its report to PlanningCommission on 29.11.2001. The main recommendations of the Working Group are asunder:
i. The design and implementation of new policies and programmes should rely onevaluation results of completed and ongoing schemes to avoid repetition of pastmistakes and to ensure better utilization of development resources.
ii. Indicators for M & E must form an integral part of programme/project design.
iii. An evaluation data bank containing lessons from evaluation studies conductedby Central and State Evaluation Organisations as well as internationalorganizations of repute needs to be created. This data bank can be accessedby planners and policy makers and even by the evaluators for literature survey.
iv. Better coordination is needed among evaluation organizations and CAG to avoidduplication of work and inappropriate use of resources. It would be useful if thebroad areas of evaluation work for every year are identified in a meeting ofevaluation organizations before the commencement of every annual plan.
v. Evaluation should be funded under plan funds in order to develop necessaryinfrastructure, human resources, collection and transmission of evaluationresults.
vi. An evaluation plan needs to be prepared for the Tenth Plan. This will includeevaluation of major programmes once in 2nd year and once in 4th year of thePlan.
vii. The Union Ministries/Departments and State Governments should be equippedwith monitoring units for analyzing the reports of monitoring and evaluation onperformance of the on going social sector development schemes and in casesuch units were not in existence, the services of research institutes from outsidethe Government should be hired for the said purpose.
viii. Computerised Monitoring Information System (CMIS) needs to be introducedimmediately for effective monitoring and audit of each scheme in the socialsector.
ix. In order to coordinate the work of various central and state monitoring units, aninstitution (existing/new) may be designated to act as monitor of monitors.
x. Training should be made an important organizational aspect of monitoring andevaluation. International organizations of repute may be contacted throughWorld Bank/UNDP for training evaluation officials of Centre and States and atraining institute may be set up for imparting training on M & E techniques.
xi. Expert Committee /Group under the Chairmanship of Member (Evaluation),Planning Commission to identify changes in procedures, rules, practices andlaws that may be required for generating quality evaluation results, linkingevaluation to resource allocation and using evaluation as a potent instrument ofgovernance.

91
xii. Planning Commission should take a lead role in establishing a NationalAssociation of Evaluators with membership drawn from the Central and Stateevaluation organisations, NGOs, and research institutions engaged inevaluation, appraisal and audit agencies. This association should hold annualconferences and bring out evaluation related literature/ news etc. and promoteexchange of views, wider dissemination of evaluation work done in the countryand develop links with similar national and international institutions &associations.
Findings of Recent Evaluation Studies
6. The important programmes evaluated by PEO during the last few years are:Employment Assurance Scheme (EAS), Functioning of State Pollution Control Boards(SPCB), Khadi & Village Industries Programme (KVIC), Social Safety Net Programme(SSNP) for Primary Heath Centres (PHCs), Member Parliament Local Area DevelopmentScheme (MPLADS) and National Project on Bio-gas Development (NPBD). The findings ofthese evaluation studies are given in brief in the following paras.
Employment Assurance Scheme (EAS)
7. The Employment Assurance Scheme was launched on 2nd October, 1993 in 1778identified backward blocks situated in drought prone desert, tribal and hill areas where therevamped public distribution system was in operation. Subsequently, the scheme wasextended to cover all the blocks by April, 1997. The primary objective of the EmploymentAssurance Scheme is to provide gainful employment in manual work during leanagricultural season to all able bodied adults in rural areas who are in need of work, butcannot find it. The secondary objective is the creation of economic infrastructure andcommunity assets for sustained employment and development.
8. At the instance of the Planning Commission, the Programme EvaluationOrganisation (PEO) undertook the evaluation study on Employment Assurance Scheme(EAS) to assess the performance, appropriateness of implementation methods adopted bythe states, extent of coverage of target group and the impact of EAS on the beneficiaries.The report was released in April, 2000.
9. The main findings of the study are:
l The provisions in the guidelines relating to the preparation of shelf of projects,identification/ registration of people seeking wage employment, issuance offamily cards and constitution of co-ordination committees at different levels werenot adhered to in a large majority of the cases.
l The utilisation of EAS funds is extremely low. Lack of planning, untimely releaseof funds, both from the Centre to DRDAs and from DRDAs to blocks, and otherfactors, such as inability of the States to generate matching resources are theimportant factors that have contributed to low utilisation of EAS funds.
l The coverage of villages and the target group is extremely low. A maximum of32% of villages and 5% of the target group in a block are estimated to havebeen covered annually.

92
l A large part of the EAS has been used in activities that are less labour intensiveand more capital intensive. The normative capital – labour ratio has not beengenerally adhered to. As a result the cost of employment generation becomesabnormally high in a few states.
l The majority of EAS beneficiaries received less than 30 day’s wage employmentin a year. Non-poor households were also found to have been the beneficiariesof EAS. The income from the EAS was not enough to enable the poorhouseholds to cross the poverty line. Most of the EAS beneficiaries gotemployment in one out of the four years of its operation.
State Pollution Control Boards (SPCBs)
10. State Pollution Control Boards (SPCBs), constituted under the Water(Prevention and Control of Pollution) Act 1974, are entrusted with the responsibility ofmonitoring and controlling environmental pollution. Successive enactment and framing ofrules have specified the powers and functions of the SPCBs in different areas of theirintervention. Constituted with a two-tier administrative set-up consisting of a Board ofMembers and the regular administrative and technical staff and with a network of fieldoffices, each SPCB is required to perform such functions as advising the State Governmenton matters relating to pollution, developing methods, standards and technology to abatepollution, administering pollution control and creating awareness among the public aboutthe ill-effects of pollution.
11. At the instance of the Planning Commission, the Programme Evaluation Organisation(PEO) undertook a review of all the 25 SPCBs in the country with the objectives of studyingtheir structure, organizational set-up, staffing pattern, finances and training requirements,examining their functioning with reference to the functions stipulated in the Pollution ControlActs, identifying the constraints in their functioning and suggesting remedial measurestherein.
12. The main findings of the study are:
l The composition of the State Boards is mostly characterized by dominantpresence of non-technical members, differential availability of staff for monitoringa certain number of polluting industrial units, discomforting vacancy positions,influx of contract and casual employees and varying ratios of technical to non-technical staff. Absence of any fixed norm for determining the staffing pattern ofSPCBs is an important cause for the above. The field formations of someSPCBs are not commensurate with the task at their hand.
l There are vast variations in the financial positions of different SPCBs. SomeSPCBs are heavily dependent on Government grants while some rely helplesslyon their own insufficient resources. A few SPCBs claim to be financially self-reliant. With widely varying number of polluting industries across states andgiven the different types and rates of fees charged on industries, the potentialfor generating ‘own resources’ differs across SPCBs.
l Most of the SPCBs run considerable revenue surpluses even while they havenot fulfilled the requirements for capital expenditure. Prohibitive spendingrestrictions imposed by State Governments are an important cause for this.

93
l The degree of inventorisation of polluting industrial activities accomplished bythe SPCBs is not generally satisfactory. The inventorisation of small pollutingunits is yet to take off.
l Compliance of industrial units with the stipulated pollutant standards is poor insome states. Absence of an effective punitive mechanism instigates non-compliance.
l Most of the SPCBs do not supply the required number of observations on airand water quality to the Central Pollution Control Board (CPCB). Some of thesanctioned monitoring stations are not operational. Inadequate financial normsper sample and greater reliance on contract employees for monitoring lead tothis.
l Crucial activities like training to staff, generation of awareness among the publicregarding different aspects of pollution and research and development remainlow-priority items of expenditure in the budgets of most of the SPCBs.
Khadi and Village Industries Programme
13. During the Freedom Struggle, the development of Khadi and Village Industries was aninstrument to meet the twin objective of self-reliance through local production and seekingactive participation of the poor in the struggle for Independence through removal of hungerand unemployment. Their potential as an instrument of poverty alleviation was alsorecognised by our early planners. Accordingly, the Khadi and Village IndustriesCommissioner (KVIC) was created by an Act of Parliament to plan, promote and organisetheir systematic development and expansion.
14. While the output and employment of Khadi and Village Industries have grownmanifold during the last four and half decades, their role in the context of the new paradigmof development has been questioned. In particular, the effectiveness of the programme interms of its employment generation capacity, resource-use efficiency and sustainability hascome under attack from various quarters. At the instance of Planning Commission, theProgramme Evaluation Organisation (PEO) undertook the evaluation of the performance,adequacy, effectiveness of the implementation mechanism and impact of the KVIprogramme.
15. The major findings of the study are as under:
l Inadequate linkage between production and sales strategies has resulted inaccumulation of stocks, low return on investment, non-performing asset build-up,low production and shrinking employment opportunities. Co-ordination amongimplementing agencies at various levels is lacking. The data base available withKVIC on production, employment, sales, earnings, stock and on other relevantparameters is inadequate and inaccurate. No scientific planning andimplementation of the programme can be designed with this data-base.
l The budgetary support constituted more than 80% of resources of KVIC till1994-95. It has come down to 35% with the introduction of MMS (Margin MoneyScheme). About 67% of budgetary resources of KVIC went to the Khadi sectorand one-third to village industries sector during Eighth Plan.

94
l As per KVIC’s own statistics, during Eighth plan only 8 lakh jobs were createdas against a target of 20 lakh set by the HPC (for 1994-97). About 95% of theadditional employment generated during the Eighth plan was in the villageindustries sector, while this sector used only about one-third of the budgetaryresources.
l A large proportion of the employment opportunities is part-time employment andthe annual earning per worker in the Khadi sector was found to be less than Rs.50 for many workers, the average earning per part-time worker being Rs. 433/annum.
l As per secondary statistics, the average full-time worker earned about Rs. 4835/annum in the khadi sector and Rs. 4323/annum in the village industries sectorduring 1996-97.
l Converting all part-time employment into full-time equivalent employment (FTE),we noted that KVI programme’s current employment level stood at 34.81 lakh in1996-97, i.e. 59% of what has been reported in secondary statistics.
l Average investment for job creation in the Khadi sector is Rs. 27,259/FTE job.The annual public cost of maintaining a job created is Rs. 4979/FTE job.
l In the Village Industries sector, the investment for job creation is Rs. 43,366/FTE job. The annual maintenance cost is Rs. 2158.
l The public (delivery) cost works out to 182%of wage payment in the Khadisector and 50% of the wage payment in the Village Industries sector.
l On an average, a sample khadi unit was found to have machinery andequipment worth Rs. 4,96,305, invested Rs. 61,39,744 in working capital andemployed about 246 FTE workers during 1997-98. An average khadi unitgenerates surplus of Rs. 5987 per FTE worker under the present pattern offinancing. However, this surplus is not translated into profit, as the entireproduction of the unit is not sold during the year. The average unintended stockbuild-up is around 35% of the annual production, and for small units, it is ashigh as 80%. The economics of khadi production will work out very differently ifthe inventory of finished good could be reduced to, say, 5% of annualproduction. In such a scenario, a khadi unit will generate a profit of Rs. 5131/FTE worker or more than Rs. 12.6 lakh as total profit for the unit.
l Another area of concern is the high raw material to output ratio. For some units,the ratio is as high as three-fourth. A ratio of more than 25% is neither justified,nor sustainable.
l The third area of concern brought out by the survey result is the low wagepayment to workers. Not only is this earning much less than what is reported insecondary statistics but, it also forms a relatively small proportion of the valueadded by an FTE worker. Only 58% of what the government spends on a khadiunit reaches the khadi workers.
l On an average, a village industry unit invested Rs. 6,97,940 and employed 16.2FTE workers. The village industries units are commercially viable and capable ofsustaining themselves without much government subsidy.
95
l The annual per capita income of the beneficiary households (workers) is Rs.5655 and the earnings from KVIC programme constitute 52.71%. The income ofan average village industries worker’s family is 70% more than that of a khadiworker’s family. The khadi workers’ families get 46% of their annual earningsfrom KVIC programme, while the Village Industries workers’ families earn about58%. The relatively low income of khadi workers’ families is because of thedominance of part-time employment in this sector.
l More than two-thirds of the sample households (workers) originally belonged tothe families below the Poverty Line. Of these poor households, about 71% haveactually crossed the poverty line with the help of additional income from theKVIC programme. Here too, the performance of the village industries sector(80.5%) far outweighs that of the khadi sector (62.3%).
l The key persons (presidents/secretaries ) are also direct beneficiaries of theKVIC programme. Analysis of survey data reveals that more than 50 per cent ofthe household income of the key persons comes from the KVIC programme.
l The non-working members of the governing bodies of the units/institutions alsoreceive financial benefits from the programme. On an average 15% of theirannual household income comes from the KVIC programme.
Social Safety Net Programmes (SSNP)
16. The Social Safety Net Programme (SSNP) assisted by World Bank for family welfarewas initiated in 1992-93 for a period of five years in 90 poor performing districts which werecharacterised by high maternal mortality rate and low levels of institutional deliveries. Theprogramme has envisaged to reduce the maternal mortality rate by creating essential healthinfrastructural facilities including the post of lady doctor in the identified PHCs for facilitatinginstitutional deliveries of pregnant mothers. The amount sanctioned per PHC was Rs.10.00lakh for creation of the requisite infrastructure.
17. At the instance of the Planning Commission, the Programme Evaluation Organisationundertook the study to evaluate the functioning of Primary Health Centres (PHCs) assistedunder Social Safety Net Programme (SSNP) and their effectiveness in facilitatinginstitutional deliveries. A multi stage sampling design with selection of 167 patients, 24PHCs spread over six sample districts of three states was adopted for the study.
18. The main findings of the Study are:
l During 1995-96 none of the 12 assisted sample PHCs was found to beequipped with all the eight essential facilities; viz; well equipped operationtheatre, labour room, observation ward, two quarters, generator, drinking water,ambulance and lady doctor that were required to be created in each PHC. Ofthe eight essential complementary facilities including the post of lady doctor, amaximum of six facilities were created in 3 PHCs followed by five facilities in 4PHCs, four facilities in 1 PHC and two facilities in 4 PHCs. Such a variation increation of essential facilities in sample PHCs against an equal allocatedamount of Rs.10 lakh/PHC needs a closer look.

96
l Among the requisite facilities, the post of lady doctor for attending on deliverycases is envisaged to be most essential, but none of the sample PHCs hadbeen posted with a lady doctor. Though, a few facilities like labour rooms,operation theatres and observation wards are available in many of the samplePHCs, such facilities could not be utilised for attending delivery cases withoutthe availability of lady doctors. This mis-match between the manpower andessential facilities is a matter of serious concern. Interestingly, amidst theexisting thin facilities, ambulances are made available in seven out of 12 samplePHCs.
l The adequacy of doctors against their sanctioned posts seems to beencouraging, as 75 per cent of doctors are in position in assisted PHCs, while96 per cent of them are found in position in non-assisted PHCs. In this context,however, the observations of PEO field teams reveal that in practice theabsenteeism among the doctors from their work places is very high which isobserved to be a binding constraint in utilisation of health care services insample PHCs.
l The average utilisation of cases in PHCs with SSNP is 30 cases/day/doctor,while it is 25 in non-assisted PHCs. However, the inter-PHC comparison ofutilisation rate reveals a variation across the sample states.
l The utilisation rate of health care services in PHCs as observed above shouldnot be taken as reflection of true performance and functionality of PHCs. In thiscontext, qualitative information gathered by PEO field teams through theirindepth probing and discussions reveals that in the absence of doctors, thecases coming to PHCs are attended by para-medical and auxiliary para-medicalstaff. It was also observed by the field teams that since the PHCs were notequipped with diagnostic facilities, the patients preferred to visit tertiary/districthospitals for treatment of their ailments.
l The profile of beneficiaries reveals that a maximum of 32.93 per cent ofbeneficiaries have sought the treatment for minor ailments like, cold, cough andfever. This is followed by the cases suffering from water borne diseases(14.63%), vaccine preventable diseases (8.54%), respiratory diseases (8.53%)and gynaecological complications (4.88%) respectively.
l As many as 51.22 per cent of beneficiaries belonging to programme assistedPHCs are found to be dissatisfied with the functioning of PHCs. Further, of thedissatisfied beneficiaries, a majority have complained about medical and para-medical staff of PHCs. The main reasons for their dissatisfaction included non-availability of medical and para-medical staff (42.85%), not examined by doctors(52.38%) and proper attention not given (35.71%). The second important reasonfor dissatisfaction of beneficiaries was the non-availability of medicines in PHCs.About 66.67 per cent of the beneficiaries expressed this view.
l Despite inadequacies in the delivery of health care services by PHCs, a vastmajority of about 89 per cent of beneficiaries belonging to programme assistedPHCs have still expressed their preferences for PHCs for seeking health careservices over other alternative sources of treatment.
l A majority of 73.33 per cent beneficiaries belonging to assisted PHCs and 52.50per cent belonging to non-assisted PHCs have incurred private expenditure

97
below Rs.100 per illness episode. Besides, major chunk of expenditure made bythe sample beneficiaries of all categories is on purchasing medicines. Theincome profile of beneficiaries belonging to programme assisted PHCs revealsthat the beneficiaries whose average monthly income was below Rs.500 haveformed a small percentage of 3.66, while a majority (63.41%) of thebeneficiaries are from the monthly income group of above Rs.1000. Similarresults are obtained for non-assisted PHCs also.
l The low-income group households seem to stay away from the public healthcare delivery system primarily because of non-availability of medicine, indirectcost on transport and high opportunity cost in terms of foregone income (due toloss of wage income say). They, therefore, seem to depend on cheaperalternatives, such as traditional Indian medicines or unqualified medicalpractitioners.
l It is interesting to note that a large majority beneficiaries of the public healthdelivery system have expressed willingness to pay for the services if the qualityof delivery improves. In the PEO sample survey the beneficiaries were asked ifthey would be willing to pay 25% of the market cost of treatment if the quality ofdelivery improves. About 62% of the beneficiaries replied in the affirmative.
Member Parliament Local Area Development Scheme (MPLADS)
19. Member of Parliament Local Area Development Scheme (MPLADS) was introduced inDecember, 1993 to enable the Members of Parliaments (MPs) to identify and getimplemented small developmental works of capital nature based on locally felt needs sothat durable assets will be created in their constituencies. The Ministry of RuralDevelopment (since renamed as Ministry of Rural Areas and Employment) initiallyadministered the scheme. Since October 1994, it has been transferred to the Ministry ofStatistics and Programme Implementation. The Ministry prepares the guidelines to befollowed and amended this from time to time.
20. The scheme is under operation during the last 7 years. A couple of localized studiesand the two CAG Reports (1993-97, 1997-2000), besides the Standing Committee onFinance (1998-99) have pointed to the operational lapses and failure of the Ministry toeffectively administer and monitor the scheme and suggested a thorough review of thescheme. At the instance of Ministry of Statistics and Programme Implementation,Programme Evaluation Organization (PEO) of Planning Commission undertook the study toevaluate the design, implementation and impact of the scheme and to identify the areas ofits weakness and strength for the improvement in the performance of the scheme.
21. The main findings of the study are:
l Out of 25702 works in 57 sample constituencies during 1993-99 those classifiedunder Roads and Bridges and Community Works dominate constituting about 29and 24 percent respectively. Of the total works, about 68% are reported to becomplete, 14% are in progress, 9% yet to start and the status of the rest ofworks (9%) could not be known.
l Allocation of funds to most of the works in the selected districts was found to bemeager despite the fact that there is a large unspent balance (46%) of MPLADS

98
amount. At the aggregate level, about 46.4% of the works got an allocation ofless than Rs.50,000, while the works with an allocation of Rs.5 lakh or moreconstitute only 3.6%.
l Monitoring and Supervision is the weakest part of the scheme, which is largelydue to inadequate infrastructure available to the collector vested with theresponsibility. Maintenance of the assets created is another area of weakness ofthe scheme. This is largely due to the lack of resources allocated specially forthis.
l The impact of the scheme as felt by the knowledgeable persons and localpeople indicate that about 65% of the created assets have been rated as goodand overwhelming majority of them have opined that the created assets are asper the felt needs and has improved their quality of life. However, their opinionabout the implementation and maintenance of assets points out to theinadequate arrangements and a need for large scale involvement of PRIs forstrengthening the scheme.
l The findings of the study suggest that there is a need for revitalizing thescheme in terms of financial management, inter-departmental coordination forimplementation and involvement of PRIs for identifying the proper works,monitoring and maintenance of the created assets. It is hoped that the findingsof the study will be useful to the Planning/Implementing agencies in introducingthe necessary corrective steps for improving the scheme.
Evaluation Study of the National Project on Bio-gas Development
22. The National Project on Biogas Development (NPBD) of the Ministry of Non-Coventional Energy Sources (MNES) was started in 1981-82 for promotion of family typebiogas plants, the current potential of which is estimated at 12 million, to provide cleanalternate fuel to the rural masses and enriched organic manure for agriculture. The implicitobjective of the programme is to reduce the use of non-renewable fuels and fuel wood. It isa central sector scheme covered under 20 Point Programme. In order to help the poor andthe disadvantaged who can not own and operate family type biogas plants, the programmefor promoting large biogas plants at the community level was taken up in 1982-83. TheNPBD carries a package of incentives for the adopters, implementing agencies and theturnkey workers.
23. The NPBD has been receiving public attention and scrutiny because of its potential asan alternate source of cheap and renewable source of energy, and also because of its poorperformance, high mortality rate of plants and high central subsidy. Based on the lessonslearnt through feedback from findings of research studies and from their own monitoringsystem the MNES has been modifying the implementation strategy for NPBD from time totime. However, there is no evidence to suggest whether the performance of NPBD hasactually improved.
24. At the instance of MNES, the Programme Evaluation Organization (PEO) took up theevaluation of NPBD primarily to examine if the implementation methods being currentlyfollowed are contributing to increased adoption of family type biogas plants and to reduced

99
mortality and non-functionality rates. Through diagnostic analysis, the study aims atidentifying the factors contributing to the success and failure of the programme. In addition,the study is designed to reflect on the viability of alternate strategies to realize the biogaspotential in the country.
25. The major findings of the study are as under:-
(a) Family type Biogas Plants
l A majority of biogas user households are well-to-do farmers holding a sizeableamount of agricultural land exceeding 2.5 acres while about 5 percent of themdo not own any agricultural land.
l About 75% of the owners of functional FTBPs have reported substantial savingin the cost of cooking fuel. 90% of them have reported that use of enrichedslurry has reduced the cost of chemical fertilizers.
l Sanitary linked biogas plants have a lower acceptability rate due to socio-psychological inhibitions in respect of routine operation of these plants.
l Only 45 percent of the plants are working fully, while plants working partiallyare 10%, incomplete 3.6%, uncommissioned 5.9%, non-operational 26.2% anddismantled 9%.
l Over 60 per cent of plants turned non-functional due to various structuralproblems. Most of these are from Orissa (43%) and Maharashtra (46%).
l A small proportion of households (3.4%), mostly among SC/ST category, do nothave any dung to operate their plants.
l Most state level biogas cells are overstaffed, while in districts staff deficiencywas felt in all the states leading to inadequate supervision during constructionas also physical verification of plants at different levels.
l Many households, nearly 90% are not aware about government scheme ofrepair of defective plants.
l Financing of biogas construction through institutional sources is not considereda viable proposition. Only 11% of the sample households availed this facility.
l The average size of cattle holding of the owners of functional biogas plants isfound to be 5.23, while that for the owners of non-functional plants works out to3.19.
l The household demand for family type biogas plants is influenced by factors likeavailability of alternate convenient fuels (LPG) , distance of a village from thenearest town and inconvenience in handling and maintaining biogas plants.
(b) Community Biogas Plants
l The MNES has almost discontinued the promotion of community biogas plantsin the past five years. During this period, only 9 such plants have been installedof which 8 are in Madhya Pradesh.

100
l Only 7% of the CBPs surveyed, are functional. A similar study on CBPsconducted in the past by Agricultural Finance Corporation, Mumbai hasindicated a functionality rate of 12%.
l The main factors contributing to the success of CBPs are the smaller number ofparticipating members (around 15), more members from occupational categoryof agriculture and animal husbandry (77%) and higher monthly family income ofthe members.
l The main reasons for failure are : large number of members, non-contribution ofmonthly maintenance charges as well as dung, non-availability of labour tooperate the plant and complaints about non-availability of gas, unsuitable timingof operation, non-cooperation of members for repair/maintenance, etc.
ANNUAL PLAN 2002-2003
26. The following evaluation studies/activities are completed/ in progress:
(i) Evaluation Study on National Project on Bio-Gas Development - Completed inMay, 2002.
(ii) Evaluation Study on Construction of Godowns & Purchase of Vans/Trucks forStrengthening of Public Distribution System – Infrastructure in States/UTs. - Inprogress.
(iii) Evaluation Study on Targeted Public Distribution System (TPDS). – In progress.
(iv) Evaluation Study on Functioning of Statutory Development Boards inMaharashtra. - In progress.
(v) Impact Studies on Integrated Dairy Development Project in Gujarat, Nagalandand Orissa. - In progress.
(vi) Evaluation Study on Growth Centres Scheme - In progress.
(vii) Evaluation Study on Decentralised Training Programme - In progress.
(viii) Evaluation Study on Mid-day Meal Schemes - In progress.
(ix) Evaluation Study on Work Force Management Options and InfrastructureRationalisation in Primary Health Care Services – In progress.
(x) Evaluation Study on Impact of CS Schemes in Anantnag, Kupwara, Rajouri andDoda districts of J&K – In progress.
3.2 PUBLIC SECTOR OUTLAYS
1. The Annual Plan Outlay of 2002-03 amounts to Rs. 1,44,037.77 crore, comprising ofGross Budgetary Support (GBS) of Rs. 66,870.92 crore and Internal and Extra BudgetaryResources (IEBR) of Rs. 77,166.85 crore. A GBS of Rs.46,629.08 crore has been allocatedas Central Assistance to State/ Union Territories. The GBS has been allocated between theCentral Sector Plan and the Central Assistance to State Plans keeping in view the balancein the flow of Plan resources between the two.

101
Background for Annual Plan 2002-03
2. In the run-up to the process of plan formulation, the need to arrest the continuousdecline in the ratio of Central Plan Outlay to GDP, as also the ratio of public investment toGDP was reinstated. Efforts in this direction are all the more important, if, the objective toraise the growth rate of the economy to 8 per cent, as envisaged in Approach Paper to theTenth Five Year Plan, has to be realistically pursued.
3. In the Annual Plans in Ninth Five Year Plan, share of Central Assistance to Statesand UTs averaged over 43 per cent. However, it declined to 39.3 per cent in the RevisedEstimates(RE) of the Annual Plan 2001-02 on account of post-budget additionalities thatwere allocated only to the Central Sector, as well as the transfer of Pradhan Mantri GraminSadak Yojana (PMGSY) as a Centrally Sponsored Scheme in the Department of RuralDevelopment from the State Sector allocations. The share of Central Assistance to Statesand UTs has been increased to 41.08 per cent in Budget Estimate(BE) of Annual Plan2002-03, amounting an increase of 14.73 per cent over BE and 19.94 per cent over RE ofAnnual Plan 2001-02. Though, it would be desirable to raise this share to the Ninth Planaverage of over 43 per cent, it has not been possible to do so on account of additionalresource commitments and policy announcements in respect of schemes/ programs in theCentral Sector. The allocation of Central Sector in 2002-03 has increased by 13.4 per centover BE and decreased by 1 per cent over RE of Annual Plan 2001-02.
4. While preparing the Plan proposals for the Tenth Five Year Plan, the CentralMinistries / Departments and State / UTs were asked to undertake a serious prioritisation ofall Plan programs / schemes / projects, with a view to use the available resources in themost judicious and economically efficient manner. Accordingly, while preparing the AnnualPlan proposals for 2002-03, the Ministries / Departments were asked to prepare a “CorePlan” highlighting basic sectoral priorities and minimum programme for the concernedsector. The idea behind this exercise is to ensure sufficient funds for the critical programsin each sector so that they could be completed on time and the projected benefits fromtheir implementation could be fully realised.
5. The need to have a realistic assessment of resources was emphasised so that theproposals formulated for the Annual Plan 2002-03, in the context of Tenth Plan, arecredible and the exercise itself is meaningful. The internal resources and the functioning ofpublic sector undertakings and departmental undertakings such as the Electricity Boards,Transport Corporations and Irrigation Departments have been a matter of concern anddeliberated extensively in the Commission. In addition, concerted efforts were also requiredto enhance the internal accruals of such undertakings so that they do not constitute a drainon the budgetary resources of the government, on the contrary, they should be in aposition to make a positive contribution to the government’s efforts at mobilising resourcesfor the Plan. It has also been observed that in some cases the gap between the approvedPlan Outlay and the revised / actual outlay is largely on account of the failure of the PSUsto mobilise the agreed Internal and Extra-budgetary Resources for the Plan. The Ministries/ Departments that have Public Sector Undertakings under with them, have been asked toexamine it closely so as to bridge the said gap.

102
6. In order to improve the efficiency and impact of the Government programs, a detailedexercise to converge, weed out and transfer the Central and Centrally Sponsored Schemeswas undertaken in the course of the year. In pursuance of the announcements made in theUnion Budget 2001-02, all on-going schemes were subjected to zero-based budgeting inthe Planning Commission. As a result of these exercises, there has been a significantreduction in the number of schemes being implemented by the Central Ministries/Departments. The results are being reflected in the allocations that are being made to theCentral Sector Plan and to the Central Assistance to State/UT Plans.
7. Keeping in view the commitments for additional resources and policy announcements,it was decided to provide adequate resources to sectors/ Ministries identified as thrustareas for the Tenth Plan, as approved by the National Development Council in theApproach Paper to the Tenth Five Year Plan.
8. The Sectors/ Ministries identified for special thrust include Education, Health andFamily Welfare, Rural Development, Agriculture, Power and Energy, Transport, UrbanDevelopment and Science and Technology. In all, over Rs.44,898 crore, amounting tonearly 67 per cent of total budgetary support to the Plan, has been allocated to these areasin the Centre and State Sectors.
9. The sectoral allocations also include a package for North Eastern States to fosterdevelopment and reduce the socio-economic differences. All Central Ministries/Departments (other than those specifically exempted) are required to earmark at least 10per cent of their budgeted outlay for programs in the North Eastern region including Sikkim.The Ministries/ Departments which were exempted from earmarking allocation for the NorthEastern region for the year 2002-03 are Departments of Expenditure, Revenue, Planning,Ocean Development, Space, Supply, Atomic Energy, Economic Affairs, External Affairs,Petroleum and Natural Gas, Steel, Legal Affairs, Personnel and Training, Bio-technologyand Science and Technology.
Highlights of Plan Allocations
10. Though Agriculture is a State subject, the budgetary support for the Sector in theCentre Sector Plan has been increased by 9.7 per cent over budget esimate of previousyear. The increase in case of Agriculture Research and Education is slightly higher at over13.3 per cent. The allocation for Irrigation under AIBP has also been enhanced by 40 percent.
11. Allocations for Elementary Education and Literacy have been enhanced by 22.5 percent over the 2001-2002 BE and by 30.7 per cent over RE to take care of the Governmentcommitment on Sarva Shiksha Abhiyan. Considering that ensuing year is the first year forthis programme, a gradual increase in the allocation may have to be factored in future.
12. In the Health and Family Welfare sector, additional allocations have been on accountof raising the salaries for the most visible Government functionary at the grass root level,namely, Anganwadi workers and improved family welfare service for reproductive and child

103
health care. Allocations have also been enhanced to strengthen the Indian System ofMedicine and Homeopathy with a view to develop this sector as a complementary andalternative system of medicine at the global level.
13. In case of Power and Energy sector, while directing enhanced allocations foradditional generation of Power, the focus of the Plan has been on accelerating the powersector reforms at State level. Accordingly, allocation for Accelerated Power Developmentand Reform Programme (APDRP) has been enhanced by over 133 per cent.
14. Central Sector allocation for Rural Development has been enhanced by 40 per centover the BE of 2001-02. In addition, the on-going National Social Assistance Programmeand Annapoorna Scheme of Department of Rural Development have been provided Rs. 680crore as part of the Central Assistance to State Plans. This Programme will now be runalong the lines of APDRP and AIBP under the supervision of the Department of RuralDevelopment. In respect of Sampoorn Gramin Rozgar Yojana, in the Department of RuralDevelopment, a provision of Rs. 3,996 crore, including cash and food grains componenthas been made. Depending upon the progress of the Programme, in particular, off-take offood grains, more funds could be provided from the savings of other Ministries in thecourse of the year.
15. Allocations for Science and Technology, including Bio-technology, Scientific andIndustrial Research, Space and Ocean Development have been enhanced by more than 22per over BE and about 29 per cent over RE of 2001-02 to take care of the focus areaswithin the sector for the Tenth Five Year Plan and for meeting the country’s strategicinterest in the sector.
16. The allocation of Transport sector, including Road and Highways, Shipping andRailways has been increased by nearly 29.2 per cent over BE of 2001-02. Most of theincrease is in the allocation of Ministry of Roads and Highways, where the second phase ofthe National Highway Development Programme is to be started during the year and theMinistry of Railways. The Budgetary Support of Railways, including provision for RailwaysSafety Fund, has been increased by over 52.3 per cent from Rs.3540 crore to Rs. 4840crore.
17. In Urban Development, a provisioning of Rs. 256.85 crore has been made for ValmikiAmbedkar Awas Yojana (VAMBAY). In addition, an allocation of Rs. 500 crore has beenmade under a new Initiative for Strengthening Urban Infrastructure in smaller cities andtowns in partnership with local bodies. This allocation has been reflected as a part ofCentral Assistance to State Plans. In most cases, the financial position of such urban localbodies is insufficient to meet the infrastructural needs of the growing population. The newprogramme, therefore, supplements the efforts of local bodies in strengthening urbaninfrastructure in medium and large towns.
18. As part of Central Assistance to State / UTs Plans, a new facility called Developmentand Reform Facility with an allocation of Rs.2500 crore has been initiated in the ensuingyear. The objectives of this facility are to incentivise and give a fillip to implementation ofan agreed set of policy and procedural reforms in a time-bound manner in the medium-term

104
Review of Annual Plan 2001-02
21. In the Revised Estimates (RE), Central Sector outlay for the Annual Plan 2001-02revised to Rs.1,27,855.57 crore, a decrease of 1.8 per cent over the Budget Estimates (BE)of Rs.1,30,181.34 crore. This has been mainly due to reduced IEBR of the Central PublicSector Undertakings (CPSUs) by 4.5 per cent. According to the BE of the 2001-02 AnnualPlan, nearly, 54.32 per cent of the Central Sector Outlay was to be funded through IEBRby the CPSUs. and the remaining Rs.59,456 crore was to be met from GBS. The RE forAnnual Plan 2001-02 for Centre, States/UTs, by heads of development, is summarized inTable.3.2.2
time frame. The proposed special packages for Bihar and the KBK districts of Orissa arebeing covered under this facility.
19. In the Central Assistance to States / UTs Plans, funds to Rural Electrification werechannelised through three windows i.e. Prime Ministers Gramoday Yojana, RuralElectrification Corporation and loans to States for Rural Electrification. These have beenmerged into one with an allocation of Rs. 600 crore for the ensuing year with a viewto improve focus and efficiency in the flow and utilisation of resources for ruralelectrification.
20. The BE for Annual Plan 2002-03 for Centre, by heads of development, is summarizedin Table.3.2.1.
Table 3.2.1
Budget Estimates of Annual Plan 2002-03 for Centre
(in Rs. crore)
Head of Development Budget Support IEBR Outlay
1 Agriculture & Allied Activities 3633.13 100.00 3733.13
2 Rural Development 6420.72 0.00 6420.72
3 Special Area Programmes 0.00 0.00 0.00
4 Irrigation & Flood Control 442.98 0.00 442.98
5 Energy 5178.11 31128.21 36306.32
6 Industry & Minerals 3195.75 4797.26 7993.01
7 Transport 14211.82 17829.55 32041.37
8 Communications 335.00 19204.79 19539.79
9 Science, Technology & Environment 4413.8 0.00 4413.80
10 General Economic Services 1783.14 2.00 1785.14
11 Social Services 26822.93 4105.04 30927.97
12 General Services 433.54 0.00 433.54
TOTAL 66870.92 77166.85 144037.77
Note: The figures for States/Uts not available

105
22. The Actual Expenditure, by heads of development, of Annual Plan 2000-01 for theCentre, States / UTs is given in Annexure 3.2.1. The Budget Estimates of the Annual Plan2001-02 of Centre, States / UTs by heads of development is given in Annexure 3.2.2. TheAnnexure 3.2.3 gives details of Revised Estimates, of Annual Plan 2001-02 for the Centre,States / UTs by heads of development. The Revised Plan Outlays of States / UnionTerritories for Annual Plan 2001-02 by heads of development, are given in Annexure 3.2.4.The Ministry / Department-wise, Budget Estimates, of Annual Plan 2002-03 for Centre isgiven in Annexure 3.2.5. The Budget Estimates of Annual Plan 2002-03 for the Centre, byheads of development is given in Annexure 3.2.6.
Table 3.2.2
Revised Estimates of Annual Plan 2001-02 for Centre, States and Union Territories
(in Rs. crore)
Centre States TotalHead of Development & UTs
Budget IEBR OutlaySupport
1 Agriculture & Allied Activities 3389.69 161.06 3550.75 4989.97 8540.72
2 Rural Development 5719.95 0.00 5719.95 8147.07 13867.02
3 Special Area Programmes 0.00 0.00 0.00 809.89 809.89
4 Irrigation & Flood Control 428.31 0.00 428.31 14160.92 14589.23
5 Energy 5214.27 24572.72 29786.99 13535.52 43322.51
6 Industry & Minerals 3121.96 4202.39 7324.35 2247.93 9572.28
7 Transport 14204.39 15872.59 30076.98 11618.94 41695.92
8 Communications 237.48 18668.97 18906.45 9.60 18916.05
9 Science, Technology & 3505.54 0.00 3505.54 401.97 3907.51Environment
10 General Economic Services 1194.03 3.00 1197.03 2123.90 3320.93
11 Social Services 22925.98 4098.84 27024.82 27778.22 54803.04
12 General Services 334.40 0.00 334.40 2669.58 3003.98
TOTAL 60276.00 67579.57 127855.57 88493.51 216349.08

106
Annexure-3.2.1
Actual Expenditure of Centre, States/ UTs for the Annual Plan 2000-01
(Rs.crore)
Sl. Head of Development Code Centre States UTs Total PlanNo. Expenditure
1 2 3 4 5 6 7
(I) AGRICULTURE & ALLIED 2993.79 4487.79 95.29 7576.87ACTIVITIES
1. Crop Husbandry 12401 1356.03 1132.34 14.42 2502.79
2. Soil & Water Conservation 12402 74.21 807.37 3.09 884.67
3. Animal Husbandry 12403 85.10 321.65 18.07 424.82
4. Dairy Development 12404 39.59 41.19 3.75 84.53
5. Fisheries 12405 106.28 204.15 8.63 319.06
6. Forestry & Wildlife 12406 424.89 1286.31 28.68 1739.88(Welfare of Animals)
7. Plantations# 12407 169.35 5.71 0.00 175.06
8. Food, Storage & Warehousing 12408 19.99 5.96 0.00 25.95
9. Agricultural Research & Education 12415 549.00 297.22 5.19 851.41
10. Agricultural Fin. Institutions 12416 26.88 81.23 0.00 108.11
11. Cooperation 12425 137.03 232.06 12.15 381.24
12. Other Agricultural Programmes 12435 5.44 72.60 1.31 79.35
(II) RURAL DEVELOPMENT 4381.85 5383.86 86.68 9852.39
1. Special Programme for Rural 12501 1273.19 651.94 5.46 1930.59Development
2. Rural Employment 12505 2804.39 2118.59 0.00 4922.98
3. Land Reforms 12506 73.00 237.89 1.34 312.23
4. Other Rural Development Progs. 12515 231.27 2375.44 79.89 2686.60
(III) SPECIAL AREA PROGRAMMES* 0.00 1045.47 0.00 1045.47
1 Hill Areas 12551 - - - -
2 North Eastern Areas 12552 - - - -
3 Other Special Area Programmes 12575 - - - -
(a) Backward Areas - - - -
(b) Tribal Sub-Plan - - - -
© Border Areas - - - -
(d) Others - - - -
(IV) IRRIGATION & FLOOD CONTROL 259.83 13232.70 36.56 13529.09
1. Major & Medium Irrigation 12701 14.84 10417.79 0.64 10433.27
2. Minor Irrigation 12702 4.91 1864.84 10.37 1880.12
3. Command Area Development 12705 144.95 339.14 0.05 484.14

107
4. Flood Control and Drainage 12711 95.13 610.93 25.49 731.55
(V) ENERGY 21199.09 14466.32 947.83 36613.24
1. Power 12801 8401.00 14392.18 942.08 23735.26
2. Petroleum 12802 9867.21 - - 9867.21
3. Coal & Lignite 12803 2093.48 - - 2093.48
4. Non Conventional Sources of Energy 12810 837.40 74.14 5.76 917.30
(VI) INDUSTRY & MINERALS 4715.85 2065.84 84.35 6866.04
1. Village & Small Industries 12851 32.01 816.53 60.95 909.49
2. Iron & Steel # 12852 1137.72 - - 1137.72
3. Non Ferrous Mining & Metallurgical 12853 1463.22 - - 1463.22Industries
4. Cement & Non-metallic MineralIndustries# 12854 16.04 - - 16.04
5. Fertilizer Industries# 12855 807.67 - - 807.67
6. Petrochemical Industries 12856 247.00 - - 247.00
7. Chemical & Pharmaceutical Inds# 12857 29.94 - - 29.94
8. Engineering Industries 12858 21.57 - - 21.57
9. Telecommunication & Electronic Industries 12859 305.35 - - 305.35
10. Consumer Industries 12860 0.02 - - 0.02
11. Atomic Energy Industries# 12861 206.71 - - 206.71
12. Other Industries# 12875 286.04 1109.03 23.40 1418.47
13. Other Outlays on Industries &Minerals 12885 162.56 140.28 0.00 302.84
(VII) TRANSPORT 16494.59 8329.91 909.27 25733.77
1. Railways 13002 9395.00 - - 9395.00
2. Ports & Lighthouses 13051 1159.32 13.74 15.19 1188.25
3. Shipping 13052 358.50 1.00 168.80 528.30
4. Civil Aviation 13053 1444.01 20.68 30.00 1494.69
5. Roads & Bridges 13054 4074.63 6964.81 274.39 11313.83
6. Road Transport 13055 - 834.50 420.37 1254.87
7. Inland Water Transport 13056 44.59 38.70 0.29 83.58
8. Other Transport Services 13075 18.54 456.48 0.24 475.26
(VIII) COMMUNICATIONS* 14181.54 0.36 1.03 14182.93
1. Postal Services 13201 75.62 - - 75.62
2. Telecommunication Services 13225 13638.62 - - 13638.62
(Rs.crore)
Sl. Head of Development Code Centre States UTs Total PlanNo. Expenditure
1 2 3 4 5 6 7
Annexure-3.2.1 Contd...

108
3. Other Communication Services 13275 467.30 - - 467.30
(IX) SCIENCE, TECHNOLOGY & 3382.82 168.68 5.86 3557.36ENVIRONMENT
1. Atomic Energy Research 13401 503.51 - - 503.51
2. Space Research 13402 1593.98 - - 1593.98
3. Oceanographic Research 13403 79.89 - - 79.89
4. Other Scientific Research 13425 764.49 66.23 1.71 832.43
5. Ecology & Environment 13435 440.95 102.45 4.15 547.55
(X) GENERAL ECONOMIC SERVICES 1127.43 1375.87 34.31 2537.61
1. Secretariat Economic Services 13451 123.23 519.45 3.01 645.69
2. Tourism 13452 124.48 197.51 15.38 337.37
3. Foreign Trade & Export Promotion# 13453 227.90 - - 227.90
4. Census, Surveys & Statistics 13454 21.15 22.73 2.59 46.47
5. Meteorology 13455 30.29 - - 30.29
6. Civil Supplies 13456 9.19 65.52 10.07 84.78
7. General Financial & TradingInstitutions# 13465 4.29 - - 4.29
8. Technical .& Economic Cooperationwith other Countries# 13605 550.00 - - 550.00
9. Other General Economic Services# 13475 36.90 570.66 3.27 610.83
(XI) SOCIAL SERVICES 19061.18 20401.85 1872.82 41335.85
1. General Education 22202 4947.22 4956.08 260.93 10164.23
2. Technical Education 22203 500.00 272.78 53.73 826.51
3. Sports & Youth Services 22204 177.56 207.96 13.19 398.71
4. Art & Culture 22205 163.04 128.73 9.28 301.05
5. Medical & Public Health 22210 1199.90 2429.10 349.36 3978.36
6. Family Welfare 22211 3090.11 - - 3090.11
7. Water Supply & Sanitation# 22215 2071.03 4814.61 496.45 7382.09
8. Housing 22216 1664.17 1867.32 56.91 3588.40
9. Urban Development 22217 457.48 2135.11 526.46 3119.05
10. Information and Publicity 22220 47.55 48.10 3.82 99.47
11. Broadcasting 22221 538.86 - - 538.86
12. Welfare of SC,ST and OtherBackward Classes 22225 908.78 1845.76 17.05 2771.59
13. Labour & Employment 22230 111.99 232.80 8.31 353.10
14. Social Security & Welfare 22235 2426.23 779.58 45.08 3250.89
(Rs.crore)
Sl. Head of Development Code Centre States UTs Total PlanNo. Expenditure
1 2 3 4 5 6 7
Annexure-3.2.1 Contd...

109
(Rs.crore)
Sl. Head of Development Code Centre States UTs Total PlanNo. Expenditure
1 2 3 4 5 6 7
15. Nutrition 22236 2.87 650.81 32.15 685.83
16. Secretariat Social Services 22251 1.82 - - 1.82
17. Other Social Services# 22250 1.20 33.11 0.10 34.41
18 North Eastern Areas 22552 751.37 - - 751.37
(XII) GENERAL SERVICES 63.87 1469.95 114.85 1648.67
1. Administration of Justice 32014 0.50 - - 0.50
2. Currency, Coinage and Mints 32046 5.44 - - 5.44
3. Other Fiscal Services 32047 0.00 - - 0.00
4. Secretariat-General Services # 32052 3.20 - - 3.20
5. Police 32055 6.50 - - 6.50
6. Jails# 32056 7.00 11.28 17.40 35.68
7. Supplies and Disposals# 32057 0.20 - - 0.20
8. Stationery & Printing 32058 0.00 12.29 1.90 14.19
9. Public Works 32059 21.01 402.14 61.21 484.36
10. Other Administrative Services 32070 20.02 1044.24 34.34 1098.60
GRAND TOTAL 87861.84 72428.60 $ 4188.85 164479.29
* Break-up not available- No allocation therein# Revised Estimates for Centre ; as Actual Expenditure figures not available.$ The State Expenditure Column excludes Jharkhand as the State Govt. have not reported the Actual
Expenditure figures
Annexure-3.2.1 Contd...

110
Annexure 3.2.2
Budget Estimates by Heads of Development of Annual Plan 2001-02 Centre,States/ UTs
(Rs.crore)
Sl. Head of Development Centre States UTs Total PlanNo. Outlay
I. AGRICULTURE & ALLIEDACTIVITIES 3380.25 5608.53 108.10 9096.88
1. Crop Husbandry 12401 1617.55 1768.25 15.82 3401.62
2. Soil & Water Conservation 12402 15.00 767.09 4.71 786.80
3. Animal Husbandry 12403 138.99 342.20 18.96 500.15
4. Dairy Development 12404 32.95 62.67 5.35 100.97
5. Fisheries 12405 119.86 215.83 10.56 346.25
6. Forestry & Wildlife 12406 335.46 1556.66 27.74 1919.86
7. Plantations 12407 136.50 7.20 3.45 147.15
8. Food, Storage & Warehousing 12408 128.19 16.54 0.00 144.73
9. Agricultural Research & Education 12415 684.00 310.59 5.13 999.72
10. Agricultural Fin. Institutions 12416 29.00 73.97 0.00 102.97
11. Cooperation 12425 132.75 344.2 14.85 491.80
12. Other Agricultural Programmes 12435 10.00 143.33 1.54 154.87
II. RURAL DEVELOPMENT 4449.45 8870.49 124.55 13444.49
1. Special Programme for Rural 12501 1194.75 1680.10 3.56 2878.41Development
2. Rural Employment 12505 2925.00 2510.44 0.00 5435.44
3. Land Reforms 12506 66.00 232.74 1.71 300.45
4. Other Rural Development 12515 263.70 4447.21 119.28 4830.19Programmes
III. SPECIAL AREA PROGRAMMES* 0.00 1146.28 0.00 1146.28
1. Hill Areas 12551 - - - 0.00
2. North Eastern Areas 12552 - - - 0.00
3. Other Special Area Programmes 12575 - - - 0.00
(a) Backward Areas - - - 0.00
(b) Tribal Sub-Plan - - - 0.00
(c) Border Areas - - - 0.00
(d) Others - - - 0.00
IV IRRIGATION & FLOOD CONTROL 476.76 16001.52 50.20 16528.48
1. Major & Medium Irrigation 12701 56.14 12821.78 0.60 12878.52
2. Minor Irrigation 12702 84.58 2168.24 14.32 2267.14
3. Command Area Development 12705 187.19 244.98 0.18 432.35

111
4. Flood Control and Drainage 12711 148.85 766.52 35.10 950.47
V. ENERGY 33787.63 14510.94 804.63 49103.20
1. Power 12801 12374.67 14349.97 796.33 27520.97
2. Petroleum 12802 16935.69 - 0.00 16935.69
3. Coal & Lignite 12803 3438.31 - 0.00 3438.31
4. Non Conventional Sources of Energy 12810 1038.96 160.97 8.30 1208.23
VI. INDUSTRY & MINERALS 7954.38 2436.62 95.61 10486.61
1. Village & Small Industries 12851 1213.97 1035.55 66.32 2315.84
2. Iron & Steel Industries 12852 1315.75 - - 1315.75
3. Non Ferrous Mining & Metallurgical 12853 1442.22 - - 1442.22Industries
4. Cement & Non-metallic 12854 21.94 - - 21.94Mineral Industries
5. Fertilizer Industries 12855 1149.03 - - 1149.03
6. Petrochemical Industries 12856 334.50 - - 334.50
7. Chemical & Pharmaceutical Industries 12857 48.95 - - 48.95
8. Engineering Industries 12858 615.88 - - 615.88
9. Telecommunication & Electronic 12859 539.73 - - 539.73Industries
10. Consumer Industries 12860 448.62 - - 448.62
11. Atomic Energy Industries 12861 366.48 - - 366.48
12. Other Industries 12875 47.96 1275.12 29.29 1352.37
13. Other Outlays on Industries & 12885 409.35 125.95 - 535.30Minerals
VII. TRANSPORT 22569.99 12099.19 1165.14 35834.32
1. Railways 13002 10040.00 0.00 10040.00
2. Ports & Lighthouses 13051 1092.75 23.83 13.75 1130.33
3. Shipping 13052 976.86 0.00 102.38 1079.24
4. Civil Aviation 13053 1641.31 35.40 19.00 1695.71
5. Roads & Bridges 13054 8745.34 10014.85 431.34 19191.53
6. Road Transport 13055 0 1784.91 597.84 2382.75
7. Inland Water Transport 13056 52.23 24.28 0.61 77.12
8. Other Transport Services 13075 21.50 215.92 0.23 237.65
VIII. COMMUNICATION* 20288.66 10.16 0.99 20299.81
1. Postal Services 13201 135.00 - - 135.00
(Rs.crore)
Sl. Head of Development Centre States UTs Total PlanNo. Outlay
Annexure-3.2.2 Contd...

112
2. Telecommunication Services 13225 18174.00 - - 18174.00
3. Other Communication Services 13275 1979.66 - - 1979.66
IX. SCIENCE, TECHNOLOGY & 3599.85 429.12 13.44 4042.41ENVIRONMENT
1. Atomic Energy Research 13401 459.00 - 0.00 459.00
2. Space Research 13402 1710.00 - 0.00 1710.00
3. Oceanographic Research 13403 142.00 - 0.00 142.00
4. Other Scientific Research 13425 888.75 218.07 5.25 1112.07
5. Ecology & Environment 13435 400.10 211.05 8.19 619.34
X. GENERAL ECONOMIC SERVICES 6404.85 2475.58 49.03 8929.46
1. Secretariat Economic Services 13451 215.84 932.48 4.29 1152.61
2. Tourism 13452 179.50 364.97 21.56 566.03
3. Foreign Trade & Export Promotion 13453 312.11 - 0.00 312.11
4. Census, Surveys & Statistics 13454 154.00 32.03 4.53 190.56
5. Meteorology 13455 55.00 - 0.00 55.00
6. Civil Supplies 13456 22.66 68.00 11.67 102.33
7. General Financial & Trading 13465 0 - 0.00 0.00Institutions
8. Technical & Economic Cooperation 13605 420.00 - 0.00 420.00with other Countries
9. Other General Economic Services 13475 5045.74 1078.10 6.98 6130.82
XI. SOCIAL SERVICES 26893.32 27156.26 2323.40 56372.98
1. General Education 22202 5343.18 6040.31 415.79 11799.28
2. Technical Education 22203 565.00 394.17 72.39 1031.56
3. Sports & Youth Services 22204 231.55 239.12 14.98 485.65
4. Art & Culture 22205 199.85 160.18 19.91 379.94
5. Medical & Public Health 22210 1411.00 3743.20 437.40 5591.60
6. Family Welfare 22211 3860.10 - 0.00 3860.10
7. Water Supply & Sanitation 22215 2167.00 5555.40 581.88 8304.28
8. Housing 22216 3810.60 2412.53 68.53 6291.66
9. Urban Development 22217 1257.97 3932.59 557.84 5748.40
10. Information and Publicity 22220 56.34 141.85 4.43 202.62
11. Broadcasting 22221 699.37 - 0.00 699.37
12. Welfare of SC,ST and 22225 1242.26 2020.17 35.65 3298.08Other Backward Classes
(Rs.crore)
Sl. Head of Development Centre States UTs Total PlanNo. Outlay
Annexure-3.2.2 Contd...

113
13. Labour & Employment 22230 130.80 281.10 13.42 425.32
14. Social Security & Welfare 22235 2966.97 1242.25 55.22 4264.44
15. Nutrition 22236 4.00 895.48 45.86 945.34
16. Secretariat Social Services 22251 7.92 - 0.00 7.92
17. Other Social Services 22250 1.60 97.91 0.11 99.62
18. North Eastern Areas 22552 2937.81 - - 2937.81
XII. GENERAL SERVICES 376.20 3089.06 142.65 3607.91
1. Administration of Justice 32014 87.40 0.00 87.40
2. Currency, Coinage and Mints 32046 8.95 0.00 8.95
3. Other Fiscal Services 32047 0.00 0.00 0.00
4. Secretariat-General Services 32052 4.50 0.00 4.50
5. Police 32055 178.50 0.00 178.50
6. Jails 32056 7.00 49.04 26.10 82.14
7. Supplies and Disposals 32057 0.00 0.00 0.00
8. Stationery & Printing 32058 0.00 64.91 1.76 66.67
9. Public Works 32059 37.35 620.87 56.97 715.19
10. Other Administrative Services 32070 48.70 2354.24 57.82 2460.76
11 Miscellaneous General Services 32075 3.80 - - 3.80
GRAND TOTAL 130181.34 93833.75 4877.76 228892.85
* Break-up not available- No allocation therein
(Rs.crore)
Sl. Head of Development Centre States UTs Total PlanNo. Outlay
Annexure-3.2.2 Contd...
114
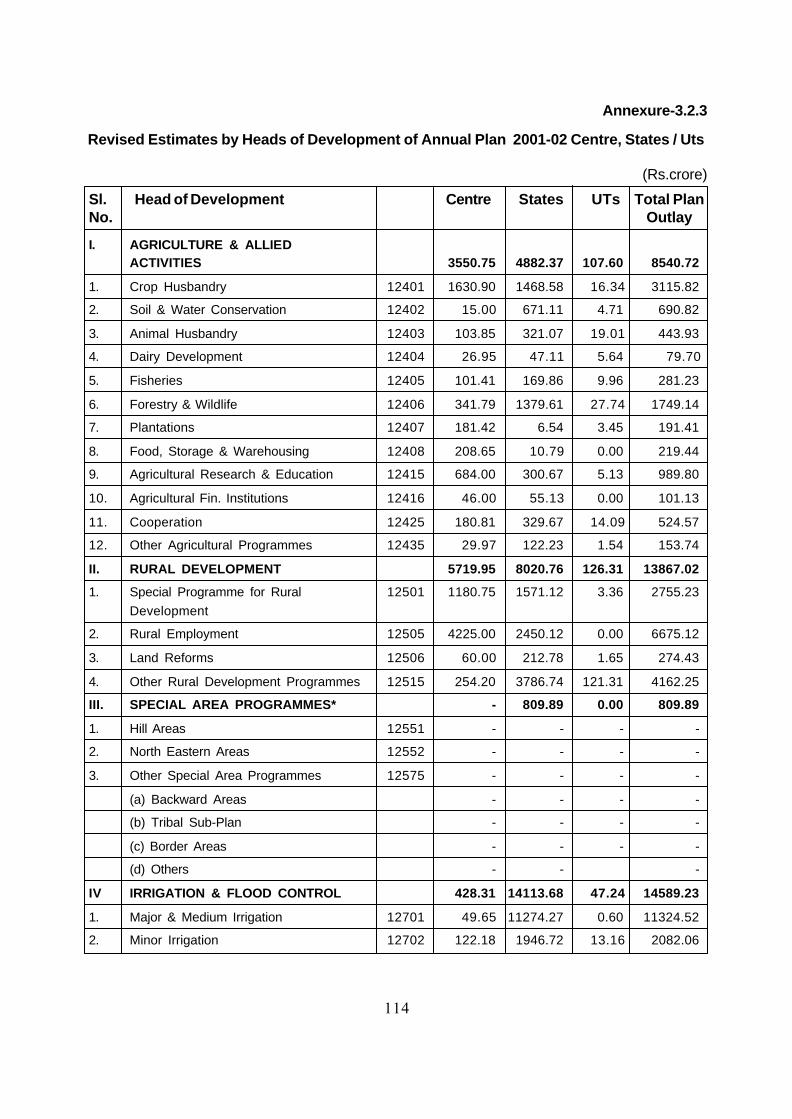
Annexure-3.2.3
Revised Estimates by Heads of Development of Annual Plan 2001-02 Centre, States / Uts
(Rs.crore)
Sl. Head of Development Centre States UTs Total PlanNo. Outlay
I. AGRICULTURE & ALLIEDACTIVITIES 3550.75 4882.37 107.60 8540.72
1. Crop Husbandry 12401 1630.90 1468.58 16.34 3115.82
2. Soil & Water Conservation 12402 15.00 671.11 4.71 690.82
3. Animal Husbandry 12403 103.85 321.07 19.01 443.93
4. Dairy Development 12404 26.95 47.11 5.64 79.70
5. Fisheries 12405 101.41 169.86 9.96 281.23
6. Forestry & Wildlife 12406 341.79 1379.61 27.74 1749.14
7. Plantations 12407 181.42 6.54 3.45 191.41
8. Food, Storage & Warehousing 12408 208.65 10.79 0.00 219.44
9. Agricultural Research & Education 12415 684.00 300.67 5.13 989.80
10. Agricultural Fin. Institutions 12416 46.00 55.13 0.00 101.13
11. Cooperation 12425 180.81 329.67 14.09 524.57
12. Other Agricultural Programmes 12435 29.97 122.23 1.54 153.74
II. RURAL DEVELOPMENT 5719.95 8020.76 126.31 13867.02
1. Special Programme for Rural 12501 1180.75 1571.12 3.36 2755.23
Development
2. Rural Employment 12505 4225.00 2450.12 0.00 6675.12
3. Land Reforms 12506 60.00 212.78 1.65 274.43
4. Other Rural Development Programmes 12515 254.20 3786.74 121.31 4162.25
III. SPECIAL AREA PROGRAMMES* - 809.89 0.00 809.89
1. Hill Areas 12551 - - - -
2. North Eastern Areas 12552 - - - -
3. Other Special Area Programmes 12575 - - - -
(a) Backward Areas - - - -
(b) Tribal Sub-Plan - - - -
(c) Border Areas - - - -
(d) Others - - -
IV IRRIGATION & FLOOD CONTROL 428.31 14113.68 47.24 14589.23
1. Major & Medium Irrigation 12701 49.65 11274.27 0.60 11324.52
2. Minor Irrigation 12702 122.18 1946.72 13.16 2082.06

115
Annexure-3.2.3 Contd...
3. Command Area Development 12705 115.53 232.21 0.18 347.92
4. Flood Control and Drainage 12711 140.95 660.48 33.29 834.72
V. ENERGY 29786.99 12726.17 809.35 43322.51
1. Power 12801 12540.65 12630.46 801.16 25972.27
2. Petroleum 12802 13757.83 - - 13757.83
3. Coal & Lignite 12803 2632.73 - - 2632.73
4. Non Conventional Sources of Energy 12810 855.78 95.71 8.20 959.69
VI. INDUSTRY & MINERALS 7324.35 2147.36 100.57 9572.28
1. Village & Small Industries 12851 1136.26 933.72 67.37 2137.35
2. Iron & Steel Industries 12852 932.76 - - 932.76
3. Non Ferrous Mining & - -
Metallurgical Industries 12853 1446.37 - - 1446.37
4. Cement & Non-metallic - -
Mineral Industries 12854 13.38 - - 13.38
5. Fertilizer Industries 12855 731.66 - - 731.66
6. Petrochemical Industries 12856 349.74 - - 349.74
7. Chemical & Pharmacutical Industries 12857 79.75 - - 79.75
8. Engineering Industries 12858 1062.47 - - 1062.47
9. Telecommunication & Electronic - - - 0.00
Industries 12859 502.41 - - 502.41
10. Consumer Industries 12860 407.90 - - 407.90
1. Atomic Energy Industries 12861 264.82 - - 264.82
12. Other Industries 12875 47.58 1104.33 33.20 1185.11
13. Other Outlays on Industries & Minerals 12885 349.25 109.31 - 458.56
VII. TRANSPORT 30076.98 10454.92 1164.02 41695.92
1. Railways 13002 8578.00 - - 8578.00
2. Ports & Lighthouses 13051 6975.53 19.21 14.25 7008.99
3. Shipping 13052 904.21 0.00 102.38 1006.59
4. Civil Aviation 13053 1485.69 42.61 19.00 1547.30
5. Roads & Bridges 13054 12040.27 8632.97 429.79 21103.03
6. Road Transport 13055 0.00 1561.99 597.77 2159.76
7. Inland Water Transport 13056 73.28 16.82 0.61 90.71
8. Other Transport Services 13075 20.00 181.32 0.23 201.55
(Rs.crore)
Sl. Head of Development Centre States UTs Total PlanNo. Outlay

116
VIII. COMMUNICATION* 18906.45 8.61 0.99 18916.05
1. Postal Services 13201 99.05 - - 99.05
2. Telecommunication Services 13225 17723.00 - - 17723.00
3. Other Communication Services 13275 1084.40 - - 1084.40
IX. SCIENCE, TECHNOLOGY &ENVIORNMENT 3505.54 388.60 13.37 3907.51
1. Atomic Energy Research 13401 417.86 - - 417.86
2. Space Research 13402 1600.00 - - 1600.00
3. Oceanographic Research 13403 120.00 - - 120.00
4. Other Scientific Research 13425 871.86 195.04 5.24 1072.14
5. Ecology & Enviornment 13435 495.82 193.56 8.14 697.52
X. GENERAL ECONOMIC SERVICES 1197.03 2079.97 43.93 3320.93
1. Secretariat Economic Services 13451 214.86 922.03 4.29 1141.18
2. Tourism 13452 151.00 324.41 21.80 497.21
3. Foreign Trade & Export Promotion 13453 283.59 283.59
4. Census, Surveys & Statistics 13454 45.04 26.74 4.53 76.31
5. Meteorology 13455 56.99 56.99
6. Civil Supplies 13456 18.08 65.20 11.21 94.49
7. General Financial & Trading Institutions 13465 0.00 - - 0.00
8. Technical & Economic Cooperation 13605 400.00 - - 400.00with other Countries
9. Other General Economic Services 13475 27.47 741.59 2.10 771.16
XI. SOCIAL SERVICES 27024.82 25461.64 2316.58 54803.04
1. General Education 22202 5022.56 5937.02 410.94 11370.52
2. Technical Education 22203 531.77 349.89 72.45 954.11
3. Sports & Youth Services 22204 244.38 210.83 14.89 470.10
4. Art & Culture 22205 185.37 142.69 19.75 347.81
5. Medical & Public Health 22210 1296.17 3197.41 435.39 4928.97
6. Family Welfare 22211 3446.24 - - 3446.24
7. Water Supply & Sanitation 22215 2097.00 5198.90 583.04 7878.94
8. Housing 22216 5091.00 2365.15 65.76 7521.91
9. Urban Development 22217 2015.15 3630.42 560.07 6205.64
10. Information and Publicity 22220 41.84 135.31 4.43 181.58
11. Broadcasting 22221 637.90 - - 637.90
(Rs.crore)
Sl. Head of Development Centre States UTs Total PlanNo. Outlay
Annexure-3.2.3 Contd...

117
Annexure-3.2.3 Contd...
12. Welfare of SC,ST and Other Backward 22225 1119.44 1921.44 33.68 3074.56Classes
13. Labour & Employment 22230 118.87 252.40 13.03 384.30
14. Social Security & Welfare 22235 2614.54 1157.70 57.19 3829.43
15. Nutrition 22236 3.95 850.75 45.86 900.56
16. Secretariat Social Services 22251 1.50 - - 1.50
17. Other Social Services 22250 6.82 111.73 0.11 118.66
18 North Eastern Areas 22552 2550.32 - - 2550.32
XII. GENERAL SERVICES 334.40 2521.79 147.79 3003.98
1. Administration of Justice 32014 90.40 - - 90.40
2. Currency, Coinage and Mints 32046 8.95 - - 8.95
3. Other Fiscal Services 32047 0.00 - - 0.00
4. Secretariat-General Services 32052 4.50 - - 4.50
5. Police 32055 153.50 - - 153.50
6. Jails 32056 7.00 46.81 26.10 79.91
7. Supplies and Disposals 32057 0.35 - - 0.35
8. Stationery & Printing 32058 0.00 66.13 1.55 67.68
9. Public Works 32059 37.35 513.04 61.70 612.09
10. Other Administrative Services 32070 30.47 1895.81 58.44 1984.72
11 Miscellaneous General Services 32075 1.88 - - 1.88
GRAND TOTAL 127855.57 83615.76 4877.76 216349.09
* Break-up not available- No allocation therein
(Rs.crore)
Sl. Head of Development Centre States UTs Total PlanNo. Outlay

118
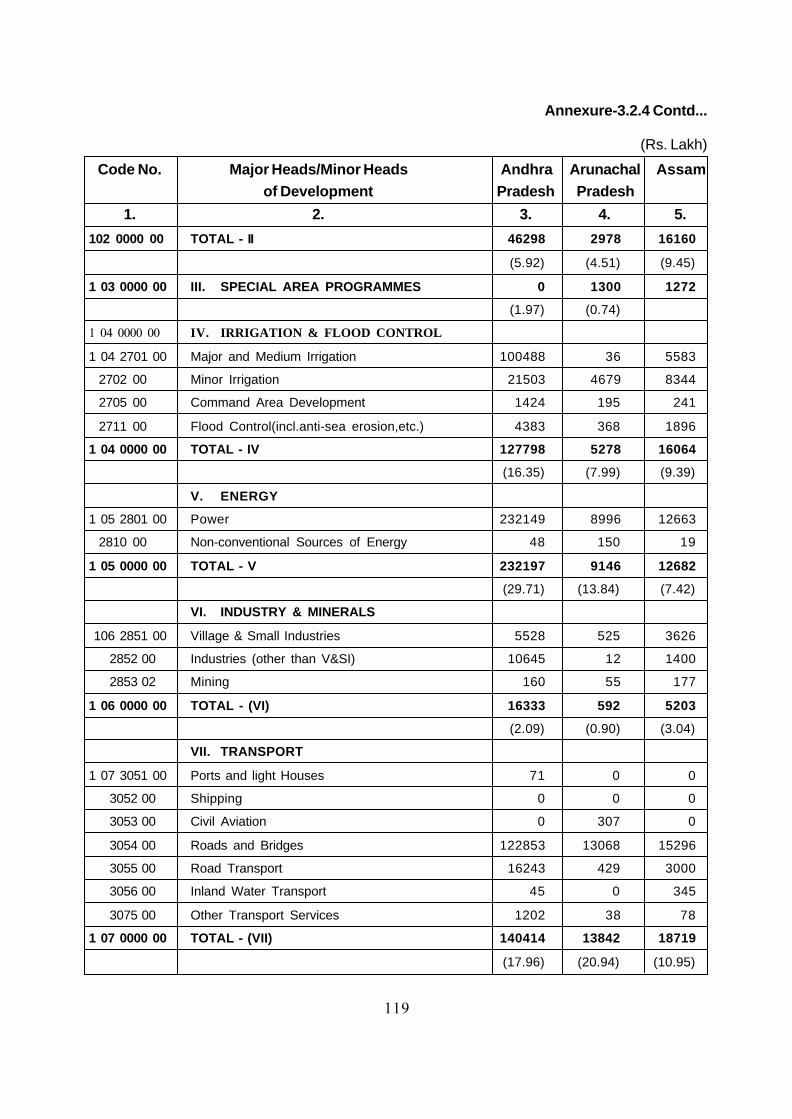
Annexure 3.2.4
ANNUAL PLAN - 2001-02 - REVISED OUTLAY - STATES/Uts
(Rs. Lakh)
Code No. Major Heads/Minor Heads Andhra Arunachal Assamof Development Pradesh Pradesh
1. 2. 3. 4. 5.
I. AGRICULTURE & ALLIED ACTIVITIES
1 01 24 0100 Crop Husbandry 2879 1667 5817
2402 00 Soil and Water Conservation 105 612 350
2403 00 Animal Husbandry 581 617 2139
2404 00 Dairy Development 0 11 300
2405 00 Fisheries 214 244 1465
2406 00 Forestry & Wild Life 9211 1580 3589
2407 00 Plantations 0 0 12
2408 00 Food,Storage & Warehousing 0 0 10
2415 00 Agricultural Research & Education 300 50 2020
2416 00 Agricultural Financial Institutions 915 0 0
2435 00 Other Agricultural Programmes :
(a) Marketing & Quality Control 0 238 116
(b) Others 0 0 0
2425 00 Cooperation 59 302 869
1 01 0000 00 Total - (I) 14264 5321 16687
(1.82) (8.05) (9.76)
II. RURAL DEVELOPMENT
1 02 2501 00 Special Programmes for Rural Development :
2501 01 (a) Integrated Rural Development
Programme(IRDP) & Allied Programmes 21038 55 2890
2501 02 (b) Drought Prone Area Programme (DPAP) 32 0 0
2501 04 (c) Integrated Rural Energy Programme (IREP) 0 83 1
1 02 2505 00 RURAL EMPLOYMENT
2505 01 (a) NREP/Jawahar Rozgar Yojna (JRY) 9591 271 110
2505 60 (b) Other Programmes(like Employment
Guarantee Scheme etc.) 0 380 1042
1 02 2506 00 Land Reforms 417 178 364
2515 00 Other Rural Development Programmes
(Incl.Community Development and Panchayats) 15220 2011 11753
119
Annexure-3.2.4 Contd...
102 0000 00 TOTAL - II 46298 2978 16160
(5.92) (4.51) (9.45)
1 03 0000 00 III. SPECIAL AREA PROGRAMMES 0 1300 1272
(1.97) (0.74)
1 04 0000 00 IV. IRRIGATION & FLOOD CONTROL
1 04 2701 00 Major and Medium Irrigation 100488 36 5583
2702 00 Minor Irrigation 21503 4679 8344
2705 00 Command Area Development 1424 195 241
2711 00 Flood Control(incl.anti-sea erosion,etc.) 4383 368 1896
1 04 0000 00 TOTAL - IV 127798 5278 16064
(16.35) (7.99) (9.39)
V. ENERGY
1 05 2801 00 Power 232149 8996 12663
2810 00 Non-conventional Sources of Energy 48 150 19
1 05 0000 00 TOTAL - V 232197 9146 12682
(29.71) (13.84) (7.42)
VI. INDUSTRY & MINERALS
106 2851 00 Village & Small Industries 5528 525 3626
2852 00 Industries (other than V&SI) 10645 12 1400
2853 02 Mining 160 55 177
1 06 0000 00 TOTAL - (VI) 16333 592 5203
(2.09) (0.90) (3.04)
VII. TRANSPORT
1 07 3051 00 Ports and light Houses 71 0 0
3052 00 Shipping 0 0 0
3053 00 Civil Aviation 0 307 0
3054 00 Roads and Bridges 122853 13068 15296
3055 00 Road Transport 16243 429 3000
3056 00 Inland Water Transport 45 0 345
3075 00 Other Transport Services 1202 38 78
1 07 0000 00 TOTAL - (VII) 140414 13842 18719
(17.96) (20.94) (10.95)
(Rs. Lakh)
Code No. Major Heads/Minor Heads Andhra Arunachal Assamof Development Pradesh Pradesh
1. 2. 3. 4. 5.

120
Annexure-3.2.4 Contd...
1 08 0000 00 VIII. COMMUNICATIONS 0 0 0
IX. SCIENCE,TECHNOLOGY &
ENVIRONMENT
1 09 3425 00 Scientific Research (incl. S&T) 97 124 163
3435 00 Ecology & Environment 45 9 10
TOTAL - (IX) 142 133 173
(0.02) (0.20) (0.10)
X. GENERAL ECONOMIC SERVICES
1 10 3451 00 Secretariat Economic Services 31552 172 707
3452 00 Tourism 2689 223 967
3454 00 Surveys & Statistics 137 105 295
3456 00 Civil Supplies 3030 87 80
3475 00 Other General Economic Services :
i) Distt. Plg./Distt. Councils 0 1574 2760
ii) Weights & Measures 0 32 70
iii) Others 26 1223 168
1 10 0000 00 TOTAL - (X) 37434 3416 5047
(4.79) (5.17) (2.95)
XI. SOCIAL SERVICES EDUCATION
2 21 2202 00 General Education 24100 10057 46587
2203 00 Technical Education 773 0 1095
2204 00 Sports & Youth Services 5430 215 267
2205 00 Art & Culture 1041 352 746
2 21 0000 00 Sub-Total (Education) 31344 10624 48695
2 22 2210 00 Medical & Public Health 33223 2486 12580
2 23 2215 00 Water Supply & Sanitation 18264 3005 6754
2 23 2216 00 Housing (incl. police Housing) 13751 1916 336
2 23 2217 00 Urban Development (incl.state capital projects) 17701 2083 1119
2 24 2220 00 Information & Publicity 1586 129 278
2 25 2225 00 Welfare of SCs,STs & OBCs 29152 0 2529
2 26 2230 00 Labour & Employment
i) Labour & Labour Welfare 888 42 869
ii) Special Employment Programmes 0 94 2000
(Rs. Lakh)
Code No. Major Heads/Minor Heads Andhra Arunachal Assamof Development Pradesh Pradesh
1. 2. 3. 4. 5.

121
2 27 2235 00 Social Welfare 4227 183 310
2 27 2236 00 Nutrition 7560 1146 3017
2 28 2252 00 Other Social Services 0 61 0
2 00 0000 00 TOTAL - (XI) 157696 21769 78487
(20.17) (32.94) (45.90)
XII. GENERAL SERVICES
3 42 2056 00 Jails 0 0 110
2058 00 Stationery & Printing 0 83 40
2059 00 Public Works 305 1698 266
2070 00 Other Administrative Services :
i) Training 0 23 0
ii) Others 8767 512 90
3 00 0000 00 TOTAL - (XII) 9072 2316 506
(1.16) (3.50) (0.30)
9 99 9999 99 GRAND TOTAL 781648 66091 171000
(100) (100) (100)
(Rs. Lakh)
Code No. Major Heads/Minor Heads Andhra Arunachal Assamof Development Pradesh Pradesh
1. 2. 3. 4. 5.
Annexure-3.2.4 Contd...

122
Annexure 3.2.4 Contd...
ANNUAL PLAN - 2001-02 - REVISED OUTLAY - STATES/Uts
(Rs. Lakh)
Code No. Major Heads/Minor Heads Bihar Chattisgarh Goaof Development
* * *
1. 2. 6. 7. 8.
I. AGRICULTURE & ALLIED ACTIVITIES
1 01 24 0100 Crop Husbandry 2050 3445 375
2402 00 Soil and Water Conservation 30 216 94
2403 00 Animal Husbandry 403 1083 325
2404 00 Dairy Development 77 0 60
2405 00 Fisheries 240 243 170
2406 00 Forestry & Wild Life 235 3794 443
2407 00 Plantations 0 0 0
2408 00 Food,Storage & Warehousing 0 0 4
2415 00 Agricultural Research & Education 615 2685 19
2416 00 Agricultural Financial Institutions 238 0 0
2435 00 Other Agricultural Programmes :
(a) Marketing & Quality Control 0 0 4
(b) Others 0 0 0
2425 00 Cooperation 1640 1070 352
1 01 0000 00 Total - (I) 5528 12536 1846
(2.09) (9.55) (4.01)
II. RURAL DEVELOPMENT
1 02 2501 00 Special Programmes for Rural Development :
2501 01 (a) Integrated Rural Development 3957 757 30Programme(IRDP) & Allied Programmes
2501 02 (b) Drought Prone Area Programme (DPAP) 115 370 0
2501 04 (c) Integrated Rural Energy Programme (IREP) 0 0 18
1 02 2505 00 RURAL EMPLOYMENT
2505 01 (a) NREP/Jawahar Rozgar Yojna (JRY) 7650 1400 49
2505 60 (b) Other Programmes(like Employment 14700 1101 50Guarantee Scheme etc.)
1 02 2506 00 Land Reforms 1712 258 63
2515 00 Other Rural Development Programmes 62738 18617 339(Incl.Community Development and Panchayats)
102 0000 00 TOTAL - II 90872 22503 549
(34.37) (17.15) (1.19)

123
Annexure-3.2.4 Contd...
1 03 0000 00 III. SPECIAL AREA PROGRAMMES 0 0 321
(0.70)
1 04 0000 00 IV. IRRIGATION & FLOOD CONTROL
1 04 2701 00 Major and Medium Irrigation 47300 24097 8262
2702 00 Minor Irrigation 13964 269 1073
2705 00 Command Area Development 2100 102 305
2711 00 Flood Control(incl.anti-sea erosion,etc.) 6348 17 165
1 04 0000 00 TOTAL - IV 69712 24485 9805
(26.37) (18.66) (21.32)
V. ENERGY
1 05 2801 00 Power 6058 857 3300
2810 00 Non-conventional Sources of Energy 321 50 22
1 05 0000 00 TOTAL - V 6379 907 3322
(2.41) (0.69) (7.22)
VI. INDUSTRY & MINERALS
106 2851 00 Village & Small Industries 1074 97 1077
2852 00 Industries (other than V&SI) 722 1774 1001
2853 02 Mining 43 490 29
1 06 0000 00 TOTAL - (VI) 1839 2361 2107
(0.70) (1.80) (4.58)
VII. TRANSPORT
1 07 3051 00 Ports and light Houses 0 0 5
3052 00 Shipping 0 0 0
3053 00 Civil Aviation 263 8 0
3054 00 Roads and Bridges 31599 4535 3728
3055 00 Road Transport 349 0 247
3056 00 Inland Water Transport 0 0 219
3075 00 Other Transport Services 0 0 100
1 07 0000 00 TOTAL - (VII) 32211 4543 4299
(12.18) (3.46) (9.35)
1 08 0000 00 VIII.COMMUNICATIONS 0 0 0
IX. SCIENCE,TECHNOLOGY &
ENVIRONMENT
(Rs. Lakh)
Code No. Major Heads/Minor Heads Bihar Chattisgarh Goaof Development
* * *
1. 2. 6. 7. 8.
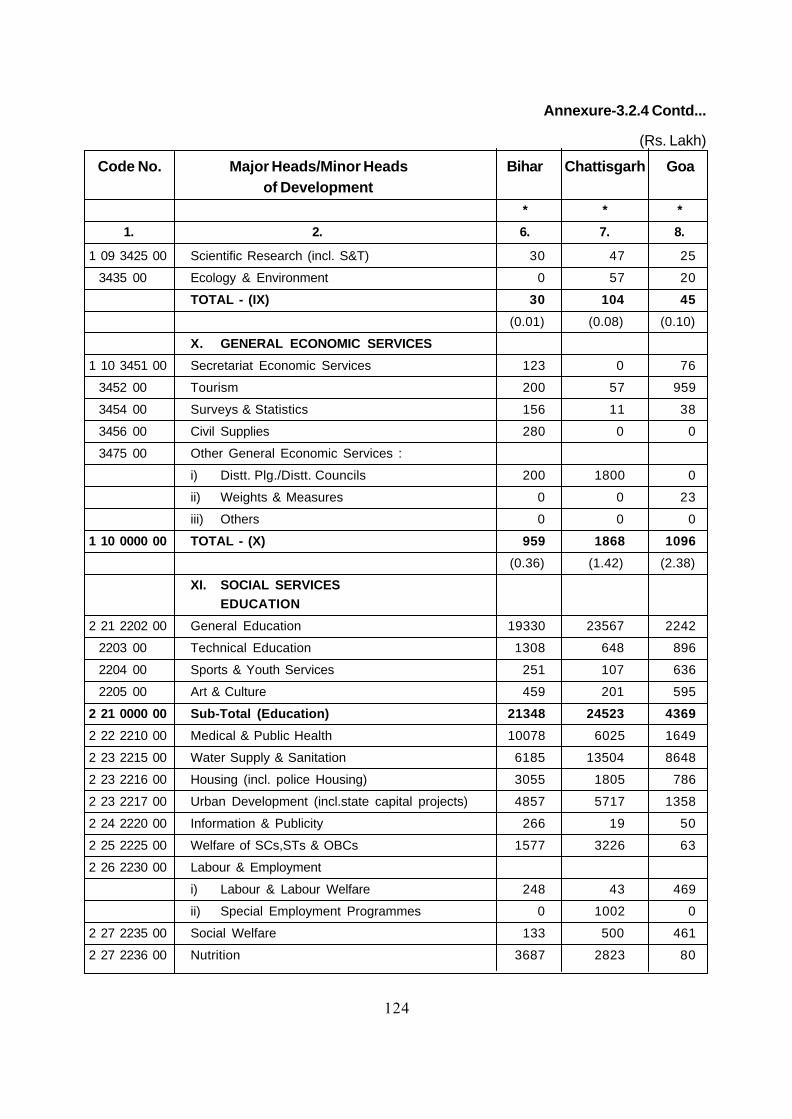
124
Annexure-3.2.4 Contd...
(Rs. Lakh)
Code No. Major Heads/Minor Heads Bihar Chattisgarh Goaof Development
* * *
1. 2. 6. 7. 8.
1 09 3425 00 Scientific Research (incl. S&T) 30 47 25
3435 00 Ecology & Environment 0 57 20
TOTAL - (IX) 30 104 45
(0.01) (0.08) (0.10)
X. GENERAL ECONOMIC SERVICES
1 10 3451 00 Secretariat Economic Services 123 0 76
3452 00 Tourism 200 57 959
3454 00 Surveys & Statistics 156 11 38
3456 00 Civil Supplies 280 0 0
3475 00 Other General Economic Services :
i) Distt. Plg./Distt. Councils 200 1800 0
ii) Weights & Measures 0 0 23
iii) Others 0 0 0
1 10 0000 00 TOTAL - (X) 959 1868 1096
(0.36) (1.42) (2.38)
XI. SOCIAL SERVICESEDUCATION
2 21 2202 00 General Education 19330 23567 2242
2203 00 Technical Education 1308 648 896
2204 00 Sports & Youth Services 251 107 636
2205 00 Art & Culture 459 201 595
2 21 0000 00 Sub-Total (Education) 21348 24523 4369
2 22 2210 00 Medical & Public Health 10078 6025 1649
2 23 2215 00 Water Supply & Sanitation 6185 13504 8648
2 23 2216 00 Housing (incl. police Housing) 3055 1805 786
2 23 2217 00 Urban Development (incl.state capital projects) 4857 5717 1358
2 24 2220 00 Information & Publicity 266 19 50
2 25 2225 00 Welfare of SCs,STs & OBCs 1577 3226 63
2 26 2230 00 Labour & Employment
i) Labour & Labour Welfare 248 43 469
ii) Special Employment Programmes 0 1002 0
2 27 2235 00 Social Welfare 133 500 461
2 27 2236 00 Nutrition 3687 2823 80

125
(Rs. Lakh)
Code No. Major Heads/Minor Heads Bihar Chattisgarh Goaof Development
* * *
1. 2. 6. 7. 8.
2 28 2252 00 Other Social Services 0 111 0
2 00 0000 00 TOTAL - (XI) 51434 59298 17933
(19.45) (45.20) (38.98)
XII. GENERAL SERVICES
3 42 2056 00 Jails 643 42 55
2058 00 Stationery & Printing 0 51 25
2059 00 Public Works 1800 2439 1910
2070 00 Other Administrative Services :
i) Training 0 0 0
ii) Others 2993 63 2687
3 00 0000 00 TOTAL - (XII) 5436 2595 4677
(2.06) (1.98) (10.17)
9 99 9999 99 GRAND TOTAL 264400 131200 46000
(100) (100) (100)
Annexure-3.2.4 Contd...

126
Annexure 3.2.4 Contd...
ANNUAL PLAN - 2001-02 - REVISED OUTLAY - STATES/Uts
(Rs. Lakh)
Code No. Major Heads/Minor Heads Gujarat Haryana Himachaof Development Pradesh
1. 2. 9. 10. 11.
I. AGRICULTURE & ALLIED ACTIVITIES
1 01 24 0100 Crop Husbandry 35026 722 4394
2402 00 Soil and Water Conservation 3130 3042 2107
2403 00 Animal Husbandry 1739 1604 2273
2404 00 Dairy Development 91 70 316
2405 00 Fisheries 1073 394 213
2406 00 Forestry & Wild Life 15025 3180 7250
2407 00 Plantations 0 0 0
2408 00 Food,Storage & Warehousing 74 35 0
2415 00 Agricultural Research & Education 1699 919 3129
2416 00 Agricultural Financial Institutions 447 0 0
2435 00 Other Agricultural Programmes :
(a) Marketing & Quality Control 0 0 768
(b) Others 0 0 0
2425 00 Cooperation 1610 1100 308
1 01 0000 00 Total - (I) 59914 11066 20758
(9.22) (6.10) (11.90)
II. RURAL DEVELOPMENT
1 02 2501 00 Special Programmes for Rural Development :
2501 01 (a) Integrated Rural Development
Programme(IRDP) & Allied Programmes 925 525 526
2501 02 (b) Drought Prone Area Programme (DPAP) 1503 194 0
2501 04 (c) Integrated Rural Energy Programme (IREP) 0 120 0
1 02 2505 00 RURAL EMPLOYMENT
2505 01 (a) NREP/Jawahar Rozgar Yojna (JRY) 1334 2593 1218
2505 60 (b) Other Programmes(like Employment 11597 0 0Guarantee Scheme etc.)
1 02 2506 00 Land Reforms 715 115 2054
2515 00 Other Rural Development Programmes 10645 10482 3216(Incl.Community Development and Panchayats)
102 0000 00 TOTAL - II 26719 14029 7014
(4.11) (7.73) (4.02)

127
1 03 0000 00 III. SPECIAL AREA PROGRAMMES 0 2750 1931
(1.52) (1.11)
1 04 0000 00 IV. IRRIGATION & FLOOD CONTROL
1 04 2701 00 Major and Medium Irrigation 114325 21151 1180
2702 00 Minor Irrigation 16934 7400 5003
2705 00 Command Area Development 537 1000 135
2711 00 Flood Control(incl.anti-sea erosion,etc.) 268 2000 660
1 04 0000 00 TOTAL - IV 132064 31551 6978
(20.32) (17.39) (4.00)
V. ENERGY
1 05 2801 00 Power 70242 3585 19832
2810 00 Non-conventional Sources of Energy 983 100 266
1 05 0000 00 TOTAL - V 71225 3685 20098
(10.96) (2.03) (11.52)
VI. INDUSTRY & MINERALS
106 2851 00 Village & Small Industries 6484 9030 1185
2852 00 Industries (other than V&SI) 26338 1140 216
2853 02 Mining 715 10 78
1 06 0000 00 TOTAL - (VI) 33537 10180 1479
(5.16) (5.61) (0.85)
VII. TRANSPORT
1 07 3051 00 Ports and light Houses 0 0 0
3052 00 Shipping 0 0 0
3053 00 Civil Aviation 537 10 109
3054 00 Roads and Bridges 36024 19000 24250
3055 00 Road Transport 1789 5000 1580
3056 00 Inland Water Transport 0 0 1
3075 00 Other Transport Services 0 0 0
1 07 0000 00 TOTAL - (VII) 38350 24010 25940
(5.90) (13.23) (14.87)
1 08 0000 00 VIII. COMMUNICATIONS 845 0 12
(0.13) (0.01)
IX. SCIENCE,TECHNOLOGY &ENVIRONMENT
1 09 3425 00 Scientific Research (incl. S&T) 5814 116 0
(Rs. Lakh)
Code No. Major Heads/Minor Heads Gujarat Haryana Himachaof Development Pradesh
1. 2. 9. 10. 11.
Annexure-3.2.4 Contd...

128
Annexure-3.2.4 Contd...
3435 00 Ecology & Environment 447 50 111
TOTAL - (IX) 6261 166 111
(0.96) (0.09) (0.06)
X. GENERAL ECONOMIC SERVICES
1 10 3451 00 Secretariat Economic Services 39 27 995
3452 00 Tourism 1520 370 450
3454 00 Surveys & Statistics 107 94 60
3456 00 Civil Supplies 268 0 160
3475 00 Other General Economic Services :
i) Distt. Plg./Distt. Councils 13362 1000 18
ii) Weights & Measures 89 25 1580
iii) Others 0 0 111
1 10 0000 00 TOTAL - (X) 15385 1516 3374
(2.37) (0.84) (1.93)
XI. SOCIAL SERVICES
EDUCATION
2 21 2202 00 General Education 41346 15900 45400
2203 00 Technical Education 3390 2300 712
2204 00 Sports & Youth Services 288 1141 370
2205 00 Art & Culture 1273 650 339
2 21 0000 00 Sub-Total (Education) 46297 19991 46821
2 22 2210 00 Medical & Public Health 18781 5845 12050
2 23 2215 00 Water Supply & Sanitation 62594 10017 13027
2 23 2216 00 Housing (incl. police Housing) 42609 3000 5883
2 23 2217 00 Urban Development (incl.state capital projects) 44512 2652 2980
2 24 2220 00 Information & Publicity 894 200 498
2 25 2225 00 Welfare of SCs,STs & OBCs 27098 1400 335
2 26 2230 00 Labour & Employment
i) Labour & Labour Welfare 4919 2092 154
ii) Special Employment Programmes 0 0 0
2 27 2235 00 Social Welfare 4785 32027 2316
2 27 2236 00 Nutrition 11850 450 980
2 28 2252 00 Other Social Services 0 10 0
2 00 0000 00 TOTAL - (XI) 264339 77684 85044
(40.67) (42.82) (48.75)
(Rs. Lakh)
Code No. Major Heads/Minor Heads Gujarat Haryana Himachaof Development Pradesh
1. 2. 9. 10. 11.
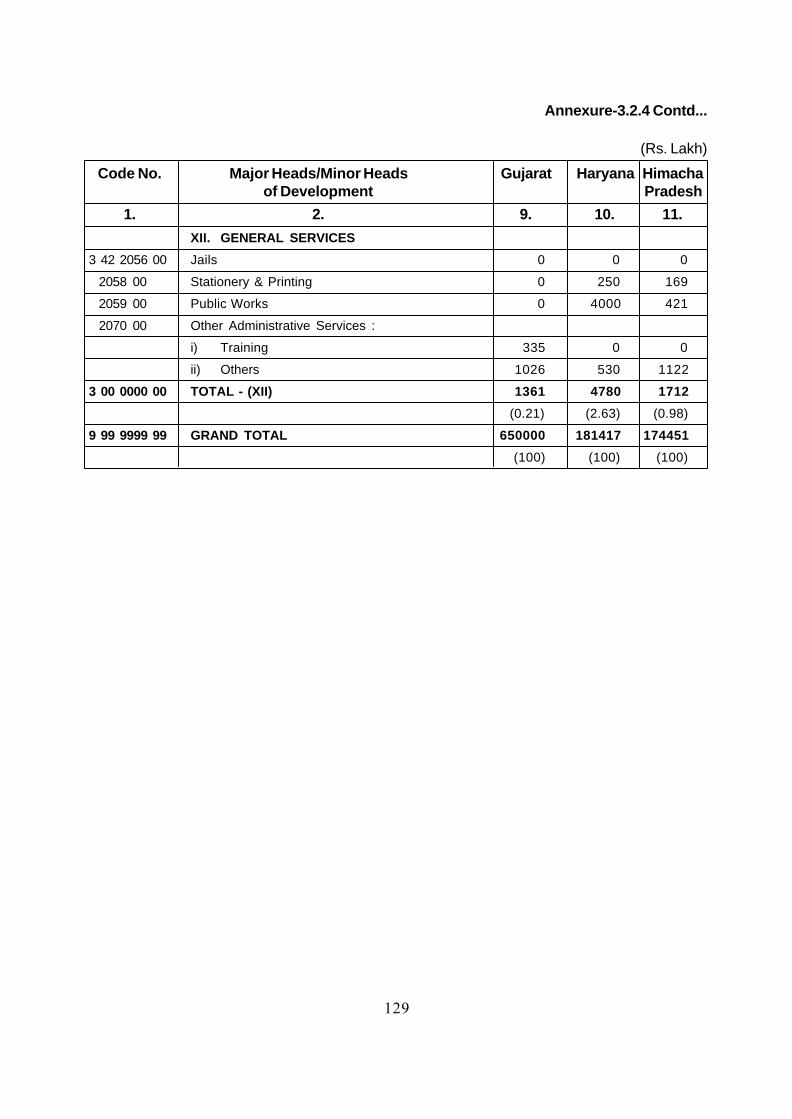
129
XII. GENERAL SERVICES
3 42 2056 00 Jails 0 0 0
2058 00 Stationery & Printing 0 250 169
2059 00 Public Works 0 4000 421
2070 00 Other Administrative Services :
i) Training 335 0 0
ii) Others 1026 530 1122
3 00 0000 00 TOTAL - (XII) 1361 4780 1712
(0.21) (2.63) (0.98)
9 99 9999 99 GRAND TOTAL 650000 181417 174451
(100) (100) (100)
(Rs. Lakh)
Code No. Major Heads/Minor Heads Gujarat Haryana Himachaof Development Pradesh
1. 2. 9. 10. 11.
Annexure-3.2.4 Contd...
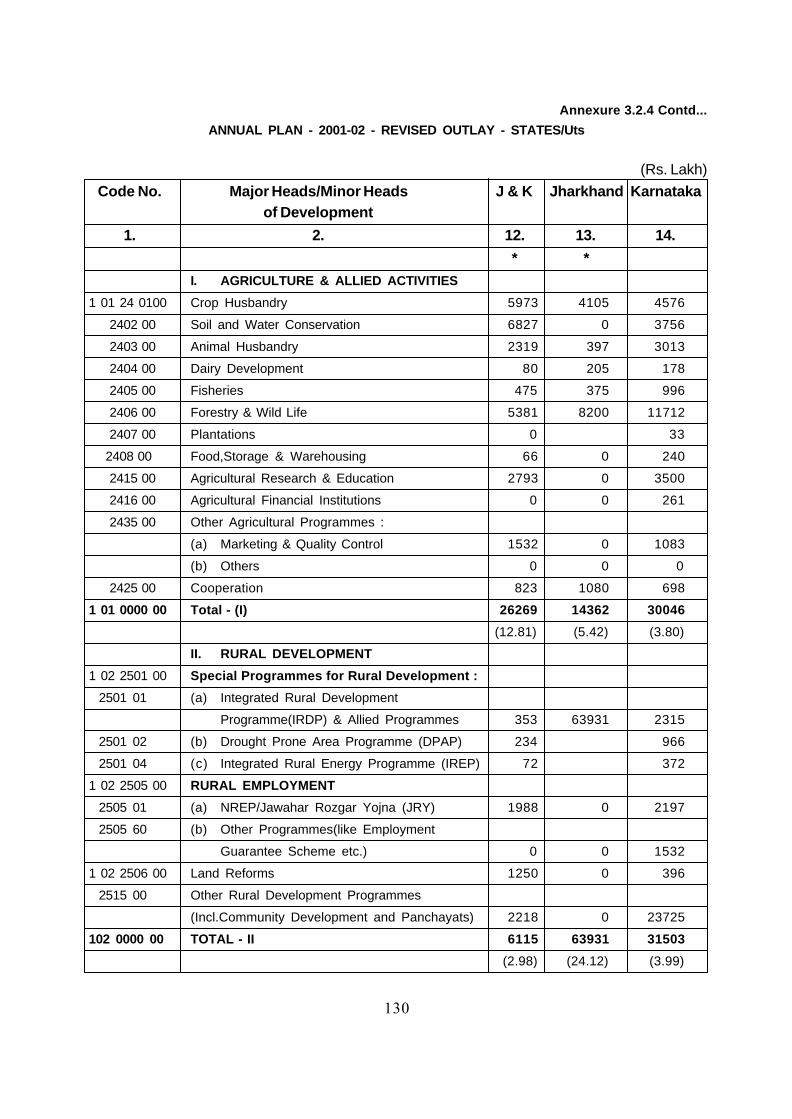
130
Annexure 3.2.4 Contd...
ANNUAL PLAN - 2001-02 - REVISED OUTLAY - STATES/Uts
(Rs. Lakh)
Code No. Major Heads/Minor Heads J & K Jharkhand Karnatakaof Development
1. 2. 12. 13. 14.
* *I. AGRICULTURE & ALLIED ACTIVITIES
1 01 24 0100 Crop Husbandry 5973 4105 4576
2402 00 Soil and Water Conservation 6827 0 3756
2403 00 Animal Husbandry 2319 397 3013
2404 00 Dairy Development 80 205 178
2405 00 Fisheries 475 375 996
2406 00 Forestry & Wild Life 5381 8200 11712
2407 00 Plantations 0 33
2408 00 Food,Storage & Warehousing 66 0 240
2415 00 Agricultural Research & Education 2793 0 3500
2416 00 Agricultural Financial Institutions 0 0 261
2435 00 Other Agricultural Programmes :
(a) Marketing & Quality Control 1532 0 1083
(b) Others 0 0 0
2425 00 Cooperation 823 1080 698
1 01 0000 00 Total - (I) 26269 14362 30046
(12.81) (5.42) (3.80)
II. RURAL DEVELOPMENT
1 02 2501 00 Special Programmes for Rural Development :
2501 01 (a) Integrated Rural Development
Programme(IRDP) & Allied Programmes 353 63931 2315
2501 02 (b) Drought Prone Area Programme (DPAP) 234 966
2501 04 (c) Integrated Rural Energy Programme (IREP) 72 372
1 02 2505 00 RURAL EMPLOYMENT
2505 01 (a) NREP/Jawahar Rozgar Yojna (JRY) 1988 0 2197
2505 60 (b) Other Programmes(like Employment
Guarantee Scheme etc.) 0 0 1532
1 02 2506 00 Land Reforms 1250 0 396
2515 00 Other Rural Development Programmes
(Incl.Community Development and Panchayats) 2218 0 23725
102 0000 00 TOTAL - II 6115 63931 31503
(2.98) (24.12) (3.99)

131
(Rs. Lakh)Code No. Major Heads/Minor Heads J & K Jharkhand Karnataka
of Development
1. 2. 12. 13. 14.
* *
1 03 0000 00 III. SPECIAL AREA PROGRAMMES 9842 0 3450
(4.80) (0.44)
1 04 0000 00 IV. IRRIGATION & FLOOD CONTROL
1 04 2701 00 Major and Medium Irrigation 7164 28860 229621
2702 00 Minor Irrigation 4841 6114 8305
2705 00 Command Area Development 559 0 1380
2711 00 Flood Control(incl.anti-sea erosion,etc.) 2855 0 599
1 04 0000 00 TOTAL - IV 15419 34974 239905
(7.52) (13.20) (30.35)
V. ENERGY
1 05 2801 00 Power 34042 15000 76805
2810 00 Non-conventional Sources of Energy 84 0 910
1 05 0000 00 TOTAL - V 34126 15000 77715
(16.65) (5.66) (9.83)
VI. INDUSTRY & MINERALS
106 2851 00 Village & Small Industries 4339 11014 16761
2852 00 Industries (other than V&SI) 1740 0 2704
2853 02 Mining 351 475 353
1 06 0000 00 TOTAL - (VI) 6430 11489 19818
(3.14) (4.34) (2.51)
VII. TRANSPORT
1 07 3051 00 Ports and light Houses 0 0 800
3052 00 Shipping 0 0 0
3053 00 Civil Aviation 0 500 0
3054 00 Roads and Bridges 26342 19000 51107
3055 00 Road Transport 403 0 19513
3056 00 Inland Water Transport 192 0 0
3075 00 Other Transport Services 1085 100 22
1 07 0000 00 TOTAL - (VII) 28022 19600 71442
(13.67) (7.40) (9.04)
1 08 0000 00 VIII. COMMUNICATIONS 0 0 0
IX. SCIENCE,TECHNOLOGY &ENVIRONMENT
1 09 3425 00 Scientific Research (incl. S&T) 614 6000 150
Annexure-3.2.4 Contd...

132
Annexure-3.2.4 Contd...
(Rs. Lakh)
Code No. Major Heads/Minor Heads J & K Jharkhand Karnatakaof Development
1. 2. 12. 13. 14.
* *
3435 00 Ecology & Environment 0 0 251
TOTAL - (IX) 614 6000 401
(0.30) (2.26) (0.05)
X. GENERAL ECONOMIC SERVICES
1 10 3451 00 Secretariat Economic Services 4276 3883 3841
3452 00 Tourism 3560 1576 840
3454 00 Surveys & Statistics 121 0 116
3456 00 Civil Supplies 0 860 0
3475 00 Other General Economic Services :
i) Distt. Plg./Distt. Councils 7565 0 0
ii) Weights & Measures 43 0 30
iii) Others 0 0 21994
1 10 0000 00 TOTAL - (X) 15565 6319 26821
(7.59) (2.38) (3.39)
XI. SOCIAL SERVICES EDUCATION
2 21 2202 00 General Education 19164 12903 46716
2203 00 Technical Education 1857 1247
2204 00 Sports & Youth Services 825 675 708
2205 00 Art & Culture 200 952
2 21 0000 00 Sub-Total (Education) 22046 13578 49623
2 22 2210 00 Medical & Public Health 11628 11250 25638
2 23 2215 00 Water Supply & Sanitation 13125 9000 75741
2 23 2216 00 Housing (incl. police Housing) 270 0 59308
2 23 2217 00 Urban Development (incl.state capital projects) 5340 21510 29719
2 24 2220 00 Information & Publicity 98 100 514
2 25 2225 00 Welfare of SCs,STs & OBCs 525 0 32005
2 26 2230 00 Labour & Employment
i) Labour & Labour Welfare 1045 341 1815
ii) Special Employment Programmes 0 0 0
2 27 2235 00 Social Welfare 1698 22473 5127
2 27 2236 00 Nutrition 1000 0 5181
2 28 2252 00 Other Social Services 0 0 872
2 00 0000 00 TOTAL - (XI) 56775 78252 285543
(27.70) (29.53) (36.13)

133
(Rs. Lakh)
Code No. Major Heads/Minor Heads J & K Jharkhand Karnatakaof Development
1. 2. 12. 13. 14.
* *
XII. GENERAL SERVICES
3 42 2056 00 Jails 0 1000 33
2058 00 Stationery & Printing 69 0 203
2059 00 Public Works 1336 4231 2786
2070 00 Other Administrative Services :
i) Training 0 0 17
ii) Others 4418 9842 696
3 00 0000 00 TOTAL - (XII) 5823 15073 3735
(2.84) (5.69) (0.47)
9 99 9999 99 GRAND TOTAL 205000 265000 790379
(100) (100) (100)
Annexure-3.2.4 Contd...

134
Annexure 3.2.4 Contd...
ANNUAL PLAN - 2001-02 - REVISED OUTLAY - STATES/Uts
(Rs. Lakh)
Code No. Major Heads/Minor Heads Kerala Madhya Mahara-of Development Pradesh shtra
1. 2. 15. 16. 17.
*I. AGRICULTURE & ALLIED ACTIVITIES
01 24 0100 Crop Husbandry 3600 12871 6836
2402 00 Soil and Water Conservation 300 921 6902
2403 00 Animal Husbandry 2000 2730 1604
2404 00 Dairy Development 250 0 445
2405 00 Fisheries 1500 486 827
2406 00 Forestry & Wild Life 4200 7401 4128
2407 00 Plantations 0 0 0
2408 00 Food,Storage & Warehousing 25 92 0
2415 00 Agricultural Research & Education 1800 1316 968
2416 00 Agricultural Financial Institutions 500 0 1
2435 00 Other Agricultural Programmes :
(a) Marketing & Quality Control 500 0 0
(b) Others 0 0 0
2425 00 Cooperation 850 5333 10740
1 01 0000 00 Total - (I) 15525 31150 32451
(6.87) (7.91) (3.00)
II. RURAL DEVELOPMENT
1 02 2501 00 Special Programmes for Rural Development :
2501 01 (a) Integrated Rural Development
Programme(IRDP) & Allied Programmes 625 6413 3288
2501 02 (b) Drought Prone Area Programme (DPAP) 0 0 3000
2501 04 (c) Integrated Rural Energy Programme (IREP) 0 0 75
1 02 2505 00 RURAL EMPLOYMENT
2505 01 (a) NREP/Jawahar Rozgar Yojna (JRY) 1325 13344 20717
2505 60 (b) Other Programmes(like Employment
Guarantee Scheme etc.) 0 0 57410
1 02 2506 00 Land Reforms 90 635 208
2515 00 Other Rural Development Programmes
(Incl.Community Development and Panchayats) 4750 26849 27850
102 0000 00 TOTAL - II 6790 47241 112548
(3.00) (12.00) (10.39)

135
Annexure-3.2.4 Contd...
1 03 0000 00 III. SPECIAL AREA PROGRAMMES 1313 0 4093
(0.58) (0.38)
1 04 0000 00 IV. IRRIGATION & FLOOD CONTROL
1 04 2701 00 Major and Medium Irrigation 9500 55139 233521
2702 00 Minor Irrigation 2500 18755 26205
2705 00 Command Area Development 1000 704 2291
2711 00 Flood Control(incl.anti-sea erosion,etc.) 1250 230 73
1 04 0000 00 TOTAL - IV 14250 74828 262090
(6.31) (19.00) (24.19)
V. ENERGY
1 05 2801 00 Power 41000 32691 147883
2810 00 Non-conventional Sources of Energy 1000 418 253
1 05 0000 00 TOTAL - V 42000 33109 148136
(18.58) (8.41) (13.67)
VI. INDUSTRY & MINERALS
106 2851 00 Village & Small Industries 4000 2620 6930
2852 00 Industries (other than V&SI) 9225 2045 2203
2853 02 Mining 75 313 0
1 06 0000 00 TOTAL - (VI) 13300 4978 9133
VII. TRANSPORT
1 07 3051 00 Ports and light Houses 300 0 548
3052 00 Shipping 0 0 0
3053 00 Civil Aviation 0 820 0
3054 00 Roads and Bridges 11500 25898 153092
3055 00 Road Transport 750 0 72003
3056 00 Inland Water Transport 500 0 212
3075 00 Other Transport Services 750 0 362
1 07 0000 00 TOTAL - (VII) 13800 26718 226217
(6.11) (6.79) (20.88)
1 08 0000 00 VIII. COMMUNICATIONS 0 0 0
IX. SCIENCE,TECHNOLOGY & ENVIRONMENT
1 09 3425 00 Scientific Research (incl. S&T) 1500 170 145
3435 00 Ecology & Environment 0 9458 54
TOTAL - (IX) 1500 9628 199
(0.66) (2.45) (0.02)
(Rs. Lakh)
Code No. Major Heads/Minor Heads Kerala Madhya Mahara-of Development Pradesh shtra
1. 2. 15. 16. 17.
*
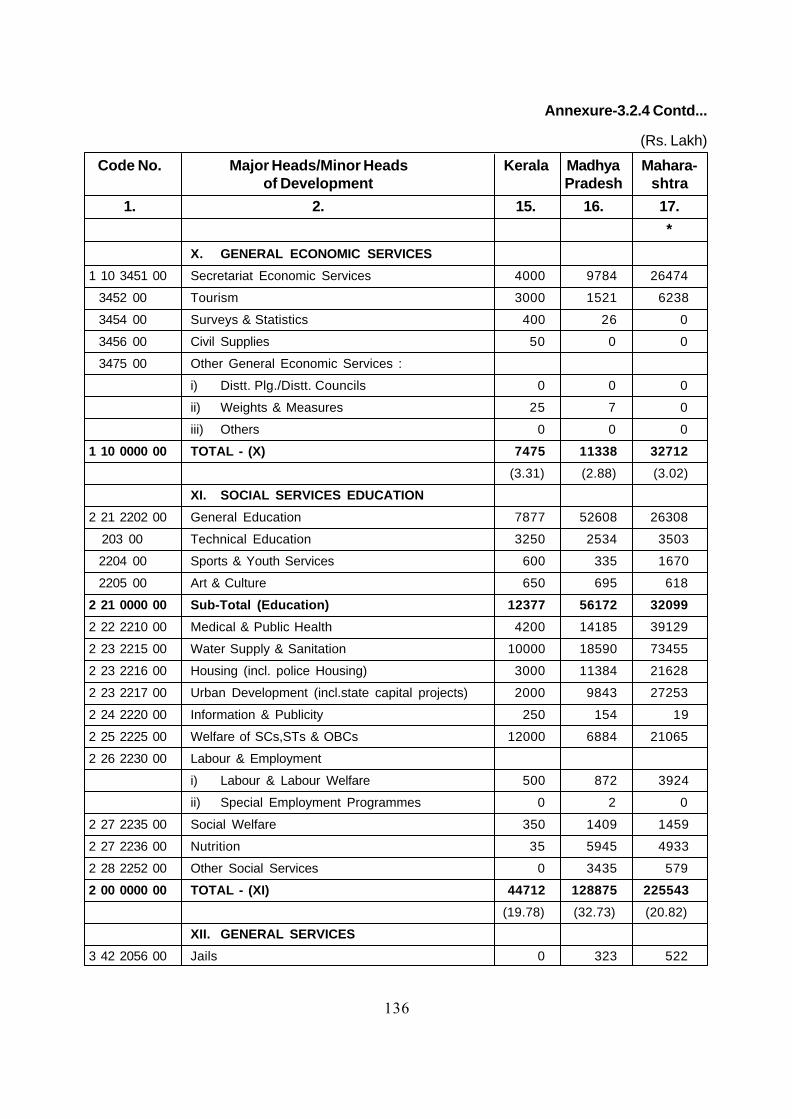
136
X. GENERAL ECONOMIC SERVICES
1 10 3451 00 Secretariat Economic Services 4000 9784 26474
3452 00 Tourism 3000 1521 6238
3454 00 Surveys & Statistics 400 26 0
3456 00 Civil Supplies 50 0 0
3475 00 Other General Economic Services :
i) Distt. Plg./Distt. Councils 0 0 0
ii) Weights & Measures 25 7 0
iii) Others 0 0 0
1 10 0000 00 TOTAL - (X) 7475 11338 32712
(3.31) (2.88) (3.02)
XI. SOCIAL SERVICES EDUCATION
2 21 2202 00 General Education 7877 52608 26308
203 00 Technical Education 3250 2534 3503
2204 00 Sports & Youth Services 600 335 1670
2205 00 Art & Culture 650 695 618
2 21 0000 00 Sub-Total (Education) 12377 56172 32099
2 22 2210 00 Medical & Public Health 4200 14185 39129
2 23 2215 00 Water Supply & Sanitation 10000 18590 73455
2 23 2216 00 Housing (incl. police Housing) 3000 11384 21628
2 23 2217 00 Urban Development (incl.state capital projects) 2000 9843 27253
2 24 2220 00 Information & Publicity 250 154 19
2 25 2225 00 Welfare of SCs,STs & OBCs 12000 6884 21065
2 26 2230 00 Labour & Employment
i) Labour & Labour Welfare 500 872 3924
ii) Special Employment Programmes 0 2 0
2 27 2235 00 Social Welfare 350 1409 1459
2 27 2236 00 Nutrition 35 5945 4933
2 28 2252 00 Other Social Services 0 3435 579
2 00 0000 00 TOTAL - (XI) 44712 128875 225543
(19.78) (32.73) (20.82)
XII. GENERAL SERVICES
3 42 2056 00 Jails 0 323 522
(Rs. Lakh)
Code No. Major Heads/Minor Heads Kerala Madhya Mahara-of Development Pradesh shtra
1. 2. 15. 16. 17.
*
Annexure-3.2.4 Contd...

137
(Rs. Lakh)
Code No. Major Heads/Minor Heads Kerala Madhya Mahara-of Development Pradesh shtra
1. 2. 15. 16. 17.
*
2058 00 Stationery & Printing 85 100 0
2059 00 Public Works 1500 488 2998
2070 00 Other Administrative Services :
i) Training 0 0 0
ii) Others 63750 25000 26758
3 00 0000 00 TOTAL - (XII) 65335 25911 30278
(28.91) (6.58) (2.79)
9 99 9999 99 GRAND TOTAL 226000 393776 1083400
(100) (100) (100)
Annexure-3.2.4 Contd...
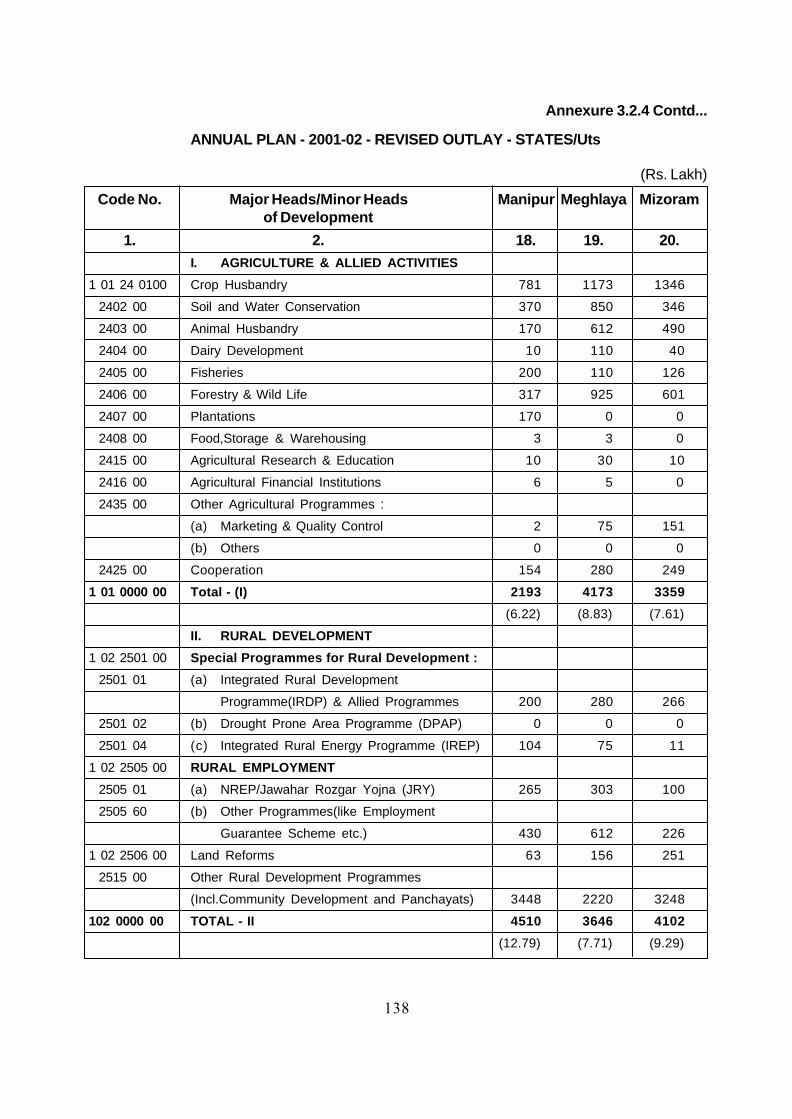
138
Annexure 3.2.4 Contd...
ANNUAL PLAN - 2001-02 - REVISED OUTLAY - STATES/Uts
(Rs. Lakh)
Code No. Major Heads/Minor Heads Manipur Meghlaya Mizoramof Development
1. 2. 18. 19. 20.I. AGRICULTURE & ALLIED ACTIVITIES
1 01 24 0100 Crop Husbandry 781 1173 1346
2402 00 Soil and Water Conservation 370 850 346
2403 00 Animal Husbandry 170 612 490
2404 00 Dairy Development 10 110 40
2405 00 Fisheries 200 110 126
2406 00 Forestry & Wild Life 317 925 601
2407 00 Plantations 170 0 0
2408 00 Food,Storage & Warehousing 3 3 0
2415 00 Agricultural Research & Education 10 30 10
2416 00 Agricultural Financial Institutions 6 5 0
2435 00 Other Agricultural Programmes :
(a) Marketing & Quality Control 2 75 151
(b) Others 0 0 0
2425 00 Cooperation 154 280 249
1 01 0000 00 Total - (I) 2193 4173 3359
(6.22) (8.83) (7.61)
II. RURAL DEVELOPMENT
1 02 2501 00 Special Programmes for Rural Development :
2501 01 (a) Integrated Rural Development
Programme(IRDP) & Allied Programmes 200 280 266
2501 02 (b) Drought Prone Area Programme (DPAP) 0 0 0
2501 04 (c) Integrated Rural Energy Programme (IREP) 104 75 11
1 02 2505 00 RURAL EMPLOYMENT
2505 01 (a) NREP/Jawahar Rozgar Yojna (JRY) 265 303 100
2505 60 (b) Other Programmes(like Employment
Guarantee Scheme etc.) 430 612 226
1 02 2506 00 Land Reforms 63 156 251
2515 00 Other Rural Development Programmes
(Incl.Community Development and Panchayats) 3448 2220 3248
102 0000 00 TOTAL - II 4510 3646 4102
(12.79) (7.71) (9.29)
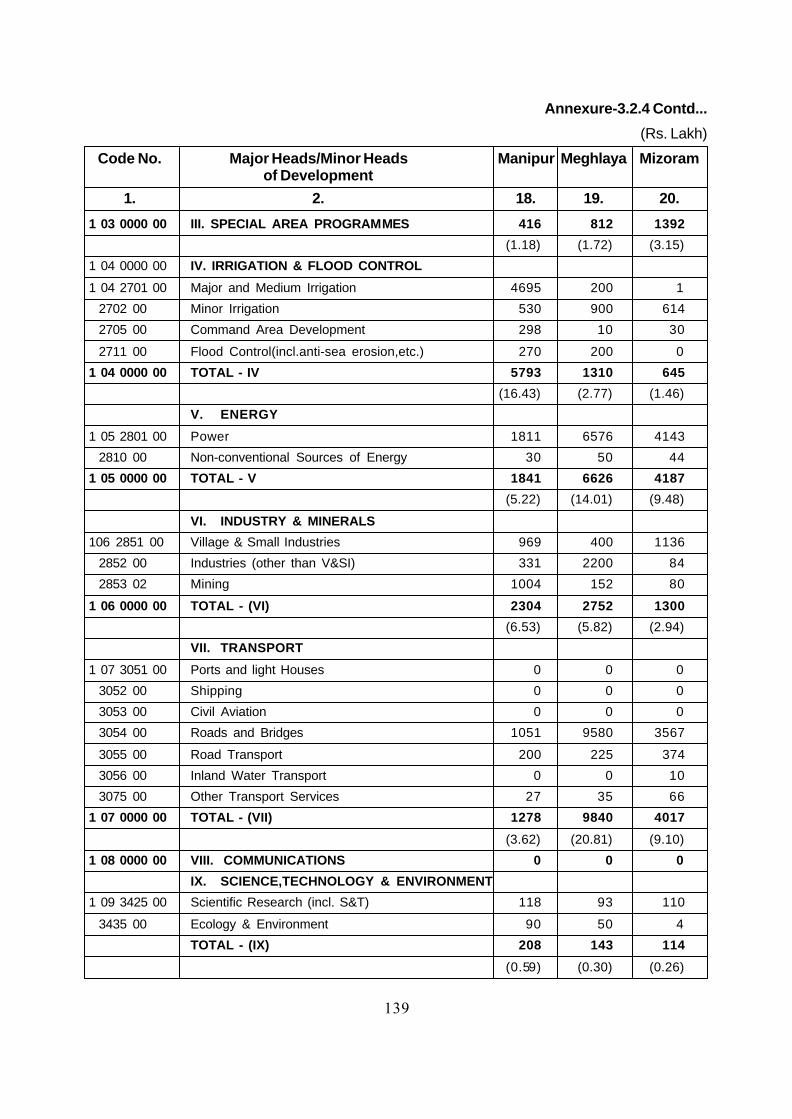
139
Annexure-3.2.4 Contd...
1 03 0000 00 III. SPECIAL AREA PROGRAMMES 416 812 1392
(1.18) (1.72) (3.15)
1 04 0000 00 IV. IRRIGATION & FLOOD CONTROL
1 04 2701 00 Major and Medium Irrigation 4695 200 1
2702 00 Minor Irrigation 530 900 614
2705 00 Command Area Development 298 10 30
2711 00 Flood Control(incl.anti-sea erosion,etc.) 270 200 0
1 04 0000 00 TOTAL - IV 5793 1310 645
(16.43) (2.77) (1.46)
V. ENERGY
1 05 2801 00 Power 1811 6576 4143
2810 00 Non-conventional Sources of Energy 30 50 44
1 05 0000 00 TOTAL - V 1841 6626 4187
(5.22) (14.01) (9.48)
VI. INDUSTRY & MINERALS
106 2851 00 Village & Small Industries 969 400 1136
2852 00 Industries (other than V&SI) 331 2200 84
2853 02 Mining 1004 152 80
1 06 0000 00 TOTAL - (VI) 2304 2752 1300
(6.53) (5.82) (2.94)
VII. TRANSPORT
1 07 3051 00 Ports and light Houses 0 0 0
3052 00 Shipping 0 0 0
3053 00 Civil Aviation 0 0 0
3054 00 Roads and Bridges 1051 9580 3567
3055 00 Road Transport 200 225 374
3056 00 Inland Water Transport 0 0 10
3075 00 Other Transport Services 27 35 66
1 07 0000 00 TOTAL - (VII) 1278 9840 4017
(3.62) (20.81) (9.10)
1 08 0000 00 VIII. COMMUNICATIONS 0 0 0
IX. SCIENCE,TECHNOLOGY & ENVIRONMENT
1 09 3425 00 Scientific Research (incl. S&T) 118 93 110
3435 00 Ecology & Environment 90 50 4
TOTAL - (IX) 208 143 114
(0.59) (0.30) (0.26)
(Rs. Lakh)
Code No. Major Heads/Minor Heads Manipur Meghlaya Mizoramof Development
1. 2. 18. 19. 20.

140
Annexure-3.2.4 Contd...
X. GENERAL ECONOMIC SERVICES
1 10 3451 00 Secretariat Economic Services 118 158 1395
3452 00 Tourism 158 300 271
3454 00 Surveys & Statistics 90 85 81
3456 00 Civil Supplies 67 30 177
3475 00 Other General Economic Services :
i) Distt. Plg./Distt. Councils 545 562 1829
ii) Weights & Measures 33 27 50
iii) Others 0 35 151
1 10 0000 00 TOTAL - (X) 1011 1197 3954
(2.87) (2.53) (8.96)
XI. SOCIAL SERVICES EDUCATION
2 21 2202 00 General Education 3510 4670 4448
2203 00 Technical Education 323 180 662
2204 00 Sports & Youth Services 264 1090 167
2205 00 Art & Culture 377 478 291
2 21 0000 00 Sub-Total (Education) 4474 6418 5568
2 22 2210 00 Medical & Public Health 1416 3600 2813
2 23 2215 00 Water Supply & Sanitation 4930 2917 3151
2 23 2216 00 Housing (incl. police Housing) 704 1055 4182
2 23 2217 00 Urban Development (incl.state capital projects) 1288 892 2942
2 24 2220 00 Information & Publicity 47 131 141
2 25 2225 00 Welfare of SCs,STs & OBCs 421 10 0
2 26 2230 00 Labour & Employment
i) Labour & Labour Welfare 91 20 74
ii) Special Employment Programmes 0 68 0
2 27 2235 00 Social Welfare 295 236 340
2 27 2236 00 Nutrition 816 682 627
2 28 2252 00 Other Social Services 0 0 0
2 00 0000 00 TOTAL - (XI) 14482 16029 19838
(41.06) (33.90) (44.93)
XII. GENERAL SERVICES
3 42 2056 00 Jails 29 66 196
2058 00 Stationery & Printing 51 95 100
(Rs. Lakh)
Code No. Major Heads/Minor Heads Manipur Meghlaya Mizoramof Development
1. 2. 18. 19. 20.
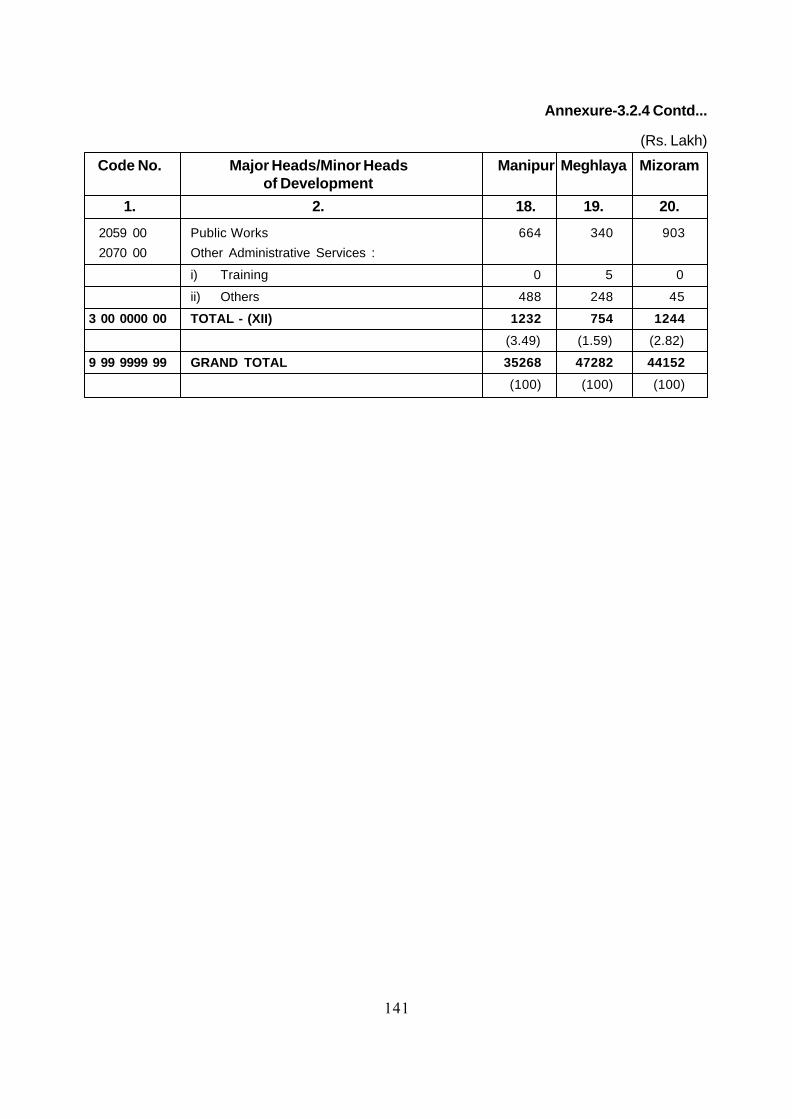
141
2059 00 Public Works 664 340 903
2070 00 Other Administrative Services :
i) Training 0 5 0
ii) Others 488 248 45
3 00 0000 00 TOTAL - (XII) 1232 754 1244
(3.49) (1.59) (2.82)
9 99 9999 99 GRAND TOTAL 35268 47282 44152
(100) (100) (100)
(Rs. Lakh)
Code No. Major Heads/Minor Heads Manipur Meghlaya Mizoramof Development
1. 2. 18. 19. 20.
Annexure-3.2.4 Contd...

142
Annexure 3.2.4 Contd...
ANNUAL PLAN - 2001-02 - REVISED OUTLAY - STATES/Uts
(Rs. Lakh)
Code No. Major Heads/Minor Heads Nagaland Orissa Punjabof Development
1. 2. 21. 22. 23.I. AGRICULTURE & ALLIED ACTIVITIES
1 01 24 0100 Crop Husbandry 1841 3431 3426
2402 00 Soil and Water Conservation 450 451 192
2403 00 Animal Husbandry 571 143 932
2404 00 Dairy Development 29 100 83
2405 00 Fisheries 117 380 183
2406 00 Forestry & Wild Life 503 2559 11506
2407 00 Plantations 0 0 0
2408 00 Food,Storage & Warehousing 0 100 0
2415 00 Agricultural Research & Education 0 180 1022
2416 00 Agricultural Financial Institutions 0 1 950
2435 00 Other Agricultural Programmes :
(a) Marketing & Quality Control 0 30 0
(b) Others 0 0 0
2425 00 Cooperation 290 780 32
1 01 0000 00 Total - (I) 3801 8155 18326
(9.24) (3.55) (6.07)
II. RURAL DEVELOPMENT
1 02 2501 00 Special Programmes for Rural Development :
2501 01 (a) Integrated Rural Development
Programme(IRDP) & Allied Programmes 55 900 399
2501 02 (b) Drought Prone Area Programme (DPAP) 0 543 0
2501 04 (c) Integrated Rural Energy Programme (IREP) 40 2 30
1 02 2505 00 RURAL EMPLOYMENT
2505 01 (a) NREP/Jawahar Rozgar Yojna (JRY) 80 2500 1519
2505 60 (b) Other Programmes(like Employment
Guarantee Scheme etc.) 170 2400 0
1 02 2506 00 Land Reforms 196 910 0
2515 00 Other Rural Development Programmes
(Incl.Community Development and Panchayats) 2606 7403 10382
102 0000 00 TOTAL - II 3147 14658 12330
(7.65) (6.37) (4.08)
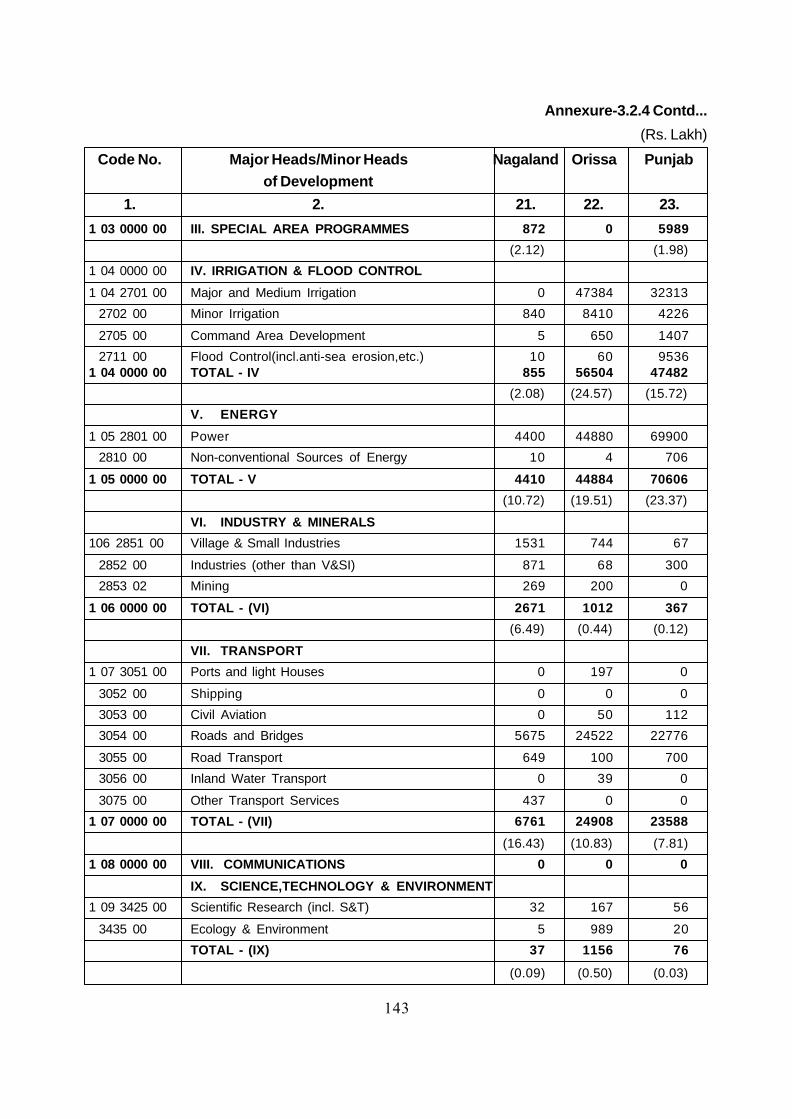
143
1 03 0000 00 III. SPECIAL AREA PROGRAMMES 872 0 5989
(2.12) (1.98)
1 04 0000 00 IV. IRRIGATION & FLOOD CONTROL
1 04 2701 00 Major and Medium Irrigation 0 47384 32313
2702 00 Minor Irrigation 840 8410 4226
2705 00 Command Area Development 5 650 1407
2711 00 Flood Control(incl.anti-sea erosion,etc.) 10 60 95361 04 0000 00 TOTAL - IV 855 56504 47482
(2.08) (24.57) (15.72)
V. ENERGY
1 05 2801 00 Power 4400 44880 69900
2810 00 Non-conventional Sources of Energy 10 4 706
1 05 0000 00 TOTAL - V 4410 44884 70606
(10.72) (19.51) (23.37)
VI. INDUSTRY & MINERALS
106 2851 00 Village & Small Industries 1531 744 67
2852 00 Industries (other than V&SI) 871 68 300
2853 02 Mining 269 200 0
1 06 0000 00 TOTAL - (VI) 2671 1012 367
(6.49) (0.44) (0.12)
VII. TRANSPORT
1 07 3051 00 Ports and light Houses 0 197 0
3052 00 Shipping 0 0 0
3053 00 Civil Aviation 0 50 112
3054 00 Roads and Bridges 5675 24522 22776
3055 00 Road Transport 649 100 700
3056 00 Inland Water Transport 0 39 0
3075 00 Other Transport Services 437 0 0
1 07 0000 00 TOTAL - (VII) 6761 24908 23588
(16.43) (10.83) (7.81)
1 08 0000 00 VIII. COMMUNICATIONS 0 0 0
IX. SCIENCE,TECHNOLOGY & ENVIRONMENT
1 09 3425 00 Scientific Research (incl. S&T) 32 167 56
3435 00 Ecology & Environment 5 989 20
TOTAL - (IX) 37 1156 76
(0.09) (0.50) (0.03)
(Rs. Lakh)
Code No. Major Heads/Minor Heads Nagaland Orissa Punjabof Development
1. 2. 21. 22. 23.
Annexure-3.2.4 Contd...

144
Annexure-3.2.4 Contd...
X. GENERAL ECONOMIC SERVICES
1 10 3451 00 Secretariat Economic Services 244 65 380
3452 00 Tourism 253 120 75
3454 00 Surveys & Statistics 117 41 80
3456 00 Civil Supplies 120 100 6
3475 00 Other General Economic Services :
i) Distt. Plg./Distt. Councils 3000 3140 1000
ii) Weights & Measures 36 1 0
iii) Others 150 3363 1008
1 10 0000 00 TOTAL - (X) 3920 6830 2549
(9.53) (2.97) (0.84)
XI. SOCIAL SERVICES EDUCATION
2 21 2202 00 General Education 2120 30479 25648
2203 00 Technical Education 1041 354 2039
2204 00 Sports & Youth Services 210 108 900
2205 00 Art & Culture 260 396 468
2 21 0000 00 Sub-Total (Education) 3631 31337 29055
2 22 2210 00 Medical & Public Health 1181 10103 17466
2 23 2215 00 Water Supply & Sanitation 3866 9051 9580
2 23 2216 00 Housing (incl. police Housing) 2766 5946 2218
2 23 2217 00 Urban Development (incl.state capital projects) 1106 3062 8749
2 24 2220 00 Information & Publicity 90 200 109
2 25 2225 00 Welfare of SCs,STs & OBCs 0 2861 4670
2 26 2230 00 Labour & Employment
i) Labour & Labour Welfare 128 240 573
ii) Special Employment Programmes 0 0 0
2 27 2235 00 Social Welfare 59 812 15360
2 27 2236 00 Nutrition 679 3115 779
2 28 2252 00 Other Social Services 0 0 117
2 00 0000 00 TOTAL - (XI) 13506 66727 88676
(32.82) (29.01) (29.35)
XII. GENERAL SERVICES
3 42 2056 00 Jails 0 176 282
2058 00 Stationery & Printing 60 0 34
(Rs. Lakh)
Code No. Major Heads/Minor Heads Nagaland Orissa Punjabof Development
1. 2. 21. 22. 23.

145
Annexure-3.2.4 Contd...
(Rs. Lakh)
Code No. Major Heads/Minor Heads Nagaland Orissa Punjabof Development
1. 2. 21. 22. 23.2059 00 Public Works 200 1635 1341
2070 00 Other Administrative Services :
i) Training 90 0 0
ii) Others 817 3355 30454
3 00 0000 00 TOTAL - (XII) 1167 5166 32111
(2.84) (2.25) (10.63)
9 99 9999 99 GRAND TOTAL 41147 230000 302100
(100) (100) (100)
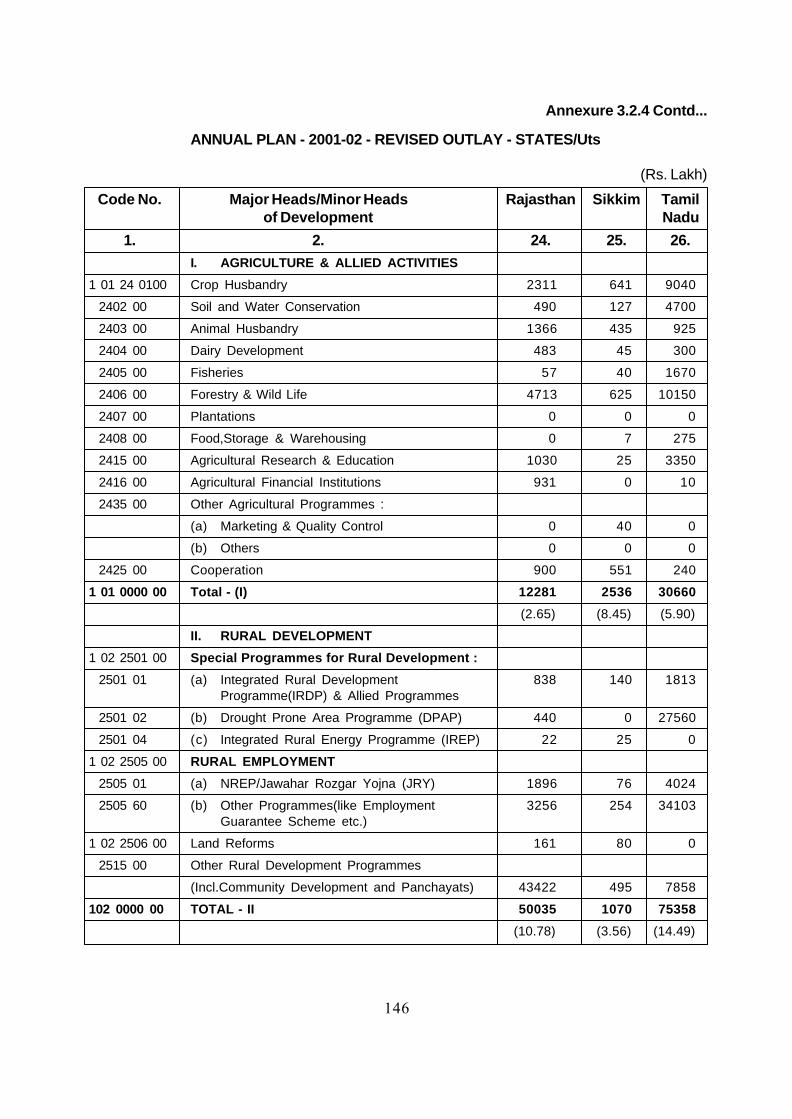
146
Annexure 3.2.4 Contd...
ANNUAL PLAN - 2001-02 - REVISED OUTLAY - STATES/Uts
(Rs. Lakh)
Code No. Major Heads/Minor Heads Rajasthan Sikkim Tamilof Development Nadu
1. 2. 24. 25. 26.I. AGRICULTURE & ALLIED ACTIVITIES
1 01 24 0100 Crop Husbandry 2311 641 9040
2402 00 Soil and Water Conservation 490 127 4700
2403 00 Animal Husbandry 1366 435 925
2404 00 Dairy Development 483 45 300
2405 00 Fisheries 57 40 1670
2406 00 Forestry & Wild Life 4713 625 10150
2407 00 Plantations 0 0 0
2408 00 Food,Storage & Warehousing 0 7 275
2415 00 Agricultural Research & Education 1030 25 3350
2416 00 Agricultural Financial Institutions 931 0 10
2435 00 Other Agricultural Programmes :
(a) Marketing & Quality Control 0 40 0
(b) Others 0 0 0
2425 00 Cooperation 900 551 240
1 01 0000 00 Total - (I) 12281 2536 30660
(2.65) (8.45) (5.90)
II. RURAL DEVELOPMENT
1 02 2501 00 Special Programmes for Rural Development :
2501 01 (a) Integrated Rural Development 838 140 1813Programme(IRDP) & Allied Programmes
2501 02 (b) Drought Prone Area Programme (DPAP) 440 0 27560
2501 04 (c) Integrated Rural Energy Programme (IREP) 22 25 0
1 02 2505 00 RURAL EMPLOYMENT
2505 01 (a) NREP/Jawahar Rozgar Yojna (JRY) 1896 76 4024
2505 60 (b) Other Programmes(like Employment 3256 254 34103Guarantee Scheme etc.)
1 02 2506 00 Land Reforms 161 80 0
2515 00 Other Rural Development Programmes
(Incl.Community Development and Panchayats) 43422 495 7858
102 0000 00 TOTAL - II 50035 1070 75358
(10.78) (3.56) (14.49)

147
Annexure-3.2.4 Contd...(Rs. Lakh)
Code No. Major Heads/Minor Heads Rajasthan Sikkim Tamilof Development Nadu
1. 2. 24. 25. 26.
1 03 0000 00 III. SPECIAL AREA PROGRAMMES 3232 572 0
(0.70) (1.91)
1 04 0000 00 IV. IRRIGATION & FLOOD CONTROL
1 04 2701 00 Major and Medium Irrigation 27581 0 38810
2702 00 Minor Irrigation 8301 390 3293
2705 00 Command Area Development 3515 350 1340
2711 00 Flood Control(incl.anti-sea erosion,etc.) 478 5 0
1 04 0000 00 TOTAL - IV 39875 745 43443
(8.59) (2.48) (8.35)
V. ENERGY
1 05 2801 00 Power 120650 3626 94837
2810 00 Non-conventional Sources of Energy 2180 34 300
1 05 0000 00 TOTAL - V 122830 3660 95137
(26.46) (12.19) (18.30)
VI. INDUSTRY & MINERALS
106 2851 00 Village & Small Industries 1299 331 3060
2852 00 Industries (other than V&SI) 3720 450 7901
2853 02 Mining 5314 100 45
1 06 0000 00 TOTAL - (VI) 10333 881 11006
(2.23) (2.93) (2.12)
VII. TRANSPORT
1 07 3051 00 Ports and light Houses 0 0 0
3052 00 Shipping 0 0 0
3053 00 Civil Aviation 0 0 0
3054 00 Roads and Bridges 29510 4608 53304
3055 00 Road Transport 5440 245 210
3056 00 Inland Water Transport 0 0 0
3075 00 Other Transport Services 12000 0 0
1 07 0000 00 TOTAL - (VII) 46950 4853 53514
(10.11) (16.16) (10.29)1 08 0000 00 VIII. COMMUNICATIONS 0 0 0
IX. SCIENCE,TECHNOLOGY & ENVIRONMENT
3435 00 Ecology & Environment 12 26 45
TOTAL - (IX) 71 96 335
(0.02) (0.32) (0.06)
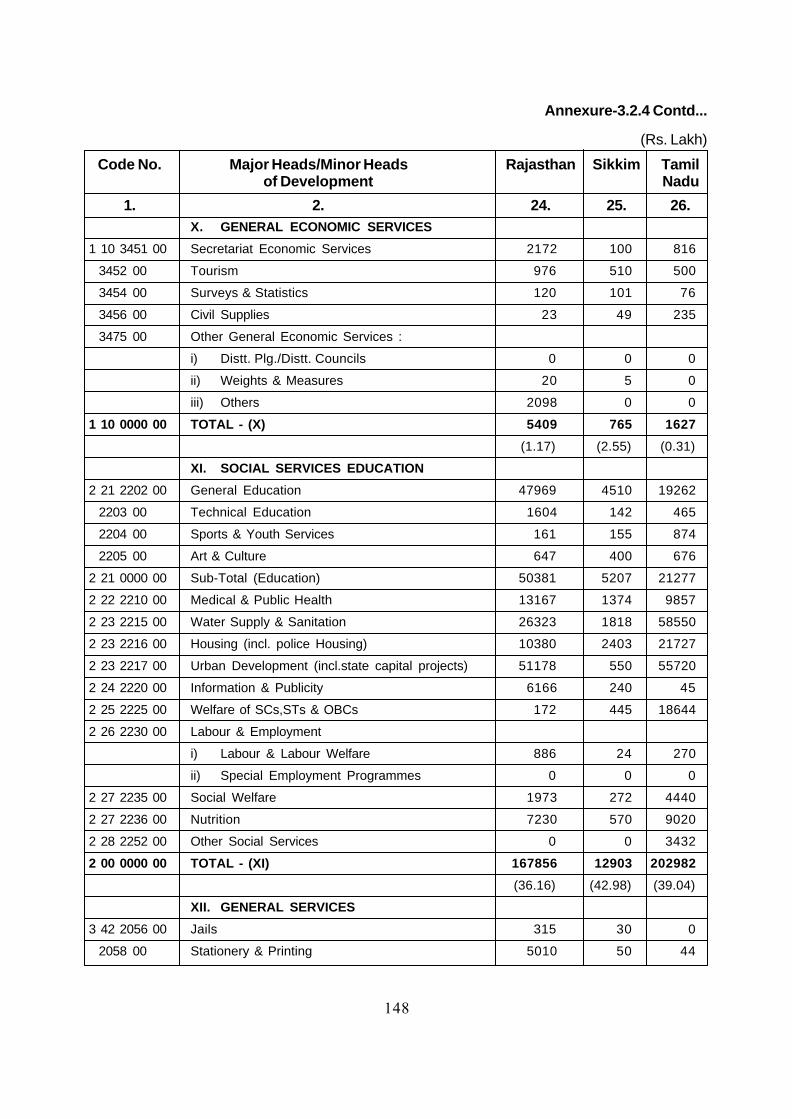
148
Annexure-3.2.4 Contd...
(Rs. Lakh)
Code No. Major Heads/Minor Heads Rajasthan Sikkim Tamilof Development Nadu
1. 2. 24. 25. 26.X. GENERAL ECONOMIC SERVICES
1 10 3451 00 Secretariat Economic Services 2172 100 816
3452 00 Tourism 976 510 500
3454 00 Surveys & Statistics 120 101 76
3456 00 Civil Supplies 23 49 235
3475 00 Other General Economic Services :
i) Distt. Plg./Distt. Councils 0 0 0
ii) Weights & Measures 20 5 0
iii) Others 2098 0 0
1 10 0000 00 TOTAL - (X) 5409 765 1627
(1.17) (2.55) (0.31)
XI. SOCIAL SERVICES EDUCATION
2 21 2202 00 General Education 47969 4510 19262
2203 00 Technical Education 1604 142 465
2204 00 Sports & Youth Services 161 155 874
2205 00 Art & Culture 647 400 676
2 21 0000 00 Sub-Total (Education) 50381 5207 21277
2 22 2210 00 Medical & Public Health 13167 1374 9857
2 23 2215 00 Water Supply & Sanitation 26323 1818 58550
2 23 2216 00 Housing (incl. police Housing) 10380 2403 21727
2 23 2217 00 Urban Development (incl.state capital projects) 51178 550 55720
2 24 2220 00 Information & Publicity 6166 240 45
2 25 2225 00 Welfare of SCs,STs & OBCs 172 445 18644
2 26 2230 00 Labour & Employment
i) Labour & Labour Welfare 886 24 270
ii) Special Employment Programmes 0 0 0
2 27 2235 00 Social Welfare 1973 272 4440
2 27 2236 00 Nutrition 7230 570 9020
2 28 2252 00 Other Social Services 0 0 3432
2 00 0000 00 TOTAL - (XI) 167856 12903 202982
(36.16) (42.98) (39.04)
XII. GENERAL SERVICES
3 42 2056 00 Jails 315 30 0
2058 00 Stationery & Printing 5010 50 44

149
(Rs. Lakh)
Code No. Major Heads/Minor Heads Rajasthan Sikkim Tamilof Development Nadu
1. 2. 24. 25. 26.
2059 00 Public Works 0 534 5894
2070 00 Other Administrative Services :
i) Training 0 7 0
ii) Others 38 1320 0
3 00 0000 00 TOTAL - (XII) 5363 1941 5938
(1.16) (6.47) (1.14)
9 99 9999 99 GRAND TOTAL 464235 30022 520000
(100) (100) (100)
Annexure-3.2.4 Contd...

150
Annexure 3.2.4 Contd...
ANNUAL PLAN - 2001-02 - REVISED OUTLAY - STATES/Uts
(Rs. Lakh)
Code No. Major Heads/Minor Heads Tripura Uttar Uttranchalof Development pradesh
* *
1. 2. 27. 28. 29.I. AGRICULTURE & ALLIED ACTIVITIES
1 01 24 0100 Crop Husbandry 1756 20458 2295
2402 00 Soil and Water Conservation 43 24747 5750
2403 00 Animal Husbandry 291 500 355
2404 00 Dairy Development 6 100 650
2405 00 Fisheries 264 500 74
2406 00 Forestry & Wild Life 1171 5000 10573
2407 00 Plantations 160 0 0
2408 00 Food,Storage & Warehousing 52 0 56
2415 00 Agricultural Research & Education 5 1708 56
2416 00 Agricultural Financial Institutions 0 392 200
2435 00 Other Agricultural Programmes :
(a) Marketing & Quality Control 1013 6000 0
(b) Others 0 0 0
2425 00 Cooperation 220 131 220
1 01 0000 00 Total - (I) 4981 59536 20229
(8.89) (12.22) (19.27)
II. RURAL DEVELOPMENT
1 02 2501 00 Special Programmes for Rural Development :
2501 01 (a) Integrated Rural Development
Programme(IRDP) & Allied Programmes 166 3635 1332
2501 02 (b) Drought Prone Area Programme (DPAP) 0 912 334
2501 04 (c) Integrated Rural Energy Programme (IREP) 43 117 50
1 02 2505 00 RURAL EMPLOYMENT
2505 01 (a) NREP/Jawahar Rozgar Yojna (JRY) 479 27429 1170
2505 60 (b) Other Programmes(like Employment
Guarantee Scheme etc.) 806 500 0
1 02 2506 00 Land Reforms 159 9978 0
2515 00 Other Rural Development Programmes
(Incl.Community Development and Panchayats) 2203 33538 7426
102 0000 00 TOTAL - II 3856 76109 10312
(6.89) (15.62) (9.82)

151
1 03 0000 00 III. SPECIAL AREA PROGRAMMES 3146 17461 0
(5.62) (3.58)
1 04 0000 00 IV. IRRIGATION & FLOOD CONTROL
1 04 2701 00 Major and Medium Irrigation 609 73000 2800
2702 00 Minor Irrigation 4500 4500 1504
2705 00 Command Area Development 2 2848 12
2711 00 Flood Control(incl.anti-sea erosion,etc.) 1017 2347 150
1 04 0000 00 TOTAL - IV 6128 82695 4466
(10.94) (16.97) (4.25)
V. ENERGY
1 05 2801 00 Power 2154 72883 8860
2810 00 Non-conventional Sources of Energy 23 603 700
1 05 0000 00 TOTAL - V 2177 73486 9560
(3.89) (15.08) (9.10)
VI. INDUSTRY & MINERALS
106 2851 00 Village & Small Industries 597 2259 948
2852 00 Industries (other than V&SI) 1210 1553 400
2853 02 Mining 7 0 6
1 06 0000 00 TOTAL - (VI) 1814 3812 1354
(3.24) (0.78) (1.29)
VII. TRANSPORT
1 07 3051 00 Ports and light Houses 0 0 0
3052 00 Shipping 0 0 0
3053 00 Civil Aviation 0 397 1100
3054 00 Roads and Bridges 5246 55205 15971
3055 00 Road Transport 85 3262 0
3056 00 Inland Water Transport 0 0 0
3075 00 Other Transport Services 1399 0 431
1 07 0000 00 TOTAL - (VII) 6730 58864 17502
(12.02) (12.08) (16.67)
1 08 0000 00 VIII. COMMUNICATIONS 4 0 0
(0.01)
IX. SCIENCE,TECHNOLOGY & ENVIRONMENT
1 09 3425 00 Scientific Research (incl. S&T) 42 364 60
(Rs. Lakh)
Code No. Major Heads/Minor Heads Tripura Uttar Uttranchalof Development pradesh
* *
1. 2. 27. 28. 29.
Annexure-3.2.4 Contd...
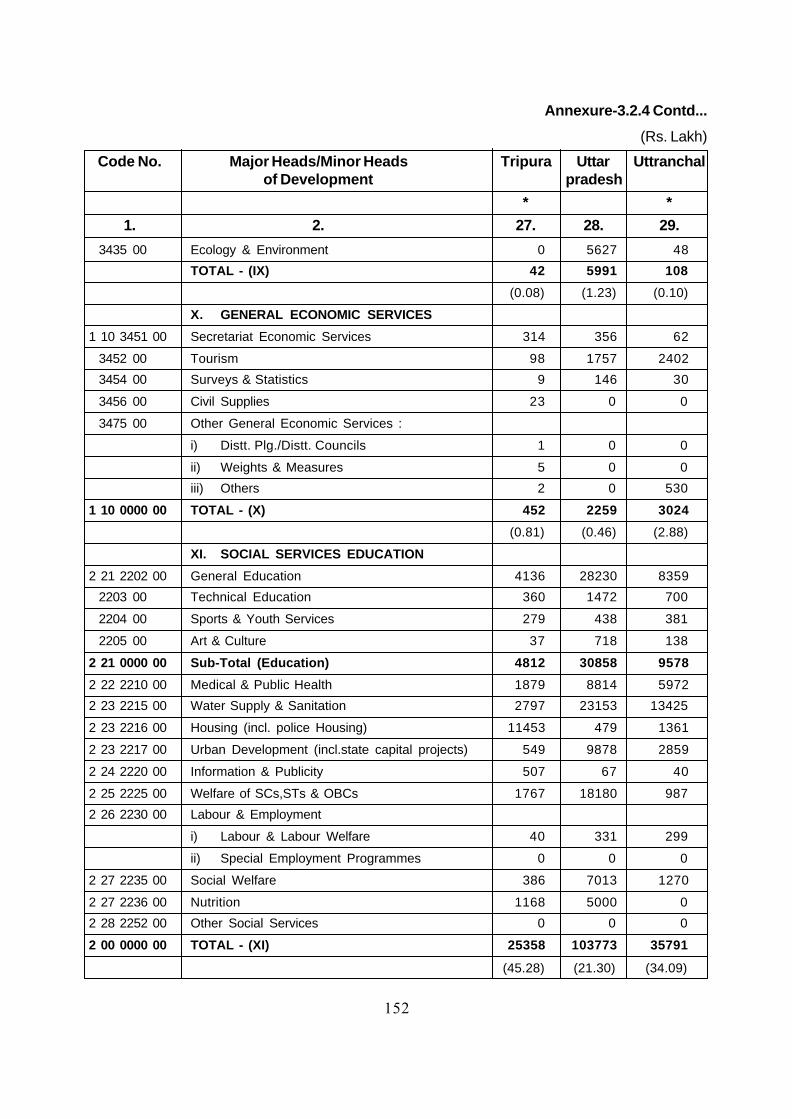
152
Annexure-3.2.4 Contd...
3435 00 Ecology & Environment 0 5627 48
TOTAL - (IX) 42 5991 108
(0.08) (1.23) (0.10)
X. GENERAL ECONOMIC SERVICES
1 10 3451 00 Secretariat Economic Services 314 356 62
3452 00 Tourism 98 1757 2402
3454 00 Surveys & Statistics 9 146 30
3456 00 Civil Supplies 23 0 0
3475 00 Other General Economic Services :
i) Distt. Plg./Distt. Councils 1 0 0
ii) Weights & Measures 5 0 0
iii) Others 2 0 530
1 10 0000 00 TOTAL - (X) 452 2259 3024
(0.81) (0.46) (2.88)
XI. SOCIAL SERVICES EDUCATION
2 21 2202 00 General Education 4136 28230 8359
2203 00 Technical Education 360 1472 700
2204 00 Sports & Youth Services 279 438 381
2205 00 Art & Culture 37 718 138
2 21 0000 00 Sub-Total (Education) 4812 30858 9578
2 22 2210 00 Medical & Public Health 1879 8814 5972
2 23 2215 00 Water Supply & Sanitation 2797 23153 13425
2 23 2216 00 Housing (incl. police Housing) 11453 479 1361
2 23 2217 00 Urban Development (incl.state capital projects) 549 9878 2859
2 24 2220 00 Information & Publicity 507 67 40
2 25 2225 00 Welfare of SCs,STs & OBCs 1767 18180 987
2 26 2230 00 Labour & Employment
i) Labour & Labour Welfare 40 331 299
ii) Special Employment Programmes 0 0 0
2 27 2235 00 Social Welfare 386 7013 1270
2 27 2236 00 Nutrition 1168 5000 0
2 28 2252 00 Other Social Services 0 0 0
2 00 0000 00 TOTAL - (XI) 25358 103773 35791
(45.28) (21.30) (34.09)
(Rs. Lakh)
Code No. Major Heads/Minor Heads Tripura Uttar Uttranchalof Development pradesh
* *
1. 2. 27. 28. 29.

153
Annexure-3.2.4 Contd...
XII. GENERAL SERVICES
3 42 2056 00 Jails 37 0 95
2058 00 Stationery & Printing 17 49 0
2059 00 Public Works 719 3242 505
2070 00 Other Administrative Services :
i) Training 0 0 0
ii) Others 539 0 2054
3 00 0000 00 TOTAL - (XII) 1312 3291 2654
(2.34) (0.68) (2.53)
9 99 9999 99 GRAND TOTAL 56000 487277 105000
(100) (100) (100)
(Rs. Lakh)
Code No. Major Heads/Minor Heads Tripura Uttar Uttranchalof Development pradesh
* *
1. 2. 27. 28. 29.

154
Annexure 3.2.4 Contd...
ANNUAL PLAN - 2001-02 - REVISED OUTLAY - STATES/Uts
(Rs. Lakh)
Code No. Major Heads/Minor Heads West Total A & Nof Development Bengal (States) Islands
*
1. 2. 30. 31. 32.I. AGRICULTURE & ALLIED ACTIVITIES
1 01 24 0100 Crop Husbandry 4023 146858 175.00
402 00 Soil and Water Conservation 203 67111 181.00
2403 00 Animal Husbandry 2490 32107 335.00
2404 00 Dairy Development 672 4711 0.00
2405 00 Fisheries 4350 16986 360.00
2406 00 Forestry & Wild Life 3989 137961 1190.00
2407 00 Plantations 279 654 0.00
2408 00 Food,Storage & Warehousing 37 1079 0.00
2415 00 Agricultural Research & Education 828 30067 0.00
2416 00 Agricultural Financial Institutions 656 5513 0.00
2435 00 Other Agricultural Programmes :
(a) Marketing & Quality Control 671 12223 0.00
(b) Others 0 0 0.00
2425 00 Cooperation 2086 32967 190.00
1 01 0000 00 Total - (I) 20284 488237 2431.00
(3.56) (6.57)
II. RURAL DEVELOPMENT
1 02 2501 00 Special Programmes for Rural Development :
2501 01 (a) Integrated Rural Development
Programme(IRDP) & Allied Programmes 1886 119538 0.00
2501 02 (b) Drought Prone Area Programme (DPAP) 111 36314 0.00
2501 04 (c) Integrated Rural Energy Programme (IREP) 0 1260 50.00
1 02 2505 00 RURAL EMPLOYMENT
2505 01 (a) NREP/Jawahar Rozgar Yojna (JRY) 10815 114443 0.00
2505 60 (b) Other Programmes(like Employment
Guarantee Scheme etc.) 0 130569 0.00
1 02 2506 00 Land Reforms 869 21278 100.00
2515 00 Other Rural Development Programmes
(Incl.Community Development and Panchayats) 34012 378674 2550.00
102 0000 00 TOTAL - II 47693 802076 2700.00
( 8.38) (7.30)

155
1 03 0000 00 III. SPECIAL AREA PROGRAMMES 20825 80989 0.00
(3.66)
1 04 0000 00 IV. IRRIGATION & FLOOD CONTROL
1 04 2701 00 Major and Medium Irrigation 13807 1127427 0.00
2702 00 Minor Irrigation 10775 194672.00 280.00
2705 00 Command Area Development 781 23221.00 0.00
2711 00 Flood Control(incl.anti-sea erosion,etc.) 30863 66048.00 0.00
1 04 0000 00 TOTAL - IV 56226 1411368 280.00
(9.88) (0.76)
V. ENERGY
1 05 2801 00 Power 123223 1263046 3050.00
810 00 Non-conventional Sources of Energy 263 9571 217.00
1 05 0000 00 TOTAL - V 123486 1272617 3267.00
(21.69) (8.83)
VI. INDUSTRY & MINERALS
106 2851 00 Village & Small Industries 5741 93372 800.00
2852 00 Industries (other than V&SI) 30180 110433 0.00
2853 02 Mining 430 10931 0.00
1 06 0000 00 TOTAL - (VI) 36351 214736 800.00
(6.38) (2.16)
VII. TRANSPORT
1 07 3051 00 Ports and light Houses 0 1921 900.00
3052 00 Shipping 0 0 4800.00
3053 00 Civil Aviation 48 4261 1900.00
3054 00 Roads and Bridges 74990 863297 5675.00
3055 00 Road Transport 23403 156199 292.00
3056 00 Inland Water Transport 119 1682 0.00
3075 00 Other Transport Services 0 18132 0.00
1 07 0000 00 TOTAL - (VII) 98560 1045492 13567.00
(17.31) (36.67)
1 08 0000 00 VIII. COMMUNICATIONS 0 861 85.00
(0.23)
IX. SCIENCE,TECHNOLOGY & ENVIRONMENT
1 09 3425 00 Scientific Research (incl. S&T) 3048 19504 20.00
(Rs. Lakh)
Code No. Major Heads/Minor Heads West Total A & Nof Development Bengal (States) Islands
*
1. 2. 30. 31. 32.
Annexure-3.2.4 Contd...

156
Annexure-3.2.4 Contd...
3435 00 Ecology & Environment 1928 19356 0.00
TOTAL - (IX) 4976 38860 20.00
(0.87) (0.05)
X. GENERAL ECONOMIC SERVICES
1 10 3451 00 Secretariat Economic Services 74 92203 150.00
3452 00 Tourism 851 32441 641.00
3454 00 Surveys & Statistics 32 2674 30.00
3456 00 Civil Supplies 875 6520 220.00
3475 00 Other General Economic Services :
i) Distt. Plg./Distt. Councils 2817 41173 0.00
ii) Weights & Measures 26 2127 0.00
iii) Others 0 30859 0.00
1 10 0000 00 TOTAL - (X) 4675 207997 1041.00
(0.82) (2.81)
XI. SOCIAL SERVICES EDUCATION
2 21 2202 00 General Education 16256 593702 3790.00
2203 00 Technical Education 2134 34989 0.00
2204 00 Sports & Youth Services 2538 21083 0.00
2205 00 Art & Culture 612 14269 0.00
2 21 0000 00 Sub-Total (Education) 21540 664043 3790.00
2 22 2210 00 Medical & Public Health 33352 319741 1900.00
2 23 2215 00 Water Supply & Sanitation 18420 519890 2675.00
2 23 2216 00 Housing (incl. police Housing) 3110 236515 1600.00
2 23 2217 00 Urban Development (incl.state capital projects) 45625 363042 1127.00
2 24 2220 00 Information & Publicity 693 13531 75.00
2 25 2225 00 Welfare of SCs,STs & OBCs 6128 192144 70.00
2 26 2230 00 Labour & Employment
i) Labour & Labour Welfare 877 22074 67.00
ii) Special Employment Programmes 0 3166 0.00
2 27 2235 00 Social Welfare 5856 115770 125.00
2 27 2236 00 Nutrition 6702 85075 220.00
2 28 2252 00 Other Social Services 2556 11173 0.00
2 00 0000 00 TOTAL - (XI) 144859 2546164 11649.00
(25.44) (31.48)
(Rs. Lakh)
Code No. Major Heads/Minor Heads West Total A & Nof Development Bengal (States) Islands
*
1. 2. 30. 31. 32.
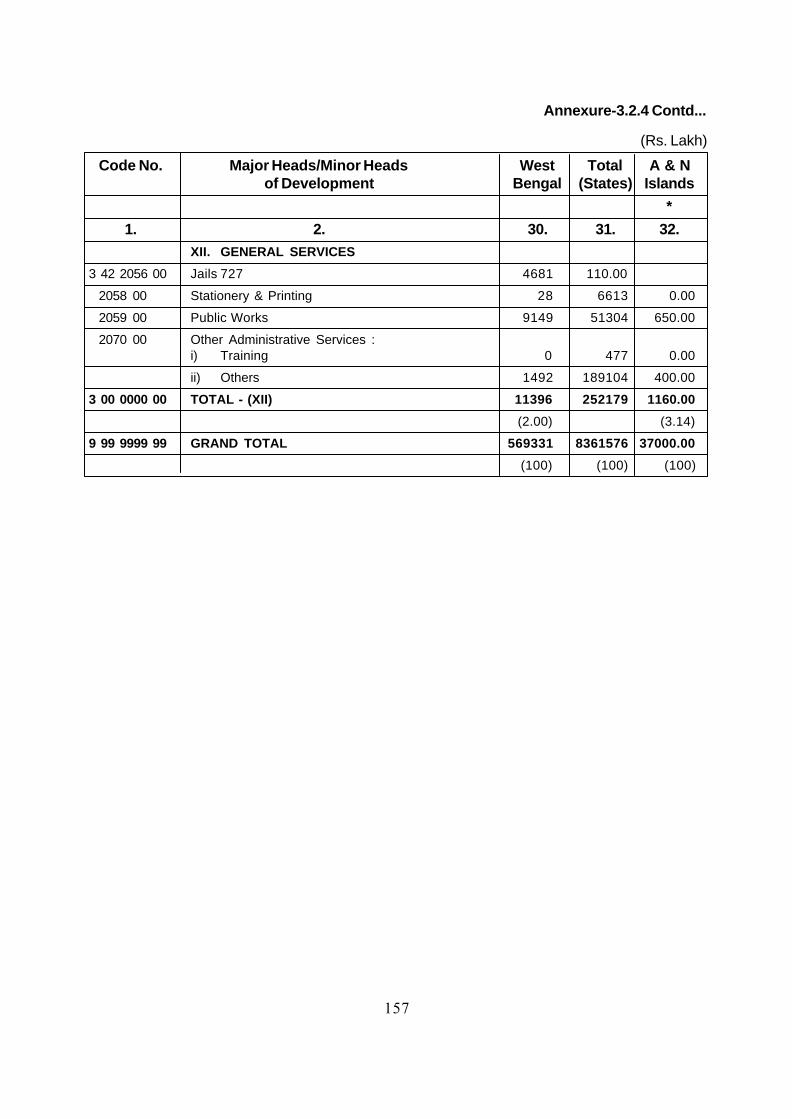
157
XII. GENERAL SERVICES
3 42 2056 00 Jails 727 4681 110.00
2058 00 Stationery & Printing 28 6613 0.00
2059 00 Public Works 9149 51304 650.00
2070 00 Other Administrative Services :i) Training 0 477 0.00
ii) Others 1492 189104 400.00
3 00 0000 00 TOTAL - (XII) 11396 252179 1160.00
(2.00) (3.14)
9 99 9999 99 GRAND TOTAL 569331 8361576 37000.00
(100) (100) (100)
(Rs. Lakh)
Code No. Major Heads/Minor Heads West Total A & Nof Development Bengal (States) Islands
*
1. 2. 30. 31. 32.
Annexure-3.2.4 Contd...

158
Annexure 3.2.4 Contd...
ANNUAL PLAN - 2001-02 - REVISED OUTLAY - STATES/Uts
(Rs. Lakh)
Code No. Major Heads/Minor Heads Chandigarh D & N Damanof Development Haveli & Diu
* *
1. 2. 33. 34. 35.I. AGRICULTURE & ALLIED ACTIVITIES
1 01 24 0100 Crop Husbandry 3.00 131.55 37.00
2402 00 Soil and Water Conservation 3.00 140.05 1.00
2403 00 Animal Husbandry 16.00 26.00 13.00
2404 00 Dairy Development 0.00 2.00 2.00
2405 00 Fisheries 23.00 0.45 57.00
2406 00 Forestry & Wild Life 688.00 255.60 41.00
2407 00 Plantations 0.00 0.00 0.00
2408 00 Food,Storage & Warehousing 0.00 0.00 0.00
2415 00 Agricultural Research & Education 0.00 0.00 0.00
2416 00 Agricultural Financial Institutions 0.00 0.00 0.00
2435 00 Other Agricultural Programmes :
(a) Marketing & Quality Control 0.00 0.00 0.00
(b) Others 0.00 0.00 0.00
2425 00 Cooperation 6.00 22.15 12.00
1 01 0000 00 Total - (I) 739.00 577.80 163.00
(4.80) (11.22) (3.86)
II. RURAL DEVELOPMENT
1 02 2501 00 Special Programmes for Rural Development :
2501 01 (a) Integrated Rural Development 0.00 0.00 0.00Programme(IRDP) & Allied Programmes
2501 02 (b) Drought Prone Area Programme (DPAP) 0.00 0.00 0.00
2501 04 (c) Integrated Rural Energy Programme (IREP) 5.00 4.05 0.00
1 02 2505 00 RURAL EMPLOYMENT
2505 01 (a) NREP/Jawahar Rozgar Yojna (JRY) 0.00 0.00 0.00
2505 60 (b) Other Programmes(like EmploymentGuarantee Scheme etc.) 0.00 0.00 0.00
1 02 2506 00 Land Reforms 0.00 5.88 18.00
2515 00 Other Rural Development Programmes 172.00 79.02 13.00(Incl.Community Development and Panchayats)
102 0000 00 TOTAL - II 177.00 88.95 31.00
(1.15) (1.73) (0.73)

159
Annexure-3.2.4 Contd...
1 03 0000 00 III. SPECIAL AREA PROGRAMMES 0.00 0.00 0.00
1 04 0000 00 IV. IRRIGATION & FLOOD CONTROL
1 04 2701 00 Major and Medium Irrigation 0.00 50.00 10.00
2702 00 Minor Irrigation 20.00 57.00 5.00
2705 00 Command Area Development 0.00 18.00 0.00
2711 00 Flood Control(incl.anti-sea erosion,etc.) 0.00 0.00 22.00
1 04 0000 00 TOTAL - IV 20.00 125.00 37.00
(0.13) (2.43) (0.88)
V. ENERGY
1 05 2801 00 Power 1255.00 1493.80 1425.00
2810 00 Non-conventional Sources of Energy 15.00 3.95 3.00
1 05 0000 00 TOTAL - V 1270.00 1497.75 1428.00
(8.24) (29.09) (33.85)
VI. INDUSTRY & MINERALS
106 2851 00 Village & Small Industries 41.00 37.00 9.00
2852 00 Industries (other than V&SI) 0.00 0.00 18.00
2853 02 Mining 0.00 0.00 0.00
1 06 0000 00 TOTAL - (VI) 41.00 37.00 27.00
(0.27) (0.72) (0.64)
VII. TRANSPORT
1 07 3051 00 Ports and light Houses 0.00 0.00 30.00
3052 00 Shipping 0.00 0.00 0.00
3053 00 Civil Aviation 0.00 0.00 0.00
3054 00 Roads and Bridges 50.00 902.00 1298.00
3055 00 Road Transport 400.00 1.00 0.00
3056 00 Inland Water Transport 0.00 0.00 0.00
3075 00 Other Transport Services 21.00 0.00 2.00
1 07 0000 00 TOTAL - (VII) 471.00 903.00 1330.00
(3.06) (17.54) (31.52)
1 08 0000 00 VIII. COMMUNICATIONS 0.00 0.00 0.00
IX. SCIENCE,TECHNOLOGY &
ENVIRONMENT
1 09 3425 00 Scientific Research (incl. S&T) 32.00 6.00 10.00
3435 00 Ecology & Environment 122.00 0.00 0.00
TOTAL - (IX) 154.00 6.00 10.00
(Rs. Lakh)
Code No. Major Heads/Minor Heads Chandigarh D & N Damanof Development Haveli & Diu
* *
1. 2. 33. 34. 35.

160
Annexure-3.2.4 Contd...
(1.00) (0.12) (0.24)
X. GENERAL ECONOMIC SERVICES
1 10 3451 00 Secretariat Economic Services 1.00 1.00 0.00
3452 00 Tourism 120.00 108.00 65.00
3454 00 Surveys & Statistics 1.00 3.00 17.00
3456 00 Civil Supplies 100.00 2.00 5.00
3475 00 Other General Economic Services :
i) Distt. Plg./Distt. Councils 0.00 0.00 0.00
ii) Weights & Measures 0.00 1.00 2.00
iii) Others 0.00 20.00 0.00
1 10 0000 00 TOTAL - (X) 222.00 135.00 89.00
(1.44) (2.62) (2.11)
XI. SOCIAL SERVICES EDUCATION
2 21 2202 00 General Education 712.00 563.80 267.00
2203 00 Technical Education 245.00 87.00 103.00
2204 00 Sports & Youth Services 298.00 10.00 10.00
2205 00 Art & Culture 304.00 10.00 14.00
2 21 0000 00 Sub-Total (Education) 1559.00 670.80 394.00
2 22 2210 00 Medical & Public Health 3947.25 234.80 165.00
2 23 2215 00 Water Supply & Sanitation 810.00 301.60 175.00
2 23 2216 00 Housing (incl. police Housing) 706.10 114.10 60.00
2 23 2217 00 Urban Development (incl.state capital projects) 4854.00 107.00 108.00
2 24 2220 00 Information & Publicity 7.00 8.00 10.00
2 25 2225 00 Welfare of SCs,STs & OBCs 76.00 0.00 18.00
2 26 2230 00 Labour & Employment
i) Labour & Labour Welfare 32.00 26.00 27.00
ii) Special Employment Programmes 0.00 0.00 0.00
2 27 2235 00 Social Welfare 73.00 9.00 7.00
2 27 2236 00 Nutrition 94.65 62.20 46.00
2 28 2252 00 Other Social Services 11.00 0.00 0.00
2 00 0000 00 TOTAL - (XI) 12170.00 1533.50 1010.00
(78.97) (29.79) (23.94)
XII. GENERAL SERVICES
3 42 2056 00 Jails 0.00 0.00 0.00
(Rs. Lakh)
Code No. Major Heads/Minor Heads Chandigarh D & N Damanof Development Haveli & Diu
* *
1. 2. 33. 34. 35.

161
(Rs. Lakh)
Code No. Major Heads/Minor Heads Chandigarh D & N Damanof Development Haveli & Diu
* *
1. 2. 33. 34. 35.
2058 00 Stationery & Printing 0.00 11.00 36.00
2059 00 Public Works 0.00 194.00 55.00
2070 00 Other Administrative Services :
i) Training 0.00 0.00 0.00
ii) Others 147.00 39.00 3.00
3 00 0000 00 TOTAL - (XII) 147.00 244.00 94.00
(0.95) (4.74) (2.23)
9 99 9999 99 GRAND TOTAL 15411.00 5148.00 4219.00
(100) (100) (100)
Annexure-3.2.4 Contd...

162
Annexure 3.2.4 Contd...
ANNUAL PLAN - 2001-02 - REVISED OUTLAY - STATES/Uts
(Rs. Lakh)
Code No. Major Heads/Minor Heads Delhi Laksha- Pondi-of Development dweep cherry
1. 2. 36. 37. 38.I. AGRICULTURE & ALLIED ACTIVITIES
1 01 24 0100 Crop Husbandry 226.00 167.28 894.00
2402 00 Soil and Water Conservation 75.00 25.00 46.00
2403 00 Animal Husbandry 434.00 258.93 818.00
2404 00 Dairy Development 500.00 0.00 59.72
2405 00 Fisheries 22.00 122.39 410.81
2406 00 Forestry & Wild Life 460.00 21.20 118.00
2407 00 Plantations 345.00 0.00 0.00
2408 00 Food,Storage & Warehousing 0.00 0.00 0.00
2415 00 Agricultural Research & Education 0.00 0.00 513.00
2416 00 Agricultural Financial Institutions 0.00 0.00 0.00
2435 00 Other Agricultural Programmes :
(a) Marketing & Quality Control 6.00 0.00 148.00
(b) Others 0.00 0.00 0.00
2425 00 Cooperation 60.00 287.83 831.21
1 01 0000 00 Total - (I) 2128.00 882.63 3838.74
(0.56) (8.41) (10.81)
II. RURAL DEVELOPMENT
1 02 2501 00 Special Programmes for Rural Development :
2501 01 (a) Integrated Rural Development 0.00 0.00 0.00Programme(IRDP) & Allied Programmes
2501 02 (b) Drought Prone Area Programme (DPAP) 0.00 0.00 0.00
2501 04 (c) Integrated Rural Energy Programme (IREP) 250.00 27.00 0.02
1 02 2505 00 RURAL EMPLOYMENT
2505 01 (a) NREP/Jawahar Rozgar Yojna (JRY) 0.00 0.00 0.00
2505 60 (b) Other Programmes(like Employment 0.00 0.00 0.00Guarantee Scheme etc.)
1 02 2506 00 Land Reforms 15.00 0.00 25.65
2515 00 Other Rural Development Programmes 8000.00 169.55 1147.30(Incl.Community Development and Panchayats)
102 0000 00 TOTAL - II 8265.00 196.55 1172.97
(2.18) (1.87) (3.30)
1 03 0000 00 III. SPECIAL AREA PROGRAMMES 0.00 0.00 0.00

163
Annexure-3.2.4 Contd...
1 04 0000 00 IV. IRRIGATION & FLOOD CONTROL
1 04 2701 00 Major and Medium Irrigation 0.00 0.00 0.00
2702 00 Minor Irrigation 68.00 0.00 886.33
2705 00 Command Area Development 0.00 0.00 0.00
2711 00 Flood Control(incl.anti-sea erosion,etc.) 2400.00 500.00 407.47
1 04 0000 00 TOTAL - IV 2468.00 500.00 1293.80
(0.65) (4.76) (3.64)
V. ENERGY
1 05 2801 00 Power 69850.00 272.76 2769.01
2810 00 Non-conventional Sources of Energy 150.00 418.80 12.15
1 05 0000 00 TOTAL - V 70000.00 691.56 2781.16
(18.42) (6.59) (7.83)
VI. INDUSTRY & MINERALS
106 2851 00 Village & Small Industries 4300.00 167.38 1382.48
2852 00 Industries (other than V&SI) 0.00 0.00 3302.00
2853 02 Mining 0.00 0.00 0.00
1 06 0000 00 TOTAL - (VI) 4300.00 167.38 4684.48
(1.13) (1.59) (13.20)
VII. TRANSPORT
1 07 3051 00 Ports and light Houses 0.00 70.00 425.00
3052 00 Shipping 0.00 5437.77 0.00
3053 00 Civil Aviation 0.00 0.00 0.00
3054 00 Roads and Bridges 32100.00 500.00 2453.51
3055 00 Road Transport 59040.00 0.91 43.20
3056 00 Inland Water Transport 0.00 60.73 0.00
3075 00 Other Transport Services 0.00 0.00 0.00
1 07 0000 00 TOTAL - (VII) 91140.00 6069.41 2921.71
(23.98) (57.81) (8.23)
1 08 0000 00 VIII. COMMUNICATIONS 0.00 13.68 0.00
(0.13)
IX. SCIENCE,TECHNOLOGY &
ENVIRONMENT
1 09 3425 00 Scientific Research (incl. S&T) 385.00 37.24 33.60
3435 00 Ecology & Environment 620.00 37.17 34.40
TOTAL - (IX) 1005.00 74.41 68.00
(Rs. Lakh)
Code No. Major Heads/Minor Heads Delhi Laksha- Pondi-of Development dweep cherry
1. 2. 36. 37. 38.

164
Annexure-3.2.4 Contd...
(0.26) (0.71) (0.19)
X. GENERAL ECONOMIC SERVICES
1 10 3451 00 Secretariat Economic Services 230.00 17.19 30.00
3452 00 Tourism 545.00 58.75 642.50
3454 00 Surveys & Statistics 385.00 7.01 10.00
3456 00 Civil Supplies 475.00 0.00 319.00
3475 00 Other General Economic Services :
i) Distt. Plg./Distt. Councils 0.00 0.00 0.00
ii) Weights & Measures 40.00 0.00 5.00
iii) Others 0.00 5.09 136.55
1 10 0000 00 TOTAL - (X) 1675.00 88.04 1143.05
(0.44) (0.84) (3.22)
XI. SOCIAL SERVICES EDUCATION
2 21 2202 00 General Education 32330.00 345.75 3085.26
2203 00 Technical Education 5367.00 0.00 1442.98
2204 00 Sports & Youth Services 810.00 128.75 231.78
2205 00 Art & Culture 1281.00 53.50 312.60
2 21 0000 00 Sub-Total (Education) 39788.00 528.00 5072.62
2 22 2210 00 Medical & Public Health 34121.00 211.46 2959.69
2 23 2215 00 Water Supply & Sanitation 52415.00 238.40 1689.00
2 23 2216 00 Housing (incl. police Housing) 3032.00 299.85 763.85
2 23 2217 00 Urban Development (incl.state capital projects) 47890.00 240.00 1681.00
2 24 2220 00 Information & Publicity 260.00 16.15 67.00
2 25 2225 00 Welfare of SCs,STs & OBCs 2400.00 0.00 803.71
2 26 2230 00 Labour & Employment
i) Labour & Labour Welfare 821.00 29.16 301.00
ii) Special Employment Programmes 0.00 0.00 0.00
2 27 2235 00 Social Welfare 3850.00 23.82 1630.79
2 27 2236 00 Nutrition 3430.00 58.70 674.69
2 28 2252 00 Other Social Services 0.00 0.00 0.00
2 00 0000 00 TOTAL - (XI) 188007.00 1645.54 15643.35
(49.48) (15.67) (44.07)
XII. GENERAL SERVICES
3 42 2056 00 Jails 2500.00 0.00 0.00
(Rs. Lakh)
Code No. Major Heads/Minor Heads Delhi Laksha- Pondi-of Development dweep cherry
1. 2. 36. 37. 38.

165
2058 00 Stationery & Printing 0.00 28.85 79.00
2059 00 Public Works 3925.00 0.00 1345.75
2070 00 Other Administrative Services :
i) Training 40.00 0.00 0.00
ii) Others 4547.00 139.95 527.99
3 00 0000 00 TOTAL - (XII) 11012.00 168.80 1952.74
(2.90) (1.61) (5.50)
9 99 9999 99 GRAND TOTAL 380000.00 10498.00 35500.00
(100) (100) (100)
(Rs. Lakh)
Code No. Major Heads/Minor Heads Delhi Laksha- Pondi-of Development dweep cherry
1. 2. 36. 37. 38.
Annexure-3.2.4 Contd...

166
Annexure 3.2.4 Contd...
ANNUAL PLAN - 2001-02 - REVISED OUTLAY - STATES/Uts
(Rs. Lakh)
Code No. Major Heads/Minor Heads Total Total % Age toof Development (UTs) (States Outlay
& UTs) 1. 2. 39. 40. 41.
I. AGRICULTURE & ALLIED ACTIVITIES
1 01 24 0100 Crop Husbandry 1633.83 148491.83 1.68
2402 00 Soil and Water Conservation 471.05 67582.05 0.76
2403 00 Animal Husbandry 1900.93 34007.93 0.38
2404 00 Dairy Development 563.72 5274.72 0.06
2405 00 Fisheries 995.65 17981.65 0.20
2406 00 Forestry & Wild Life 2773.80 140734.80 1.59
2407 00 Plantations 345.00 999.00 0.01
2408 00 Food,Storage & Warehousing 0.00 1079.00 0.01
2415 00 Agricultural Research & Education 513.00 30580.00 0.35
2416 00 Agricultural Financial Institutions 0.00 5513.00 0.06
2435 00 Other Agricultural Programmes :
(a) Marketing & Quality Control 154.00 12377.00 0.14
(b) Others 0.00 0.00 0.00
2425 00 Cooperation 1409.19 34376.19 0.39
1 01 0000 00 Total - (I) 10760.17 498997.17 5.64
(2.21) (5.64)
II. RURAL DEVELOPMENT
1 02 2501 00 Special Programmes for Rural Development :
2501 01 (a) Integrated Rural Development
Programme(IRDP) & Allied Programmes 0.00 119538.00 1.35
2501 02 (b) Drought Prone Area Programme (DPAP) 0.00 36314.00 0.41
2501 04 (c) Integrated Rural Energy Programme (IREP) 336.07 1596.07 0.02
1 02 2505 00 RURAL EMPLOYMENT
2505 01 (a) NREP/Jawahar Rozgar Yojna (JRY) 0.00 114443.00 1.29
2505 60 (b) Other Programmes(like Employment
Guarantee Scheme etc.) 0.00 130569.00 1.48
1 02 2506 00 Land Reforms 164.53 21442.53 0.24
2515 00 Other Rural Development Programmes
(Incl.Community Development and Panchayats) 12130.87 390804.87 4.42
102 0000 00 TOTAL - II 12631.47 814707.47 9.21
(2.59) (9.21)

167
Annexure-3.2.4 Contd...
1 03 0000 00 III. SPECIAL AREA PROGRAMMES 0.00 80989.00 0.92
(0.92)
1 04 0000 00 IV. IRRIGATION & FLOOD CONTROL
1 04 2701 00 Major and Medium Irrigation 60.00 1127487.00 12.74
2702 00 Minor Irrigation 1316.33 195988.33 2.21
2705 00 Command Area Development 18.00 23239.00 0.26
2711 00 Flood Control(incl.anti-sea erosion,etc.) 3329.47 69377.47 0.78
1 04 0000 00 TOTAL - IV 4723.80 1416091.80 16.00
(0.97) (16.00)
V. ENERGY
1 05 2801 00 Power 80115.57 1343161.57 15.18
2810 00 Non-conventional Sources of Energy 819.90 10390.90 0.12
1 05 0000 00 TOTAL - V 80935.47 1353552.47 15.30
(16.59) (15.30)
VI. INDUSTRY & MINERALS
106 2851 00 Village & Small Industries 6736.86 100108.86 1.13
2852 00 Industries (other than V&SI) 3320.00 113753.00 1.29
2853 02 Mining 0.00 10931.00 0.12
1 06 0000 00 TOTAL - (VI) 10056.86 224792.86 2.54
(2.06) (2.54)
VII. TRANSPORT
1 07 3051 00 Ports and light Houses 1425.00 3346.00 0.04
3052 00 Shipping 10237.77 10237.77 0.12
3053 00 Civil Aviation 1900.00 6161.00 0.07
3054 00 Roads and Bridges 42978.51 906275.51 10.24
3055 00 Road Transport 59777.11 215976.11 2.44
3056 00 Inland Water Transport 60.73 1742.73 0.02
3075 00 Other Transport Services 23.00 18155.00 0.21
1 07 0000 00 TOTAL - (VII) 116402.12 1161894.12 13.13
(23.86) (13.13)
1 08 0000 00 VIII. COMMUNICATIONS 98.68 959.68 0.01
(0.01)
(Rs. Lakh)
Code No. Major Heads/Minor Heads Total Total % Age toof Development (UTs) (States Outlay
& UTs)1. 2. 39. 40. 41.

168
Annexure-3.2.4 Contd...
IX. SCIENCE,TECHNOLOGY &
ENVIRONMENT
1 09 3425 00 Scientific Research (incl. S&T) 523.84 20027.84 0.23
3435 00 Ecology & Environment 813.57 20169.57 0.23
TOTAL - (IX) 1337.41 40197.41 0.45
(0.27) (0.45)
X. GENERAL ECONOMIC SERVICES
1 10 3451 00 Secretariat Economic Services 429.19 92632.19 1.05
3452 00 Tourism 2180.25 34621.25 0.39
3454 00 Surveys & Statistics 453.01 3127.01 0.04
3456 00 Civil Supplies 1121.00 7641.00 0.09
3475 00 Other General Economic Services :
i) Distt. Plg./Distt. Councils 0.00 41173.00 0.47
ii) Weights & Measures 48.00 2175.00 0.02
iii) Others 161.64 31020.64 0.35
1 10 0000 00 TOTAL - (X) 4393.09 212390.09 2.40
(0.90) (2.40)
XI. SOCIAL SERVICES EDUCATION
2 21 2202 00 General Education 41093.81 634795.81 7.17
2203 00 Technical Education 7244.98 42233.98 0.48
2204 00 Sports & Youth Services 1488.53 22571.53 0.26
2205 00 Art & Culture 1975.10 16244.10 0.18
2 21 0000 00 Sub-Total (Education) 51802.42 715845.42 8.09
2 22 2210 00 Medical & Public Health 43539.20 363280.20 4.11
2 23 2215 00 Water Supply & Sanitation 58304.00 578194.00 6.53
2 23 2216 00 Housing (incl. police Housing) 6575.90 243090.90 2.75
2 23 2217 00 Urban Development (incl.state capital projects) 56007.00 419049.00 4.74
2 24 2220 00 Information & Publicity 443.15 13974.15 0.16
2 25 2225 00 Welfare of SCs,STs & OBCs 3367.71 195511.71 2.21
2 26 2230 00 Labour & Employment
i) Labour & Labour Welfare 1303.16 23377.16 0.26
ii) Special Employment Programmes 0.00 3166.00 0.04
2 27 2235 00 Social Welfare 5718.61 121488.61 1.37
(Rs. Lakh)
Code No. Major Heads/Minor Heads Total Total % Age toof Development (UTs) (States Outlay
& UTs)1. 2. 39. 40. 41.

169
Annexure-3.2.4 Contd...
2 27 2236 00 Nutrition 4586.24 89661.24 1.01
2 28 2252 00 Other Social Services 11.00 11184.00 0.13
2 00 0000 00 TOTAL - (XI) 231658.39 2777822.39 31.39
(47.49) (31.39)
XII. GENERAL SERVICES
3 42 2056 00 Jails 2610.00 7291.00 0.08
2058 00 Stationery & Printing 154.85 6767.85 0.08
2059 00 Public Works 6169.75 57473.75 0.65
2070 00 Other Administrative Services :
i) Training 40.00 517.00 0.01
ii) Others 5803.94 194907.94 2.20
3 00 0000 00 TOTAL - (XII) 14778.54 266957.54 3.02
(3.03) (3.02)
9 99 9999 99 GRAND TOTAL 487776.00 8849352.00 100.00
(100) (100)
(Rs. Lakh)
Code No. Major Heads/Minor Heads Total Total % Age toof Development (UTs) (States Outlay
& UTs)1. 2. 39. 40. 41.

170
FOOTNOTES
* Revision not sought by State Govt. Aproved Outaly repeated.
ANDHRA PRADESH
1) Includes Rs. 15 lakhs for CD & Panchayats and Rs.15205 lakhs for Assistance toLocal Bodies.
2) For Traffic Control
3) For Legal Metrology.
4) Includes Rs. 781 lakhs for Court Building ; Rs.35 lakhs for AP Police AcademyComplex; Rs. 756 lakhs for Mandal Bindings; Rs. 633 lakhs for Institute ofAdministration; Rs. 402 lakhs for Dir. Fire Service; Rs. 5780 lakhs for Modernisationof Police force and Rs. 379 lakhs for NALSAR.
ARUNACHAL PRADESH
1) Includes Rs. 30 lakhs for Directorate of Transport and Rs. 8 lakhs for Roads safetyprogramme.
2) Includes Rs. 1211 lakhs for MLALAD Schemes and Rs. 12 lakhs for Small Savings.
3) Includes Rs. 72 lakhs for ITI and Rs. 22 lakhs for Employment Exchange.
4) For NRY /SJSRY
5) Includes Rs. 54 lakhs for Infrastructure Facility for Judiciary; Rs.141 lakhs for PoliceAdmn.; Rs. 100 lakhs for Fire Service; Rs. 201 lakhs for Prison Admin; Rs. 15 lakhsfor Fiscal Admn;
ASSAM
1) Includes Rs. 9511 lakhs for Shelter & Rural Roads for PMGY and Rs. 2242 lakhs forother Rural Deve. Programme.
2) Includes Rs. 18 lakhs for Public Enterprises and Rs. 150 lakhs for Administration ofJustice.
3) Includes Rs. 200 lakhs for Special Employment Programme .
BIHAR
1) Includes Rs. 4100 lakhs for Emp. Assurance Scheme and Rs. 10600 lakhs for IndiraAwas Yojana also.
2) Includes Rs. 3308 lakhs for Community Dev; Rs. 28177 lakhs for Panchayats; Rs.8603 lakhs for others-PMGY- IAY and Rs. 22650 lakhs for MLA-MLC schemes.
3) Includes Rs. 28 lakhs for monitoring of twenty point programme ; Rs. 100 lakhs forman power training; Rs. 500 lakhs for District Re-organization; Rs. 200 lakhs forMinority Financing; Rs. 203 lakhs computerization of treasuries and Rs. 200 lakhs forComputerization of Commercial Taxes.

171
CHATTISGARH
1) Includes Rs. 11000 lakhs for Rural Roads also.
GOA
1) Includes Rs. 25 lakhs DRDA Administration also.
2) Includes Rs. 500 lakhs for Information Technology.
3) For Railways.
4) Includes Rs. 70 lakhs for Judicial Administration; Rs. 17 lakhs for Accounts and Rs.2000 lakhs for Finance.
GUJARAT
1) Includes Rs. 491 lakhs for Spl. Emp. Generation Prog; Rs. 5902 lakhs for Indira AwasYojana; Rs. 1204 lakhs for Employment Assurance Scheme and Rs. 4000 lakhs forSampuran Gram Rozgar Yojana.
2) Includes Rs. 3130 for Com Dev. & Panchayats; Rs. 27 lakhs for Strengtheing TrainingFacilities for Rural Development; Rs. 358 lakhs for DRDA Administration; Rs. 18lakhs for Regional Rural Banks; Rs.219 lakhs for Earmarking for TASP; Rs.4 lakhsfor State Water Shed Programme on demand; Rs.457 lakhs for Water shed Project(NABARD); Rs. 5264 for Gokul Gram Yojana; and Rs. 1108 lakhs for DesertDevelopment prog.
3) Includes Rs. 7378 lakhs for Mid day meals programme.
4) For Border Area Dev. Programme.
HARYANA
1) Includes Rs. 317 lakhs for horticulture also.
2) Includes Rs. 5252 lakhs for Rural Roads and Rs. 3160 lakhs for Comm.Deve.&Panchayats.
HIMACHAL PRADESH
1) For Consumer Commission.
JHARKHAND
1) Included under Forestry & wildlife.
2) Included under IRDP and Allied Programmes.
3) Indcluded under General Education.
4) Included under Sports & Youth Services.
KARNATAKA
1) Includes Rs. 426 lakhs for DRDA Administration.
2) Includes Rs. 304 lakhs for Desert Dev. Progamme.

172
3) Includes Rs. 10 lakhs for Wasteland Dev.Programme also.
4) For Pollution control.
5) Includes Rs. 86 lakhs for Modernization of Administration; Rs. 19600 lakhs forTransfer of Cess to Infrastructure initiative fund and Rs. 2308 for TechnicalAssistance to VAT (WBA).
6) Includes Rs. 642 lakhs for Saree Dhoti Scheme and Rs.230 lakhs for ConsumerWelfare.
7) Includes Rs. 121 lakhs for Fire protection; Rs.39 lakhs for Administration of Justice;Rs.41 lakhs for Governance to Administrative Reforms and Rs. 495 lakhs HumanResource Development.
KERALA
1) For Plan assistance to Local Bodies.
MAHARASHTRA
1) Includes Rs. 26194 lakhs for Panchayati Raj; Rs. 1462 lakhs for Rural SanitationProgramme;Rs. 45 lakhs for Activities for Cremation & Burial;Rs. 36 lakhs for Grant-in-aid to YASHADA; Rs. 109 lakhs for International Fund for Agriculture and Rs. 4lakhs for Rural Group Life Insurance.
2) For States participation in Konkan Railway Project.
3) For Employment and Self Employment Programme.
4) Includes Rs. 307 lakhs for Maharashtra Earthquake Rehabilitation Prog; Rs. 10000lakhs for unallocated Additional Outlay for SDB; Rs. 3382 lakhs for Vidarbhadevelopment prog.; Rs. 2243 lakhs for Maharashtra Development Prog.; Rs.1954lakhs for Konkan deve. Prog. Rs. 3671 lakhs for undistributed S.C.P/T.S.P. and Rs,.5200 lakhs for Sihansth Kumbharnela.
MADHYA PRADESH
1) Includes Rs. 1607 lakhs for Rural Raods and Rs. 2497 lakhs for Rural Housing also.
2) Includes Rs. 1098 lakhs for Women & Child Welfare.
MANIPUR
1) Includes Rs. 236 laks for Horticulture.
2) Includes Rs. 221 lakhs for IAY and Rs. 209 lakhs for EAS.
3) Includes Rs. 550 lakhs for Other Rural Dev. Prog.; Rs. 2000 lakhs for Rural Roads &Rs. 600 lakhs for MLA Local Area Deve. Prog. And Rs. 298 lakhs for CommunityDev. & Panchayats.
4) Includes Rs.220 lakhs for Sericulture also.
5) Includes Rs. 1000 lakhs for Special Dev. Fund also.
6) Includes Rs. 12 lakhs for Motor Vehicle and Rs. 15 lakhs for City Bus Terminal.

173
7) Includes Rs. 151 lakhs for Police Upgradation; Rs.38 lakhs for SAT; Rs. 9 lakhs forLegal aid & advice; Rs. 100 lakhs for National Highway Patrolling Scheme; Rs. 50lakhs for District Admn; Rs. 25 lakhs for Judicial Administration; Rs. 25 lakhs forFiscal Administration and Rs. 50 lakh for GAD and Rs. 40 lakhs for Fire Services.
MEGHALAYA
1) Includes Rs. 293 lakhs for IAY and Rs. 319 lakhs for EAS.
2) Inclues Rs. 52 lakhs for Research & Training in Rural Development; Rs. 1708 lakhsfor special Fund Works Programme and Rs. 460 lakhs for Community Dev. &Panchayats.
3) For Motor Vehicle.
4) For Voluntary Action fund.
5) Includes Rs. 96 lakhs for Fire Protection; Rs. 142 lakhs for Police Housing and Rs. 10lakhs for Judiciary Building.
MIZORAM
1) Includes Rs. 610 lakhs for Horticulture.
2) Includes Rs. 110 lakhs for IAY and Rs. 116 lakhs for Employment AssuranceScheme New Land Use Policy (NLUP)
3) Includes provision for Civil Aviation also.
4) For M.V. Wing.
5) For Law & Judicial.
NAGALAND
1) Includes Rs. 160 lakhs for Horticulture.
2) Includes Rs. 80 lakhs for IAY and Rs. 90 lakhs for EAS.
3) Includes Rs. 453 lakhs for Rural Housing; Rs. 400 lakhs for Rural Connectivity; Rs.45 lakhs SIRD and Rs. 1708 lakhs for Community Dev. & Panchayats.
4) Includes Rs. 127 lakhs for Sericulture.
5) Includes Rs. 392 lakhs for Mechanical Engg. And Rs/ 45 lakhs for Vehicular pollutionControl.
6) Includes Rs. 55 lakhs for Evaluation and Rs. 95 lakhs for Judiciary.
7) Includes Rs. 350 lakhs for Assembly Complex; Rs.50 lakhs for Fiscal Administration;Rs. 200 lakhs for Police Administration; Rs. 172 lakhs for Computer Trg. For Schoolchildren and Rs. 45 lakhs for Fire Services.
ORISSA
1) Includes Rs. 55 lakhs for Share Capital to RRBs; Rs203 lakhs for LTAP and otherProgrammes; Rs.3000 lakhs for Grants to WODC and Rs. 80 lakhs for FiscalAdministration and Rs. 25 lakhs for Human Development Report.

174
2) Includes Rs. 355 lakhs for Police Welfare & Buildings and Rs. 3000 lakhs forRestoration & Reconstruction Works.
PUNJAB
1) For BADP.
RAJASTHAN
1) Includes Rs. 998 lakhs for Indira Awas Yojana and Rs. 2258 lakhs for AssuredEmployment Programme.
2) Includes Rs. 171 lakhs for Women Development; Rs. 501 lakhs for DRDAAdministration; Rs. 2029 lakhs for Desert Dev.Programme; Rs. 27596 lakhs for RuralDevelopment & Panchayats and Rs. 13125 lakhs for MLA Local Area DevelopmentScheme.
3) For Rajasthan Agri. Marketing Board.
4) Includes Rs. 225 lakhs for Setting up of Rajasthan Foundation Fund and Rs. 1873lakhs for Resource Dev. Fund.
SIKKIM
1) Includes Rs. 162 lakhs for Women & Child Welfare also.
2) Includes Rs. 20 lakhs for Fiscal Reforms ; Rs. 167 lakhs for Modernisation of PoliceAdmn; Rs. 20 lakhs for Fire Services and Rs. 20 lakhs for Judicial Administration.
TRIPURA
1) Includes Rs. 428 lakhs for IAY; Rs. 377 lakhs for EAS and Rs. 1 lakhs forEmployment Cell.
2) Includes Rs. 35 lakhs for Planning & Deve. Cell and Rs. 1364 lakhs for VillegeCommunication.
3) Includes Rs. 53 lakhs for Judicial Admn.; Rs. 8 lakhs for Legal Aid & Advices and Rs.477 lakhs for other Administrative Services.
A&N ISLANDS
$ Provision included under General Education.
1) Includes Rs. 50 lakhs for local Audit Fund; Rs. 25 lakhs for Issue of Identity cards;Rs. 125 lakhs for strengthening of judiciary; Rs. 50 lakhs for modernisation of Govt.Press; and Rs. 150 lakhs for strengthening of Police Deptt.
CHANDIGARH
1) Includes Rs. 57 lakhs for Rural Water Supply; Rs. 50 lakhs for Rural Sewerage andRs. 65 lakhs for Community Development.
2) Includes Rs. 8 lakhs for Road Safety and Rs. 13 lakhs for Enforcement of MV Act.
3) Includes Rs. 105 lakhs for fire protection.

175
DADRA & NAGAR HAVELI
1) For setting up of P.A.O.’s office.
2) For fire protection and control.
DAMAN & DIU
1) For Accounts Service.
LAKSHADWEEP
1) Includes Rs. 42 lakhs for Fire Services; Rs. 96.60 lakhs for Information & Technologyand Rs. 0.50 lakhs for Police.
PONDICHERRY
1) For Computerization.

176
Annexure 3.2.5
Budget Estimates of Central Ministries/Departments for the Annual Plan (2002-03)Internal and Extra-Budgetary Resources
(Rs. Crore)
MINISTRIES/ Gross Internal Bonds ECBs/ Total Total TotalDEPARTMENTS Budget Resource Supplier Others EBR IEBR Outlay
Support (IR) Credits
I MINISTRY OF 3317.00 0.00 0.00 0.00 0.00 0.00 0.00 3317.00AGRICULTURE
a. Department of Agriculture 2167.00 0.00 0.00 0.00 0.00 0.00 0.00 2167.00and Cooperation
b. Department of Agricultural 775.00 0.00 0.00 0.00 0.00 0.00 0.00 775.00Research & Education
c. D/Animal Husbandry 300.00 0.00 0.00 0.00 0.00 0.00 0.00 300.00and Dairying
d. Department of Food 75.00 0.00 0.00 0.00 0.00 0.00 0.00 75.00Processing -ing Industries.
MINISTRY OF AGRO 580.00 0.00 0.00 0.00 0.00 0.00 0.00 580.00AND RURAL INDSTRIES
II MINISTRY OF 335.00 482.89 35.55 0.00 258.06 293.61 776.50 1111.50CHEMICALS ANDFERTILIZERS
a. Department of Chemicals 55.00 97.45 35.55 0.00 24.50 60.05 157.50 212.50and Petro-Chemicals
b. Department of Fertilizers 280.00 385.44 0.00 0.00 233.56 233.56 619.00 899.00
III MINISTRY OF CIVIL 69.00 2415.56 0.00 0.00 36.63 36.63 2452.19 2521.19AVIATION
IV MINISTRY OF COAL 561.50 1907.14 0.00 17.66 2258.17 2275.83 4182.97 4744.47& MINES
a. Department of Coal 327.00 1605.14 17.66 1541.67
b. Department of Mines 234.50 302.00 716.50
V MINISTRY OF 1055.00 2.00 0.00 0.00 0.00 0.00 2.00 1057.00COMMERCE ANDINDUSTRY
a. Department of Commerce 775.00 2.00 0.00 0.00 0.00 0.00 2.00 777.00
b Department of Industrial 280.00 0.00 0.00 0.00 0.00 0.00 0.00 280.00Development & Ind.policyand Promotion
VI MINISTRY OF COMM- 805.00 11524.02 4902.00 0.00 2975.35 7877.35 19401.37 20206.37UNICATIONS ANDINFORMATIONTECHNOLOGY
a. Department of Posts 150.00 0.00 0.00 0.00 0.00 0.00 0.00 150.00
b. Department of 185.00 11494.79 4902.00 0.00 2881.00 7783.00 19277.79 19462.79Telecommunications
c. Department of InformationTechnology 470.00 29.23 94.35

177
VII DEPARTMENT OF 19.90 0.00 0.00 0.00 0.82 0.82 0.82 20.72DEVELOPMENT OFNORTH EASTERNREGION
VIII MINISTRY OF 990.00 0.00 0.00 0.00 0.00 0.00 0.00 990.00ENVIRONMENTAND FORESTS
IX MINISTRY OFEXTERNAL AFFAIRS 600.00 0.00 0.00 0.00 0.00 0.00 0.00 600.00
X MINISTRY OF 524.91 0.00 0.00 0.00 0.00 0.00 0.00 524.91FINANCE
a. Dept. of Economic Affairs 454.65 0.00 0.00 0.00 0.00 0.00 0.00 454.65
b. Currency, Coinage and 14.00Stamps
c. Payments to Financial 54.95Institutions
d. Department of Expenditure 0.31 0.00 0.00 0.00 0.00 0.00 0.00 0.31
e. Department of Revenue 1.00 0.00 0.00 0.00 0.00 0.00 0.00 1.00
XI M/CONSUMER 54.48 100.00 0.00 0.00 0.00 0.00 100.00 154.48FOOD AND PUBLICDISTRIBUTION
a. D/Public Distribution 44.23 100.00 0.00 0.00 0.00 0.00 100.00 144.23
b. D/Consumer Affairs 10.25 0.00 0.00 0.00 0.00 0.00 0.00 10.25
XII MINISTRY OF 6630.00 0.00 0.00 0.00 0.00 0.00 0.00 6630.00AFFAIRS, HEALTH &FAMILY WELFARE
a. Department of Health 1550.00 0.00 0.00 0.00 0.00 0.00 0.00 1550.00
b. D/ ISM & H 150.00 0.00 0.00 0.00 0.00 0.00 0.00 150.00
c. Department of Family 4930.00 0.00 0.00 0.00 0.00 0.00 0.00 4930.00Welfare
XIII MINISTRY OF HOME 250.00 0.00 0.00 0.00 0.00 0.00 0.00 250.00AFFAIRS
XIV MINISTRY OF HUMAN 9225.00 0.00 0.00 0.00 0.00 0.00 0.00 9225.00RESOURCEDEVELOPMENT
a. D/Elementary Education 4900.00 0.00 0.00 0.00 0.00 0.00 0.00 4900.00and Literacy
b. D/Secondary Education and 2125.00 0.00 0.00 0.00 0.00 0.00 0.00 2125.00Higher Education
c. Department of Women and 2200.00 0.00 0.00 0.00 0.00 0.00 0.00 2200.00Child Development
XV M/HEAVY INDUSTRIES 110.00 299.03 0.00 0.00 20.00 20.00 319.03 429.03AND PUBLICENTERPRISES
(Rs. Crore)
MINISTRIES/ Gross Internal Bonds ECBs/ Total Total TotalDEPARTMENTS Budget Resource Supplier Others EBR IEBR Outlay
Support (IR) Credits
Annexure-3.2.5 Contd...

178
Annexure-3.2.5 Contd...
a. D/Heavy Industry 100.00 299.03 0.00 0.00 26.11 325.14 425.14
b. D/Public Enterprises 10.00 0.00 0.00 0.00 0.00 0.00 0.00 10.00
XVI MINISTRY OF 415.00 463.00 0.00 0.00 0.00 0.00 463.00 878.00INFORMATION ANDBROADCASTING
XVII MINISTRY OF LABOUR 170.00 0.00 0.00 0.00 0.00 0.00 0.00 170.00
XVIII MINISTRY OF LAW, 130.00 0.00 0.00 0.00 0.00 0.00 0.00 130.00JUSTICE & COMPANYAFFAIRS
XIX M/NON-CONVEN- 625.00 151.48 50.00 225.00 50.00 325.00 476.48 1101.48TIONAL ENERGYSOURCES
XX M/PERSONNEL, 35.00 0.00 0.00 0.00 0.00 0.00 0.00 35.00PUBLIC GRIEVANCES& PENSIONS
XXI MINISTRY OF 0.00 13789.48 515.00 1000.00 2684.01 4199.01 17988.49 17988.49PETROLEUM ANDNATURAL GAS
XXII MINISTRY OF 23.21 0.00 0.00 0.00 0.00 0.00 0.00 23.21PLANNING
XXIII MINISTRY OF POWER 3300.00 1797.17 4025.55 2781.90 1578.38 8385.83 10183.00 13483.00
XXIV M/RURAL 13670.00 0.00 0.00 0.00 0.00 0.00 0.00 13670.00DEVELOPMENT
a. D/Rural Development 10270.00 0.00 0.00 0.00 0.00 0.00 0.00 10270.00
b. D/Land Resources 1000.00 0.00 0.00 0.00 0.00 0.00 0.00 1000.00
c. D/Drinking Water Supply 2400.00 0.00 0.00 0.00 0.00 0.00 0.00 2400.00
XXV M/SCIENCE & 1290.00 0.00 0.00 0.00 0.00 0.00 0.00 1290.00TECHNOLOGY
a. D/Science & Technology 625.00 0.00 0.00 0.00 0.00 0.00 0.00 625.00
b. Dept. of Scientific andIndustrial Research 440.00 0.00 0.00 0.00 0.00 0.00 0.00 440.00
c. Department of Bio- 225.00 0.00 0.00 0.00 0.00 0.00 0.00 225.00Technology
XXVI MINISTRY OF SMALL 350.00 28.00 0.00 0.00 57.00 57.00 85.00 435.00SCALE & AGRO &RURAL INDUSTRIES
XXVII MINISTRY OFSTATISTICS AND 128.00 0.00 0.00 0.00 0.00 0.00 0.00 128.00PROGRAMMEIMPLEMENTATION
XXVIII MINISTRY OF STEEL 12.00 802.00 0.00 0.00 595.00 595.00 1397.00 1409.00
XXIV MINISTRY OF ROAD 5905.92 0.00 6200.00 0.00 0.00 6200.00 6200.00 12105.92TRANSPORT &HIGHWAYS
(Rs. Crore)
MINISTRIES/ Gross Internal Bonds ECBs/ Total Total TotalDEPARTMENTS Budget Resource Supplier Others EBR IEBR Outlay
Support (IR) Credits

179
Annexure-3.2.5 Contd...
XXX MINISTRY OFSHIPPING 425.00 1153.61 0.00 1025.75 116.00 1141.75 2295.36 2720.36
XXXI MINISTRY OF 715.00 21.00 0.00 0.00 0.00 0.00 21.00 736.00TEXTILES
XXXII MINISTRY OF 475.00 0.00 0.00 0.00 0.00 0.00 0.00 475.00TOURISM
a. D/Tourism 225.00 0.00 0.00 0.00 0.00 0.00 0.00 225.00
b. D/Culture 250.00 0.00 0.00 0.00 0.00 0.00 0.00 250.00
XXXIII MINISTRY OF TRIBAL 290.00 0.00 0.00 0.00 0.00 0.00 0.00 290.00AFFAIRS
XXXIV M/URBAN DEVELOP- 1525.00 409.74 3049.40 0.00 182.90 3232.30 3642.04 5167.04MENT AND POVERTYALLEVIATION
XXXV MINISTRY OF WATER 550.00 0.00 0.00 0.00 0.00 0.00 0.00 550.00RESOURCES
XXXVI MINISTRY OF SOCIAL 1410.00 0.00 0.00 0.00 0.00 0.00 0.00 1410.00JUSTICE ANDEMPOWERMENT
XXXVII MINISTRY OF YOUTH 285.00 0.00 0.00 0.00 0.00 0.00 0.00 285.00AFFAIRS AND SPORTS
XXXVIII DEPT. OF ATOMIC 2500.00 240.60 0.00 0.00 0.00 0.00 240.60 2740.60ENERGY
XXXIX DEPT. OF OCEAN 175.00 0.00 0.00 0.00 0.00 0.00 0.00 175.00DEVELOPMENT
XXXX DEPT. OF SPACE 1950.00 0.00 0.00 0.00 0.00 0.00 0.00 1950.00
XXXXI MINISTRY OF 5390.00 3940.00 3000.00 0.00 0.00 3000.00 6940.00 12330.00RAILWAYS
GRAND TOTAL 66870.92 39526.72 21777.50 5050.31 10812.32 37640.13 77166.85 144037.77
(Rs. Crore)
MINISTRIES/ Gross Internal Bonds ECBs/ Total Total TotalDEPARTMENTS Budget Resource Supplier Others EBR IEBR Outlay
Support (IR) Credits
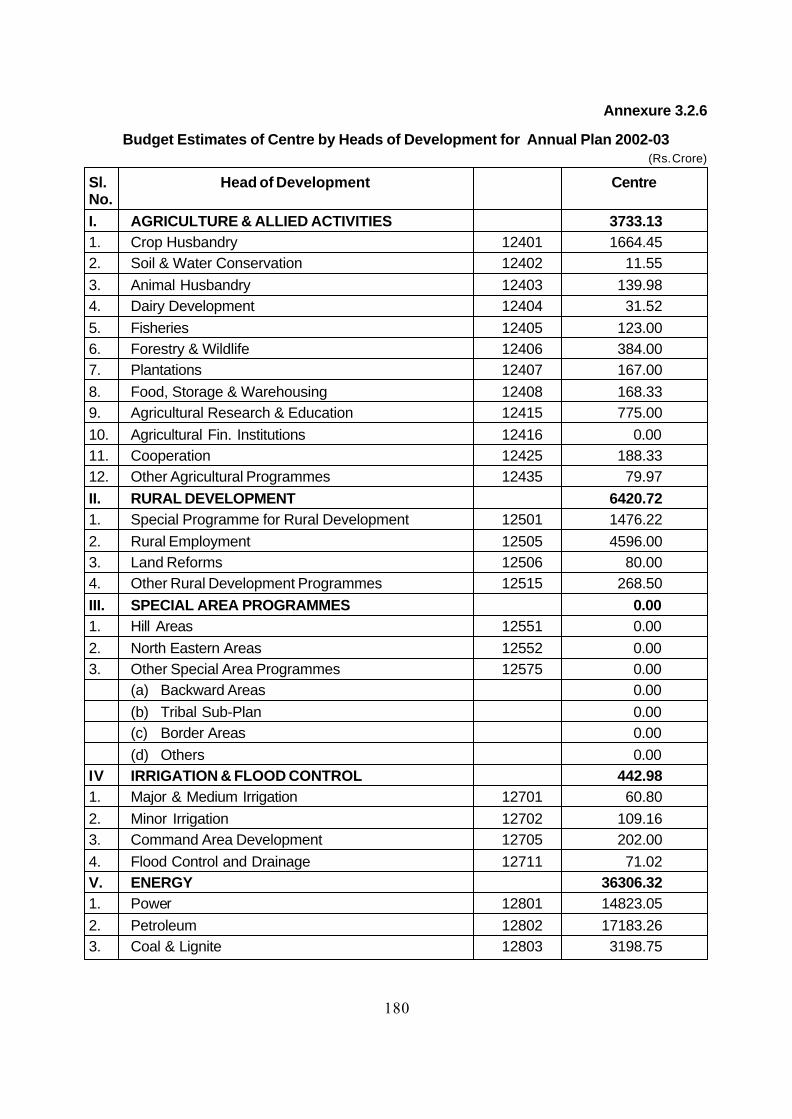
180
Annexure 3.2.6
Budget Estimates of Centre by Heads of Development for Annual Plan 2002-03(Rs. Crore)
Sl. Head of Development CentreNo.I. AGRICULTURE & ALLIED ACTIVITIES 3733.131. Crop Husbandry 12401 1664.452. Soil & Water Conservation 12402 11.55
3. Animal Husbandry 12403 139.984. Dairy Development 12404 31.52
5. Fisheries 12405 123.006. Forestry & Wildlife 12406 384.007. Plantations 12407 167.00
8. Food, Storage & Warehousing 12408 168.339. Agricultural Research & Education 12415 775.00
10. Agricultural Fin. Institutions 12416 0.0011. Cooperation 12425 188.3312. Other Agricultural Programmes 12435 79.97
II. RURAL DEVELOPMENT 6420.721. Special Programme for Rural Development 12501 1476.22
2. Rural Employment 12505 4596.003. Land Reforms 12506 80.004. Other Rural Development Programmes 12515 268.50
III. SPECIAL AREA PROGRAMMES 0.001. Hill Areas 12551 0.00
2. North Eastern Areas 12552 0.003. Other Special Area Programmes 12575 0.00
(a) Backward Areas 0.00
(b) Tribal Sub-Plan 0.00(c) Border Areas 0.00
(d) Others 0.00IV IRRIGATION & FLOOD CONTROL 442.981. Major & Medium Irrigation 12701 60.80
2. Minor Irrigation 12702 109.163. Command Area Development 12705 202.00
4. Flood Control and Drainage 12711 71.02V. ENERGY 36306.321. Power 12801 14823.05
2. Petroleum 12802 17183.263. Coal & Lignite 12803 3198.75

181
4. Non Conventional Sources of Energy 12810 1101.26
VI. INDUSTRY & MINERALS 7993.011. Village & Small Industries 12851 1212.772. Iron & Steel Industries 12852 1417.503. Non Ferrous Mining & Metallurgical Industries 12853 1243.014. Cement & Non-metallic Mineral Industries 12854 31.755. Fertilizer Industries 12855 899.006. Petrochemical Industries 12856 936.74
7. Chemical & Pharmaceutical Industries 12857 67.968. Engineering Industries 12858 416.869. Telecommunication & Electronic Industries 12859 521.8810. Consumer Industries 12860 489.2011. Atomic Energy Industries 12861 481.0912. Other Industries 12875 194.9013. Other Outlays on Industries & Minerals 12885 80.35
VII. TRANSPORT 32041.371. Railways 13002 12330.002. Ports & Lighthouses 13051 1005.003. Shipping 13052 1562.264. Civil Aviation 13053 2521.195. Roads & Bridges 13054 14542.926. Road Transport 13055 0.007. Inland Water Transport 13056 55.00
8. Other Transport Services 13075 25.00VIII. COMMUNICATION 19539.791. Postal Services 13201 150.002. Telecommunication Services 13225 18069.063. Other Communication Services 13275 1320.73IX. SCIENCE, TECHNOLOGY & ENVIRONMENT 4413.801. Atomic Energy Research 13401 535.00
2. Space Research 13402 1950.003. Oceanographic Research 13403 175.004. Other Scientific Research 13425 1228.805. Ecology & Environment 13435 525.00X. GENERAL ECONOMIC SERVICES 1785.141. Secretariat Economic Services 13451 193.612. Tourism 13452 225.003. Foreign Trade & Export Promotion 13453 530.00
(Rs. Crore)
Sl. Head of Development CentreNo.
Annexure-3.2.6 Contd...

182
4. Census, Surveys & Statistics 13454 114.205. Meteorology 13455 60.006. Civil Supplies 13456 14.557. General Financial & Trading Institutions 13465 0.008. Technical & Economic Cooperation with other 13605 600.00
Countries9. Other General Economic Services 13475 47.78XI. SOCIAL SERVICES 30927.971. General Education 22202 5838.912. Technical Education 22203 582.303. Sports & Youth Services 22204 255.824. Art & Culture 22205 227.105. Medical & Public Health 22210 1527.006. Family Welfare 22211 4521.007. Water Supply & Sanitation 22215 2359.308. Housing 22216 4698.479. Urban Development 22217 1635.2710. Information and Publicity 22220 52.7011. Broadcasting 22221 745.5012. Welfare of SC,ST and Other Backward Classes 22225 1369.8313. Labour & Employment 22230 151.7714. Social Security & Welfare 22235 2269.1015. Nutrition 22236 2.8016. Secretariat Social Services 22251 7.7517. Other Social Services 22250 4.0018. North Eastern Areas 22552 4679.35XII. GENERAL SERVICES 433.541. Administration of Justice 32014 109.002. Currency, Coinage and Mints 32046 14.003. Other Fiscal Services 32047 0.004. Secretariat-General Services 32052 9.305. Police 32055 228.206. Jails 32056 0.007. Supplies and Disposals 32057 2.008. Stationery & Printing 32058 0.009. Public Works 32059 35.0010. Other Administrative Services 32070 31.3911 Miscellaneus General Services 32075 4.65
GRAND TOTAL 144037.77Note: The Budget Estimates for States/Uts are not yet available
(Rs. Crore)
Sl. Head of Development CentreNo.
Annexure-3.2.4 Contd...