Plaintiffs-Appellees Opening Brief – part 2 · Governor’s recommended expenditures by $248.9...
98
Appendix G: Demonstrative Funding Comparisons ELECTRONICALLY FILED 2017 Jun 30 PM 4:50 CLERK OF THE APPELLATE COURT CASE NUMBER: 113267
Transcript of Plaintiffs-Appellees Opening Brief – part 2 · Governor’s recommended expenditures by $248.9...

Appendix G:
Demonstrative Funding Comparisons
ELECTRONICALLY FILED2017 Jun 30 PM 4:50
CLERK OF THE APPELLATE COURTCASE NUMBER: 113267

Comparison of Bases and Increases to State BOE recommendations over two years
State BOE recommendation SB19
SB19 compared to State BOE recommendation
Base Year1 4,604 4,006 -5982 5,090 4,128 -962
Annual Increased Cost
1 565,691,752 194,705,228 -370,986,524Additional year 2 327,805,945 97,858,910 -229,947,035
Two year total increase 893,497,697 292,564,138 -600,933,559
Percentage of 2 year plan to State
BOE recommendation 33%
S:\S\SFL\[991332a CompareSB19StateBOEBaseovertwoyears 6-4-17.xlsx]Sheet1
2017ADEQ00043

Comparison of SB19 Base and Increases to Trial Court $4980 recommendations over two years
Trial court $4980 base SB19
SB19 compared to Trial court $4980
Base Year1 4,980 4,006 -9742 5,055 4,128 -927
Annual Increased Cost
1 768,713,275 194,705,228 -574,008,047Additional year 2 51,111,255 97,858,910 46,747,655
Two year total increase 819,824,530 292,564,138 -527,260,392
Percentage of 2 year plan to Trial
Court $4980 recommendation 36%
681,483 (assumed weightied enrollment from FY17 from KLRD in Appendix Z)(assumed year 2 inflation at 1.5% as used by KSDE in SF17-232 at Appendix B 2017ADEQ00021)
S:\S\SFL\[991332b CompareSB19Trialcourt4980Baseovertwoyears 6-29-17.xlsx]Sheet1
2017ADEQ00044

Comparison of SB19 Base and Increases indicated by Averaged Cost Studies over two years
Average of Cost Studies base = $6347 SB19
SB19 compared to Averaged Cost Studies
Base Year1 6,347 4,006 -2,3412 6,442 4,128 -2,314
Annual Increased Cost
1 1,700,301,083 194,705,228 -1,505,595,855Additional year 2 64,880,627 97,858,910 32,978,283
Two year total increase 1,765,181,710 292,564,138 -1,472,617,572
Percentage of 2 year plan to Cost
Studies recommendation 17%
681,483 (assumed weightied enrollment from FY17 from KLRD in Appendix Z)(assumed year 2 inflation at 1.5% as used by KSDE in SF17-232 at Appendix B 2017ADEQ00021)
S:\S\SFL\[991332b CompareSB19CostStudiesBaseovertwoyears 6-29-17.xlsx]Sheet1
2017ADEQ00045

Appendix H:
Demonstrative Inflation Exhibit
Appx. H is a demonstrative exhibit that draws its data from publically available reports. See Appx. H, at 2017ADEQ00046. It is appropriate to take judicial notice of these reports, and Plaintiffs respectfully request that this Court do so. K.S.A. 60-409(b)(4); K.S.A. 60-412(c).
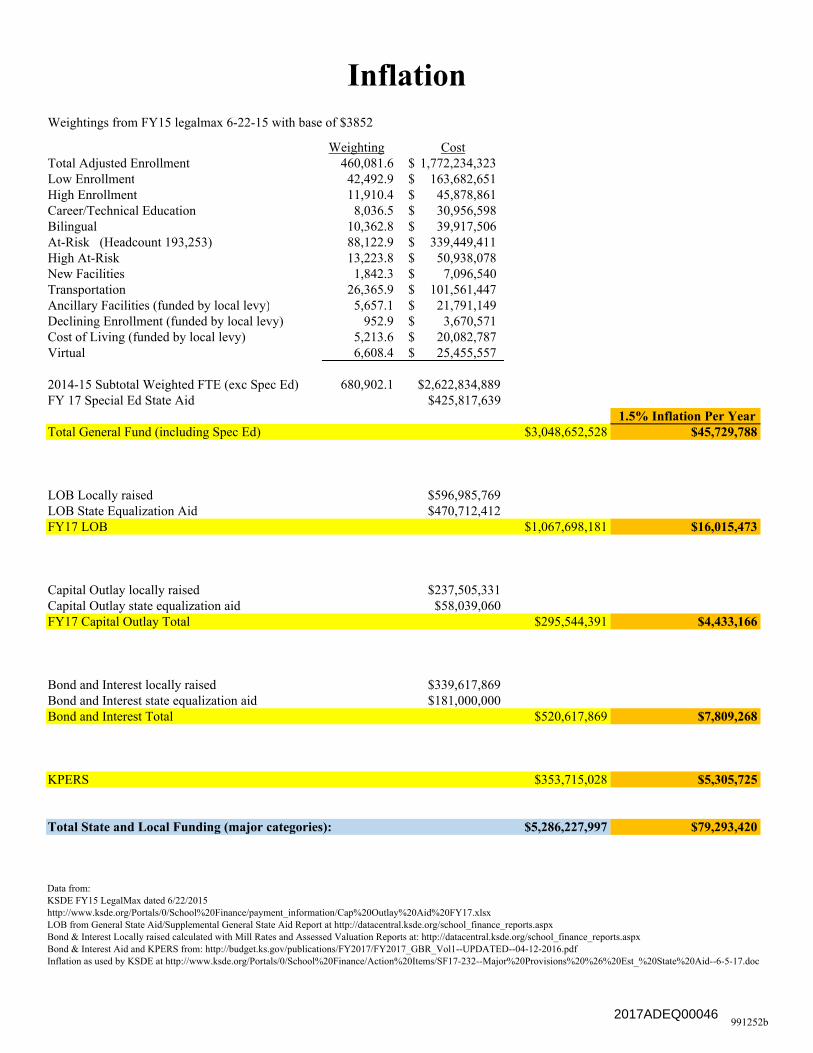
InflationWeightings from FY15 legalmax 6-22-15 with base of $3852
Weighting CostTotal Adjusted Enrollment 460,081.6 1,772,234,323$ Low Enrollment 42,492.9 163,682,651$ High Enrollment 11,910.4 45,878,861$ Career/Technical Education 8,036.5 30,956,598$ Bilingual 10,362.8 39,917,506$ At-Risk (Headcount 193,253) 88,122.9 339,449,411$ High At-Risk 13,223.8 50,938,078$ New Facilities 1,842.3 7,096,540$ Transportation 26,365.9 101,561,447$ Ancillary Facilities (funded by local levy) 5,657.1 21,791,149$ Declining Enrollment (funded by local levy) 952.9 3,670,571$ Cost of Living (funded by local levy) 5,213.6 20,082,787$ Virtual 6,608.4 25,455,557$
2014-15 Subtotal Weighted FTE (exc Spec Ed) 680,902.1 $2,622,834,889FY 17 Special Ed State Aid $425,817,639
1.5% Inflation Per YearTotal General Fund (including Spec Ed) $3,048,652,528 $45,729,788
LOB Locally raised $596,985,769LOB State Equalization Aid $470,712,412FY17 LOB $1,067,698,181 $16,015,473
Capital Outlay locally raised $237,505,331Capital Outlay state equalization aid $58,039,060FY17 Capital Outlay Total $295,544,391 $4,433,166
Bond and Interest locally raised $339,617,869Bond and Interest state equalization aid $181,000,000Bond and Interest Total $520,617,869 $7,809,268
KPERS $353,715,028 $5,305,725
Total State and Local Funding (major categories): $5,286,227,997 $79,293,420
Data from:KSDE FY15 LegalMax dated 6/22/2015http://www.ksde.org/Portals/0/School%20Finance/payment_information/Cap%20Outlay%20Aid%20FY17.xlsxLOB from General State Aid/Supplemental General State Aid Report at http://datacentral.ksde.org/school_finance_reports.aspxBond & Interest Locally raised calculated with Mill Rates and Assessed Valuation Reports at: http://datacentral.ksde.org/school_finance_reports.aspxBond & Interest Aid and KPERS from: http://budget.ks.gov/publications/FY2017/FY2017_GBR_Vol1--UPDATED--04-12-2016.pdfInflation as used by KSDE at http://www.ksde.org/Portals/0/School%20Finance/Action%20Items/SF17-232--Major%20Provisions%20%26%20Est_%20State%20Aid--6-5-17.doc
991252b2017ADEQ00046

Appendix I-1:
Stepping Soundly: KPERS 2016 Comprehensive Annual
Financial Reports for the Fiscal Year Ended June 20, 2016
This report is publically available at: https://www.kpers.org/annualreport2016.pdf. It is appropriate to take judicial notice of this report, and Plaintiffs respectfully request that this Court do so. K.S.A. 60-409(b)(4); K.S.A. 60-412(c).

Kansas Public Employees Retirement System a component unit of the State of Kansas
2016 Comprehensive Annual Financial Report for the Fiscal Year Ended June 30, 2016
SOUNDLY STEPPING
991377
https://www.kpers.org/annualreport2016.pdf 2017ADEQ00147

STEPPING SOUNDLY | 2 0 1 6 A N N U A L R E P O R T
ACTUARIAL 87
SUMMARY OF PRINCIPAL RESULTS – KPERS (SCHOOL)
12/31/2015 12/31/2014Valuation Valuation % Change
1. PARTICIPANT DATA
Number of:
Active Members 84,020 85,347 (1.6%)
Retired Members and Beneficiaries 50,188 48,396 3.7
Inactive Members 27,321 25,506 7.1
Total Members 161,529 159,249 1.4
Projected Annual Salaries of Active Members $ 3,428,810,555 $ 3,438,564,123 (0.3)
Annual Retirement Payments for Retired Members and Beneficiaries $ 749,416,332 $ 707,046,829 6.0
2. ASSETS AND LIABILITIES
a. Total Actuarial Liability $ 13,798,734,403 $ 13,436,665,540 2.7
b. Assets for Valuation Purposes 8,393,193,573 7,231,564,556 16.1
c. Unfunded Actuarial Liability (a) - (b) 5,405,540,830 6,205,100,984 (12.9)
d. Funded Ratio (b) / (a) 60.8% 53.8% 13.0
e. Market Value of Assets 8,151,104,207 7,540,084,183 8.1
f. Funded Ratio on Market Value (e) / (a) 59.1% 56.1% 5.3
3. EMPLOYER CONTRIBUTION RATES AS A PERCENT OF PAYROLL
Normal Cost
Total 8.38% 8.49%
Member 6.00 6.00
Employer 2.38 2.49
Amortization of Unfunded Actuarial Liability 12.21 13.89
Actuarial Contribution Rate 14.59 16.38
Statutory Employer Contribution Rate* 13.21% 12.01%
* The rate in this valuation may not exceed last year’s rate by more than the statutory rate increase limit of 1.20 percent for Fiscal Year 2017 and later. This rate excludes the contribution rate for the Death and Disability Program.
991377
https://www.kpers.org/annualreport2016.pdf 2017ADEQ00233

Appendix I-2:
Senate Sub. for House Bill 2002 Summary
This summary is available at:http://www.kslegislature.org/li/b2017_18/measures/documents/summary_hb_2002_2017.pdf. It is appropriate to take judicial notice of the bill summary, and Plaintiffs respectfully request that this Court do so. K.S.A. 60-409(b)(4); K.S.A. 60-412(c).

State Budget; Senate Sub. for HB 2002
Senate Sub. for HB 2002 includes funding for FY 2017, FY 2018, and FY 2019 supplemental expenditures for most state agencies and FY 2018 and FY 2019 capital improvements for selected state agencies. This summary, excluding the table, does not include expenditures associated with SB 30 (the tax bill) or SB 19 (the education bill).
FY 2018
The approved FY 2018 budget, from Senate Sub. for HB 2002, totals $15.6 billion, including $6.4 billion from the State General Fund. The approved budget increases the Governor’s recommended expenditures by $248.9 million, including $170.0 million from the State General Fund, for FY 2018. Adjustments to the Governor’s recommendations include:
● Add $141.4 million, including $135.8 million from the State General Fund, torestore Kansas Public Employee Retirement System (KPERS) employercontributions to the statutory rate for FY 2018;
● Add $47.2 million, all from the State General Fund, to remove savings associatedwith Alvarez & Marsal (A&M) recommendations for health insurance andprocurement in K-12 schools for FY 2018;
● Add $26.7 million, including $12.2 million from the State General Fund, for: a 2.5percent adjustment for all state employees with less than five years of service,except highway patrol law enforcement personnel, legislators, teachers andlicensed personnel at the Schools for the Deaf and Blind, employees at theKansas Bureau of Investigation who are part of the Recruitment and RetentionPlan, and other Statewide Elected Officials; a 5.0 percent adjustment for stateemployees who have not had a pay adjustment in five years; and a 2.5 percentadjustment for judges and non-judicial staff in FY 2018;
● Add $20.3 million, including $9.1 million from the State General Fund, and addlanguage providing a 3.0 percent rate increase for providers of Home andCommunity Based Services under each of the waivers for FY 2018;
● Add $10.5 million, all from the State General Fund, for community mental healthcenters;
● Add $4.7 million, all from the State General Fund, and add language to open atleast 20 additional beds for patients at Osawatomie State Hospital. If the facilitycannot open the beds at Osawatomie State Hospital, the funding is to be used toenter into a contract to provide patient beds through third-party facilities for FY2018 and add $6.6 million, including $2.3 million from the State General Fund, foroperational expenditures and add language that the State Finance Council willreview the current status of funding for FY 2018;
Kansas Legislative Research Department 1 2017 Summary of Legislation
http://www.kslegislature.org/li/b2017_18/measures/documents/summary_hb_2002_2017.pdf Bills 2017- Omnibus summary_hb_2002_2017
2017ADEQ00295
jsr
Highlight

● Add $6.5 million, all from the State General Fund, to replace federal and other funding lost due to Larned State Mental Health Hospital previously counting patients in the Sexual Predator Treatment Program as part of the eligible Disproportionate Share Hospital population and due to a decreased number of patients eligible for Medicaid and Medicare reimbursements for FY 2018;
● Add $2.7 million, all from special revenue funds, to establish an on-site health clinic for state employees provided that no more than $500,000 shall be expended to construct and renovate the facility for FY 2018.
● Add $2.1 million, all from the State General Fund, for the Senior Care Act for FY 2018;
● Add $5.0 million, including $2.2 million from the State General Fund, and add language requiring the Kansas Department of Health and Environment to set Medicaid reimbursement rates for children’s hospitals contracting with a KanCare managed care organization (MCO) at reimbursement rates that restore calendar year 2015 reductions and require the agency to complete a study on the statewide average cost recovery ratio for all Kansas hospitals contracting with MCOs for FY 2018.
● Add $1.1 million, all from the State General Fund, for expenditures related to state capital habeas proceedings for four capital punishment cases for FY 2018;
● Add $1.0 million, all from the State General Fund, for domestic violence prevention grant matching funds for FY 2018; and
● Eliminate the securitization of tobacco proceeds and delete $34.5 million in State General Fund expenditures and $7.2 million from Temporary Assistance for Needy Families (TANF) to restore expenditures from the Children’s Initiatives Fund for FY 2018.
FY 2019
The approved FY 2019 budget, in House Sub. for SB 2002, totals $15.8 billion, including $6.3 billion from the State General Fund. The approved budget increases the Governor’s recommended expenditures by $0.3 million, including $132.3 million from the State General Fund, for FY 2019. Adjustments to the Governor�’s recommendations include:
● Add language to repay delayed FY 2019 employer contributions of $194.0 million to KPERS via layered amortization beginning in FY 2020;
● Eliminate the securitization of tobacco proceeds and delete $34.5 million in State General Fund expenditures and $7.2 million from TANF to restore expenditures from the Children’s Initiatives Fund for FY 2019;
Kansas Legislative Research Department 2 2017 Summary of Legislation
http://www.kslegislature.org/li/b2017_18/measures/documents/summary_hb_2002_2017.pdf Bills 2017- Omnibus summary_hb_2002_2017
2017ADEQ00296
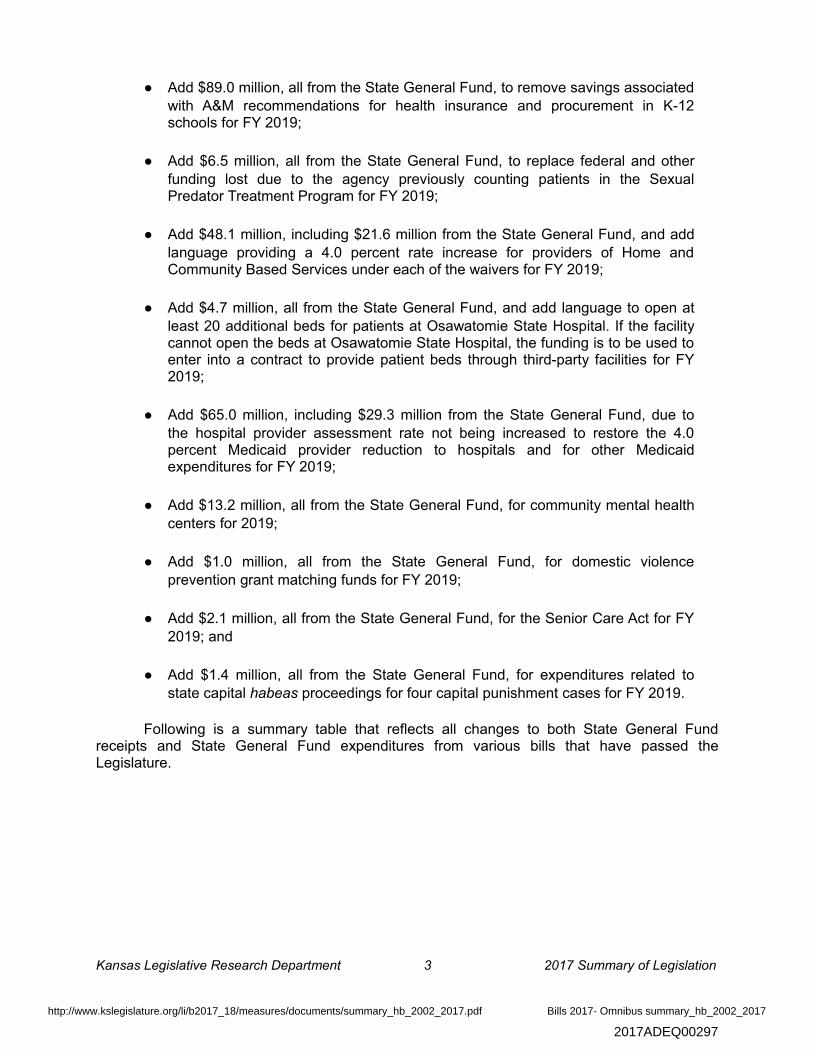
● Add $89.0 million, all from the State General Fund, to remove savings associated with A&M recommendations for health insurance and procurement in K-12 schools for FY 2019;
● Add $6.5 million, all from the State General Fund, to replace federal and other funding lost due to the agency previously counting patients in the Sexual Predator Treatment Program for FY 2019;
● Add $48.1 million, including $21.6 million from the State General Fund, and add language providing a 4.0 percent rate increase for providers of Home and Community Based Services under each of the waivers for FY 2019;
● Add $4.7 million, all from the State General Fund, and add language to open at least 20 additional beds for patients at Osawatomie State Hospital. If the facility cannot open the beds at Osawatomie State Hospital, the funding is to be used to enter into a contract to provide patient beds through third-party facilities for FY 2019;
● Add $65.0 million, including $29.3 million from the State General Fund, due to the hospital provider assessment rate not being increased to restore the 4.0 percent Medicaid provider reduction to hospitals and for other Medicaid expenditures for FY 2019;
● Add $13.2 million, all from the State General Fund, for community mental health centers for 2019;
● Add $1.0 million, all from the State General Fund, for domestic violence prevention grant matching funds for FY 2019;
● Add $2.1 million, all from the State General Fund, for the Senior Care Act for FY 2019; and
● Add $1.4 million, all from the State General Fund, for expenditures related to state capital habeas proceedings for four capital punishment cases for FY 2019.
Following is a summary table that reflects all changes to both State General Fund receipts and State General Fund expenditures from various bills that have passed the Legislature.
Kansas Legislative Research Department 3 2017 Summary of Legislation
http://www.kslegislature.org/li/b2017_18/measures/documents/summary_hb_2002_2017.pdf Bills 2017- Omnibus summary_hb_2002_2017
2017ADEQ00297

STATE GENERAL FUND RECEIPTS, EXPENDITURES, AND BALANCESSenate Sub. for HB 2002 Conference Profile
(dollars in millions)
Actual Conf. Rec. Conf. Rec. Conf. Rec.FY 2016 FY 2017 FY 2018 FY 2019
Beginning Balance $ 71.5 $ 37.1 $ 50.0 $ 134.8 Receipts (November 2016 Consensus) 6,080.6 6,073.1 5,687.6 5,564.4 Governor’s Revenue Adjustments 0.0 10.3 337.3 487.2 PMIB Transfer 0.0 230.0 87.3 0.0 SB 30–Tax Bill 0.0 0.0 591.0 633.0 SB 19–Education Tax Credit 0.0 0.0 (9.0) (9.0)Legislative Receipt Adjustments 0.0 (4.1) (14.7) (10.1)Adjusted Receipts $ 6,080.6 $ 6,309.3 $ 6,679.4 $ 6,665.5 Total Available $ 6,152.1 $ 6,346.4 $ 6,729.4 $ 6,823.1
Less Expenditures $ 6,115.1 $ 6,296.5 $ 6,408.0 $ 6,329.6 SB 19 (Education Bill) 0.0 0.0 186.6 283.8 Ending Balance $ 37.0 $ 50.0 $ 134.8 $ 186.9
Ending Balance as a % of Expenditures 0.6% 0.8% 2.1% 3.0%
Kansas Legislative Research Department 4 2017 Summary of Legislation
http://www.kslegislature.org/li/b2017_18/measures/documents/summary_hb_2002_2017.pdf Bills 2017- Omnibus summary_hb_2002_2017
2017ADEQ00298

Appendix J:
Demonstrative Exhibit Regarding District Gains and Losses
Under S.B. 19
This demonstrative exhibit was created from publically available KSDE data, including data from S.B. 19 SF17-22 (attached as Appx. B) and data from S.B. 19 SF 17-226 (attached as Appx. E-2).

Senate Bill 19 ‐ Year 1General Fund Difference LOB Difference Combined Difference
Districts Gaining: 248 176 233Total of Increases: $191,079,002 $38,115,581 $227,332,708
Districts Losing: 38 110 53Total of Decreases: ‐$7,177,816 ‐$6,005,030 ‐$11,312,838
KSDE SF17‐232 KSDE SF17‐232 KSDE SF17‐232 KSDE SF17‐232 KSDE SF17‐226 KSDE SF17‐226 KSDE SF17‐226 Calculated CalculatedCol 1 Col 13 Col 14 Col 15 Col 3 Col 4 Col 5
SF17‐145 Col 3 2017‐18 2016‐17 CombinedProposed 2017‐18 Est. 2015‐16 Proposed Adopted General Fund and LOB2017‐18 General Fund General Fund Difference Max LOB LOB Difference Difference Percentage
USD # County District Name Total Adj Enroll. (incl Sped) (incl Sped) (Col 13‐14) Budget Budget (Col 3 ‐ Col 4) (Col 15 + Col 5) DifferenceTotal STATE TOTALS 472,772.5 3,251,881,770 3,067,980,584 183,901,186 1,099,865,522 1,067,746,822 32,118,684 216,019,870422 Kiowa Kiowa County 242.5 2,711,864 3,578,497 ‐866,633 719,330 711,197 8,133 ‐858,500 ‐20%476 Gray Copeland 94.5 1,040,138 1,243,863 ‐203,725 346,786 418,312 ‐71,526 ‐275,251 ‐17%283 Elk Elk Valley 114.5 1,422,908 1,632,725 ‐209,817 447,996 530,290 ‐82,294 ‐292,111 ‐14%390 Greenwood Hamilton 77.0 873,736 986,887 ‐113,151 267,597 315,985 ‐48,388 ‐161,539 ‐12%106 Ness Western Plains 109.5 1,207,517 1,324,391 ‐116,874 421,216 484,121 ‐62,905 ‐179,779 ‐10%247 Crawford Cherokee 523.1 4,505,990 4,845,318 ‐339,328 1,485,398 1,684,619 ‐199,222 ‐538,550 ‐8%225 Meade Fowler 145.5 1,374,696 1,476,642 ‐101,946 515,822 577,905 ‐62,083 ‐164,029 ‐8%269 Rooks Palco 107.5 1,122,143 1,193,889 ‐71,746 399,774 455,135 ‐55,361 ‐127,107 ‐8%207 LeavenworthFt Leavenworth 1,704.6 8,853,025 9,368,637 ‐515,612 3,215,000 3,539,416 ‐324,416 ‐840,028 ‐7%334 Cloud Southern Cloud 185.0 1,976,609 2,097,190 ‐120,581 641,396 713,212 ‐71,817 ‐192,398 ‐7%387 Wilson Altoona‐Midway 184.5 1,890,040 2,005,422 ‐115,382 543,276 605,830 ‐62,554 ‐177,936 ‐7%217 Morton Rolla 165.5 1,538,147 1,617,836 ‐79,689 515,756 588,359 ‐72,603 ‐152,292 ‐7%475 Geary Geary County Schools 7,655.0 48,830,941 51,727,921 ‐2,896,980 16,070,236 17,546,515 ‐1,476,279 ‐4,373,259 ‐6%371 Gray Montezuma 215.0 1,964,914 2,083,340 ‐118,426 641,078 691,455 ‐50,378 ‐168,804 ‐6%326 Phillips Logan 151.0 1,521,609 1,601,672 ‐80,063 512,835 565,637 ‐52,802 ‐132,865 ‐6%352 Sherman Goodland 907.0 6,812,329 7,080,957 ‐268,628 2,238,508 2,408,048 ‐169,540 ‐438,168 ‐5%243 Coffey Lebo‐Waverly 430.7 3,452,542 3,578,852 ‐126,310 1,142,238 1,280,739 ‐138,501 ‐264,811 ‐5%399 Russell Paradise 113.7 1,205,686 1,245,918 ‐40,232 405,793 446,473 ‐40,680 ‐80,912 ‐5%344 Linn Pleasanton 347.0 2,829,427 2,899,813 ‐70,386 940,193 987,719 ‐47,526 ‐117,912 ‐3%481 Dickinson Rural Vista 309.0 2,485,604 2,522,462 ‐36,858 868,296 921,368 ‐53,072 ‐89,930 ‐3%311 Reno Pretty Prairie 258.0 2,175,165 2,206,276 ‐31,111 721,403 765,242 ‐43,839 ‐74,950 ‐3%337 Jackson Royal Valley 834.6 6,491,292 6,575,424 ‐84,132 2,159,133 2,287,502 ‐128,369 ‐212,501 ‐2%114 Doniphan Riverside 617.3 5,065,964 5,115,339 ‐49,375 1,664,162 1,747,132 ‐82,970 ‐132,345 ‐2%377 Atchison Atchison Co Comm Sch 569.5 4,855,848 4,892,821 ‐36,973 1,598,093 1,687,938 ‐89,845 ‐126,818 ‐2%329 Wabaunsee Mill Creek Valley 440.0 3,577,821 3,618,448 ‐40,627 1,203,801 1,269,535 ‐65,734 ‐106,361 ‐2%358 Sumner Oxford 294.0 2,993,396 3,019,795 ‐26,399 865,587 925,529 ‐59,942 ‐86,341 ‐2%223 Washington Barnes 367.4 3,050,378 3,125,405 ‐75,027 1,009,218 1,011,921 ‐2,703 ‐77,730 ‐2%338 Jefferson Valley Falls 374.5 3,078,744 3,101,407 ‐22,663 1,016,130 1,056,443 ‐40,313 ‐62,976 ‐2%456 Osage Marais Des Cygnes Val 236.5 2,279,683 2,427,350 ‐147,667 759,501 670,000 89,501 ‐58,166 ‐2%351 Stafford Macksville 231.0 2,308,753 2,323,295 ‐14,542 764,543 803,447 ‐38,904 ‐53,446 ‐2%275 Logan Triplains 70.5 779,435 772,176 7,259 289,902 323,981 ‐34,079 ‐26,820 ‐2%365 Anderson Garnett 1,012.5 7,171,840 7,152,727 19,113 2,367,711 2,484,409 ‐116,698 ‐97,585 ‐1%449 LeavenworthEaston 612.5 4,885,575 4,888,061 ‐2,486 1,611,018 1,687,280 ‐76,262 ‐78,748 ‐1%336 Jackson Holton 1,064.5 7,574,531 7,546,509 28,022 2,459,699 2,554,123 ‐94,425 ‐66,403 ‐1%498 Marshall Valley Heights 395.0 3,252,784 3,259,081 ‐6,297 1,121,239 1,173,503 ‐52,264 ‐58,561 ‐1%294 Decatur Oberlin 336.0 2,711,561 2,753,050 ‐41,489 897,780 904,293 ‐6,513 ‐48,002 ‐1%270 Rooks Plainville 340.3 2,779,185 2,778,018 1,167 916,545 962,024 ‐45,479 ‐44,312 ‐1%419 McPherson Canton‐Galva 371.4 3,037,198 3,032,076 5,122 1,105,454 1,151,022 ‐45,568 ‐40,446 ‐1%454 Osage Burlingame Public Scho 300.0 2,432,394 2,432,518 ‐124 805,490 844,149 ‐38,659 ‐38,783 ‐1%307 Saline Ell‐Saline 462.5 3,569,016 3,556,529 12,487 1,182,766 1,233,338 ‐50,572 ‐38,085 ‐1%335 Jackson North Jackson 369.5 3,018,665 3,016,379 2,286 1,002,884 1,035,405 ‐32,521 ‐30,235 ‐1%444 Rice Little River 321.9 2,650,702 2,640,106 10,596 875,318 911,216 ‐35,899 ‐25,303 ‐1%471 Cowley Dexter 144.0 1,392,077 1,393,225 ‐1,148 471,905 495,073 ‐23,168 ‐24,316 ‐1%487 Dickinson Herington 446.3 3,569,827 3,547,042 22,785 1,185,371 1,231,439 ‐46,068 ‐23,283 0%343 Jefferson Perry Public Schools 759.5 5,985,558 5,951,585 33,973 1,973,199 2,024,282 ‐51,083 ‐17,110 0%423 McPherson Moundridge 392.9 3,079,671 3,057,321 22,350 1,118,225 1,153,795 ‐35,570 ‐13,220 0%212 Norton Northern Valley 167.5 1,683,809 1,666,815 16,994 561,340 585,990 ‐24,650 ‐7,656 0%347 Edwards Kinsley‐Offerle 338.0 3,075,614 3,066,215 9,399 1,018,316 1,032,998 ‐14,683 ‐5,284 0%392 Osborne Osborne County 284.1 2,436,516 2,411,464 25,052 815,300 845,608 ‐30,308 ‐5,256 0%216 Kearny Deerfield 202.5 2,058,570 2,025,730 32,840 706,172 741,598 ‐35,427 ‐2,587 0%342 Jefferson McLouth 471.0 3,982,165 3,952,933 29,232 1,309,410 1,340,050 ‐30,640 ‐1,408 0%505 Labette Chetopa‐St. Paul 442.0 3,521,028 3,480,503 40,525 1,184,350 1,225,972 ‐41,622 ‐1,097 0%322 PottawatomOnaga‐Havensville‐Wh 301.0 2,483,866 2,465,408 18,458 821,559 840,540 ‐18,981 ‐523 0%245 Coffey LeRoy‐Gridley 212.0 2,002,586 1,978,797 23,789 674,494 695,103 ‐20,609 3,180 0%205 Butler Bluestem 497.8 4,172,951 4,118,843 54,108 1,395,993 1,444,620 ‐48,627 5,481 0%226 Meade Meade 393.9 2,932,706 2,890,796 41,910 1,103,067 1,138,479 ‐35,412 6,498 0%467 Wichita Leoti 402.0 3,278,917 3,230,196 48,721 1,100,657 1,141,740 ‐41,083 7,638 0%284 Chase Chase County 353.0 2,930,019 2,889,212 40,807 984,356 1,015,472 ‐31,116 9,691 0%374 Haskell Sublette 461.7 3,799,257 3,771,933 27,324 1,270,187 1,277,892 ‐7,706 19,618 0%206 Butler Remington‐Whitewate 510.2 4,175,789 4,190,969 ‐15,180 1,378,848 1,338,988 39,860 24,680 0%464 LeavenworthTonganoxie 1,954.6 11,459,345 11,526,430 ‐67,085 3,792,585 3,684,608 107,977 40,892 0%468 Lane Healy Public Schools 70.0 802,126 783,445 18,681 293,733 306,623 ‐12,890 5,791 1%
Data from:http://www.ksde.org/Portals/0/School%20Finance/Action%20Items/SF17‐232.xlsxhttp://www.ksde.org/Portals/0/School%20Finance/Action%20Items/SF17‐226.xlsx
991366a2017ADEQ00047

Senate Bill 19 ‐ Year 1KSDE SF17‐232 KSDE SF17‐232 KSDE SF17‐232 KSDE SF17‐232 KSDE SF17‐226 KSDE SF17‐226 KSDE SF17‐226 Calculated Calculated
Col 1 Col 13 Col 14 Col 15 Col 3 Col 4 Col 5SF17‐145 Col 3 2017‐18 2016‐17 Combined
Proposed 2017‐18 Est. 2015‐16 Proposed Adopted General Fund and LOB2017‐18 General Fund General Fund Difference Max LOB LOB Difference Difference Percentage
USD # County District Name Total Adj Enroll. (incl Sped) (incl Sped) (Col 13‐14) Budget Budget (Col 3 ‐ Col 4) (Col 15 + Col 5) DifferenceTotal STATE TOTALS 472,772.5 3,251,881,770 3,067,980,584 183,901,186 1,099,865,522 1,067,746,822 32,118,684 216,019,870386 Greenwood Madison‐Virgil 229.0 2,172,722 2,137,073 35,649 714,289 732,690 ‐18,401 17,248 1%360 Sumner Caldwell 233.0 2,164,191 2,123,901 40,290 783,254 806,220 ‐22,966 17,324 1%246 Crawford Northeast 470.5 4,120,527 4,050,607 69,920 1,357,205 1,383,416 ‐26,212 43,708 1%395 Rush LaCrosse 290.0 2,375,094 2,319,352 55,742 819,241 830,000 ‐10,759 44,983 1%102 Gray Cimmaron‐Ensign 646.5 4,847,590 4,747,331 100,259 1,616,679 1,671,502 ‐54,823 45,436 1%394 Butler Rose Hill Public School 1,568.5 9,233,386 9,109,830 123,556 3,340,976 3,398,568 ‐57,592 65,964 1%251 Lyon North Lyon County 423.0 3,596,441 3,504,542 91,899 1,186,954 1,211,303 ‐24,349 67,550 1%312 Reno Haven Public Schools 817.0 6,703,136 6,576,688 126,448 2,197,279 2,248,779 ‐51,500 74,948 1%315 Thomas Colby Public Schools 893.4 6,103,566 5,977,559 126,007 2,125,594 2,176,376 ‐50,782 75,225 1%215 Kearny Lakin 623.5 4,766,135 4,634,325 131,810 1,569,146 1,622,083 ‐52,937 78,873 1%306 Saline Southeast Of Saline 692.0 5,096,287 4,982,097 114,190 1,685,969 1,717,612 ‐31,643 82,547 1%499 Cherokee Galena 813.5 6,255,780 6,101,523 154,257 2,058,557 2,092,419 ‐33,862 120,395 1%367 Miami Osawatomie 1,154.5 9,149,914 8,988,119 161,795 3,007,307 3,027,917 ‐20,610 141,185 1%416 Miami Louisburg 1,716.4 9,593,056 9,383,383 209,673 3,470,018 3,528,496 ‐58,478 151,195 1%209 Stevens Moscow Public School 173.0 1,754,070 1,688,160 65,910 647,904 674,130 ‐26,226 39,684 2%200 Greeley Greeley County Schoo 252.5 2,153,473 2,092,775 60,698 722,582 737,264 ‐14,682 46,016 2%482 Lane Dighton 223.8 1,945,391 1,898,442 46,949 657,631 650,000 7,631 54,580 2%393 Dickinson Solomon 313.5 2,558,932 2,489,495 69,437 860,810 875,358 ‐14,548 54,889 2%463 Cowley Udall 339.7 2,748,970 2,672,480 76,490 909,037 928,029 ‐18,992 57,498 2%110 Phillips Thunder Ridge Schools 221.0 2,260,724 2,188,013 72,711 763,038 767,887 ‐4,849 67,862 2%350 Stafford St John‐Hudson 336.9 2,850,529 2,766,265 84,264 970,298 981,774 ‐11,476 72,788 2%504 Labette Oswego 462.0 3,637,124 3,538,395 98,729 1,207,472 1,226,392 ‐18,921 79,808 2%356 Sumner Conway Springs 484.8 3,689,150 3,587,833 101,317 1,227,887 1,248,630 ‐20,744 80,573 2%298 Lincoln Lincoln 360.0 3,049,407 2,976,777 72,630 1,008,533 996,229 12,304 84,934 2%439 Harvey Sedgwick Public Schoo 477.5 3,639,650 3,551,172 88,478 1,204,999 1,196,000 8,999 97,477 2%404 Cherokee Riverton 736.0 5,579,536 5,450,546 128,990 1,846,935 1,863,621 ‐16,686 112,304 2%211 Norton Norton Community Sc 701.2 5,337,613 5,215,978 121,635 1,760,368 1,759,037 1,331 122,966 2%331 Kingman Kingman ‐ Norwich 910.5 7,189,309 6,982,710 206,599 2,321,570 2,349,718 ‐28,149 178,450 2%264 Sedgwick Clearwater 1,122.0 7,551,998 7,375,409 176,589 2,474,911 2,471,795 3,116 179,705 2%493 Cherokee Columbus 967.0 7,430,818 7,194,930 235,888 2,463,426 2,496,158 ‐32,732 203,156 2%375 Butler Circle 1,908.3 11,065,935 10,902,291 163,644 3,611,732 3,556,907 54,825 218,469 2%362 Linn Prairie View 908.6 7,324,952 7,082,674 242,278 2,451,433 2,459,649 ‐8,216 234,062 2%490 Butler El Dorado 1,904.3 12,133,986 11,822,625 311,361 4,105,341 4,168,515 ‐63,174 248,187 2%290 Franklin Ottawa 2,418.9 15,422,993 15,090,251 332,742 5,058,769 5,069,420 ‐10,651 322,091 2%450 Shawnee Shawnee Heights 3,512.5 21,465,223 21,026,744 438,479 7,080,208 6,967,765 112,443 550,922 2%308 Reno Hutchinson Public Scho 4,826.2 31,145,102 30,538,022 607,080 10,309,757 10,287,770 21,987 629,067 2%474 Kiowa Haviland 103.5 1,115,723 1,075,537 40,186 378,734 379,947 ‐1,213 38,973 3%496 Pawnee Pawnee Heights 143.5 1,426,605 1,449,729 ‐23,124 522,714 442,999 79,715 56,591 3%401 Rice Chase‐Raymond 167.0 1,738,129 1,665,314 72,815 576,644 579,066 ‐2,422 70,393 3%477 Gray Ingalls 239.5 1,971,546 1,888,480 83,066 667,730 674,060 ‐6,331 76,735 3%227 Hodgeman Hodgeman County Sch 297.5 2,373,941 2,296,269 77,672 821,690 820,208 1,482 79,154 3%349 Stafford Stafford 246.4 2,308,603 2,242,180 66,423 757,913 740,990 16,923 83,346 3%411 Marion Goessel 276.0 2,397,074 2,319,724 77,350 870,495 863,699 6,796 84,146 3%398 Marion Peabody‐Burns 250.0 2,448,419 2,357,251 91,168 900,807 906,437 ‐5,630 85,538 3%432 Ellis Victoria 297.0 2,175,289 2,082,864 92,425 740,557 739,614 943 93,368 3%256 Allen Marmaton Valley 283.0 2,557,298 2,447,564 109,734 861,789 863,127 ‐1,338 108,396 3%397 Marion Centre 215.5 2,794,942 2,677,761 117,181 756,587 764,141 ‐7,554 109,627 3%462 Cowley Central 312.7 2,744,500 2,625,668 118,832 911,051 907,277 3,774 122,606 3%288 Franklin Central Heights 555.0 4,744,334 4,563,453 180,881 1,575,081 1,592,996 ‐17,915 162,966 3%258 Allen Humboldt 607.0 5,332,269 5,183,213 149,056 1,549,247 1,515,110 34,137 183,193 3%460 Harvey Hesston 801.6 5,350,667 5,147,171 203,496 1,951,794 1,954,110 ‐2,316 201,180 3%101 Neosho Erie‐Galesburg 518.0 4,588,977 4,381,582 207,395 1,533,214 1,539,410 ‐6,196 201,199 3%440 Harvey Halstead 756.0 5,678,505 5,459,754 218,751 1,880,125 1,883,765 ‐3,640 215,111 3%289 Franklin Wellsville 773.0 5,538,329 5,309,486 228,843 1,832,762 1,833,608 ‐846 227,997 3%495 Pawnee Ft Larned 914.6 6,998,072 6,734,102 263,970 2,312,953 2,307,743 5,210 269,180 3%340 Jefferson Jefferson West 859.5 6,258,374 6,009,462 248,912 2,065,445 2,035,421 30,024 278,936 3%400 McPherson Smoky Valley 921.5 7,123,213 6,867,471 255,742 2,396,796 2,331,628 65,168 320,910 3%309 Reno Nickerson 1,108.5 8,347,156 7,969,174 377,982 2,722,697 2,769,732 ‐47,035 330,947 3%257 Allen Iola 1,264.0 9,506,539 9,124,956 381,583 3,133,101 3,150,882 ‐17,781 363,802 3%267 Sedgwick Renwick 1,891.0 10,769,301 10,363,693 405,608 3,912,041 3,900,441 11,600 417,208 3%465 Cowley Winfield 2,210.7 14,627,347 14,020,364 606,983 4,831,660 4,821,269 10,391 617,374 3%313 Reno Buhler 2,276.3 13,931,950 13,360,139 571,811 4,669,690 4,617,490 52,200 624,011 3%469 LeavenworthLansing 2,631.8 15,791,596 15,448,049 343,547 5,190,339 4,884,132 306,207 649,754 3%345 Shawnee Seaman 3,746.6 23,142,240 22,490,108 652,132 7,587,903 7,475,889 112,014 764,146 3%291 Gove Grinnell Public Schools 89.0 933,619 888,893 44,726 218,046 220,020 ‐1,974 42,752 4%292 Gove Wheatland 110.0 1,195,532 1,132,282 63,250 407,978 405,823 2,155 65,405 4%332 Kingman Cunningham 157.0 1,620,279 1,537,406 82,873 535,597 537,156 ‐1,559 81,314 4%
Data from:http://www.ksde.org/Portals/0/School%20Finance/Action%20Items/SF17‐232.xlsxhttp://www.ksde.org/Portals/0/School%20Finance/Action%20Items/SF17‐226.xlsx
991366a2017ADEQ00048

Senate Bill 19 ‐ Year 1KSDE SF17‐232 KSDE SF17‐232 KSDE SF17‐232 KSDE SF17‐232 KSDE SF17‐226 KSDE SF17‐226 KSDE SF17‐226 Calculated Calculated
Col 1 Col 13 Col 14 Col 15 Col 3 Col 4 Col 5SF17‐145 Col 3 2017‐18 2016‐17 Combined
Proposed 2017‐18 Est. 2015‐16 Proposed Adopted General Fund and LOB2017‐18 General Fund General Fund Difference Max LOB LOB Difference Difference Percentage
USD # County District Name Total Adj Enroll. (incl Sped) (incl Sped) (Col 13‐14) Budget Budget (Col 3 ‐ Col 4) (Col 15 + Col 5) DifferenceTotal STATE TOTALS 472,772.5 3,251,881,770 3,067,980,584 183,901,186 1,099,865,522 1,067,746,822 32,118,684 216,019,870403 Rush Otis‐Bison 220.6 2,204,700 2,092,304 112,396 712,721 706,643 6,078 118,474 4%108 Washington Washington Co. Schoo 348.5 2,869,516 2,724,711 144,805 1,006,778 1,006,913 ‐135 144,670 4%235 Bourbon Uniontown 441.0 3,780,009 3,604,816 175,193 1,256,218 1,246,690 9,528 184,721 4%452 Stanton Stanton County 444.7 3,587,994 3,387,164 200,830 1,200,740 1,212,863 ‐12,124 188,706 4%494 Hamilton Syracuse 528.5 4,257,070 4,061,165 195,905 1,420,189 1,423,018 ‐2,829 193,076 4%252 Lyon Southern Lyon County 512.0 4,113,250 3,915,865 197,385 1,347,029 1,350,252 ‐3,224 194,161 4%376 Rice Sterling 523.2 4,094,794 3,904,628 190,166 1,353,151 1,337,550 15,601 205,767 4%239 Ottawa North Ottawa County 616.9 4,678,799 4,457,347 221,452 1,705,161 1,698,503 6,658 228,110 4%484 Wilson Fredonia 662.8 5,086,431 4,844,575 241,856 1,720,538 1,719,460 1,078 242,934 4%430 Brown South Brown County 570.0 5,083,898 4,848,522 235,376 1,688,792 1,680,979 7,813 243,189 4%364 Marshall Marysville 713.5 5,296,866 5,067,244 229,622 1,820,912 1,803,805 17,107 246,729 4%372 Shawnee Silver Lake 694.0 4,799,888 4,558,626 241,262 1,603,245 1,592,469 10,776 252,038 4%357 Sumner Belle Plaine 601.0 4,801,413 4,560,577 240,836 1,604,564 1,588,804 15,760 256,596 4%346 Linn Jayhawk 559.0 4,723,790 4,494,378 229,412 1,565,344 1,534,596 30,748 260,160 4%378 Riley Riley County 686.9 5,130,990 4,887,860 243,130 1,698,204 1,679,444 18,760 261,890 4%389 Greenwood Eureka 642.0 5,235,081 4,962,883 272,198 1,739,813 1,724,538 15,275 287,473 4%436 MontgomeryCaney Valley 766.0 5,552,968 5,257,103 295,865 1,855,299 1,845,466 9,833 305,698 4%218 Morton Elkhart 481.9 6,878,960 6,499,462 379,498 1,238,345 1,288,319 ‐49,974 329,524 4%434 Osage Santa Fe Trail 999.7 7,885,146 7,548,064 337,082 2,590,289 2,562,170 28,119 365,201 4%473 Dickinson Chapman 1,086.8 7,571,018 7,208,388 362,630 2,499,830 2,475,710 24,120 386,750 4%379 Clay Clay Center 1,349.6 8,838,538 8,466,673 371,865 2,911,443 2,880,460 30,983 402,848 4%321 PottawatomKaw Valley 1,158.0 8,010,817 7,598,382 412,435 2,650,564 2,634,833 15,731 428,166 4%263 Sedgwick Mulvane 1,752.8 10,523,191 9,990,377 532,814 3,458,232 3,411,536 46,696 579,510 4%402 Butler Augusta 2,173.3 12,812,591 12,118,537 694,054 4,213,425 4,265,279 ‐51,854 642,200 4%428 Barton Great Bend 3,022.5 19,888,251 18,939,062 949,189 6,582,652 6,499,570 83,082 1,032,271 4%373 Harvey Newton 3,433.3 21,087,508 19,953,045 1,134,463 6,963,323 6,911,599 51,724 1,186,187 4%501 Shawnee Topeka Public Schools 13,426.0 96,355,405 92,886,189 3,469,216 34,912,613 33,616,616 1,295,997 4,765,213 4%220 Clark Ashland 197.9 1,804,295 1,695,496 108,799 607,699 606,082 1,617 110,416 5%219 Clark Minneola 243.5 2,143,112 2,015,571 127,541 731,548 722,119 9,429 136,970 5%297 Cheyenne St Francis Comm Sch 281.5 2,255,174 2,111,293 143,881 752,432 749,559 2,873 146,754 5%429 Doniphan Troy Public Schools 334.5 2,540,182 2,401,270 138,912 855,248 846,088 9,160 148,072 5%293 Gove Quinter Public Schools 298.5 2,382,344 2,202,171 180,173 831,387 860,964 ‐29,577 150,596 5%111 Doniphan Doniphan West Schoo 333.0 2,849,134 2,683,491 165,643 1,020,026 1,005,747 14,278 179,921 5%281 Graham Graham County 369.3 2,939,875 2,746,307 193,568 1,010,980 1,005,053 5,927 199,495 5%448 McPherson Inman 426.1 3,358,004 3,176,859 181,145 1,221,686 1,196,840 24,846 205,991 5%421 Osage Lyndon 429.5 3,378,134 3,180,152 197,982 1,128,282 1,111,848 16,434 214,416 5%240 Ottawa Twin Valley 591.7 4,538,574 4,240,165 298,409 1,656,115 1,632,260 23,855 322,264 5%287 Franklin West Franklin 590.5 5,080,892 4,776,428 304,464 1,724,172 1,694,000 30,172 334,636 5%447 MontgomeryCherryvale 814.9 6,333,656 5,963,251 370,405 2,046,727 2,013,841 32,886 403,291 5%508 Cherokee Baxter Springs 1,008.0 7,605,098 7,187,359 417,739 2,484,820 2,450,671 34,149 451,888 5%320 PottawatomWamego 1,524.6 9,294,163 8,686,620 607,543 3,034,971 3,002,851 32,120 639,663 5%445 MontgomeryCoffeyville 1,723.3 11,971,582 11,325,018 646,564 4,011,918 3,946,454 65,464 712,028 5%353 Sumner Wellington 1,596.5 10,921,346 10,303,079 618,267 3,591,444 3,471,792 119,652 737,919 5%214 Grant Ulysses 1,705.0 11,183,464 10,483,646 699,818 3,701,060 3,649,066 51,994 751,812 5%413 Neosho Chanute Public School 1,808.7 12,584,864 11,827,741 757,123 4,143,974 4,090,402 53,572 810,695 5%453 LeavenworthLeavenworth 3,699.2 24,521,627 23,185,084 1,336,543 8,011,633 7,894,175 117,458 1,454,001 5%202 Wyandotte Turner‐Kansas City 4,098.7 28,094,542 26,618,544 1,475,998 9,333,320 9,053,413 279,907 1,755,905 5%253 Lyon Emporia 4,503.7 29,543,984 27,754,159 1,789,825 9,777,520 9,558,122 219,398 2,009,223 5%305 Saline Salina 7,152.0 46,302,339 43,704,006 2,598,333 15,297,348 15,002,490 294,858 2,893,191 5%103 Cheyenne Cheylin 138.0 1,498,719 1,379,512 119,207 513,305 520,040 ‐6,735 112,472 6%316 Thomas Golden Plains 181.6 1,950,794 1,813,814 136,980 668,433 661,429 7,004 143,984 6%426 Republic Pike Valley 222.5 2,027,600 1,889,836 137,764 700,831 686,149 14,682 152,446 6%459 Ford Bucklin 230.0 2,062,174 1,946,245 115,929 697,048 657,500 39,548 155,477 6%369 Harvey Burrton 245.5 2,162,312 2,014,898 147,414 718,244 696,502 21,742 169,156 6%107 Jewell Rock Hills 303.5 2,701,684 2,533,116 168,568 709,893 700,125 9,768 178,336 6%224 Washington Clifton‐Clyde 318.0 2,590,982 2,415,680 175,302 877,670 856,388 21,282 196,584 6%272 Mitchell Waconda 313.8 2,673,958 2,494,841 179,117 890,206 868,923 21,283 200,400 6%381 Ford Spearville 355.0 2,660,080 2,460,894 199,186 892,397 884,315 8,082 207,268 6%310 Reno Fairfield 296.0 2,804,969 2,602,052 202,917 951,587 930,708 20,879 223,796 6%282 Elk West Elk 343.5 3,199,273 2,988,700 210,573 1,054,796 1,034,400 20,396 230,969 6%286 Chautauqua Chautauqua Co Comm 371.9 3,249,469 3,036,991 212,478 1,102,628 1,072,320 30,308 242,786 6%237 Smith Smith Center 395.0 3,365,996 3,126,302 239,694 1,245,547 1,211,171 34,376 274,070 6%380 Marshall Vermillion 565.5 4,053,746 3,810,780 242,966 1,373,586 1,314,991 58,595 301,561 6%325 Phillips Phillipsburg 626.0 4,722,766 4,420,371 302,395 1,561,854 1,525,889 35,965 338,360 6%420 Osage Osage City 666.5 5,026,869 4,707,743 319,126 1,667,450 1,623,808 43,642 362,768 6%268 Sedgwick Cheney 781.1 5,589,035 5,278,271 310,764 1,852,040 1,761,337 90,703 401,467 6%461 Wilson Neodesha 719.0 5,330,447 4,975,751 354,696 1,956,868 1,891,821 65,047 419,743 6%
Data from:http://www.ksde.org/Portals/0/School%20Finance/Action%20Items/SF17‐232.xlsxhttp://www.ksde.org/Portals/0/School%20Finance/Action%20Items/SF17‐226.xlsx
991366a2017ADEQ00049

Senate Bill 19 ‐ Year 1KSDE SF17‐232 KSDE SF17‐232 KSDE SF17‐232 KSDE SF17‐232 KSDE SF17‐226 KSDE SF17‐226 KSDE SF17‐226 Calculated Calculated
Col 1 Col 13 Col 14 Col 15 Col 3 Col 4 Col 5SF17‐145 Col 3 2017‐18 2016‐17 Combined
Proposed 2017‐18 Est. 2015‐16 Proposed Adopted General Fund and LOB2017‐18 General Fund General Fund Difference Max LOB LOB Difference Difference Percentage
USD # County District Name Total Adj Enroll. (incl Sped) (incl Sped) (Col 13‐14) Budget Budget (Col 3 ‐ Col 4) (Col 15 + Col 5) DifferenceTotal STATE TOTALS 472,772.5 3,251,881,770 3,067,980,584 183,901,186 1,099,865,522 1,067,746,822 32,118,684 216,019,870417 Morris Morris County 742.7 5,497,774 5,102,106 395,668 1,827,870 1,782,072 45,798 441,466 6%249 Crawford Frontenac Public Scho 929.0 6,329,982 5,943,802 386,180 2,095,615 2,034,196 61,419 447,599 6%248 Crawford Girard 1,017.8 7,318,585 6,865,540 453,045 2,415,487 2,335,075 80,412 533,457 6%361 Harper Anthony‐Harper 822.0 7,069,972 6,467,709 602,263 2,269,494 2,316,214 ‐46,720 555,543 6%333 Cloud Concordia 1,071.6 7,268,871 6,757,682 511,189 2,475,174 2,393,007 82,167 593,356 6%382 Pratt Pratt 1,130.0 8,355,296 7,820,670 534,626 2,697,621 2,610,764 86,857 621,483 6%210 Stevens Hugoton Public School 1,074.9 7,765,663 7,171,716 593,947 2,584,628 2,554,725 29,903 623,850 6%348 Douglas Baldwin City 1,391.2 8,864,384 8,276,226 588,158 2,924,352 2,824,943 99,409 687,567 6%435 Dickinson Abilene 1,573.3 9,764,232 9,026,307 737,925 3,186,501 3,137,115 49,386 787,311 6%368 Miami Paola 2,010.5 12,221,172 11,438,203 782,969 4,435,818 4,307,408 128,410 911,379 6%446 MontgomeryIndependence 2,003.0 12,740,918 11,860,707 880,211 4,232,175 4,108,647 123,528 1,003,739 6%418 McPherson McPherson 2,364.4 14,447,582 13,537,641 909,941 5,204,404 5,028,614 175,790 1,085,731 6%260 Sedgwick Derby 6,709.8 40,735,734 38,452,930 2,282,804 13,418,556 12,767,588 650,968 2,933,772 6%383 Riley Manhattan‐Ogden 6,144.0 39,237,734 36,683,300 2,554,434 13,901,752 13,364,245 537,507 3,091,941 6%229 Johnson Blue Valley 22,259.3 140,851,373 131,898,165 8,953,208 51,192,296 48,519,957 2,672,339 11,625,547 6%500 Wyandotte Kansas City 21,152.0 155,526,721 144,769,419 10,757,302 51,343,044 49,972,534 1,370,510 12,127,812 6%233 Johnson Olathe 28,783.6 182,859,685 171,561,092 11,298,593 66,206,824 64,120,804 2,086,020 13,384,613 6%259 Sedgwick Wichita 48,737.2 349,389,399 327,995,113 21,394,286 115,013,862 111,369,465 3,644,397 25,038,683 6%300 Comanche Comanche County 325.5 2,884,672 2,653,255 231,417 951,792 936,283 15,509 246,926 7%208 Trego Wakeeney 380.5 3,073,147 2,836,790 236,357 1,023,296 1,002,148 21,148 257,505 7%438 Pratt Skyline Schools 411.0 3,304,453 3,064,160 240,293 1,129,213 1,080,330 48,883 289,176 7%339 Jefferson Jefferson County Nort 454.5 3,716,289 3,461,384 254,905 1,225,239 1,171,469 53,770 308,675 7%366 Woodson Woodson 448.5 3,933,277 3,624,306 308,971 1,296,766 1,261,137 35,629 344,600 7%330 Wabaunsee Mission Valley 492.0 4,355,958 4,026,806 329,152 1,435,841 1,364,541 71,300 400,452 7%410 Marion Durham‐Hillsboro‐Leh 572.0 4,648,000 4,292,729 355,271 1,670,165 1,621,498 48,667 403,938 7%396 Butler Douglass Public Schoo 677.3 5,233,801 4,839,163 394,638 1,867,324 1,827,614 39,710 434,348 7%244 Coffey Burlington 850.5 6,476,392 5,977,592 498,800 2,155,618 2,081,264 74,354 573,154 7%113 Nemaha Prairie Hills 1,142.7 7,600,853 7,038,459 562,394 2,565,450 2,488,805 76,645 639,039 7%503 Labette Parsons 1,272.5 9,042,883 8,385,716 657,167 3,032,861 2,939,784 93,077 750,244 7%506 Labette Labette County 1,548.1 10,690,845 9,905,123 785,722 3,535,391 3,375,549 159,842 945,564 7%234 Bourbon Fort Scott 1,870.1 11,840,367 11,126,312 714,055 3,925,272 3,607,179 318,093 1,032,148 7%204 Wyandotte Bonner Springs 2,679.0 17,738,793 16,499,498 1,239,295 5,769,225 5,426,138 343,087 1,582,382 7%470 Cowley Arkansas City 2,836.9 19,988,217 18,555,486 1,432,731 6,621,987 6,335,000 286,987 1,719,718 7%385 Butler Andover 5,163.5 31,321,061 29,089,742 2,231,319 9,762,574 9,253,425 509,149 2,740,468 7%232 Johnson De Soto 7,084.2 39,530,128 36,639,685 2,890,443 14,396,334 13,812,173 584,161 3,474,604 7%266 Sedgwick Maize 6,762.7 41,189,466 38,227,866 2,961,600 13,053,159 12,502,460 550,699 3,512,299 7%497 Douglas Lawrence 10,732.5 74,034,284 69,255,890 4,778,394 24,683,466 23,297,182 1,386,284 6,164,678 7%512 Johnson Shawnee Mission Pub 27,443.1 163,582,596 151,260,227 12,322,369 61,693,771 59,788,008 1,905,763 14,228,132 7%509 Sumner South Haven 202.5 1,992,868 1,824,241 168,627 727,708 684,739 42,969 211,596 8%105 Rawlins Rawlins County 347.4 2,835,811 2,574,583 261,228 945,323 923,233 22,090 283,318 8%408 Marion Marion‐Florence 517.0 4,277,948 3,901,980 375,968 1,403,049 1,349,977 53,072 429,040 8%327 Ellsworth Ellsworth 639.7 4,696,999 4,301,196 395,803 1,558,746 1,481,709 77,037 472,840 8%341 Jefferson Oskaloosa Public Scho 593.5 5,142,331 4,751,816 390,515 1,692,401 1,591,626 100,775 491,290 8%323 PottawatomRock Creek 1,035.1 7,041,412 6,507,088 534,324 2,341,109 2,213,144 127,965 662,289 8%491 Douglas Eudora 1,682.1 10,021,294 9,232,417 788,877 3,278,420 3,093,344 185,076 973,953 8%262 Sedgwick Valley Center Pub Sch 2,782.2 17,126,095 15,737,525 1,388,570 5,581,781 5,321,342 260,439 1,649,009 8%437 Shawnee Auburn Washburn 6,249.4 37,835,802 34,895,522 2,940,280 12,428,907 11,614,736 814,171 3,754,451 8%241 Wallace Wallace County Schoo 200.5 1,790,050 1,626,860 163,190 595,981 566,166 29,815 193,005 9%303 Ness Ness City 297.5 2,399,190 2,160,620 238,570 795,764 771,787 23,977 262,547 9%492 Butler Flinthills 269.7 2,435,232 2,209,019 226,213 801,620 759,020 42,600 268,813 9%388 Ellis Ellis 434.6 3,164,730 2,856,998 307,732 1,067,074 1,010,904 56,170 363,902 9%112 Ellsworth Central Plains 489.0 4,155,131 3,771,223 383,908 1,388,459 1,304,810 83,649 467,557 9%273 Mitchell Beloit 791.0 5,964,692 5,436,986 527,706 1,970,138 1,868,516 101,622 629,328 9%363 Finney Holcomb 993.5 6,846,135 6,220,034 626,101 2,276,057 2,150,000 126,057 752,158 9%405 Rice Lyons 817.8 6,651,052 6,184,858 466,194 2,193,160 1,893,090 300,070 766,264 9%409 Atchison Atchison Public School 1,703.0 11,583,024 10,568,499 1,014,525 3,822,211 3,578,462 243,749 1,258,274 9%250 Crawford Pittsburg 3,039.1 20,427,862 18,623,611 1,804,251 6,696,883 6,364,720 332,163 2,136,414 9%261 Sedgwick Haysville 5,488.6 35,545,449 32,449,018 3,096,431 11,762,044 11,075,570 686,474 3,782,905 9%480 Seward Liberal 4,903.0 34,334,926 31,605,086 2,729,840 11,378,071 10,250,000 1,128,071 3,857,911 9%231 Johnson Gardner Edgerton 5,816.4 35,333,579 32,402,238 2,931,341 12,833,335 11,590,874 1,242,461 4,173,802 9%457 Finney Garden City 7,478.0 52,696,150 47,821,311 4,874,839 17,475,168 16,676,760 798,408 5,673,247 9%443 Ford Dodge City 6,837.8 51,271,320 46,407,914 4,863,406 16,930,818 16,008,101 922,717 5,786,123 9%355 Barton Ellinwood Public Schoo 448.8 3,540,903 3,200,929 339,974 1,172,405 1,091,193 81,212 421,186 10%415 Brown Hiawatha 914.6 7,061,391 6,400,881 660,510 2,324,440 2,143,811 180,629 841,139 10%489 Ellis Hays 2,988.7 18,320,031 16,396,380 1,923,651 6,227,286 5,850,530 376,756 2,300,407 10%265 Sedgwick Goddard 5,587.9 33,139,607 29,987,061 3,152,546 10,935,522 10,178,501 757,021 3,909,567 10%242 Wallace Weskan 102.5 1,068,482 953,667 114,815 389,894 357,775 32,119 146,934 11%
Data from:http://www.ksde.org/Portals/0/School%20Finance/Action%20Items/SF17‐232.xlsxhttp://www.ksde.org/Portals/0/School%20Finance/Action%20Items/SF17‐226.xlsx
991366a2017ADEQ00050

Senate Bill 19 ‐ Year 1KSDE SF17‐232 KSDE SF17‐232 KSDE SF17‐232 KSDE SF17‐232 KSDE SF17‐226 KSDE SF17‐226 KSDE SF17‐226 Calculated Calculated
Col 1 Col 13 Col 14 Col 15 Col 3 Col 4 Col 5SF17‐145 Col 3 2017‐18 2016‐17 Combined
Proposed 2017‐18 Est. 2015‐16 Proposed Adopted General Fund and LOB2017‐18 General Fund General Fund Difference Max LOB LOB Difference Difference Percentage
USD # County District Name Total Adj Enroll. (incl Sped) (incl Sped) (Col 13‐14) Budget Budget (Col 3 ‐ Col 4) (Col 15 + Col 5) DifferenceTotal STATE TOTALS 472,772.5 3,251,881,770 3,067,980,584 183,901,186 1,099,865,522 1,067,746,822 32,118,684 216,019,870507 Haskell Satanta 311.0 2,771,447 2,417,081 354,366 935,300 912,132 23,168 377,534 11%109 Republic Republic County 508.0 4,051,937 3,606,090 445,847 1,396,070 1,302,588 93,482 539,329 11%115 Nemaha Nemaha Central 584.8 4,289,483 4,006,523 282,960 1,465,751 1,170,000 295,751 578,711 11%431 Barton Hoisington 737.7 5,696,246 5,102,525 593,721 1,888,414 1,743,769 144,645 738,366 11%407 Russell Russell County 830.2 6,132,667 5,432,998 699,669 2,253,003 2,111,500 141,503 841,172 11%466 Scott Scott County 990.5 6,768,393 6,036,154 732,239 2,246,593 2,096,672 149,921 882,160 11%254 Barber Barber County North 471.5 3,896,296 3,421,747 474,549 1,287,417 1,207,674 79,743 554,292 12%458 LeavenworthBasehor‐Linwood 2,327.6 13,934,513 12,446,000 1,488,513 4,335,038 3,882,569 452,469 1,940,982 12%511 Harper Attica 168.0 1,596,595 1,391,941 204,654 529,384 481,387 47,997 252,651 13%384 Riley Blue Valley 216.5 2,048,299 1,802,237 246,062 746,183 671,635 74,548 320,610 13%274 Logan Oakley 406.1 3,198,070 2,788,374 409,696 1,098,989 1,021,941 77,048 486,744 13%502 Edwards Lewis 116.0 1,277,705 1,115,568 162,137 424,476 378,223 46,253 208,390 14%412 Sheridan Hoxie Community Scho 380.9 2,888,754 2,503,020 385,734 992,640 887,978 104,662 490,396 14%271 Rooks Stockton 335.0 2,776,872 2,393,863 383,009 919,928 834,528 85,400 468,409 15%483 Seward Kismet‐Plains 699.0 6,759,445 6,422,846 336,599 2,244,366 1,379,609 864,757 1,201,356 15%203 Wyandotte Piper‐Kansas City 2,169.9 12,690,305 10,887,529 1,802,776 4,326,105 3,726,052 600,053 2,402,829 16%230 Johnson Spring Hill 2,742.0 24,023,960 20,992,010 3,031,950 6,385,200 5,261,457 1,123,743 4,155,693 16%299 Lincoln Sylvan Grove 242.3 2,247,651 2,063,188 184,463 744,772 500,000 244,772 429,235 17%255 Barber South Barber 248.5 2,227,290 1,839,903 387,387 737,220 687,767 49,453 436,840 17%359 Sumner Argonia Public Schools 187.5 1,842,342 1,557,776 284,566 612,842 502,720 110,122 394,688 19%314 Thomas Brewster 147.0 1,440,303 1,207,261 233,042 477,523 382,827 94,696 327,738 21%285 Chautauqua Cedar Vale 182.5 1,809,277 1,590,416 218,861 601,571 395,000 206,571 425,432 21%479 Anderson Crest 219.0 2,112,455 1,924,702 187,753 709,382 405,000 304,382 492,135 21%
Data from:http://www.ksde.org/Portals/0/School%20Finance/Action%20Items/SF17‐232.xlsxhttp://www.ksde.org/Portals/0/School%20Finance/Action%20Items/SF17‐226.xlsx
991366a2017ADEQ00051

Senate Bill 19 ‐ Year 2Base Recalculated for 2nd Year General Fund Difference LOB Difference Combined Difference$4128 Base plus additional Districts Gaining: 267 176 262$12M Special Education Total of Increases: $283,185,415 $38,115,581 $318,346,597
Districts Losing: 19 110 24Total of Decreases: ‐$3,730,317 ‐$6,005,030 ‐$6,772,815
KSDE SF17‐232 KSDE SF17‐232 KSDE SF17‐232 KSDE SF17‐232 KSDE SF17‐226 KSDE SF17‐226 KSDE SF17‐226 Calculated CalculatedCol 1 Col 13 Col 14 Col 15 Col 3 Col 4 Col 5
SF17‐145 Col 3 2017‐18 2016‐17 CombinedProposed 2017‐18 Est. 2015‐16 Proposed Adopted General Fund and LOB2017‐18 General Fund General Fund Difference Max LOB LOB Difference Difference Percentage
USD # County District Name Total Adj Enroll. (incl Sped) (incl Sped) (Col 13‐14) Budget Budget (Col 3 ‐ Col 4) (Col 15 + Col 5) DifferenceTotal STATE TOTALS 472,772.5 3,347,435,682 3,067,980,584 279,455,098 1,099,865,522 1,067,746,822 32,118,684 311,573,782422 Kiowa Kiowa County 242.5 2,776,846 3,578,497 ‐801,651 719,330 711,197 8,133 ‐793,518 ‐18%476 Gray Copeland 94.5 1,071,126 1,243,863 ‐172,737 346,786 418,312 ‐71,526 ‐244,263 ‐15%283 Elk Elk Valley 114.5 1,465,207 1,632,725 ‐167,518 447,996 530,290 ‐82,294 ‐249,812 ‐12%390 Greenwood Hamilton 77.0 899,776 986,887 ‐87,111 267,597 315,985 ‐48,388 ‐135,499 ‐10%106 Ness Western Plains 109.5 1,243,949 1,324,391 ‐80,442 421,216 484,121 ‐62,905 ‐143,347 ‐8%247 Crawford Cherokee 523.1 4,640,453 4,845,318 ‐204,865 1,485,398 1,684,619 ‐199,222 ‐404,087 ‐6%225 Meade Fowler 145.5 1,416,119 1,476,642 ‐60,523 515,822 577,905 ‐62,083 ‐122,606 ‐6%269 Rooks Palco 107.5 1,155,827 1,193,889 ‐38,062 399,774 455,135 ‐55,361 ‐93,423 ‐6%334 Cloud Southern Cloud 185.0 2,034,524 2,097,190 ‐62,666 641,396 713,212 ‐71,817 ‐134,483 ‐5%387 Wilson Altoona‐Midway 184.5 1,946,662 2,005,422 ‐58,760 543,276 605,830 ‐62,554 ‐121,314 ‐5%217 Morton Rolla 165.5 1,584,529 1,617,836 ‐33,307 515,756 588,359 ‐72,603 ‐105,910 ‐5%475 Geary Geary County Schools 7,655.0 50,284,804 51,727,921 ‐1,443,117 16,070,236 17,546,515 ‐1,476,279 ‐2,919,396 ‐4%207 LeavenworthFt Leavenworth 1,704.6 9,116,943 9,368,637 ‐251,694 3,215,000 3,539,416 ‐324,416 ‐576,110 ‐4%371 Gray Montezuma 215.0 2,022,808 2,083,340 ‐60,532 641,078 691,455 ‐50,378 ‐110,910 ‐4%326 Phillips Logan 151.0 1,567,225 1,601,672 ‐34,447 512,835 565,637 ‐52,802 ‐87,249 ‐4%243 Coffey Lebo‐Waverly 430.7 3,555,722 3,578,852 ‐23,130 1,142,238 1,280,739 ‐138,501 ‐161,631 ‐3%399 Russell Paradise 113.7 1,241,844 1,245,918 ‐4,074 405,793 446,473 ‐40,680 ‐44,754 ‐3%352 Sherman Goodland 907.0 7,014,813 7,080,957 ‐66,144 2,238,508 2,408,048 ‐169,540 ‐235,684 ‐2%344 Linn Pleasanton 347.0 2,914,421 2,899,813 14,608 940,193 987,719 ‐47,526 ‐32,918 ‐1%337 Jackson Royal Valley 834.6 6,685,498 6,575,424 110,074 2,159,133 2,287,502 ‐128,369 ‐18,295 0%481 Dickinson Rural Vista 309.0 2,560,327 2,522,462 37,865 868,296 921,368 ‐53,072 ‐15,207 0%311 Reno Pretty Prairie 258.0 2,240,358 2,206,276 34,082 721,403 765,242 ‐43,839 ‐9,757 0%358 Sumner Oxford 294.0 3,070,576 3,019,795 50,781 865,587 925,529 ‐59,942 ‐9,161 0%275 Logan Triplains 70.5 802,774 772,176 30,598 289,902 323,981 ‐34,079 ‐3,481 0%329 Wabaunsee Mill Creek Valley 440.0 3,684,961 3,618,448 66,513 1,203,801 1,269,535 ‐65,734 779 0%456 Osage Marais Des Cygnes Val 236.5 2,347,813 2,427,350 ‐79,537 759,501 670,000 89,501 9,964 0%223 Washington Barnes 367.4 3,141,542 3,125,405 16,137 1,009,218 1,011,921 ‐2,703 13,434 0%351 Stafford Macksville 231.0 2,377,825 2,323,295 54,530 764,543 803,447 ‐38,904 15,626 0%377 Atchison Atchison Co Comm Sch 569.5 5,000,310 4,892,821 107,489 1,598,093 1,687,938 ‐89,845 17,644 0%114 Doniphan Riverside 617.3 5,216,114 5,115,339 100,775 1,664,162 1,747,132 ‐82,970 17,805 0%471 Cowley Dexter 144.0 1,433,895 1,393,225 40,670 471,905 495,073 ‐23,168 17,502 1%338 Jefferson Valley Falls 374.5 3,170,495 3,101,407 69,088 1,016,130 1,056,443 ‐40,313 28,775 1%294 Decatur Oberlin 336.0 2,792,739 2,753,050 39,689 897,780 904,293 ‐6,513 33,176 1%454 Osage Burlingame Public Scho 300.0 2,505,022 2,432,518 72,504 805,490 844,149 ‐38,659 33,845 1%270 Rooks Plainville 340.3 2,862,045 2,778,018 84,027 916,545 962,024 ‐45,479 38,548 1%498 Marshall Valley Heights 395.0 3,350,423 3,259,081 91,342 1,121,239 1,173,503 ‐52,264 39,078 1%419 McPherson Canton‐Galva 371.4 3,127,979 3,032,076 95,903 1,105,454 1,151,022 ‐45,568 50,335 1%335 Jackson North Jackson 369.5 3,109,319 3,016,379 92,940 1,002,884 1,035,405 ‐32,521 60,419 1%449 LeavenworthEaston 612.5 5,031,020 4,888,061 142,959 1,611,018 1,687,280 ‐76,262 66,697 1%307 Saline Ell‐Saline 462.5 3,675,911 3,556,529 119,382 1,182,766 1,233,338 ‐50,572 68,810 1%365 Anderson Garnett 1,012.5 7,386,564 7,152,727 233,837 2,367,711 2,484,409 ‐116,698 117,139 1%212 Norton Northern Valley 167.5 1,734,216 1,666,815 67,401 561,340 585,990 ‐24,650 42,751 2%444 Rice Little River 321.9 2,729,745 2,640,106 89,639 875,318 911,216 ‐35,899 53,740 2%216 Kearny Deerfield 202.5 2,120,760 2,025,730 95,030 706,172 741,598 ‐35,427 59,603 2%245 Coffey LeRoy‐Gridley 212.0 2,062,592 1,978,797 83,795 674,494 695,103 ‐20,609 63,186 2%392 Osborne Osborne County 284.1 2,509,336 2,411,464 97,872 815,300 845,608 ‐30,308 67,564 2%322 PottawatomOnaga‐Havensville‐Wh 301.0 2,558,245 2,465,408 92,837 821,559 840,540 ‐18,981 73,856 2%423 McPherson Moundridge 392.9 3,171,464 3,057,321 114,143 1,118,225 1,153,795 ‐35,570 78,573 2%487 Dickinson Herington 446.3 3,675,958 3,547,042 128,916 1,185,371 1,231,439 ‐46,068 82,848 2%347 Edwards Kinsley‐Offerle 338.0 3,167,799 3,066,215 101,584 1,018,316 1,032,998 ‐14,683 86,901 2%226 Meade Meade 393.9 3,020,869 2,890,796 130,073 1,103,067 1,138,479 ‐35,412 94,661 2%284 Chase Chase County 353.0 3,017,732 2,889,212 128,520 984,356 1,015,472 ‐31,116 97,404 2%505 Labette Chetopa‐St. Paul 442.0 3,626,213 3,480,503 145,710 1,184,350 1,225,972 ‐41,622 104,088 2%467 Wichita Leoti 402.0 3,377,865 3,230,196 147,669 1,100,657 1,141,740 ‐41,083 106,586 2%342 Jefferson McLouth 471.0 4,100,651 3,952,933 147,718 1,309,410 1,340,050 ‐30,640 117,078 2%205 Butler Bluestem 497.8 4,297,878 4,118,843 179,035 1,395,993 1,444,620 ‐48,627 130,408 2%336 Jackson Holton 1,064.5 7,795,788 7,546,509 249,279 2,459,699 2,554,123 ‐94,425 154,854 2%343 Jefferson Perry Public Schools 759.5 6,163,707 5,951,585 212,122 1,973,199 2,024,282 ‐51,083 161,039 2%468 Lane Healy Public Schools 70.0 826,131 783,445 42,686 293,733 306,623 ‐12,890 29,796 3%360 Sumner Caldwell 233.0 2,228,553 2,123,901 104,652 783,254 806,220 ‐22,966 81,686 3%386 Greenwood Madison‐Virgil 229.0 2,237,559 2,137,073 100,486 714,289 732,690 ‐18,401 82,085 3%374 Haskell Sublette 461.7 3,913,803 3,771,933 141,870 1,270,187 1,277,892 ‐7,706 134,164 3%
Data from:http://www.ksde.org/Portals/0/School%20Finance/Action%20Items/SF17‐232.xlsxhttp://www.ksde.org/Portals/0/School%20Finance/Action%20Items/SF17‐226.xlsx
991366d2017ADEQ00052

Senate Bill 19 ‐ Year 2KSDE SF17‐232 KSDE SF17‐232 KSDE SF17‐232 KSDE SF17‐232 KSDE SF17‐226 KSDE SF17‐226 KSDE SF17‐226 Calculated Calculated
Col 1 Col 13 Col 14 Col 15 Col 3 Col 4 Col 5SF17‐145 Col 3 2017‐18 2016‐17 Combined
Proposed 2017‐18 Est. 2015‐16 Proposed Adopted General Fund and LOB2017‐18 General Fund General Fund Difference Max LOB LOB Difference Difference Percentage
USD # County District Name Total Adj Enroll. (incl Sped) (incl Sped) (Col 13‐14) Budget Budget (Col 3 ‐ Col 4) (Col 15 + Col 5) DifferenceTotal STATE TOTALS 472,772.5 3,347,435,682 3,067,980,584 279,455,098 1,099,865,522 1,067,746,822 32,118,684 311,573,782206 Butler Remington‐Whitewate 510.2 4,300,366 4,190,969 109,397 1,378,848 1,338,988 39,860 149,257 3%246 Crawford Northeast 470.5 4,243,169 4,050,607 192,562 1,357,205 1,383,416 ‐26,212 166,350 3%102 Gray Cimmaron‐Ensign 646.5 4,993,347 4,747,331 246,016 1,616,679 1,671,502 ‐54,823 191,193 3%315 Thomas Colby Public Schools 893.4 6,286,543 5,977,559 308,984 2,125,594 2,176,376 ‐50,782 258,202 3%312 Reno Haven Public Schools 817.0 6,894,741 6,576,688 318,053 2,197,279 2,248,779 ‐51,500 266,553 3%394 Butler Rose Hill Public School 1,568.5 9,507,726 9,109,830 397,896 3,340,976 3,398,568 ‐57,592 340,304 3%464 LeavenworthTonganoxie 1,954.6 11,801,952 11,526,430 275,522 3,792,585 3,684,608 107,977 383,499 3%367 Miami Osawatomie 1,154.5 9,421,270 8,988,119 433,151 3,007,307 3,027,917 ‐20,610 412,541 3%416 Miami Louisburg 1,716.4 9,877,974 9,383,383 494,591 3,470,018 3,528,496 ‐58,478 436,113 3%209 Stevens Moscow Public School 173.0 1,807,029 1,688,160 118,869 647,904 674,130 ‐26,226 92,643 4%200 Greeley Greeley County Schoo 252.5 2,218,489 2,092,775 125,714 722,582 737,264 ‐14,682 111,032 4%482 Lane Dighton 223.8 2,003,977 1,898,442 105,535 657,631 650,000 7,631 113,166 4%395 Rush LaCrosse 290.0 2,446,414 2,319,352 127,062 819,241 830,000 ‐10,759 116,303 4%393 Dickinson Solomon 313.5 2,635,628 2,489,495 146,133 860,810 875,358 ‐14,548 131,585 4%463 Cowley Udall 339.7 2,831,278 2,672,480 158,798 909,037 928,029 ‐18,992 139,806 4%350 Stafford St John‐Hudson 336.9 2,935,644 2,766,265 169,379 970,298 981,774 ‐11,476 157,903 4%251 Lyon North Lyon County 423.0 3,704,230 3,504,542 199,688 1,186,954 1,211,303 ‐24,349 175,339 4%298 Lincoln Lincoln 360.0 3,140,659 2,976,777 163,882 1,008,533 996,229 12,304 176,186 4%504 Labette Oswego 462.0 3,746,259 3,538,395 207,864 1,207,472 1,226,392 ‐18,921 188,943 4%356 Sumner Conway Springs 484.8 3,799,616 3,587,833 211,783 1,227,887 1,248,630 ‐20,744 191,039 4%439 Harvey Sedgwick Public Schoo 477.5 3,748,639 3,551,172 197,467 1,204,999 1,196,000 8,999 206,466 4%215 Kearny Lakin 623.5 4,907,627 4,634,325 273,302 1,569,146 1,622,083 ‐52,937 220,365 4%306 Saline Southeast Of Saline 692.0 5,248,630 4,982,097 266,533 1,685,969 1,717,612 ‐31,643 234,890 4%404 Cherokee Riverton 736.0 5,746,559 5,450,546 296,013 1,846,935 1,863,621 ‐16,686 279,327 4%211 Norton Norton Community Sc 701.2 5,496,845 5,215,978 280,867 1,760,368 1,759,037 1,331 282,198 4%499 Cherokee Galena 813.5 6,441,811 6,101,523 340,288 2,058,557 2,092,419 ‐33,862 306,426 4%331 Kingman Kingman ‐ Norwich 910.5 7,399,836 6,982,710 417,126 2,321,570 2,349,718 ‐28,149 388,977 4%264 Sedgwick Clearwater 1,122.0 7,775,540 7,375,409 400,131 2,474,911 2,471,795 3,116 403,247 4%493 Cherokee Columbus 967.0 7,653,153 7,194,930 458,223 2,463,426 2,496,158 ‐32,732 425,491 4%375 Butler Circle 1,908.3 11,392,229 10,902,291 489,938 3,611,732 3,556,907 54,825 544,763 4%490 Butler El Dorado 1,904.3 12,496,492 11,822,625 673,867 4,105,341 4,168,515 ‐63,174 610,693 4%290 Franklin Ottawa 2,418.9 15,879,907 15,090,251 789,656 5,058,769 5,069,420 ‐10,651 779,005 4%450 Shawnee Shawnee Heights 3,512.5 22,105,805 21,026,744 1,079,061 7,080,208 6,967,765 112,443 1,191,504 4%308 Reno Hutchinson Public Scho 4,826.2 32,076,511 30,538,022 1,538,489 10,309,757 10,287,770 21,987 1,560,476 4%474 Kiowa Haviland 103.5 1,149,185 1,075,537 73,648 378,734 379,947 ‐1,213 72,435 5%496 Pawnee Pawnee Heights 143.5 1,468,734 1,449,729 19,005 522,714 442,999 79,715 98,720 5%401 Rice Chase‐Raymond 167.0 1,790,243 1,665,314 124,929 576,644 579,066 ‐2,422 122,507 5%110 Phillips Thunder Ridge Schools 221.0 2,328,468 2,188,013 140,455 763,038 767,887 ‐4,849 135,606 5%477 Gray Ingalls 239.5 2,030,943 1,888,480 142,463 667,730 674,060 ‐6,331 136,132 5%227 Hodgeman Hodgeman County Sch 297.5 2,445,412 2,296,269 149,143 821,690 820,208 1,482 150,625 5%349 Stafford Stafford 246.4 2,377,673 2,242,180 135,493 757,913 740,990 16,923 152,416 5%411 Marion Goessel 276.0 2,468,533 2,319,724 148,809 870,495 863,699 6,796 155,605 5%398 Marion Peabody‐Burns 250.0 2,521,074 2,357,251 163,823 900,807 906,437 ‐5,630 158,193 5%397 Marion Centre 215.5 2,863,221 2,677,761 185,460 756,587 764,141 ‐7,554 177,906 5%288 Franklin Central Heights 555.0 4,886,475 4,563,453 323,022 1,575,081 1,592,996 ‐17,915 305,107 5%258 Allen Humboldt 607.0 5,472,581 5,183,213 289,368 1,549,247 1,515,110 34,137 323,505 5%460 Harvey Hesston 801.6 5,511,008 5,147,171 363,837 1,951,794 1,954,110 ‐2,316 361,521 5%440 Harvey Halstead 756.0 5,848,785 5,459,754 389,031 1,880,125 1,883,765 ‐3,640 385,391 5%362 Linn Prairie View 908.6 7,543,087 7,082,674 460,413 2,451,433 2,459,649 ‐8,216 452,197 5%495 Pawnee Ft Larned 914.6 7,206,968 6,734,102 472,866 2,312,953 2,307,743 5,210 478,076 5%309 Reno Nickerson 1,108.5 8,593,099 7,969,174 623,925 2,722,697 2,769,732 ‐47,035 576,890 5%257 Allen Iola 1,264.0 9,785,499 9,124,956 660,543 3,133,101 3,150,882 ‐17,781 642,762 5%267 Sedgwick Renwick 1,891.0 11,090,455 10,363,693 726,762 3,912,041 3,900,441 11,600 738,362 5%469 LeavenworthLansing 2,631.8 16,259,956 15,448,049 811,907 5,190,339 4,884,132 306,207 1,118,114 5%345 Shawnee Seaman 3,746.6 23,831,059 22,490,108 1,340,951 7,587,903 7,475,889 112,014 1,452,965 5%291 Gove Grinnell Public Schools 89.0 961,665 888,893 72,772 218,046 220,020 ‐1,974 70,798 6%332 Kingman Cunningham 157.0 1,668,653 1,537,406 131,247 535,597 537,156 ‐1,559 129,688 6%432 Ellis Victoria 297.0 2,240,718 2,082,864 157,854 740,557 739,614 943 158,797 6%256 Allen Marmaton Valley 283.0 2,633,762 2,447,564 186,198 861,789 863,127 ‐1,338 184,860 6%462 Cowley Central 312.7 2,826,842 2,625,668 201,174 911,051 907,277 3,774 204,948 6%108 Washington Washington Co. Schoo 348.5 2,955,602 2,724,711 230,891 1,006,778 1,006,913 ‐135 230,756 6%452 Stanton Stanton County 444.7 3,696,270 3,387,164 309,106 1,200,740 1,212,863 ‐12,124 296,982 6%235 Bourbon Uniontown 441.0 3,893,570 3,604,816 288,754 1,256,218 1,246,690 9,528 298,282 6%252 Lyon Southern Lyon County 512.0 4,236,409 3,915,865 320,544 1,347,029 1,350,252 ‐3,224 317,320 6%494 Hamilton Syracuse 528.5 4,385,635 4,061,165 324,470 1,420,189 1,423,018 ‐2,829 321,641 6%376 Rice Sterling 523.2 4,217,003 3,904,628 312,375 1,353,151 1,337,550 15,601 327,976 6%101 Neosho Erie‐Galesburg 518.0 4,725,809 4,381,582 344,227 1,533,214 1,539,410 ‐6,196 338,031 6%
Data from:http://www.ksde.org/Portals/0/School%20Finance/Action%20Items/SF17‐232.xlsxhttp://www.ksde.org/Portals/0/School%20Finance/Action%20Items/SF17‐226.xlsx
991366d2017ADEQ00053

Senate Bill 19 ‐ Year 2KSDE SF17‐232 KSDE SF17‐232 KSDE SF17‐232 KSDE SF17‐232 KSDE SF17‐226 KSDE SF17‐226 KSDE SF17‐226 Calculated Calculated
Col 1 Col 13 Col 14 Col 15 Col 3 Col 4 Col 5SF17‐145 Col 3 2017‐18 2016‐17 Combined
Proposed 2017‐18 Est. 2015‐16 Proposed Adopted General Fund and LOB2017‐18 General Fund General Fund Difference Max LOB LOB Difference Difference Percentage
USD # County District Name Total Adj Enroll. (incl Sped) (incl Sped) (Col 13‐14) Budget Budget (Col 3 ‐ Col 4) (Col 15 + Col 5) DifferenceTotal STATE TOTALS 472,772.5 3,347,435,682 3,067,980,584 279,455,098 1,099,865,522 1,067,746,822 32,118,684 311,573,782239 Ottawa North Ottawa County 616.9 4,818,858 4,457,347 361,511 1,705,161 1,698,503 6,658 368,169 6%289 Franklin Wellsville 773.0 5,703,891 5,309,486 394,405 1,832,762 1,833,608 ‐846 393,559 6%430 Brown South Brown County 570.0 5,235,661 4,848,522 387,139 1,688,792 1,680,979 7,813 394,952 6%484 Wilson Fredonia 662.8 5,238,496 4,844,575 393,921 1,720,538 1,719,460 1,078 394,999 6%372 Shawnee Silver Lake 694.0 4,943,794 4,558,626 385,168 1,603,245 1,592,469 10,776 395,944 6%357 Sumner Belle Plaine 601.0 4,942,639 4,560,577 382,062 1,604,564 1,588,804 15,760 397,822 6%364 Marshall Marysville 713.5 5,455,773 5,067,244 388,529 1,820,912 1,803,805 17,107 405,636 6%378 Riley Riley County 686.9 5,284,400 4,887,860 396,540 1,698,204 1,679,444 18,760 415,300 6%218 Morton Elkhart 481.9 6,988,669 6,499,462 489,207 1,238,345 1,288,319 ‐49,974 439,233 6%340 Jefferson Jefferson West 859.5 6,444,870 6,009,462 435,408 2,065,445 2,035,421 30,024 465,432 6%400 McPherson Smoky Valley 921.5 7,319,979 6,867,471 452,508 2,396,796 2,331,628 65,168 517,676 6%434 Osage Santa Fe Trail 999.7 8,118,984 7,548,064 570,920 2,590,289 2,562,170 28,119 599,039 6%473 Dickinson Chapman 1,086.8 7,797,904 7,208,388 589,516 2,499,830 2,475,710 24,120 613,636 6%379 Clay Clay Center 1,349.6 9,101,874 8,466,673 635,201 2,911,443 2,880,460 30,983 666,184 6%402 Butler Augusta 2,173.3 13,195,400 12,118,537 1,076,863 4,213,425 4,265,279 ‐51,854 1,025,009 6%313 Reno Buhler 2,276.3 14,347,852 13,360,139 987,713 4,669,690 4,617,490 52,200 1,039,913 6%465 Cowley Winfield 2,210.7 15,063,680 14,020,364 1,043,316 4,831,660 4,821,269 10,391 1,053,707 6%428 Barton Great Bend 3,022.5 20,484,682 18,939,062 1,545,620 6,582,652 6,499,570 83,082 1,628,702 6%501 Shawnee Topeka Public Schools 13,426.0 99,221,496 92,886,189 6,335,307 34,912,613 33,616,616 1,295,997 7,631,304 6%292 Gove Wheatland 110.0 1,231,337 1,132,282 99,055 407,978 405,823 2,155 101,210 7%220 Clark Ashland 197.9 1,858,613 1,695,496 163,117 607,699 606,082 1,617 164,734 7%403 Rush Otis‐Bison 220.6 2,269,178 2,092,304 176,874 712,721 706,643 6,078 182,952 7%219 Clark Minneola 243.5 2,207,659 2,015,571 192,088 731,548 722,119 9,429 201,517 7%293 Gove Quinter Public Schools 298.5 2,453,681 2,202,171 251,510 831,387 860,964 ‐29,577 221,933 7%429 Doniphan Troy Public Schools 334.5 2,616,400 2,401,270 215,130 855,248 846,088 9,160 224,290 7%111 Doniphan Doniphan West Schoo 333.0 2,934,718 2,683,491 251,227 1,020,026 1,005,747 14,278 265,505 7%448 McPherson Inman 426.1 3,458,321 3,176,859 281,462 1,221,686 1,196,840 24,846 306,308 7%421 Osage Lyndon 429.5 3,478,939 3,180,152 298,787 1,128,282 1,111,848 16,434 315,221 7%346 Linn Jayhawk 559.0 4,865,301 4,494,378 370,923 1,565,344 1,534,596 30,748 401,671 7%389 Greenwood Eureka 642.0 5,392,357 4,962,883 429,474 1,739,813 1,724,538 15,275 444,749 7%436 MontgomeryCaney Valley 766.0 5,719,073 5,257,103 461,970 1,855,299 1,845,466 9,833 471,803 7%447 MontgomeryCherryvale 814.9 6,518,707 5,963,251 555,456 2,046,727 2,013,841 32,886 588,342 7%321 PottawatomKaw Valley 1,158.0 8,249,559 7,598,382 651,177 2,650,564 2,634,833 15,731 666,908 7%508 Cherokee Baxter Springs 1,008.0 7,829,632 7,187,359 642,273 2,484,820 2,450,671 34,149 676,422 7%263 Sedgwick Mulvane 1,752.8 10,836,427 9,990,377 846,050 3,458,232 3,411,536 46,696 892,746 7%445 MontgomeryCoffeyville 1,723.3 12,329,879 11,325,018 1,004,861 4,011,918 3,946,454 65,464 1,070,325 7%413 Neosho Chanute Public School 1,808.7 12,959,029 11,827,741 1,131,288 4,143,974 4,090,402 53,572 1,184,860 7%373 Harvey Newton 3,433.3 21,716,786 19,953,045 1,763,741 6,963,323 6,911,599 51,724 1,815,465 7%453 LeavenworthLeavenworth 3,699.2 25,244,057 23,185,084 2,058,973 8,011,633 7,894,175 117,458 2,176,431 7%202 Wyandotte Turner‐Kansas City 4,098.7 28,934,486 26,618,544 2,315,942 9,333,320 9,053,413 279,907 2,595,849 7%305 Saline Salina 7,152.0 47,682,308 43,704,006 3,978,302 15,297,348 15,002,490 294,858 4,273,160 7%103 Cheyenne Cheylin 138.0 1,543,851 1,379,512 164,339 513,305 520,040 ‐6,735 157,604 8%316 Thomas Golden Plains 181.6 2,009,183 1,813,814 195,369 668,433 661,429 7,004 202,373 8%426 Republic Pike Valley 222.5 2,088,599 1,889,836 198,763 700,831 686,149 14,682 213,445 8%297 Cheyenne St Francis Comm Sch 281.5 2,323,094 2,111,293 211,801 752,432 749,559 2,873 214,674 8%459 Ford Bucklin 230.0 2,124,344 1,946,245 178,099 697,048 657,500 39,548 217,647 8%107 Jewell Rock Hills 303.5 2,782,529 2,533,116 249,413 709,893 700,125 9,768 259,181 8%224 Washington Clifton‐Clyde 318.0 2,668,778 2,415,680 253,098 877,670 856,388 21,282 274,380 8%272 Mitchell Waconda 313.8 2,754,043 2,494,841 259,202 890,206 868,923 21,283 280,485 8%281 Graham Graham County 369.3 3,028,163 2,746,307 281,856 1,010,980 1,005,053 5,927 287,783 8%282 Elk West Elk 343.5 3,294,505 2,988,700 305,805 1,054,796 1,034,400 20,396 326,201 8%286 Chautauqua Chautauqua Co Comm 371.9 3,346,784 3,036,991 309,793 1,102,628 1,072,320 30,308 340,101 8%380 Marshall Vermillion 565.5 4,176,020 3,810,780 365,240 1,373,586 1,314,991 58,595 423,835 8%240 Ottawa Twin Valley 591.7 4,674,686 4,240,165 434,521 1,656,115 1,632,260 23,855 458,376 8%325 Phillips Phillipsburg 626.0 4,863,719 4,420,371 443,348 1,561,854 1,525,889 35,965 479,313 8%287 Franklin West Franklin 590.5 5,232,644 4,776,428 456,216 1,724,172 1,694,000 30,172 486,388 8%420 Osage Osage City 666.5 5,176,629 4,707,743 468,886 1,667,450 1,623,808 43,642 512,528 8%268 Sedgwick Cheney 781.1 5,756,376 5,278,271 478,105 1,852,040 1,761,337 90,703 568,808 8%461 Wilson Neodesha 719.0 5,490,643 4,975,751 514,892 1,956,868 1,891,821 65,047 579,939 8%249 Crawford Frontenac Public Scho 929.0 6,519,329 5,943,802 575,527 2,095,615 2,034,196 61,419 636,946 8%248 Crawford Girard 1,017.8 7,537,091 6,865,540 671,551 2,415,487 2,335,075 80,412 751,963 8%382 Pratt Pratt 1,130.0 8,599,206 7,820,670 778,536 2,697,621 2,610,764 86,857 865,393 8%320 PottawatomWamego 1,524.6 9,568,212 8,686,620 881,592 3,034,971 3,002,851 32,120 913,712 8%353 Sumner Wellington 1,596.5 11,245,438 10,303,079 942,359 3,591,444 3,471,792 119,652 1,062,011 8%214 Grant Ulysses 1,705.0 11,516,481 10,483,646 1,032,835 3,701,060 3,649,066 51,994 1,084,829 8%368 Miami Paola 2,010.5 12,585,350 11,438,203 1,147,147 4,435,818 4,307,408 128,410 1,275,557 8%418 McPherson McPherson 2,364.4 14,876,224 13,537,641 1,338,583 5,204,404 5,028,614 175,790 1,514,373 8%
Data from:http://www.ksde.org/Portals/0/School%20Finance/Action%20Items/SF17‐232.xlsxhttp://www.ksde.org/Portals/0/School%20Finance/Action%20Items/SF17‐226.xlsx
991366d2017ADEQ00054

Senate Bill 19 ‐ Year 2KSDE SF17‐232 KSDE SF17‐232 KSDE SF17‐232 KSDE SF17‐232 KSDE SF17‐226 KSDE SF17‐226 KSDE SF17‐226 Calculated Calculated
Col 1 Col 13 Col 14 Col 15 Col 3 Col 4 Col 5SF17‐145 Col 3 2017‐18 2016‐17 Combined
Proposed 2017‐18 Est. 2015‐16 Proposed Adopted General Fund and LOB2017‐18 General Fund General Fund Difference Max LOB LOB Difference Difference Percentage
USD # County District Name Total Adj Enroll. (incl Sped) (incl Sped) (Col 13‐14) Budget Budget (Col 3 ‐ Col 4) (Col 15 + Col 5) DifferenceTotal STATE TOTALS 472,772.5 3,347,435,682 3,067,980,584 279,455,098 1,099,865,522 1,067,746,822 32,118,684 311,573,782253 Lyon Emporia 4,503.7 30,430,931 27,754,159 2,676,772 9,777,520 9,558,122 219,398 2,896,170 8%260 Sedgwick Derby 6,709.8 41,953,167 38,452,930 3,500,237 13,418,556 12,767,588 650,968 4,151,205 8%383 Riley Manhattan‐Ogden 6,144.0 40,385,449 36,683,300 3,702,149 13,901,752 13,364,245 537,507 4,239,656 8%233 Johnson Olathe 28,783.6 188,016,438 171,561,092 16,455,346 66,206,824 64,120,804 2,086,020 18,541,366 8%259 Sedgwick Wichita 48,737.2 359,807,579 327,995,113 31,812,466 115,013,862 111,369,465 3,644,397 35,456,863 8%369 Harvey Burrton 245.5 2,227,234 2,014,898 212,336 718,244 696,502 21,742 234,078 9%381 Ford Spearville 355.0 2,740,066 2,460,894 279,172 892,397 884,315 8,082 287,254 9%310 Reno Fairfield 296.0 2,889,178 2,602,052 287,126 951,587 930,708 20,879 308,005 9%300 Comanche Comanche County 325.5 2,970,879 2,653,255 317,624 951,792 936,283 15,509 333,133 9%208 Trego Wakeeney 380.5 3,164,887 2,836,790 328,097 1,023,296 1,002,148 21,148 349,245 9%237 Smith Smith Center 395.0 3,466,530 3,126,302 340,228 1,245,547 1,211,171 34,376 374,604 9%438 Pratt Skyline Schools 411.0 3,403,159 3,064,160 338,999 1,129,213 1,080,330 48,883 387,882 9%339 Jefferson Jefferson County Nort 454.5 3,826,901 3,461,384 365,517 1,225,239 1,171,469 53,770 419,287 9%366 Woodson Woodson 448.5 4,050,364 3,624,306 426,058 1,296,766 1,261,137 35,629 461,687 9%410 Marion Durham‐Hillsboro‐Leh 572.0 4,785,095 4,292,729 492,366 1,670,165 1,621,498 48,667 541,033 9%396 Butler Douglass Public Schoo 677.3 5,386,724 4,839,163 547,561 1,867,324 1,827,614 39,710 587,271 9%417 Morris Morris County 742.7 5,662,763 5,102,106 560,657 1,827,870 1,782,072 45,798 606,455 9%361 Harper Anthony‐Harper 822.0 7,279,310 6,467,709 811,601 2,269,494 2,316,214 ‐46,720 764,881 9%333 Cloud Concordia 1,071.6 7,486,679 6,757,682 728,997 2,475,174 2,393,007 82,167 811,164 9%210 Stevens Hugoton Public School 1,074.9 7,999,865 7,171,716 828,149 2,584,628 2,554,725 29,903 858,052 9%113 Nemaha Prairie Hills 1,142.7 7,828,811 7,038,459 790,352 2,565,450 2,488,805 76,645 866,997 9%348 Douglas Baldwin City 1,391.2 9,128,478 8,276,226 852,252 2,924,352 2,824,943 99,409 951,661 9%503 Labette Parsons 1,272.5 9,313,705 8,385,716 927,989 3,032,861 2,939,784 93,077 1,021,066 9%435 Dickinson Abilene 1,573.3 10,052,972 9,026,307 1,026,665 3,186,501 3,137,115 49,386 1,076,051 9%446 MontgomeryIndependence 2,003.0 13,123,467 11,860,707 1,262,760 4,232,175 4,108,647 123,528 1,386,288 9%234 Bourbon Fort Scott 1,870.1 12,195,233 11,126,312 1,068,921 3,925,272 3,607,179 318,093 1,387,014 9%470 Cowley Arkansas City 2,836.9 20,586,522 18,555,486 2,031,036 6,621,987 6,335,000 286,987 2,318,023 9%385 Butler Andover 5,163.5 32,174,348 29,089,742 3,084,606 9,762,574 9,253,425 509,149 3,593,755 9%232 Johnson De Soto 7,084.2 40,713,769 36,639,685 4,074,084 14,396,334 13,812,173 584,161 4,658,245 9%266 Sedgwick Maize 6,762.7 42,368,379 38,227,866 4,140,513 13,053,159 12,502,460 550,699 4,691,212 9%497 Douglas Lawrence 10,732.5 76,073,603 69,255,890 6,817,713 24,683,466 23,297,182 1,386,284 8,203,997 9%229 Johnson Blue Valley 22,259.3 144,711,883 131,898,165 12,813,718 51,192,296 48,519,957 2,672,339 15,486,057 9%500 Wyandotte Kansas City 21,152.0 160,183,183 144,769,419 15,413,764 51,343,044 49,972,534 1,370,510 16,784,274 9%512 Johnson Shawnee Mission Pub 27,443.1 168,439,016 151,260,227 17,178,789 61,693,771 59,788,008 1,905,763 19,084,552 9%330 Wabaunsee Mission Valley 492.0 4,485,579 4,026,806 458,773 1,435,841 1,364,541 71,300 530,073 10%341 Jefferson Oskaloosa Public Scho 593.5 5,295,074 4,751,816 543,258 1,692,401 1,591,626 100,775 644,033 10%244 Coffey Burlington 850.5 6,668,964 5,977,592 691,372 2,155,618 2,081,264 74,354 765,726 10%323 PottawatomRock Creek 1,035.1 7,252,521 6,507,088 745,433 2,341,109 2,213,144 127,965 873,398 10%506 Labette Labette County 1,548.1 11,010,175 9,905,123 1,105,052 3,535,391 3,375,549 159,842 1,264,894 10%491 Douglas Eudora 1,682.1 10,317,318 9,232,417 1,084,901 3,278,420 3,093,344 185,076 1,269,977 10%204 Wyandotte Bonner Springs 2,679.0 18,260,358 16,499,498 1,760,860 5,769,225 5,426,138 343,087 2,103,947 10%262 Sedgwick Valley Center Pub Sch 2,782.2 17,631,121 15,737,525 1,893,596 5,581,781 5,321,342 260,439 2,154,035 10%437 Shawnee Auburn Washburn 6,249.4 38,964,052 34,895,522 4,068,530 12,428,907 11,614,736 814,171 4,882,701 10%241 Wallace Wallace County Schoo 200.5 1,843,941 1,626,860 217,081 595,981 566,166 29,815 246,896 11%509 Sumner South Haven 202.5 2,052,124 1,824,241 227,883 727,708 684,739 42,969 270,852 11%303 Ness Ness City 297.5 2,471,397 2,160,620 310,777 795,764 771,787 23,977 334,754 11%105 Rawlins Rawlins County 347.4 2,920,975 2,574,583 346,392 945,323 923,233 22,090 368,482 11%408 Marion Marion‐Florence 517.0 4,404,433 3,901,980 502,453 1,403,049 1,349,977 53,072 555,525 11%327 Ellsworth Ellsworth 639.7 4,837,928 4,301,196 536,732 1,558,746 1,481,709 77,037 613,769 11%273 Mitchell Beloit 791.0 6,142,608 5,436,986 705,622 1,970,138 1,868,516 101,622 807,244 11%363 Finney Holcomb 993.5 7,052,398 6,220,034 832,364 2,276,057 2,150,000 126,057 958,421 11%409 Atchison Atchison Public School 1,703.0 11,928,139 10,568,499 1,359,640 3,822,211 3,578,462 243,749 1,603,389 11%250 Crawford Pittsburg 3,039.1 21,033,624 18,623,611 2,410,013 6,696,883 6,364,720 332,163 2,742,176 11%261 Sedgwick Haysville 5,488.6 36,607,956 32,449,018 4,158,938 11,762,044 11,075,570 686,474 4,845,412 11%457 Finney Garden City 7,478.0 54,273,259 47,821,311 6,451,948 17,475,168 16,676,760 798,408 7,250,356 11%492 Butler Flinthills 269.7 2,507,912 2,209,019 298,893 801,620 759,020 42,600 341,493 12%388 Ellis Ellis 434.6 3,259,708 2,856,998 402,710 1,067,074 1,010,904 56,170 458,880 12%355 Barton Ellinwood Public Schoo 448.8 3,646,821 3,200,929 445,892 1,172,405 1,091,193 81,212 527,104 12%112 Ellsworth Central Plains 489.0 4,274,927 3,771,223 503,704 1,388,459 1,304,810 83,649 587,353 12%405 Rice Lyons 817.8 6,850,046 6,184,858 665,188 2,193,160 1,893,090 300,070 965,258 12%415 Brown Hiawatha 914.6 7,271,341 6,400,881 870,460 2,324,440 2,143,811 180,629 1,051,089 12%480 Seward Liberal 4,903.0 35,369,791 31,605,086 3,764,705 11,378,071 10,250,000 1,128,071 4,892,776 12%265 Sedgwick Goddard 5,587.9 34,127,702 29,987,061 4,140,641 10,935,522 10,178,501 757,021 4,897,662 12%231 Johnson Gardner Edgerton 5,816.4 36,340,344 32,402,238 3,938,106 12,833,335 11,590,874 1,242,461 5,180,567 12%443 Ford Dodge City 6,837.8 52,811,628 46,407,914 6,403,714 16,930,818 16,008,101 922,717 7,326,431 12%109 Republic Republic County 508.0 4,173,507 3,606,090 567,417 1,396,070 1,302,588 93,482 660,899 13%431 Barton Hoisington 737.7 5,866,885 5,102,525 764,360 1,888,414 1,743,769 144,645 909,005 13%
Data from:http://www.ksde.org/Portals/0/School%20Finance/Action%20Items/SF17‐232.xlsxhttp://www.ksde.org/Portals/0/School%20Finance/Action%20Items/SF17‐226.xlsx
991366d2017ADEQ00055

Senate Bill 19 ‐ Year 2KSDE SF17‐232 KSDE SF17‐232 KSDE SF17‐232 KSDE SF17‐232 KSDE SF17‐226 KSDE SF17‐226 KSDE SF17‐226 Calculated Calculated
Col 1 Col 13 Col 14 Col 15 Col 3 Col 4 Col 5SF17‐145 Col 3 2017‐18 2016‐17 Combined
Proposed 2017‐18 Est. 2015‐16 Proposed Adopted General Fund and LOB2017‐18 General Fund General Fund Difference Max LOB LOB Difference Difference Percentage
USD # County District Name Total Adj Enroll. (incl Sped) (incl Sped) (Col 13‐14) Budget Budget (Col 3 ‐ Col 4) (Col 15 + Col 5) DifferenceTotal STATE TOTALS 472,772.5 3,347,435,682 3,067,980,584 279,455,098 1,099,865,522 1,067,746,822 32,118,684 311,573,782466 Scott Scott County 990.5 6,971,177 6,036,154 935,023 2,246,593 2,096,672 149,921 1,084,944 13%489 Ellis Hays 2,988.7 18,855,672 16,396,380 2,459,292 6,227,286 5,850,530 376,756 2,836,048 13%242 Wallace Weskan 102.5 1,100,514 953,667 146,847 389,894 357,775 32,119 178,966 14%507 Haskell Satanta 311.0 2,855,187 2,417,081 438,106 935,300 912,132 23,168 461,274 14%254 Barber Barber County North 471.5 4,012,729 3,421,747 590,982 1,287,417 1,207,674 79,743 670,725 14%115 Nemaha Nemaha Central 584.8 4,418,415 4,006,523 411,892 1,465,751 1,170,000 295,751 707,643 14%407 Russell Russell County 830.2 6,316,480 5,432,998 883,482 2,253,003 2,111,500 141,503 1,024,985 14%458 LeavenworthBasehor‐Linwood 2,327.6 14,326,160 12,446,000 1,880,160 4,335,038 3,882,569 452,469 2,332,629 14%384 Riley Blue Valley 216.5 2,109,585 1,802,237 307,348 746,183 671,635 74,548 381,896 15%274 Logan Oakley 406.1 3,294,053 2,788,374 505,679 1,098,989 1,021,941 77,048 582,727 15%511 Harper Attica 168.0 1,644,461 1,391,941 252,520 529,384 481,387 47,997 300,517 16%502 Edwards Lewis 116.0 1,316,075 1,115,568 200,507 424,476 378,223 46,253 246,760 17%271 Rooks Stockton 335.0 2,860,030 2,393,863 466,167 919,928 834,528 85,400 551,567 17%412 Sheridan Hoxie Community Scho 380.9 2,975,697 2,503,020 472,677 992,640 887,978 104,662 577,339 17%483 Seward Kismet‐Plains 699.0 6,963,165 6,422,846 540,319 2,244,366 1,379,609 864,757 1,405,076 18%230 Johnson Spring Hill 2,742.0 24,515,373 20,992,010 3,523,363 6,385,200 5,261,457 1,123,743 4,647,106 18%299 Lincoln Sylvan Grove 242.3 2,315,213 2,063,188 252,025 744,772 500,000 244,772 496,797 19%203 Wyandotte Piper‐Kansas City 2,169.9 13,068,475 10,887,529 2,180,946 4,326,105 3,726,052 600,053 2,780,999 19%255 Barber South Barber 248.5 2,293,974 1,839,903 454,071 737,220 687,767 49,453 503,524 20%359 Sumner Argonia Public Schools 187.5 1,897,579 1,557,776 339,803 612,842 502,720 110,122 449,925 22%314 Thomas Brewster 147.0 1,483,609 1,207,261 276,348 477,523 382,827 94,696 371,044 23%285 Chautauqua Cedar Vale 182.5 1,863,676 1,590,416 273,260 601,571 395,000 206,571 479,831 24%479 Anderson Crest 219.0 2,175,727 1,924,702 251,025 709,382 405,000 304,382 555,407 24%
Data from:http://www.ksde.org/Portals/0/School%20Finance/Action%20Items/SF17‐232.xlsxhttp://www.ksde.org/Portals/0/School%20Finance/Action%20Items/SF17‐226.xlsx
991366d2017ADEQ00056

Appendix K-1:
Demonstrative Charts Regarding Achievement Gap Between
Free Lunch Students and Paid Lunch Students
This demonstrative exhibit was created using the achievement data that is attached as Appx. K-3.

0
10
20
30
40
50
60
70
Percen
t Not on Grade
Level
All Kansas School Districts
2015‐16 MATHPERCENT NOT ON GRADE LEVELFREE LUNCH V. PAID LUNCH
PERCENTAGE OF FREE LUNCH STUDENTSBELOW GRADE LEVEL
PERCENTAGE OF PAID LUNCH STUDENTSBELOW GRADE LEVEL
Data from: http://ksreportcard.ksde.org/2015_2016_Assessment_Full_File.xlsxEstimated student count calculated using 2015‐2016 Free and Reduced Headcount Report: http://datacentral.ksde.org/report_gen.aspx*Reduced Lunch Students excluded from this analysis
Math Statewide:Free Lunch Students Not on Grade Level: 39.82% 77,960 Students Paid Lunch Students Not on Grade Level: 15.82% 39,662 Students
991380
2017ADEQ00470
jah
Highlight

0
10
20
30
40
50
60
70
Percen
t Not on Grade
Level
All Kansas School Districts
2015‐16 READING (ELA)PERCENT NOT ON GRADE LEVELFREE LUNCH V. PAID LUNCH
PERCENTAGE OF FREE LUNCH STUDENTSBELOW GRADE LEVEL
PERCENTAGE OF PAID LUNCH STUDENTSBELOW GRADE LEVEL
Data from: http://ksreportcard.ksde.org/2015_2016_Assessment_Full_File.xlsxEstimated student count calculated using 2015‐2016 Free and Reduced Headcount Report: http://datacentral.ksde.org/report_gen.aspx*Reduced Lunch Students excluded from this analysis
Reading (ELA) Statewide:Free Lunch Students Not on Grade Level: 37.17% 72,772 Students Paid Lunch Students Not on Grade Level: 12.59% 31,564 Students
991380
2017ADEQ00471
jah
Highlight

TOTAL STUDENTS
# OFSTUDENTSAPPROVEDFOR FREE-LUNCHES
% OFSTUDENTSAPPROVEDFOR FREE-LUNCHES
# OF STUDENTSAPPROVED
FOR REDUCED-PRICE LUNCHES
% OF STUDENTSAPPROVED
FOR REDUCED-PRICE LUNCHES
% OF STUDENTSAPPROVEDFOR FREE-
OR REDUCED-PRICE LUNCHES
491575 195781 39.8 45085 9.2 49.0
Above data from Free and Reduced Headcount Report: http://datacentral.ksde.org/report_gen.aspx
Math Chart Calculations: Reading Chart Calculations:
195,781 free lunch students 195,781 free lunch studentsx 39.82% not on grade level for reading x 37.17% not on grade level for reading
77,960 students 72,772 students
491,575 total students 491,575 total students-240,866 free and reduced lunch students -240,866 free and reduced lunch students250,709 paid lunch students 250,709 paid lunch studentsx 15.82% not on grade level for reading x 12.59% not on grade level for reading
39,662 students 31,564 students
* At least one column has fewer than 10 students. The Family Educational Rights and Privacy Act (FERPA) prevents the disclosure of personally identifiable student information. KSDE has determined that any quantities less than 10 may be personally identifiable.
State Totals
2015-2016 STATE STUDENTS APPROVED FOR FREE- OR REDUCED-PRICE LUNCHES
PUBLIC SCHOOLS
# OF STUDENTSAPPROVEDFOR FREE-
OR REDUCED-PRICE LUNCHES
240866
991380
2017ADEQ00472

Appendix K-2:
Demonstrative Exhibit Regarding Year 2 Gains and Losses
Under S.B. 19 With Achievement Data
This demonstrative exhibit was created from publically available KSDE data, including data from S.B. 19 SF17-22 (attached as Appx. B) and data from S.B. 19 SF 17-226 (attached as Appx. E-2). The last two columns summarize the achievement data that is attached as Appx. K-3. That achievement data is publically available at http://ksreportcard.ksde.org/2015_2016_Assessment_Full_file.xlsx. It is appropriate to take judicial notice of this data, and Plaintiffs respectfully request that this Court do so. K.S.A. 60-409(b)(4); K.S.A. 60-412(c).

Senate Bill 19 ‐ Year 2Base Recalculated for 2nd Year General Fund Difference LOB Difference Combined Difference$4128 Base plus additional Districts Gaining: 267 176 262$12M Special Education Total of Increases: $283,185,415 $38,115,581 $318,346,597
Districts Losing: 19 110 24Total of Decreases: ‐$3,730,317 ‐$6,005,030 ‐$6,772,815 2015‐16 2015‐16
KSDE SF17‐232 KSDE SF17‐232 KSDE SF17‐232 KSDE SF17‐232 KSDE SF17‐226 KSDE SF17‐226 KSDE SF17‐226 Calculated Calculated Percent of Percent ofCol 1 Col 13 Col 14 Col 15 Col 3 Col 4 Col 5 Students Students
SF17‐145 Col 3 2017‐18 2016‐17 Combined Level One Level OneProposed 2017‐18 Est. 2015‐16 Proposed Adopted General Fund + LOB Not at Not at2017‐18 General Fund General Fund Difference Max LOB LOB Difference Difference Percentage Grade Level Grade Level
USD # County District Name Total Adj Enroll. (incl Sped) (incl Sped) (Col 13‐14) Budget Budget (Col 3 ‐ Col 4) (Col 15 + Col 5) Difference ELA MathTotal STATE TOTALS 472,772.5 3,347,435,682 3,067,980,584 279,455,098 1,099,865,522 1,067,746,822 32,118,684 311,573,782422 Kiowa Kiowa County 242.5 2,776,846 3,578,497 ‐801,651 719,330 711,197 8,133 ‐793,518 ‐18% 22.04 22.65476 Gray Copeland 94.5 1,071,126 1,243,863 ‐172,737 346,786 418,312 ‐71,526 ‐244,263 ‐15% 20.48 15.29283 Elk Elk Valley 114.5 1,465,207 1,632,725 ‐167,518 447,996 530,290 ‐82,294 ‐249,812 ‐12% 34.00 52.00390 Greenwood Hamilton 77.0 899,776 986,887 ‐87,111 267,597 315,985 ‐48,388 ‐135,499 ‐10% 23.25 13.95106 Ness Western Plains 109.5 1,243,949 1,324,391 ‐80,442 421,216 484,121 ‐62,905 ‐143,347 ‐8% 28.57 34.69247 Crawford Cherokee 523.1 4,640,453 4,845,318 ‐204,865 1,485,398 1,684,619 ‐199,222 ‐404,087 ‐6% 21.66 35.53225 Meade Fowler 145.5 1,416,119 1,476,642 ‐60,523 515,822 577,905 ‐62,083 ‐122,606 ‐6% 30.15 30.15269 Rooks Palco 107.5 1,155,827 1,193,889 ‐38,062 399,774 455,135 ‐55,361 ‐93,423 ‐6% 26.66 26.66334 Cloud Southern Cloud 185.0 2,034,524 2,097,190 ‐62,666 641,396 713,212 ‐71,817 ‐134,483 ‐5% 34.88 29.06387 Wilson Altoona‐Midway 184.5 1,946,662 2,005,422 ‐58,760 543,276 605,830 ‐62,554 ‐121,314 ‐5% 40.86 44.08217 Morton Rolla 165.5 1,584,529 1,617,836 ‐33,307 515,756 588,359 ‐72,603 ‐105,910 ‐5% 25.31 32.91475 Geary Geary County Schools 7,655.0 50,284,804 51,727,921 ‐1,443,117 16,070,236 17,546,515 ‐1,476,279 ‐2,919,396 ‐4% 23.54 30.00207 LeavenworthFt Leavenworth 1,704.6 9,116,943 9,368,637 ‐251,694 3,215,000 3,539,416 ‐324,416 ‐576,110 ‐4% 7.35 7.93371 Gray Montezuma 215.0 2,022,808 2,083,340 ‐60,532 641,078 691,455 ‐50,378 ‐110,910 ‐4% 12.85 12.67326 Phillips Logan 151.0 1,567,225 1,601,672 ‐34,447 512,835 565,637 ‐52,802 ‐87,249 ‐4% 20.25 25.31243 Coffey Lebo‐Waverly 430.7 3,555,722 3,578,852 ‐23,130 1,142,238 1,280,739 ‐138,501 ‐161,631 ‐3% 20.00 20.51399 Russell Paradise 113.7 1,241,844 1,245,918 ‐4,074 405,793 446,473 ‐40,680 ‐44,754 ‐3% 26.00 30.00352 Sherman Goodland 907.0 7,014,813 7,080,957 ‐66,144 2,238,508 2,408,048 ‐169,540 ‐235,684 ‐2% 23.54 22.07344 Linn Pleasanton 347.0 2,914,421 2,899,813 14,608 940,193 987,719 ‐47,526 ‐32,918 ‐1% 23.65 23.78337 Jackson Royal Valley 834.6 6,685,498 6,575,424 110,074 2,159,133 2,287,502 ‐128,369 ‐18,295 0% 26.99 26.93481 Dickinson Rural Vista 309.0 2,560,327 2,522,462 37,865 868,296 921,368 ‐53,072 ‐15,207 0% 12.59 22.83311 Reno Pretty Prairie 258.0 2,240,358 2,206,276 34,082 721,403 765,242 ‐43,839 ‐9,757 0% 19.25 16.41358 Sumner Oxford 294.0 3,070,576 3,019,795 50,781 865,587 925,529 ‐59,942 ‐9,161 0% 24.62 38.16275 Logan Triplains 70.5 802,774 772,176 30,598 289,902 323,981 ‐34,079 ‐3,481 0% 8.82 .00329 Wabaunsee Mill Creek Valley 440.0 3,684,961 3,618,448 66,513 1,203,801 1,269,535 ‐65,734 779 0% 13.77 18.66456 Osage Marais Des Cygnes Val 236.5 2,347,813 2,427,350 ‐79,537 759,501 670,000 89,501 9,964 0% 24.52 23.58223 Washington Barnes 367.4 3,141,542 3,125,405 16,137 1,009,218 1,011,921 ‐2,703 13,434 0% 19.40 18.51351 Stafford Macksville 231.0 2,377,825 2,323,295 54,530 764,543 803,447 ‐38,904 15,626 0% 23.77 37.93377 Atchison Atchison Co Comm Sch 569.5 5,000,310 4,892,821 107,489 1,598,093 1,687,938 ‐89,845 17,644 0% 30.79 29.02114 Doniphan Riverside 617.3 5,216,114 5,115,339 100,775 1,664,162 1,747,132 ‐82,970 17,805 0% 31.66 38.99471 Cowley Dexter 144.0 1,433,895 1,393,225 40,670 471,905 495,073 ‐23,168 17,502 1% 11.53 28.20338 Jefferson Valley Falls 374.5 3,170,495 3,101,407 69,088 1,016,130 1,056,443 ‐40,313 28,775 1% 17.48 17.48294 Decatur Oberlin 336.0 2,792,739 2,753,050 39,689 897,780 904,293 ‐6,513 33,176 1% 23.60 26.87
Data from:http://www.ksde.org/Portals/0/School%20Finance/Action%20Items/SF17‐232.xlsxhttp://www.ksde.org/Portals/0/School%20Finance/Action%20Items/SF17‐226.xlsxhttp://ksreportcard.ksde.org/2015_2016_Assessment_Full_File.xlsx 991366d‐e2017ADEQ00057

Senate Bill 19 ‐ Year 2KSDE SF17‐232 KSDE SF17‐232 KSDE SF17‐232 KSDE SF17‐232 KSDE SF17‐226 KSDE SF17‐226 KSDE SF17‐226 Calculated Calculated Percent of Percent of
Col 1 Col 13 Col 14 Col 15 Col 3 Col 4 Col 5 Students StudentsSF17‐145 Col 3 2017‐18 2016‐17 Combined Level One Level One
Proposed 2017‐18 Est. 2015‐16 Proposed Adopted General Fund + LOB Not at Not at2017‐18 General Fund General Fund Difference Max LOB LOB Difference Difference Percentage Grade Level Grade Level
USD # County District Name Total Adj Enroll. (incl Sped) (incl Sped) (Col 13‐14) Budget Budget (Col 3 ‐ Col 4) (Col 15 + Col 5) Difference ELA MathTotal STATE TOTALS 472,772.5 3,347,435,682 3,067,980,584 279,455,098 1,099,865,522 1,067,746,822 32,118,684 311,573,782454 Osage Burlingame Public Scho 300.0 2,505,022 2,432,518 72,504 805,490 844,149 ‐38,659 33,845 1% 28.48 20.60270 Rooks Plainville 340.3 2,862,045 2,778,018 84,027 916,545 962,024 ‐45,479 38,548 1% 20.63 33.33498 Marshall Valley Heights 395.0 3,350,423 3,259,081 91,342 1,121,239 1,173,503 ‐52,264 39,078 1% 18.75 19.23419 McPherson Canton‐Galva 371.4 3,127,979 3,032,076 95,903 1,105,454 1,151,022 ‐45,568 50,335 1% 18.53 20.00335 Jackson North Jackson 369.5 3,109,319 3,016,379 92,940 1,002,884 1,035,405 ‐32,521 60,419 1% 19.21 17.24449 LeavenworthEaston 612.5 5,031,020 4,888,061 142,959 1,611,018 1,687,280 ‐76,262 66,697 1% 20.64 23.14307 Saline Ell‐Saline 462.5 3,675,911 3,556,529 119,382 1,182,766 1,233,338 ‐50,572 68,810 1% 20.96 27.71365 Anderson Garnett 1,012.5 7,386,564 7,152,727 233,837 2,367,711 2,484,409 ‐116,698 117,139 1% 17.22 18.46212 Norton Northern Valley 167.5 1,734,216 1,666,815 67,401 561,340 585,990 ‐24,650 42,751 2% 17.94 11.53444 Rice Little River 321.9 2,729,745 2,640,106 89,639 875,318 911,216 ‐35,899 53,740 2% 17.54 18.96216 Kearny Deerfield 202.5 2,120,760 2,025,730 95,030 706,172 741,598 ‐35,427 59,603 2% 35.29 49.41245 Coffey LeRoy‐Gridley 212.0 2,062,592 1,978,797 83,795 674,494 695,103 ‐20,609 63,186 2% 16.49 20.61392 Osborne Osborne County 284.1 2,509,336 2,411,464 97,872 815,300 845,608 ‐30,308 67,564 2% 20.27 22.37322 Pottawatom Onaga‐Havensville‐Wh 301.0 2,558,245 2,465,408 92,837 821,559 840,540 ‐18,981 73,856 2% 17.42 21.21423 McPherson Moundridge 392.9 3,171,464 3,057,321 114,143 1,118,225 1,153,795 ‐35,570 78,573 2% 15.90 18.18487 Dickinson Herington 446.3 3,675,958 3,547,042 128,916 1,185,371 1,231,439 ‐46,068 82,848 2% 28.31 22.72347 Edwards Kinsley‐Offerle 338.0 3,167,799 3,066,215 101,584 1,018,316 1,032,998 ‐14,683 86,901 2% 19.37 18.12226 Meade Meade 393.9 3,020,869 2,890,796 130,073 1,103,067 1,138,479 ‐35,412 94,661 2% 17.83 28.48284 Chase Chase County 353.0 3,017,732 2,889,212 128,520 984,356 1,015,472 ‐31,116 97,404 2% 16.66 23.29505 Labette Chetopa‐St. Paul 442.0 3,626,213 3,480,503 145,710 1,184,350 1,225,972 ‐41,622 104,088 2% 32.12 38.91467 Wichita Leoti 402.0 3,377,865 3,230,196 147,669 1,100,657 1,141,740 ‐41,083 106,586 2% 22.27 17.91342 Jefferson McLouth 471.0 4,100,651 3,952,933 147,718 1,309,410 1,340,050 ‐30,640 117,078 2% 25.39 34.37205 Butler Bluestem 497.8 4,297,878 4,118,843 179,035 1,395,993 1,444,620 ‐48,627 130,408 2% 33.21 40.00336 Jackson Holton 1,064.5 7,795,788 7,546,509 249,279 2,459,699 2,554,123 ‐94,425 154,854 2% 19.12 16.51343 Jefferson Perry Public Schools 759.5 6,163,707 5,951,585 212,122 1,973,199 2,024,282 ‐51,083 161,039 2% 23.31 19.68468 Lane Healy Public Schools 70.0 826,131 783,445 42,686 293,733 306,623 ‐12,890 29,796 3% 31.03 45.45360 Sumner Caldwell 233.0 2,228,553 2,123,901 104,652 783,254 806,220 ‐22,966 81,686 3% 23.14 37.19386 Greenwood Madison‐Virgil 229.0 2,237,559 2,137,073 100,486 714,289 732,690 ‐18,401 82,085 3% 21.31 32.52374 Haskell Sublette 461.7 3,913,803 3,771,933 141,870 1,270,187 1,277,892 ‐7,706 134,164 3% 20.85 25.11206 Butler Remington‐Whitewate 510.2 4,300,366 4,190,969 109,397 1,378,848 1,338,988 39,860 149,257 3% 14.33 18.42246 Crawford Northeast 470.5 4,243,169 4,050,607 192,562 1,357,205 1,383,416 ‐26,212 166,350 3% 24.24 35.49102 Gray Cimmaron‐Ensign 646.5 4,993,347 4,747,331 246,016 1,616,679 1,671,502 ‐54,823 191,193 3% 18.18 13.29315 Thomas Colby Public Schools 893.4 6,286,543 5,977,559 308,984 2,125,594 2,176,376 ‐50,782 258,202 3% 25.97 28.92312 Reno Haven Public Schools 817.0 6,894,741 6,576,688 318,053 2,197,279 2,248,779 ‐51,500 266,553 3% 18.64 27.57394 Butler Rose Hill Public Schools 1,568.5 9,507,726 9,109,830 397,896 3,340,976 3,398,568 ‐57,592 340,304 3% 22.83 20.89464 LeavenworthTonganoxie 1,954.6 11,801,952 11,526,430 275,522 3,792,585 3,684,608 107,977 383,499 3% 23.05 25.36367 Miami Osawatomie 1,154.5 9,421,270 8,988,119 433,151 3,007,307 3,027,917 ‐20,610 412,541 3% 30.79 32.61416 Miami Louisburg 1,716.4 9,877,974 9,383,383 494,591 3,470,018 3,528,496 ‐58,478 436,113 3% 11.13 16.86
Data from:http://www.ksde.org/Portals/0/School%20Finance/Action%20Items/SF17‐232.xlsxhttp://www.ksde.org/Portals/0/School%20Finance/Action%20Items/SF17‐226.xlsxhttp://ksreportcard.ksde.org/2015_2016_Assessment_Full_File.xlsx 991366d‐e2017ADEQ00058

Senate Bill 19 ‐ Year 2KSDE SF17‐232 KSDE SF17‐232 KSDE SF17‐232 KSDE SF17‐232 KSDE SF17‐226 KSDE SF17‐226 KSDE SF17‐226 Calculated Calculated Percent of Percent of
Col 1 Col 13 Col 14 Col 15 Col 3 Col 4 Col 5 Students StudentsSF17‐145 Col 3 2017‐18 2016‐17 Combined Level One Level One
Proposed 2017‐18 Est. 2015‐16 Proposed Adopted General Fund + LOB Not at Not at2017‐18 General Fund General Fund Difference Max LOB LOB Difference Difference Percentage Grade Level Grade Level
USD # County District Name Total Adj Enroll. (incl Sped) (incl Sped) (Col 13‐14) Budget Budget (Col 3 ‐ Col 4) (Col 15 + Col 5) Difference ELA MathTotal STATE TOTALS 472,772.5 3,347,435,682 3,067,980,584 279,455,098 1,099,865,522 1,067,746,822 32,118,684 311,573,782209 Stevens Moscow Public Schools 173.0 1,807,029 1,688,160 118,869 647,904 674,130 ‐26,226 92,643 4% 35.29 44.18200 Greeley Greeley County School 252.5 2,218,489 2,092,775 125,714 722,582 737,264 ‐14,682 111,032 4% 27.20 23.01482 Lane Dighton 223.8 2,003,977 1,898,442 105,535 657,631 650,000 7,631 113,166 4% 14.75 13.93395 Rush LaCrosse 290.0 2,446,414 2,319,352 127,062 819,241 830,000 ‐10,759 116,303 4% 18.12 28.12393 Dickinson Solomon 313.5 2,635,628 2,489,495 146,133 860,810 875,358 ‐14,548 131,585 4% 23.23 34.50463 Cowley Udall 339.7 2,831,278 2,672,480 158,798 909,037 928,029 ‐18,992 139,806 4% 24.05 27.50350 Stafford St John‐Hudson 336.9 2,935,644 2,766,265 169,379 970,298 981,774 ‐11,476 157,903 4% 13.42 16.66251 Lyon North Lyon County 423.0 3,704,230 3,504,542 199,688 1,186,954 1,211,303 ‐24,349 175,339 4% 16.44 20.35298 Lincoln Lincoln 360.0 3,140,659 2,976,777 163,882 1,008,533 996,229 12,304 176,186 4% 17.90 16.66504 Labette Oswego 462.0 3,746,259 3,538,395 207,864 1,207,472 1,226,392 ‐18,921 188,943 4% 17.80 17.88356 Sumner Conway Springs 484.8 3,799,616 3,587,833 211,783 1,227,887 1,248,630 ‐20,744 191,039 4% 14.65 19.49439 Harvey Sedgwick Public Schoo 477.5 3,748,639 3,551,172 197,467 1,204,999 1,196,000 8,999 206,466 4% 18.50 15.41215 Kearny Lakin 623.5 4,907,627 4,634,325 273,302 1,569,146 1,622,083 ‐52,937 220,365 4% 17.79 15.18306 Saline Southeast Of Saline 692.0 5,248,630 4,982,097 266,533 1,685,969 1,717,612 ‐31,643 234,890 4% 21.35 20.62404 Cherokee Riverton 736.0 5,746,559 5,450,546 296,013 1,846,935 1,863,621 ‐16,686 279,327 4% 29.18 37.81211 Norton Norton Community Sch 701.2 5,496,845 5,215,978 280,867 1,760,368 1,759,037 1,331 282,198 4% 15.81 19.20499 Cherokee Galena 813.5 6,441,811 6,101,523 340,288 2,058,557 2,092,419 ‐33,862 306,426 4% 24.68 28.03331 Kingman Kingman ‐ Norwich 910.5 7,399,836 6,982,710 417,126 2,321,570 2,349,718 ‐28,149 388,977 4% 22.17 28.60264 Sedgwick Clearwater 1,122.0 7,775,540 7,375,409 400,131 2,474,911 2,471,795 3,116 403,247 4% 19.04 23.93493 Cherokee Columbus 967.0 7,653,153 7,194,930 458,223 2,463,426 2,496,158 ‐32,732 425,491 4% 20.55 30.99375 Butler Circle 1,908.3 11,392,229 10,902,291 489,938 3,611,732 3,556,907 54,825 544,763 4% 13.62 18.12490 Butler El Dorado 1,904.3 12,496,492 11,822,625 673,867 4,105,341 4,168,515 ‐63,174 610,693 4% 24.27 28.60290 Franklin Ottawa 2,418.9 15,879,907 15,090,251 789,656 5,058,769 5,069,420 ‐10,651 779,005 4% 25.30 30.89450 Shawnee Shawnee Heights 3,512.5 22,105,805 21,026,744 1,079,061 7,080,208 6,967,765 112,443 1,191,504 4% 19.75 21.25308 Reno Hutchinson Public Scho 4,826.2 32,076,511 30,538,022 1,538,489 10,309,757 10,287,770 21,987 1,560,476 4% 28.03 31.34474 Kiowa Haviland 103.5 1,149,185 1,075,537 73,648 378,734 379,947 ‐1,213 72,435 5% 15.00 15.00496 Pawnee Pawnee Heights 143.5 1,468,734 1,449,729 19,005 522,714 442,999 79,715 98,720 5% 20.00 16.92401 Rice Chase‐Raymond 167.0 1,790,243 1,665,314 124,929 576,644 579,066 ‐2,422 122,507 5% 43.20 51.85110 Phillips Thunder Ridge Schools 221.0 2,328,468 2,188,013 140,455 763,038 767,887 ‐4,849 135,606 5% 17.85 20.86477 Gray Ingalls 239.5 2,030,943 1,888,480 142,463 667,730 674,060 ‐6,331 136,132 5% 18.58 20.17227 Hodgeman Hodgeman County Sch 297.5 2,445,412 2,296,269 149,143 821,690 820,208 1,482 150,625 5% 16.66 16.12349 Stafford Stafford 246.4 2,377,673 2,242,180 135,493 757,913 740,990 16,923 152,416 5% 32.67 23.52411 Marion Goessel 276.0 2,468,533 2,319,724 148,809 870,495 863,699 6,796 155,605 5% 14.96 12.92398 Marion Peabody‐Burns 250.0 2,521,074 2,357,251 163,823 900,807 906,437 ‐5,630 158,193 5% 37.50 46.42397 Marion Centre 215.5 2,863,221 2,677,761 185,460 756,587 764,141 ‐7,554 177,906 5% 21.67 26.57288 Franklin Central Heights 555.0 4,886,475 4,563,453 323,022 1,575,081 1,592,996 ‐17,915 305,107 5% 22.30 29.71258 Allen Humboldt 607.0 5,472,581 5,183,213 289,368 1,549,247 1,515,110 34,137 323,505 5% 27.71 34.04460 Harvey Hesston 801.6 5,511,008 5,147,171 363,837 1,951,794 1,954,110 ‐2,316 361,521 5% 11.64 10.73
Data from:http://www.ksde.org/Portals/0/School%20Finance/Action%20Items/SF17‐232.xlsxhttp://www.ksde.org/Portals/0/School%20Finance/Action%20Items/SF17‐226.xlsxhttp://ksreportcard.ksde.org/2015_2016_Assessment_Full_File.xlsx 991366d‐e2017ADEQ00059

Senate Bill 19 ‐ Year 2KSDE SF17‐232 KSDE SF17‐232 KSDE SF17‐232 KSDE SF17‐232 KSDE SF17‐226 KSDE SF17‐226 KSDE SF17‐226 Calculated Calculated Percent of Percent of
Col 1 Col 13 Col 14 Col 15 Col 3 Col 4 Col 5 Students StudentsSF17‐145 Col 3 2017‐18 2016‐17 Combined Level One Level One
Proposed 2017‐18 Est. 2015‐16 Proposed Adopted General Fund + LOB Not at Not at2017‐18 General Fund General Fund Difference Max LOB LOB Difference Difference Percentage Grade Level Grade Level
USD # County District Name Total Adj Enroll. (incl Sped) (incl Sped) (Col 13‐14) Budget Budget (Col 3 ‐ Col 4) (Col 15 + Col 5) Difference ELA MathTotal STATE TOTALS 472,772.5 3,347,435,682 3,067,980,584 279,455,098 1,099,865,522 1,067,746,822 32,118,684 311,573,782440 Harvey Halstead 756.0 5,848,785 5,459,754 389,031 1,880,125 1,883,765 ‐3,640 385,391 5% 20.05 21.11362 Linn Prairie View 908.6 7,543,087 7,082,674 460,413 2,451,433 2,459,649 ‐8,216 452,197 5% 26.01 31.90495 Pawnee Ft Larned 914.6 7,206,968 6,734,102 472,866 2,312,953 2,307,743 5,210 478,076 5% 20.27 33.56309 Reno Nickerson 1,108.5 8,593,099 7,969,174 623,925 2,722,697 2,769,732 ‐47,035 576,890 5% 23.07 25.65257 Allen Iola 1,264.0 9,785,499 9,124,956 660,543 3,133,101 3,150,882 ‐17,781 642,762 5% 23.89 33.02267 Sedgwick Renwick 1,891.0 11,090,455 10,363,693 726,762 3,912,041 3,900,441 11,600 738,362 5% 12.38 14.41469 LeavenworthLansing 2,631.8 16,259,956 15,448,049 811,907 5,190,339 4,884,132 306,207 1,118,114 5% 17.06 20.93345 Shawnee Seaman 3,746.6 23,831,059 22,490,108 1,340,951 7,587,903 7,475,889 112,014 1,452,965 5% 17.00 19.19291 Gove Grinnell Public Schools 89.0 961,665 888,893 72,772 218,046 220,020 ‐1,974 70,798 6% 28.35 16.41332 Kingman Cunningham 157.0 1,668,653 1,537,406 131,247 535,597 537,156 ‐1,559 129,688 6% 10.97 18.29432 Ellis Victoria 297.0 2,240,718 2,082,864 157,854 740,557 739,614 943 158,797 6% 13.92 17.72256 Allen Marmaton Valley 283.0 2,633,762 2,447,564 186,198 861,789 863,127 ‐1,338 184,860 6% 19.46 20.27462 Cowley Central 312.7 2,826,842 2,625,668 201,174 911,051 907,277 3,774 204,948 6% 30.06 28.96108 Washington Washington Co. Schoo 348.5 2,955,602 2,724,711 230,891 1,006,778 1,006,913 ‐135 230,756 6% 19.65 25.28452 Stanton Stanton County 444.7 3,696,270 3,387,164 309,106 1,200,740 1,212,863 ‐12,124 296,982 6% 33.16 26.63235 Bourbon Uniontown 441.0 3,893,570 3,604,816 288,754 1,256,218 1,246,690 9,528 298,282 6% 18.09 16.74252 Lyon Southern Lyon County 512.0 4,236,409 3,915,865 320,544 1,347,029 1,350,252 ‐3,224 317,320 6% 21.56 18.82494 Hamilton Syracuse 528.5 4,385,635 4,061,165 324,470 1,420,189 1,423,018 ‐2,829 321,641 6% 31.95 46.31376 Rice Sterling 523.2 4,217,003 3,904,628 312,375 1,353,151 1,337,550 15,601 327,976 6% 14.39 19.62101 Neosho Erie‐Galesburg 518.0 4,725,809 4,381,582 344,227 1,533,214 1,539,410 ‐6,196 338,031 6% 33.57 34.43239 Ottawa North Ottawa County 616.9 4,818,858 4,457,347 361,511 1,705,161 1,698,503 6,658 368,169 6% 19.28 14.65289 Franklin Wellsville 773.0 5,703,891 5,309,486 394,405 1,832,762 1,833,608 ‐846 393,559 6% 16.94 21.46430 Brown South Brown County 570.0 5,235,661 4,848,522 387,139 1,688,792 1,680,979 7,813 394,952 6% 31.48 20.37484 Wilson Fredonia 662.8 5,238,496 4,844,575 393,921 1,720,538 1,719,460 1,078 394,999 6% 27.40 31.83372 Shawnee Silver Lake 694.0 4,943,794 4,558,626 385,168 1,603,245 1,592,469 10,776 395,944 6% 9.78 10.32357 Sumner Belle Plaine 601.0 4,942,639 4,560,577 382,062 1,604,564 1,588,804 15,760 397,822 6% 20.54 33.90364 Marshall Marysville 713.5 5,455,773 5,067,244 388,529 1,820,912 1,803,805 17,107 405,636 6% 19.66 25.48378 Riley Riley County 686.9 5,284,400 4,887,860 396,540 1,698,204 1,679,444 18,760 415,300 6% 12.91 17.63218 Morton Elkhart 481.9 6,988,669 6,499,462 489,207 1,238,345 1,288,319 ‐49,974 439,233 6% 22.68 35.25340 Jefferson Jefferson West 859.5 6,444,870 6,009,462 435,408 2,065,445 2,035,421 30,024 465,432 6% 19.13 19.34400 McPherson Smoky Valley 921.5 7,319,979 6,867,471 452,508 2,396,796 2,331,628 65,168 517,676 6% 17.46 24.94434 Osage Santa Fe Trail 999.7 8,118,984 7,548,064 570,920 2,590,289 2,562,170 28,119 599,039 6% 19.05 19.84473 Dickinson Chapman 1,086.8 7,797,904 7,208,388 589,516 2,499,830 2,475,710 24,120 613,636 6% 12.21 23.72379 Clay Clay Center 1,349.6 9,101,874 8,466,673 635,201 2,911,443 2,880,460 30,983 666,184 6% 19.79 20.11402 Butler Augusta 2,173.3 13,195,400 12,118,537 1,076,863 4,213,425 4,265,279 ‐51,854 1,025,009 6% 22.62 25.84313 Reno Buhler 2,276.3 14,347,852 13,360,139 987,713 4,669,690 4,617,490 52,200 1,039,913 6% 17.60 20.03465 Cowley Winfield 2,210.7 15,063,680 14,020,364 1,043,316 4,831,660 4,821,269 10,391 1,053,707 6% 22.33 22.91428 Barton Great Bend 3,022.5 20,484,682 18,939,062 1,545,620 6,582,652 6,499,570 83,082 1,628,702 6% 27.72 35.71
Data from:http://www.ksde.org/Portals/0/School%20Finance/Action%20Items/SF17‐232.xlsxhttp://www.ksde.org/Portals/0/School%20Finance/Action%20Items/SF17‐226.xlsxhttp://ksreportcard.ksde.org/2015_2016_Assessment_Full_File.xlsx 991366d‐e2017ADEQ00060
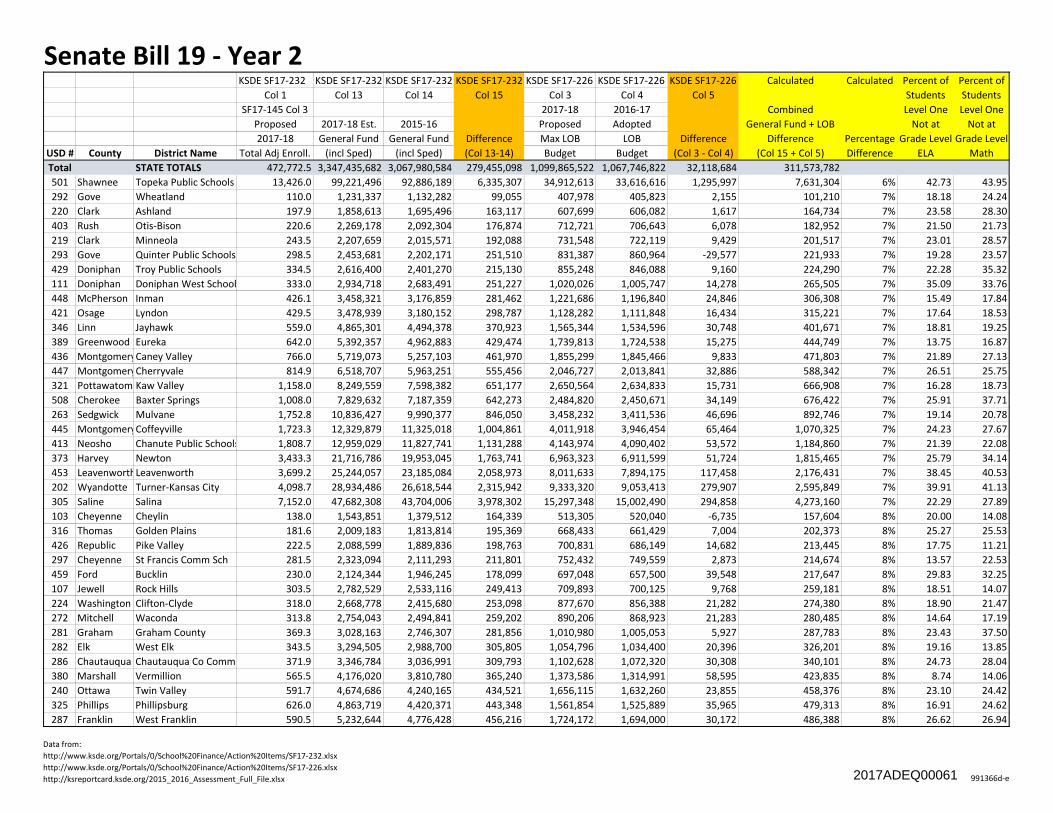
Senate Bill 19 ‐ Year 2KSDE SF17‐232 KSDE SF17‐232 KSDE SF17‐232 KSDE SF17‐232 KSDE SF17‐226 KSDE SF17‐226 KSDE SF17‐226 Calculated Calculated Percent of Percent of
Col 1 Col 13 Col 14 Col 15 Col 3 Col 4 Col 5 Students StudentsSF17‐145 Col 3 2017‐18 2016‐17 Combined Level One Level One
Proposed 2017‐18 Est. 2015‐16 Proposed Adopted General Fund + LOB Not at Not at2017‐18 General Fund General Fund Difference Max LOB LOB Difference Difference Percentage Grade Level Grade Level
USD # County District Name Total Adj Enroll. (incl Sped) (incl Sped) (Col 13‐14) Budget Budget (Col 3 ‐ Col 4) (Col 15 + Col 5) Difference ELA MathTotal STATE TOTALS 472,772.5 3,347,435,682 3,067,980,584 279,455,098 1,099,865,522 1,067,746,822 32,118,684 311,573,782501 Shawnee Topeka Public Schools 13,426.0 99,221,496 92,886,189 6,335,307 34,912,613 33,616,616 1,295,997 7,631,304 6% 42.73 43.95292 Gove Wheatland 110.0 1,231,337 1,132,282 99,055 407,978 405,823 2,155 101,210 7% 18.18 24.24220 Clark Ashland 197.9 1,858,613 1,695,496 163,117 607,699 606,082 1,617 164,734 7% 23.58 28.30403 Rush Otis‐Bison 220.6 2,269,178 2,092,304 176,874 712,721 706,643 6,078 182,952 7% 21.50 21.73219 Clark Minneola 243.5 2,207,659 2,015,571 192,088 731,548 722,119 9,429 201,517 7% 23.01 28.57293 Gove Quinter Public Schools 298.5 2,453,681 2,202,171 251,510 831,387 860,964 ‐29,577 221,933 7% 19.28 23.57429 Doniphan Troy Public Schools 334.5 2,616,400 2,401,270 215,130 855,248 846,088 9,160 224,290 7% 22.28 35.32111 Doniphan Doniphan West School 333.0 2,934,718 2,683,491 251,227 1,020,026 1,005,747 14,278 265,505 7% 35.09 33.76448 McPherson Inman 426.1 3,458,321 3,176,859 281,462 1,221,686 1,196,840 24,846 306,308 7% 15.49 17.84421 Osage Lyndon 429.5 3,478,939 3,180,152 298,787 1,128,282 1,111,848 16,434 315,221 7% 17.64 18.53346 Linn Jayhawk 559.0 4,865,301 4,494,378 370,923 1,565,344 1,534,596 30,748 401,671 7% 18.81 19.25389 Greenwood Eureka 642.0 5,392,357 4,962,883 429,474 1,739,813 1,724,538 15,275 444,749 7% 13.75 16.87436 MontgomeryCaney Valley 766.0 5,719,073 5,257,103 461,970 1,855,299 1,845,466 9,833 471,803 7% 21.89 27.13447 MontgomeryCherryvale 814.9 6,518,707 5,963,251 555,456 2,046,727 2,013,841 32,886 588,342 7% 26.51 25.75321 Pottawatom Kaw Valley 1,158.0 8,249,559 7,598,382 651,177 2,650,564 2,634,833 15,731 666,908 7% 16.28 18.73508 Cherokee Baxter Springs 1,008.0 7,829,632 7,187,359 642,273 2,484,820 2,450,671 34,149 676,422 7% 25.91 37.71263 Sedgwick Mulvane 1,752.8 10,836,427 9,990,377 846,050 3,458,232 3,411,536 46,696 892,746 7% 19.14 20.78445 MontgomeryCoffeyville 1,723.3 12,329,879 11,325,018 1,004,861 4,011,918 3,946,454 65,464 1,070,325 7% 24.23 27.67413 Neosho Chanute Public Schools 1,808.7 12,959,029 11,827,741 1,131,288 4,143,974 4,090,402 53,572 1,184,860 7% 21.39 22.08373 Harvey Newton 3,433.3 21,716,786 19,953,045 1,763,741 6,963,323 6,911,599 51,724 1,815,465 7% 25.79 34.14453 LeavenworthLeavenworth 3,699.2 25,244,057 23,185,084 2,058,973 8,011,633 7,894,175 117,458 2,176,431 7% 38.45 40.53202 Wyandotte Turner‐Kansas City 4,098.7 28,934,486 26,618,544 2,315,942 9,333,320 9,053,413 279,907 2,595,849 7% 39.91 41.13305 Saline Salina 7,152.0 47,682,308 43,704,006 3,978,302 15,297,348 15,002,490 294,858 4,273,160 7% 22.29 27.89103 Cheyenne Cheylin 138.0 1,543,851 1,379,512 164,339 513,305 520,040 ‐6,735 157,604 8% 20.00 14.08316 Thomas Golden Plains 181.6 2,009,183 1,813,814 195,369 668,433 661,429 7,004 202,373 8% 25.27 25.53426 Republic Pike Valley 222.5 2,088,599 1,889,836 198,763 700,831 686,149 14,682 213,445 8% 17.75 11.21297 Cheyenne St Francis Comm Sch 281.5 2,323,094 2,111,293 211,801 752,432 749,559 2,873 214,674 8% 13.57 22.53459 Ford Bucklin 230.0 2,124,344 1,946,245 178,099 697,048 657,500 39,548 217,647 8% 29.83 32.25107 Jewell Rock Hills 303.5 2,782,529 2,533,116 249,413 709,893 700,125 9,768 259,181 8% 18.51 14.07224 Washington Clifton‐Clyde 318.0 2,668,778 2,415,680 253,098 877,670 856,388 21,282 274,380 8% 18.90 21.47272 Mitchell Waconda 313.8 2,754,043 2,494,841 259,202 890,206 868,923 21,283 280,485 8% 14.64 17.19281 Graham Graham County 369.3 3,028,163 2,746,307 281,856 1,010,980 1,005,053 5,927 287,783 8% 23.43 37.50282 Elk West Elk 343.5 3,294,505 2,988,700 305,805 1,054,796 1,034,400 20,396 326,201 8% 19.16 13.85286 Chautauqua Chautauqua Co Comm 371.9 3,346,784 3,036,991 309,793 1,102,628 1,072,320 30,308 340,101 8% 24.73 28.04380 Marshall Vermillion 565.5 4,176,020 3,810,780 365,240 1,373,586 1,314,991 58,595 423,835 8% 8.74 14.06240 Ottawa Twin Valley 591.7 4,674,686 4,240,165 434,521 1,656,115 1,632,260 23,855 458,376 8% 23.10 24.42325 Phillips Phillipsburg 626.0 4,863,719 4,420,371 443,348 1,561,854 1,525,889 35,965 479,313 8% 16.91 24.62287 Franklin West Franklin 590.5 5,232,644 4,776,428 456,216 1,724,172 1,694,000 30,172 486,388 8% 26.62 26.94
Data from:http://www.ksde.org/Portals/0/School%20Finance/Action%20Items/SF17‐232.xlsxhttp://www.ksde.org/Portals/0/School%20Finance/Action%20Items/SF17‐226.xlsxhttp://ksreportcard.ksde.org/2015_2016_Assessment_Full_File.xlsx 991366d‐e2017ADEQ00061

Senate Bill 19 ‐ Year 2KSDE SF17‐232 KSDE SF17‐232 KSDE SF17‐232 KSDE SF17‐232 KSDE SF17‐226 KSDE SF17‐226 KSDE SF17‐226 Calculated Calculated Percent of Percent of
Col 1 Col 13 Col 14 Col 15 Col 3 Col 4 Col 5 Students StudentsSF17‐145 Col 3 2017‐18 2016‐17 Combined Level One Level One
Proposed 2017‐18 Est. 2015‐16 Proposed Adopted General Fund + LOB Not at Not at2017‐18 General Fund General Fund Difference Max LOB LOB Difference Difference Percentage Grade Level Grade Level
USD # County District Name Total Adj Enroll. (incl Sped) (incl Sped) (Col 13‐14) Budget Budget (Col 3 ‐ Col 4) (Col 15 + Col 5) Difference ELA MathTotal STATE TOTALS 472,772.5 3,347,435,682 3,067,980,584 279,455,098 1,099,865,522 1,067,746,822 32,118,684 311,573,782420 Osage Osage City 666.5 5,176,629 4,707,743 468,886 1,667,450 1,623,808 43,642 512,528 8% 23.54 22.15268 Sedgwick Cheney 781.1 5,756,376 5,278,271 478,105 1,852,040 1,761,337 90,703 568,808 8% 10.75 13.25461 Wilson Neodesha 719.0 5,490,643 4,975,751 514,892 1,956,868 1,891,821 65,047 579,939 8% 27.37 24.58249 Crawford Frontenac Public Schoo 929.0 6,519,329 5,943,802 575,527 2,095,615 2,034,196 61,419 636,946 8% 17.25 22.86248 Crawford Girard 1,017.8 7,537,091 6,865,540 671,551 2,415,487 2,335,075 80,412 751,963 8% 19.67 28.41382 Pratt Pratt 1,130.0 8,599,206 7,820,670 778,536 2,697,621 2,610,764 86,857 865,393 8% 28.16 27.46320 Pottawatom Wamego 1,524.6 9,568,212 8,686,620 881,592 3,034,971 3,002,851 32,120 913,712 8% 19.37 23.89353 Sumner Wellington 1,596.5 11,245,438 10,303,079 942,359 3,591,444 3,471,792 119,652 1,062,011 8% 23.77 22.92214 Grant Ulysses 1,705.0 11,516,481 10,483,646 1,032,835 3,701,060 3,649,066 51,994 1,084,829 8% 38.70 36.83368 Miami Paola 2,010.5 12,585,350 11,438,203 1,147,147 4,435,818 4,307,408 128,410 1,275,557 8% 17.41 18.02418 McPherson McPherson 2,364.4 14,876,224 13,537,641 1,338,583 5,204,404 5,028,614 175,790 1,514,373 8% 24.14 28.85253 Lyon Emporia 4,503.7 30,430,931 27,754,159 2,676,772 9,777,520 9,558,122 219,398 2,896,170 8% 22.71 25.20260 Sedgwick Derby 6,709.8 41,953,167 38,452,930 3,500,237 13,418,556 12,767,588 650,968 4,151,205 8% 19.92 23.28383 Riley Manhattan‐Ogden 6,144.0 40,385,449 36,683,300 3,702,149 13,901,752 13,364,245 537,507 4,239,656 8% 13.56 16.72233 Johnson Olathe 28,783.6 188,016,438 171,561,092 16,455,346 66,206,824 64,120,804 2,086,020 18,541,366 8% 15.24 17.83259 Sedgwick Wichita 48,737.2 359,807,579 327,995,113 31,812,466 115,013,862 111,369,465 3,644,397 35,456,863 8% 37.38 41.58369 Harvey Burrton 245.5 2,227,234 2,014,898 212,336 718,244 696,502 21,742 234,078 9% 20.83 22.50381 Ford Spearville 355.0 2,740,066 2,460,894 279,172 892,397 884,315 8,082 287,254 9% 24.19 17.20310 Reno Fairfield 296.0 2,889,178 2,602,052 287,126 951,587 930,708 20,879 308,005 9% 30.40 41.21300 Comanche Comanche County 325.5 2,970,879 2,653,255 317,624 951,792 936,283 15,509 333,133 9% 23.64 21.62208 Trego Wakeeney 380.5 3,164,887 2,836,790 328,097 1,023,296 1,002,148 21,148 349,245 9% 22.68 23.71237 Smith Smith Center 395.0 3,466,530 3,126,302 340,228 1,245,547 1,211,171 34,376 374,604 9% 12.08 25.27438 Pratt Skyline Schools 411.0 3,403,159 3,064,160 338,999 1,129,213 1,080,330 48,883 387,882 9% 18.36 22.59339 Jefferson Jefferson County North 454.5 3,826,901 3,461,384 365,517 1,225,239 1,171,469 53,770 419,287 9% 18.02 17.16366 Woodson Woodson 448.5 4,050,364 3,624,306 426,058 1,296,766 1,261,137 35,629 461,687 9% 24.79 19.42410 Marion Durham‐Hillsboro‐Lehi 572.0 4,785,095 4,292,729 492,366 1,670,165 1,621,498 48,667 541,033 9% 21.45 19.32396 Butler Douglass Public School 677.3 5,386,724 4,839,163 547,561 1,867,324 1,827,614 39,710 587,271 9% 23.89 28.61417 Morris Morris County 742.7 5,662,763 5,102,106 560,657 1,827,870 1,782,072 45,798 606,455 9% 18.64 20.00361 Harper Anthony‐Harper 822.0 7,279,310 6,467,709 811,601 2,269,494 2,316,214 ‐46,720 764,881 9% 27.25 23.73333 Cloud Concordia 1,071.6 7,486,679 6,757,682 728,997 2,475,174 2,393,007 82,167 811,164 9% 21.60 30.65210 Stevens Hugoton Public School 1,074.9 7,999,865 7,171,716 828,149 2,584,628 2,554,725 29,903 858,052 9% 27.96 33.86113 Nemaha Prairie Hills 1,142.7 7,828,811 7,038,459 790,352 2,565,450 2,488,805 76,645 866,997 9% 14.48 10.61348 Douglas Baldwin City 1,391.2 9,128,478 8,276,226 852,252 2,924,352 2,824,943 99,409 951,661 9% 16.64 16.71503 Labette Parsons 1,272.5 9,313,705 8,385,716 927,989 3,032,861 2,939,784 93,077 1,021,066 9% 19.79 23.11435 Dickinson Abilene 1,573.3 10,052,972 9,026,307 1,026,665 3,186,501 3,137,115 49,386 1,076,051 9% 20.20 26.01446 MontgomeryIndependence 2,003.0 13,123,467 11,860,707 1,262,760 4,232,175 4,108,647 123,528 1,386,288 9% 24.18 22.31234 Bourbon Fort Scott 1,870.1 12,195,233 11,126,312 1,068,921 3,925,272 3,607,179 318,093 1,387,014 9% 26.90 36.69470 Cowley Arkansas City 2,836.9 20,586,522 18,555,486 2,031,036 6,621,987 6,335,000 286,987 2,318,023 9% 26.47 27.72
Data from:http://www.ksde.org/Portals/0/School%20Finance/Action%20Items/SF17‐232.xlsxhttp://www.ksde.org/Portals/0/School%20Finance/Action%20Items/SF17‐226.xlsxhttp://ksreportcard.ksde.org/2015_2016_Assessment_Full_File.xlsx 991366d‐e2017ADEQ00062

Senate Bill 19 ‐ Year 2KSDE SF17‐232 KSDE SF17‐232 KSDE SF17‐232 KSDE SF17‐232 KSDE SF17‐226 KSDE SF17‐226 KSDE SF17‐226 Calculated Calculated Percent of Percent of
Col 1 Col 13 Col 14 Col 15 Col 3 Col 4 Col 5 Students StudentsSF17‐145 Col 3 2017‐18 2016‐17 Combined Level One Level One
Proposed 2017‐18 Est. 2015‐16 Proposed Adopted General Fund + LOB Not at Not at2017‐18 General Fund General Fund Difference Max LOB LOB Difference Difference Percentage Grade Level Grade Level
USD # County District Name Total Adj Enroll. (incl Sped) (incl Sped) (Col 13‐14) Budget Budget (Col 3 ‐ Col 4) (Col 15 + Col 5) Difference ELA MathTotal STATE TOTALS 472,772.5 3,347,435,682 3,067,980,584 279,455,098 1,099,865,522 1,067,746,822 32,118,684 311,573,782385 Butler Andover 5,163.5 32,174,348 29,089,742 3,084,606 9,762,574 9,253,425 509,149 3,593,755 9% 8.82 9.91232 Johnson De Soto 7,084.2 40,713,769 36,639,685 4,074,084 14,396,334 13,812,173 584,161 4,658,245 9% 8.61 9.49266 Sedgwick Maize 6,762.7 42,368,379 38,227,866 4,140,513 13,053,159 12,502,460 550,699 4,691,212 9% 13.64 16.30497 Douglas Lawrence 10,732.5 76,073,603 69,255,890 6,817,713 24,683,466 23,297,182 1,386,284 8,203,997 9% 16.95 22.89229 Johnson Blue Valley 22,259.3 144,711,883 131,898,165 12,813,718 51,192,296 48,519,957 2,672,339 15,486,057 9% 6.36 7.92500 Wyandotte Kansas City 21,152.0 160,183,183 144,769,419 15,413,764 51,343,044 49,972,534 1,370,510 16,784,274 9% 51.25 50.56512 Johnson Shawnee Mission Pub S 27,443.1 168,439,016 151,260,227 17,178,789 61,693,771 59,788,008 1,905,763 19,084,552 9% 17.20 19.36330 Wabaunsee Mission Valley 492.0 4,485,579 4,026,806 458,773 1,435,841 1,364,541 71,300 530,073 10% 23.48 30.24341 Jefferson Oskaloosa Public Schoo 593.5 5,295,074 4,751,816 543,258 1,692,401 1,591,626 100,775 644,033 10% 30.70 37.54244 Coffey Burlington 850.5 6,668,964 5,977,592 691,372 2,155,618 2,081,264 74,354 765,726 10% 15.33 19.15323 Pottawatom Rock Creek 1,035.1 7,252,521 6,507,088 745,433 2,341,109 2,213,144 127,965 873,398 10% 12.84 9.86506 Labette Labette County 1,548.1 11,010,175 9,905,123 1,105,052 3,535,391 3,375,549 159,842 1,264,894 10% 21.35 17.21491 Douglas Eudora 1,682.1 10,317,318 9,232,417 1,084,901 3,278,420 3,093,344 185,076 1,269,977 10% 16.22 22.59204 Wyandotte Bonner Springs 2,679.0 18,260,358 16,499,498 1,760,860 5,769,225 5,426,138 343,087 2,103,947 10% 24.10 25.98262 Sedgwick Valley Center Pub Sch 2,782.2 17,631,121 15,737,525 1,893,596 5,581,781 5,321,342 260,439 2,154,035 10% 18.47 18.08437 Shawnee Auburn Washburn 6,249.4 38,964,052 34,895,522 4,068,530 12,428,907 11,614,736 814,171 4,882,701 10% 14.75 17.92241 Wallace Wallace County School 200.5 1,843,941 1,626,860 217,081 595,981 566,166 29,815 246,896 11% 15.38 9.89509 Sumner South Haven 202.5 2,052,124 1,824,241 227,883 727,708 684,739 42,969 270,852 11% 30.23 36.04303 Ness Ness City 297.5 2,471,397 2,160,620 310,777 795,764 771,787 23,977 334,754 11% 30.76 30.23105 Rawlins Rawlins County 347.4 2,920,975 2,574,583 346,392 945,323 923,233 22,090 368,482 11% 18.78 26.06408 Marion Marion‐Florence 517.0 4,404,433 3,901,980 502,453 1,403,049 1,349,977 53,072 555,525 11% 14.74 17.52327 Ellsworth Ellsworth 639.7 4,837,928 4,301,196 536,732 1,558,746 1,481,709 77,037 613,769 11% 21.33 22.11273 Mitchell Beloit 791.0 6,142,608 5,436,986 705,622 1,970,138 1,868,516 101,622 807,244 11% 19.52 16.09363 Finney Holcomb 993.5 7,052,398 6,220,034 832,364 2,276,057 2,150,000 126,057 958,421 11% 16.53 23.52409 Atchison Atchison Public School 1,703.0 11,928,139 10,568,499 1,359,640 3,822,211 3,578,462 243,749 1,603,389 11% 29.65 36.86250 Crawford Pittsburg 3,039.1 21,033,624 18,623,611 2,410,013 6,696,883 6,364,720 332,163 2,742,176 11% 24.49 26.74261 Sedgwick Haysville 5,488.6 36,607,956 32,449,018 4,158,938 11,762,044 11,075,570 686,474 4,845,412 11% 21.78 26.86457 Finney Garden City 7,478.0 54,273,259 47,821,311 6,451,948 17,475,168 16,676,760 798,408 7,250,356 11% 32.44 40.71492 Butler Flinthills 269.7 2,507,912 2,209,019 298,893 801,620 759,020 42,600 341,493 12% 17.98 23.74388 Ellis Ellis 434.6 3,259,708 2,856,998 402,710 1,067,074 1,010,904 56,170 458,880 12% 12.19 16.58355 Barton Ellinwood Public Schoo 448.8 3,646,821 3,200,929 445,892 1,172,405 1,091,193 81,212 527,104 12% 25.85 23.41112 Ellsworth Central Plains 489.0 4,274,927 3,771,223 503,704 1,388,459 1,304,810 83,649 587,353 12% 17.35 14.09405 Rice Lyons 817.8 6,850,046 6,184,858 665,188 2,193,160 1,893,090 300,070 965,258 12% 22.91 23.77415 Brown Hiawatha 914.6 7,271,341 6,400,881 870,460 2,324,440 2,143,811 180,629 1,051,089 12% 17.04 21.34480 Seward Liberal 4,903.0 35,369,791 31,605,086 3,764,705 11,378,071 10,250,000 1,128,071 4,892,776 12% 35.89 42.40265 Sedgwick Goddard 5,587.9 34,127,702 29,987,061 4,140,641 10,935,522 10,178,501 757,021 4,897,662 12% 10.49 14.71231 Johnson Gardner Edgerton 5,816.4 36,340,344 32,402,238 3,938,106 12,833,335 11,590,874 1,242,461 5,180,567 12% 15.93 15.14443 Ford Dodge City 6,837.8 52,811,628 46,407,914 6,403,714 16,930,818 16,008,101 922,717 7,326,431 12% 35.28 38.45
Data from:http://www.ksde.org/Portals/0/School%20Finance/Action%20Items/SF17‐232.xlsxhttp://www.ksde.org/Portals/0/School%20Finance/Action%20Items/SF17‐226.xlsxhttp://ksreportcard.ksde.org/2015_2016_Assessment_Full_File.xlsx 991366d‐e2017ADEQ00063

Senate Bill 19 ‐ Year 2KSDE SF17‐232 KSDE SF17‐232 KSDE SF17‐232 KSDE SF17‐232 KSDE SF17‐226 KSDE SF17‐226 KSDE SF17‐226 Calculated Calculated Percent of Percent of
Col 1 Col 13 Col 14 Col 15 Col 3 Col 4 Col 5 Students StudentsSF17‐145 Col 3 2017‐18 2016‐17 Combined Level One Level One
Proposed 2017‐18 Est. 2015‐16 Proposed Adopted General Fund + LOB Not at Not at2017‐18 General Fund General Fund Difference Max LOB LOB Difference Difference Percentage Grade Level Grade Level
USD # County District Name Total Adj Enroll. (incl Sped) (incl Sped) (Col 13‐14) Budget Budget (Col 3 ‐ Col 4) (Col 15 + Col 5) Difference ELA MathTotal STATE TOTALS 472,772.5 3,347,435,682 3,067,980,584 279,455,098 1,099,865,522 1,067,746,822 32,118,684 311,573,782109 Republic Republic County 508.0 4,173,507 3,606,090 567,417 1,396,070 1,302,588 93,482 660,899 13% 17.14 17.55431 Barton Hoisington 737.7 5,866,885 5,102,525 764,360 1,888,414 1,743,769 144,645 909,005 13% 26.86 22.34466 Scott Scott County 990.5 6,971,177 6,036,154 935,023 2,246,593 2,096,672 149,921 1,084,944 13% 21.80 22.37489 Ellis Hays 2,988.7 18,855,672 16,396,380 2,459,292 6,227,286 5,850,530 376,756 2,836,048 13% 16.96 21.37242 Wallace Weskan 102.5 1,100,514 953,667 146,847 389,894 357,775 32,119 178,966 14% 14.58 33.33507 Haskell Satanta 311.0 2,855,187 2,417,081 438,106 935,300 912,132 23,168 461,274 14% 25.31 30.37254 Barber Barber County North 471.5 4,012,729 3,421,747 590,982 1,287,417 1,207,674 79,743 670,725 14% 27.72 28.50115 Nemaha Nemaha Central 584.8 4,418,415 4,006,523 411,892 1,465,751 1,170,000 295,751 707,643 14% 13.33 14.50407 Russell Russell County 830.2 6,316,480 5,432,998 883,482 2,253,003 2,111,500 141,503 1,024,985 14% 22.70 27.11458 LeavenworthBasehor‐Linwood 2,327.6 14,326,160 12,446,000 1,880,160 4,335,038 3,882,569 452,469 2,332,629 14% 15.03 22.86384 Riley Blue Valley 216.5 2,109,585 1,802,237 307,348 746,183 671,635 74,548 381,896 15% 14.13 25.00274 Logan Oakley 406.1 3,294,053 2,788,374 505,679 1,098,989 1,021,941 77,048 582,727 15% 17.83 24.86511 Harper Attica 168.0 1,644,461 1,391,941 252,520 529,384 481,387 47,997 300,517 16% 15.66 26.82502 Edwards Lewis 116.0 1,316,075 1,115,568 200,507 424,476 378,223 46,253 246,760 17% 8.82 26.47271 Rooks Stockton 335.0 2,860,030 2,393,863 466,167 919,928 834,528 85,400 551,567 17% 31.81 35.22412 Sheridan Hoxie Community Scho 380.9 2,975,697 2,503,020 472,677 992,640 887,978 104,662 577,339 17% 15.46 21.87483 Seward Kismet‐Plains 699.0 6,963,165 6,422,846 540,319 2,244,366 1,379,609 864,757 1,405,076 18% 33.87 27.17230 Johnson Spring Hill 2,742.0 24,515,373 20,992,010 3,523,363 6,385,200 5,261,457 1,123,743 4,647,106 18% 15.82 18.98299 Lincoln Sylvan Grove 242.3 2,315,213 2,063,188 252,025 744,772 500,000 244,772 496,797 19% 22.55 20.61203 Wyandotte Piper‐Kansas City 2,169.9 13,068,475 10,887,529 2,180,946 4,326,105 3,726,052 600,053 2,780,999 19% 12.35 16.93255 Barber South Barber 248.5 2,293,974 1,839,903 454,071 737,220 687,767 49,453 503,524 20% 24.24 17.17359 Sumner Argonia Public Schools 187.5 1,897,579 1,557,776 339,803 612,842 502,720 110,122 449,925 22% 10.00 10.00314 Thomas Brewster 147.0 1,483,609 1,207,261 276,348 477,523 382,827 94,696 371,044 23% 58.13 45.00285 Chautauqua Cedar Vale 182.5 1,863,676 1,590,416 273,260 601,571 395,000 206,571 479,831 24% 32.14 26.19479 Anderson Crest 219.0 2,175,727 1,924,702 251,025 709,382 405,000 304,382 555,407 24% 40.38 41.74
Data from:http://www.ksde.org/Portals/0/School%20Finance/Action%20Items/SF17‐232.xlsxhttp://www.ksde.org/Portals/0/School%20Finance/Action%20Items/SF17‐226.xlsxhttp://ksreportcard.ksde.org/2015_2016_Assessment_Full_File.xlsx 991366d‐e2017ADEQ00064

Appendix K-3:
2015-16 Achievement Data
That achievement data is publically available at http://ksreportcard.ksde.org/2015_2016_Assessment_Full_file.xlsx. It is appropriate to take judicial notice of this data, and Plaintiffs respectfully request that this Court do so. K.S.A. 60-409(b)(4); K.S.A. 60-412(c).

program_y Org_No Organization Building_Number GradeNam GroupName PCLevel_One PCLevel_Two PCLevel_Three PCLevel_Four PCNotValid Subject Population2016 D0101 D0101 ‐ Erie‐Galesburg District Aggregate ALL All Students 33.57 38.32 21.89 6.20 .00 ELA Accountability2016 D0102 D0102 ‐ Cimarron‐Ensign District Aggregate ALL All Students 18.18 38.78 34.54 8.48 .00 ELA Accountability2016 D0103 D0103 ‐ Cheylin District Aggregate ALL All Students 20.00 41.42 32.85 5.71 .00 ELA Accountability2016 D0105 D0105 ‐ Rawlins County District Aggregate ALL All Students 18.78 36.96 34.54 9.69 .00 ELA Accountability2016 D0106 D0106 ‐ Western Plains District Aggregate ALL All Students 28.57 46.93 20.40 4.08 .00 ELA Accountability2016 D0107 D0107 ‐ Rock Hills District Aggregate ALL All Students 18.51 41.48 33.33 6.66 .00 ELA Accountability2016 D0108 D0108 ‐ Washington Co. SchDistrict Aggregate ALL All Students 19.65 42.19 31.79 6.35 .00 ELA Accountability2016 D0109 D0109 ‐ Republic County District Aggregate ALL All Students 17.14 41.63 31.42 9.79 .00 ELA Accountability2016 D0110 D0110 ‐ Thunder Ridge SchoDistrict Aggregate ALL All Students 17.85 37.50 37.50 7.14 .00 ELA Accountability2016 D0111 D0111 ‐ Doniphan West SchDistrict Aggregate ALL All Students 35.09 37.74 24.50 2.64 .00 ELA Accountability2016 D0112 D0112 ‐ Central Plains District Aggregate ALL All Students 17.35 32.87 38.81 10.95 .00 ELA Accountability2016 D0113 D0113 ‐ Prairie Hills District Aggregate ALL All Students 14.48 32.86 39.92 12.72 .00 ELA Accountability2016 D0114 D0114 ‐ Riverside District Aggregate ALL All Students 31.66 39.76 25.86 2.70 .00 ELA Accountability2016 D0115 D0115 ‐ Nemaha Central District Aggregate ALL All Students 13.33 38.03 36.07 12.54 .00 ELA Accountability2016 D0200 D0200 ‐ Greeley County SchDistrict Aggregate ALL All Students 27.20 35.20 30.40 7.20 .00 ELA Accountability2016 D0202 D0202 ‐ Turner‐Kansas City District Aggregate ALL All Students 39.91 36.63 20.16 3.28 .00 ELA Accountability2016 D0203 D0203 ‐ Piper‐Kansas City District Aggregate ALL All Students 12.35 30.60 40.01 17.01 .00 ELA Accountability2016 D0204 D0204 ‐ Bonner Springs District Aggregate ALL All Students 24.10 38.02 28.94 8.92 .00 ELA Accountability2016 D0205 D0205 ‐ Bluestem District Aggregate ALL All Students 33.21 40.95 22.50 3.32 .00 ELA Accountability2016 D0206 D0206 ‐ Remington‐WhitewDistrict Aggregate ALL All Students 14.33 36.22 39.24 10.18 .00 ELA Accountability2016 D0207 D0207 ‐ Ft Leavenworth District Aggregate ALL All Students 7.35 21.96 45.45 25.21 .00 ELA Accountability2016 D0208 D0208 ‐ Wakeeney District Aggregate ALL All Students 22.68 37.11 30.41 9.79 .00 ELA Accountability2016 D0209 D0209 ‐ Moscow Public Sch District Aggregate ALL All Students 35.29 41.17 20.00 3.52 .00 ELA Accountability2016 D0210 D0210 ‐ Hugoton Public SchDistrict Aggregate ALL All Students 27.96 37.22 28.37 6.43 .00 ELA Accountability2016 D0211 D0211 ‐ Norton CommunityDistrict Aggregate ALL All Students 15.81 34.74 32.76 16.66 .00 ELA Accountability2016 D0212 D0212 ‐ Northern Valley District Aggregate ALL All Students 17.94 37.17 37.17 7.69 .00 ELA Accountability2016 D0214 D0214 ‐ Ulysses District Aggregate ALL All Students 38.70 38.09 20.02 3.17 .00 ELA Accountability2016 D0215 D0215 ‐ Lakin District Aggregate ALL All Students 17.79 47.89 25.88 8.41 .00 ELA Accountability2016 D0216 D0216 ‐ Deerfield District Aggregate ALL All Students 35.29 37.64 22.35 4.70 .00 ELA Accountability2016 D0217 D0217 ‐ Rolla District Aggregate ALL All Students 25.31 44.30 25.31 5.06 .00 ELA Accountability2016 D0218 D0218 ‐ Elkhart District Aggregate ALL All Students 22.68 39.79 29.48 8.04 .00 ELA Accountability2016 D0219 D0219 ‐ Minneola District Aggregate ALL All Students 23.01 31.74 30.15 15.07 .00 ELA Accountability2016 D0220 D0220 ‐ Ashland District Aggregate ALL All Students 23.58 40.56 31.13 4.71 .00 ELA Accountability2016 D0223 D0223 ‐ Barnes District Aggregate ALL All Students 19.40 29.10 35.07 16.41 .00 ELA Accountability2016 D0224 D0224 ‐ Clifton‐Clyde District Aggregate ALL All Students 18.90 37.19 32.92 10.97 .00 ELA Accountability2016 D0225 D0225 ‐ Fowler District Aggregate ALL All Students 30.15 39.68 25.39 4.76 .00 ELA Accountability2016 D0226 D0226 ‐ Meade District Aggregate ALL All Students 17.83 37.57 36.30 8.28 .00 ELA Accountability2016 D0227 D0227 ‐ Hodgeman County District Aggregate ALL All Students 16.66 33.33 39.74 10.25 .00 ELA Accountability2016 D0229 D0229 ‐ Blue Valley District Aggregate ALL All Students 6.36 25.21 44.20 24.20 .00 ELA Accountability2016 D0230 D0230 ‐ Spring Hill District Aggregate ALL All Students 15.82 34.66 33.92 15.57 .00 ELA Accountability2016 D0231 D0231 ‐ Gardner Edgerton District Aggregate ALL All Students 15.93 36.94 36.15 10.96 .00 ELA Accountability2016 D0232 D0232 ‐ De Soto District Aggregate ALL All Students 8.61 31.76 43.56 16.04 .00 ELA Accountability2016 D0233 D0233 ‐ Olathe District Aggregate ALL All Students 15.24 32.86 36.91 14.97 .00 ELA Accountability2016 D0234 D0234 ‐ Fort Scott District Aggregate ALL All Students 26.90 38.02 29.87 5.19 .00 ELA Accountability2016 D0235 D0235 ‐ Uniontown District Aggregate ALL All Students 18.09 28.95 46.15 6.78 .00 ELA Accountability2016 D0237 D0237 ‐ Smith Center District Aggregate ALL All Students 12.08 37.36 36.26 14.28 .00 ELA Accountability2016 D0239 D0239 ‐ North Ottawa CounDistrict Aggregate ALL All Students 19.28 35.62 34.64 10.45 .00 ELA Accountability2016 D0240 D0240 ‐ Twin Valley District Aggregate ALL All Students 23.10 36.96 31.02 8.91 .00 ELA Accountability2016 D0241 D0241 ‐ Wallace County SchDistrict Aggregate ALL All Students 15.38 27.47 40.65 16.48 .00 ELA Accountability2016 D0242 D0242 ‐ Weskan District Aggregate ALL All Students 14.58 43.75 35.41 6.25 .00 ELA Accountability2016 D0243 D0243 ‐ Lebo‐Waverly District Aggregate ALL All Students 20.00 39.48 32.82 7.69 .00 ELA Accountability
Data from: http://ksreportcard.ksde.org/2015_2016_Assessment_Full_File.xlsx991373
2017ADEQ00065

program_y Org_No Organization Building_Number GradeNam GroupName PCLevel_One PCLevel_Two PCLevel_Three PCLevel_Four PCNotValid Subject Population2016 D0244 D0244 ‐ Burlington District Aggregate ALL All Students 15.33 37.33 34.66 12.66 .00 ELA Accountability2016 D0245 D0245 ‐ LeRoy‐Gridley District Aggregate ALL All Students 16.49 47.42 31.95 4.12 .00 ELA Accountability2016 D0246 D0246 ‐ Northeast District Aggregate ALL All Students 24.24 43.72 27.70 4.32 .00 ELA Accountability2016 D0247 D0247 ‐ Cherokee District Aggregate ALL All Students 21.66 38.75 35.83 3.75 .00 ELA Accountability2016 D0248 D0248 ‐ Girard District Aggregate ALL All Students 19.67 40.61 31.32 8.37 .00 ELA Accountability2016 D0249 D0249 ‐ Frontenac Public ScDistrict Aggregate ALL All Students 17.25 36.17 35.96 10.60 .00 ELA Accountability2016 D0250 D0250 ‐ Pittsburg District Aggregate ALL All Students 24.49 33.40 30.68 11.41 .00 ELA Accountability2016 D0251 D0251 ‐ North Lyon County District Aggregate ALL All Students 16.44 37.33 36.88 9.33 .00 ELA Accountability2016 D0252 D0252 ‐ Southern Lyon Cou District Aggregate ALL All Students 21.56 33.33 36.07 9.01 .00 ELA Accountability2016 D0253 D0253 ‐ Emporia District Aggregate ALL All Students 22.71 36.91 31.08 9.28 .00 ELA Accountability2016 D0254 D0254 ‐ Barber County NortDistrict Aggregate ALL All Students 27.72 37.27 26.36 8.63 .00 ELA Accountability2016 D0255 D0255 ‐ South Barber District Aggregate ALL All Students 24.24 34.34 30.30 11.11 .00 ELA Accountability2016 D0256 D0256 ‐ Marmaton Valley District Aggregate ALL All Students 19.46 46.97 26.17 7.38 .00 ELA Accountability2016 D0257 D0257 ‐ Iola District Aggregate ALL All Students 23.89 35.61 33.18 7.30 .00 ELA Accountability2016 D0258 D0258 ‐ Humboldt District Aggregate ALL All Students 27.71 31.62 30.72 9.93 .00 ELA Accountability2016 D0259 D0259 ‐ Wichita District Aggregate ALL All Students 37.38 35.73 21.34 5.53 .00 ELA Accountability2016 D0260 D0260 ‐ Derby District Aggregate ALL All Students 19.92 37.75 33.01 9.29 .00 ELA Accountability2016 D0261 D0261 ‐ Haysville District Aggregate ALL All Students 21.78 39.59 30.70 7.91 .00 ELA Accountability2016 D0262 D0262 ‐ Valley Center Pub SDistrict Aggregate ALL All Students 18.47 37.15 34.72 9.65 .00 ELA Accountability2016 D0263 D0263 ‐ Mulvane District Aggregate ALL All Students 19.14 42.34 31.64 6.86 .00 ELA Accountability2016 D0264 D0264 ‐ Clearwater District Aggregate ALL All Students 19.04 36.22 37.75 6.97 .00 ELA Accountability2016 D0265 D0265 ‐ Goddard District Aggregate ALL All Students 10.49 34.52 41.20 13.78 .00 ELA Accountability2016 D0266 D0266 ‐ Maize District Aggregate ALL All Students 13.64 33.14 39.27 13.93 .00 ELA Accountability2016 D0267 D0267 ‐ Renwick District Aggregate ALL All Students 12.38 36.24 39.39 11.97 .00 ELA Accountability2016 D0268 D0268 ‐ Cheney District Aggregate ALL All Students 10.75 34.25 41.00 14.00 .00 ELA Accountability2016 D0269 D0269 ‐ Palco District Aggregate ALL All Students 26.66 35.00 36.66 1.66 .00 ELA Accountability2016 D0270 D0270 ‐ Plainville District Aggregate ALL All Students 20.63 46.56 25.92 6.87 .00 ELA Accountability2016 D0271 D0271 ‐ Stockton District Aggregate ALL All Students 31.81 31.81 28.97 7.38 .00 ELA Accountability2016 D0272 D0272 ‐ Waconda District Aggregate ALL All Students 14.64 29.29 41.40 14.64 .00 ELA Accountability2016 D0273 D0273 ‐ Beloit District Aggregate ALL All Students 19.52 33.77 36.67 10.02 .00 ELA Accountability2016 D0274 D0274 ‐ Oakley District Aggregate ALL All Students 17.83 32.43 40.54 9.18 .00 ELA Accountability2016 D0275 D0275 ‐ Triplains District Aggregate ALL All Students 8.82 50.00 29.41 11.76 .00 ELA Accountability2016 D0281 D0281 ‐ Graham County District Aggregate ALL All Students 23.43 41.66 31.77 3.12 .00 ELA Accountability2016 D0282 D0282 ‐ West Elk District Aggregate ALL All Students 19.16 44.91 25.74 10.17 .00 ELA Accountability2016 D0283 D0283 ‐ Elk Valley District Aggregate ALL All Students 34.00 48.00 18.00 .00 .00 ELA Accountability2016 D0284 D0284 ‐ Chase County District Aggregate ALL All Students 16.66 36.11 38.33 8.88 .00 ELA Accountability2016 D0285 D0285 ‐ Cedar Vale District Aggregate ALL All Students 32.14 34.52 25.00 8.33 .00 ELA Accountability2016 D0286 D0286 ‐ Chautauqua Co ComDistrict Aggregate ALL All Students 24.73 51.57 20.00 3.68 .00 ELA Accountability2016 D0287 D0287 ‐ West Franklin District Aggregate ALL All Students 26.62 34.41 29.54 9.41 .00 ELA Accountability2016 D0288 D0288 ‐ Central Heights District Aggregate ALL All Students 22.30 36.33 34.53 6.83 .00 ELA Accountability2016 D0289 D0289 ‐ Wellsville District Aggregate ALL All Students 16.94 38.25 33.65 11.13 .00 ELA Accountability2016 D0290 D0290 ‐ Ottawa District Aggregate ALL All Students 25.30 41.92 27.06 5.70 .00 ELA Accountability2016 D0291 D0291 ‐ Grinnell Public SchoDistrict Aggregate ALL All Students 28.35 41.79 25.37 4.47 .00 ELA Accountability2016 D0292 D0292 ‐ Wheatland District Aggregate ALL All Students 18.18 30.30 45.45 6.06 .00 ELA Accountability2016 D0293 D0293 ‐ Quinter Public SchoDistrict Aggregate ALL All Students 19.28 26.42 42.85 11.42 .00 ELA Accountability2016 D0294 D0294 ‐ Oberlin District Aggregate ALL All Students 23.60 38.50 28.57 9.31 .00 ELA Accountability2016 D0297 D0297 ‐ St Francis Comm ScDistrict Aggregate ALL All Students 13.57 40.00 37.85 8.57 .00 ELA Accountability2016 D0298 D0298 ‐ Lincoln District Aggregate ALL All Students 17.90 40.12 34.56 7.40 .00 ELA Accountability2016 D0299 D0299 ‐ Sylvan Grove District Aggregate ALL All Students 22.55 33.08 39.09 5.26 .00 ELA Accountability2016 D0300 D0300 ‐ Comanche County District Aggregate ALL All Students 23.64 38.51 32.43 5.40 .00 ELA Accountability2016 D0303 D0303 ‐ Ness City District Aggregate ALL All Students 30.76 46.92 16.92 5.38 .00 ELA Accountability
Data from: http://ksreportcard.ksde.org/2015_2016_Assessment_Full_File.xlsx991373
2017ADEQ00066

program_y Org_No Organization Building_Number GradeNam GroupName PCLevel_One PCLevel_Two PCLevel_Three PCLevel_Four PCNotValid Subject Population2016 D0305 D0305 ‐ Salina District Aggregate ALL All Students 22.29 37.91 30.21 9.58 .00 ELA Accountability2016 D0306 D0306 ‐ Southeast Of SalineDistrict Aggregate ALL All Students 21.35 37.76 32.55 8.33 .00 ELA Accountability2016 D0307 D0307 ‐ Ell‐Saline District Aggregate ALL All Students 20.96 41.12 30.64 7.25 .00 ELA Accountability2016 D0308 D0308 ‐ Hutchinson Public SDistrict Aggregate ALL All Students 28.03 34.56 30.57 6.82 .00 ELA Accountability2016 D0309 D0309 ‐ Nickerson District Aggregate ALL All Students 23.07 41.08 29.19 6.64 .00 ELA Accountability2016 D0310 D0310 ‐ Fairfield District Aggregate ALL All Students 30.40 37.16 27.70 4.72 .00 ELA Accountability2016 D0311 D0311 ‐ Pretty Prairie District Aggregate ALL All Students 19.25 35.55 37.77 7.40 .00 ELA Accountability2016 D0312 D0312 ‐ Haven Public SchooDistrict Aggregate ALL All Students 18.64 41.02 30.76 9.55 .00 ELA Accountability2016 D0313 D0313 ‐ Buhler District Aggregate ALL All Students 17.60 39.64 33.94 8.80 .00 ELA Accountability2016 D0314 D0314 ‐ Brewster District Aggregate ALL All Students 58.13 23.25 13.95 4.65 .00 ELA Accountability2016 D0315 D0315 ‐ Colby Public SchoolDistrict Aggregate ALL All Students 25.97 37.93 30.34 5.74 .00 ELA Accountability2016 D0316 D0316 ‐ Golden Plains District Aggregate ALL All Students 25.27 39.56 29.67 5.49 .00 ELA Accountability2016 D0320 D0320 ‐ Wamego District Aggregate ALL All Students 19.37 36.60 33.45 10.56 .00 ELA Accountability2016 D0321 D0321 ‐ Kaw Valley District Aggregate ALL All Students 16.28 38.00 37.47 8.23 .00 ELA Accountability2016 D0322 D0322 ‐ Onaga‐Havensville‐District Aggregate ALL All Students 17.42 40.90 34.84 6.81 .00 ELA Accountability2016 D0323 D0323 ‐ Rock Creek District Aggregate ALL All Students 12.84 34.18 41.10 11.85 .00 ELA Accountability2016 D0325 D0325 ‐ Phillipsburg District Aggregate ALL All Students 16.91 32.93 41.54 8.60 .00 ELA Accountability2016 D0326 D0326 ‐ Logan District Aggregate ALL All Students 20.25 44.30 32.91 2.53 .00 ELA Accountability2016 D0327 D0327 ‐ Ellsworth District Aggregate ALL All Students 21.33 37.57 27.70 13.37 .00 ELA Accountability2016 D0329 D0329 ‐ Mill Creek Valley District Aggregate ALL All Students 13.77 35.55 40.88 9.77 .00 ELA Accountability2016 D0330 D0330 ‐ Mission Valley District Aggregate ALL All Students 23.48 42.10 28.74 5.66 .00 ELA Accountability2016 D0331 D0331 ‐ Kingman ‐ Norwich District Aggregate ALL All Students 22.17 39.68 30.59 7.53 .00 ELA Accountability2016 D0332 D0332 ‐ Cunningham District Aggregate ALL All Students 10.97 35.36 36.58 17.07 .00 ELA Accountability2016 D0333 D0333 ‐ Concordia District Aggregate ALL All Students 21.60 38.62 30.40 9.36 .00 ELA Accountability2016 D0334 D0334 ‐ Southern Cloud District Aggregate ALL All Students 34.88 39.53 20.93 4.65 .00 ELA Accountability2016 D0335 D0335 ‐ North Jackson District Aggregate ALL All Students 19.21 37.43 32.01 11.33 .00 ELA Accountability2016 D0336 D0336 ‐ Holton District Aggregate ALL All Students 19.12 31.69 36.24 12.93 .00 ELA Accountability2016 D0337 D0337 ‐ Royal Valley District Aggregate ALL All Students 26.99 34.03 28.40 10.56 .00 ELA Accountability2016 D0338 D0338 ‐ Valley Falls District Aggregate ALL All Students 17.48 38.79 34.97 8.74 .00 ELA Accountability2016 D0339 D0339 ‐ Jefferson County N District Aggregate ALL All Students 18.02 27.46 40.34 14.16 .00 ELA Accountability2016 D0340 D0340 ‐ Jefferson West District Aggregate ALL All Students 19.13 37.39 33.26 10.21 .00 ELA Accountability2016 D0341 D0341 ‐ Oskaloosa Public ScDistrict Aggregate ALL All Students 30.70 40.94 22.83 5.51 .00 ELA Accountability2016 D0342 D0342 ‐ McLouth District Aggregate ALL All Students 25.39 34.37 33.20 7.03 .00 ELA Accountability2016 D0343 D0343 ‐ Perry Public School District Aggregate ALL All Students 23.31 38.08 32.12 6.47 .00 ELA Accountability2016 D0344 D0344 ‐ Pleasanton District Aggregate ALL All Students 23.65 45.16 27.95 3.22 .00 ELA Accountability2016 D0345 D0345 ‐ Seaman District Aggregate ALL All Students 17.00 35.80 35.80 11.38 .00 ELA Accountability2016 D0346 D0346 ‐ Jayhawk District Aggregate ALL All Students 18.81 36.53 36.16 8.48 .00 ELA Accountability2016 D0347 D0347 ‐ Kinsley‐Offerle District Aggregate ALL All Students 19.37 41.25 33.12 6.25 .00 ELA Accountability2016 D0348 D0348 ‐ Baldwin City District Aggregate ALL All Students 16.64 35.40 37.51 10.43 .00 ELA Accountability2016 D0349 D0349 ‐ Stafford District Aggregate ALL All Students 32.67 34.65 23.76 8.91 .00 ELA Accountability2016 D0350 D0350 ‐ St John‐Hudson District Aggregate ALL All Students 13.42 45.63 35.57 5.36 .00 ELA Accountability2016 D0351 D0351 ‐ Macksville District Aggregate ALL All Students 23.77 37.06 31.46 7.69 .00 ELA Accountability2016 D0352 D0352 ‐ Goodland District Aggregate ALL All Students 23.54 36.50 30.45 9.50 .00 ELA Accountability2016 D0353 D0353 ‐ Wellington District Aggregate ALL All Students 23.77 38.17 32.10 5.94 .00 ELA Accountability2016 D0355 D0355 ‐ Ellinwood Public ScDistrict Aggregate ALL All Students 25.85 36.09 31.70 6.34 .00 ELA Accountability2016 D0356 D0356 ‐ Conway Springs District Aggregate ALL All Students 14.65 43.96 33.62 7.75 .00 ELA Accountability2016 D0357 D0357 ‐ Belle Plaine District Aggregate ALL All Students 20.54 39.04 34.24 6.16 .00 ELA Accountability2016 D0358 D0358 ‐ Oxford District Aggregate ALL All Students 24.62 39.55 31.34 4.47 .00 ELA Accountability2016 D0359 D0359 ‐ Argonia Public SchoDistrict Aggregate ALL All Students 10.00 47.50 33.75 8.75 .00 ELA Accountability2016 D0360 D0360 ‐ Caldwell District Aggregate ALL All Students 23.14 50.41 21.48 4.95 .00 ELA Accountability2016 D0361 D0361 ‐ Chaparral Schools District Aggregate ALL All Students 27.25 35.00 30.50 7.25 .00 ELA Accountability
Data from: http://ksreportcard.ksde.org/2015_2016_Assessment_Full_File.xlsx991373
2017ADEQ00067

program_y Org_No Organization Building_Number GradeNam GroupName PCLevel_One PCLevel_Two PCLevel_Three PCLevel_Four PCNotValid Subject Population2016 D0362 D0362 ‐ Prairie View District Aggregate ALL All Students 26.01 37.10 30.31 6.56 .00 ELA Accountability2016 D0363 D0363 ‐ Holcomb District Aggregate ALL All Students 16.53 45.05 31.93 6.46 .00 ELA Accountability2016 D0364 D0364 ‐ Marysville District Aggregate ALL All Students 19.66 41.55 30.47 8.31 .00 ELA Accountability2016 D0365 D0365 ‐ Garnett District Aggregate ALL All Students 17.22 38.35 34.83 9.58 .00 ELA Accountability2016 D0366 D0366 ‐ Woodson District Aggregate ALL All Students 24.79 36.36 28.09 10.74 .00 ELA Accountability2016 D0367 D0367 ‐ Osawatomie District Aggregate ALL All Students 30.79 42.21 22.10 4.89 .00 ELA Accountability2016 D0368 D0368 ‐ Paola District Aggregate ALL All Students 17.41 38.11 36.06 8.40 .00 ELA Accountability2016 D0369 D0369 ‐ Burrton District Aggregate ALL All Students 20.83 35.00 35.00 9.16 .00 ELA Accountability2016 D0371 D0371 ‐ Montezuma District Aggregate ALL All Students 12.85 28.57 45.71 12.85 .00 ELA Accountability2016 D0372 D0372 ‐ Silver Lake District Aggregate ALL All Students 9.78 32.88 41.57 15.76 .00 ELA Accountability2016 D0373 D0373 ‐ Newton District Aggregate ALL All Students 25.79 35.42 29.20 9.57 .00 ELA Accountability2016 D0374 D0374 ‐ Sublette District Aggregate ALL All Students 20.85 39.81 32.22 7.10 .00 ELA Accountability2016 D0375 D0375 ‐ Circle District Aggregate ALL All Students 13.62 34.61 41.47 10.29 .00 ELA Accountability2016 D0376 D0376 ‐ Sterling District Aggregate ALL All Students 14.39 34.09 39.01 12.50 .00 ELA Accountability2016 D0377 D0377 ‐ Atchison Co Comm District Aggregate ALL All Students 30.79 35.29 26.64 7.26 .00 ELA Accountability2016 D0378 D0378 ‐ Riley County District Aggregate ALL All Students 12.91 39.01 34.61 13.46 .00 ELA Accountability2016 D0379 D0379 ‐ Clay Center District Aggregate ALL All Students 19.79 39.16 30.49 10.54 .00 ELA Accountability2016 D0380 D0380 ‐ Vermillion District Aggregate ALL All Students 8.74 30.03 47.90 13.30 .00 ELA Accountability2016 D0381 D0381 ‐ Spearville District Aggregate ALL All Students 24.19 34.40 30.64 10.75 .00 ELA Accountability2016 D0382 D0382 ‐ Pratt District Aggregate ALL All Students 28.16 39.50 25.70 6.61 .00 ELA Accountability2016 D0383 D0383 ‐ Manhattan‐Ogden District Aggregate ALL All Students 13.56 32.21 37.51 16.70 .00 ELA Accountability2016 D0384 D0384 ‐ Blue Valley District Aggregate ALL All Students 14.13 34.78 42.39 8.69 .00 ELA Accountability2016 D0385 D0385 ‐ Andover District Aggregate ALL All Students 8.82 29.67 42.97 18.52 .00 ELA Accountability2016 D0386 D0386 ‐ Madison‐Virgil District Aggregate ALL All Students 21.31 36.88 35.24 6.55 .00 ELA Accountability2016 D0387 D0387 ‐ Altoona‐Midway District Aggregate ALL All Students 40.86 33.33 21.50 4.30 .00 ELA Accountability2016 D0388 D0388 ‐ Ellis District Aggregate ALL All Students 12.19 37.56 41.95 8.29 .00 ELA Accountability2016 D0389 D0389 ‐ Eureka District Aggregate ALL All Students 13.75 44.37 32.81 9.06 .00 ELA Accountability2016 D0390 D0390 ‐ Hamilton District Aggregate ALL All Students 23.25 27.90 44.18 4.65 .00 ELA Accountability2016 D0392 D0392 ‐ Osborne County District Aggregate ALL All Students 20.27 37.76 28.67 13.28 .00 ELA Accountability2016 D0393 D0393 ‐ Solomon District Aggregate ALL All Students 23.23 45.77 23.23 7.74 .00 ELA Accountability2016 D0394 D0394 ‐ Rose Hill Public SchDistrict Aggregate ALL All Students 22.83 36.48 30.05 10.62 .00 ELA Accountability2016 D0395 D0395 ‐ LaCrosse District Aggregate ALL All Students 18.12 41.87 30.62 9.37 .00 ELA Accountability2016 D0396 D0396 ‐ Douglass Public SchDistrict Aggregate ALL All Students 23.89 34.59 35.84 5.66 .00 ELA Accountability2016 D0397 D0397 ‐ Centre District Aggregate ALL All Students 21.67 37.76 32.16 8.39 .00 ELA Accountability2016 D0398 D0398 ‐ Peabody‐Burns District Aggregate ALL All Students 37.50 36.60 15.17 10.71 .00 ELA Accountability2016 D0399 D0399 ‐ Paradise District Aggregate ALL All Students 26.00 44.00 22.00 8.00 .00 ELA Accountability2016 D0400 D0400 ‐ Smoky Valley District Aggregate ALL All Students 17.46 39.22 32.42 10.88 .00 ELA Accountability2016 D0401 D0401 ‐ Chase‐Raymond District Aggregate ALL All Students 43.20 35.80 17.28 3.70 .00 ELA Accountability2016 D0402 D0402 ‐ Augusta District Aggregate ALL All Students 22.62 37.04 32.55 7.77 .00 ELA Accountability2016 D0403 D0403 ‐ Otis‐Bison District Aggregate ALL All Students 21.50 37.63 31.18 9.67 .00 ELA Accountability2016 D0404 D0404 ‐ Riverton District Aggregate ALL All Students 29.18 38.07 26.39 6.34 .00 ELA Accountability2016 D0405 D0405 ‐ Lyons District Aggregate ALL All Students 22.91 43.22 26.30 7.55 .00 ELA Accountability2016 D0407 D0407 ‐ Russell County District Aggregate ALL All Students 22.70 42.02 27.77 7.48 .00 ELA Accountability2016 D0408 D0408 ‐ Marion‐Florence District Aggregate ALL All Students 14.74 36.65 35.85 12.74 .00 ELA Accountability2016 D0409 D0409 ‐ Atchison Public SchDistrict Aggregate ALL All Students 29.65 41.89 23.40 5.04 .00 ELA Accountability2016 D0410 D0410 ‐ Durham‐Hillsboro‐LDistrict Aggregate ALL All Students 21.45 34.94 32.52 11.07 .00 ELA Accountability2016 D0411 D0411 ‐ Goessel District Aggregate ALL All Students 14.96 32.65 36.73 15.64 .00 ELA Accountability2016 D0412 D0412 ‐ Hoxie Community SDistrict Aggregate ALL All Students 15.46 35.05 37.62 11.85 .00 ELA Accountability2016 D0413 D0413 ‐ Chanute Public Sch District Aggregate ALL All Students 21.39 38.56 30.87 9.16 .00 ELA Accountability2016 D0415 D0415 ‐ Hiawatha District Aggregate ALL All Students 17.04 34.08 37.21 11.65 .00 ELA Accountability2016 D0416 D0416 ‐ Louisburg District Aggregate ALL All Students 11.13 36.57 38.53 13.75 .00 ELA Accountability
Data from: http://ksreportcard.ksde.org/2015_2016_Assessment_Full_File.xlsx991373
2017ADEQ00068

program_y Org_No Organization Building_Number GradeNam GroupName PCLevel_One PCLevel_Two PCLevel_Three PCLevel_Four PCNotValid Subject Population2016 D0417 D0417 ‐ Morris County District Aggregate ALL All Students 18.64 40.11 30.79 10.45 .00 ELA Accountability2016 D0418 D0418 ‐ McPherson District Aggregate ALL All Students 24.14 37.83 29.81 8.19 .00 ELA Accountability2016 D0419 D0419 ‐ Canton‐Galva District Aggregate ALL All Students 18.53 39.02 31.70 10.73 .00 ELA Accountability2016 D0420 D0420 ‐ Osage City District Aggregate ALL All Students 23.54 35.17 34.01 7.26 .00 ELA Accountability2016 D0421 D0421 ‐ Lyndon District Aggregate ALL All Students 17.64 39.70 35.78 6.86 .00 ELA Accountability2016 D0422 D0422 ‐ Kiowa County District Aggregate ALL All Students 22.04 31.49 36.22 10.23 .00 ELA Accountability2016 D0423 D0423 ‐ Moundridge District Aggregate ALL All Students 15.90 30.11 40.34 13.63 .00 ELA Accountability2016 D0426 D0426 ‐ Pike Valley District Aggregate ALL All Students 17.75 40.18 33.64 8.41 .00 ELA Accountability2016 D0428 D0428 ‐ Great Bend District Aggregate ALL All Students 27.72 42.20 25.57 4.50 .00 ELA Accountability2016 D0429 D0429 ‐ Troy Public SchoolsDistrict Aggregate ALL All Students 22.28 38.55 30.12 9.03 .00 ELA Accountability2016 D0430 D0430 ‐ South Brown CountDistrict Aggregate ALL All Students 31.48 34.44 29.62 4.44 .00 ELA Accountability2016 D0431 D0431 ‐ Hoisington District Aggregate ALL All Students 26.86 39.09 28.72 5.31 .00 ELA Accountability2016 D0432 D0432 ‐ Victoria District Aggregate ALL All Students 13.92 42.40 34.81 8.86 .00 ELA Accountability2016 D0434 D0434 ‐ Santa Fe Trail District Aggregate ALL All Students 19.05 36.93 36.34 7.66 .00 ELA Accountability2016 D0435 D0435 ‐ Abilene District Aggregate ALL All Students 20.20 37.35 33.79 8.64 .00 ELA Accountability2016 D0436 D0436 ‐ Caney Valley District Aggregate ALL All Students 21.89 38.30 32.83 6.96 .00 ELA Accountability2016 D0437 D0437 ‐ Auburn Washburn District Aggregate ALL All Students 14.75 32.07 38.42 14.75 .00 ELA Accountability2016 D0438 D0438 ‐ Skyline Schools District Aggregate ALL All Students 18.36 35.37 36.73 9.52 .00 ELA Accountability2016 D0439 D0439 ‐ Sedgwick Public SchDistrict Aggregate ALL All Students 18.50 33.07 37.00 11.41 .00 ELA Accountability2016 D0440 D0440 ‐ Halstead District Aggregate ALL All Students 20.05 37.81 34.51 7.61 .00 ELA Accountability2016 D0443 D0443 ‐ Dodge City District Aggregate ALL All Students 35.28 39.57 20.74 4.38 .00 ELA Accountability2016 D0444 D0444 ‐ Little River District Aggregate ALL All Students 17.54 37.42 32.74 12.28 .00 ELA Accountability2016 D0445 D0445 ‐ Coffeyville District Aggregate ALL All Students 24.23 42.78 27.06 5.91 .00 ELA Accountability2016 D0446 D0446 ‐ Independence District Aggregate ALL All Students 24.18 37.11 30.49 8.20 .00 ELA Accountability2016 D0447 D0447 ‐ Cherryvale District Aggregate ALL All Students 26.51 41.86 26.97 4.65 .00 ELA Accountability2016 D0448 D0448 ‐ Inman District Aggregate ALL All Students 15.49 35.68 39.90 8.92 .00 ELA Accountability2016 D0449 D0449 ‐ Easton District Aggregate ALL All Students 20.64 34.21 35.39 9.73 .00 ELA Accountability2016 D0450 D0450 ‐ Shawnee Heights District Aggregate ALL All Students 19.75 36.22 34.63 9.38 .00 ELA Accountability2016 D0452 D0452 ‐ Stanton County District Aggregate ALL All Students 33.16 40.20 20.60 6.03 .00 ELA Accountability2016 D0453 D0453 ‐ Leavenworth District Aggregate ALL All Students 38.45 32.04 24.68 4.80 .00 ELA Accountability2016 D0454 D0454 ‐ Burlingame Public SDistrict Aggregate ALL All Students 28.48 39.39 26.06 6.06 .00 ELA Accountability2016 D0456 D0456 ‐ Marais Des Cygnes District Aggregate ALL All Students 24.52 36.79 30.18 8.49 .00 ELA Accountability2016 D0457 D0457 ‐ Garden City District Aggregate ALL All Students 32.44 42.98 20.69 3.87 .00 ELA Accountability2016 D0458 D0458 ‐ Basehor‐Linwood District Aggregate ALL All Students 15.03 34.96 36.79 13.20 .00 ELA Accountability2016 D0459 D0459 ‐ Bucklin District Aggregate ALL All Students 29.83 44.35 21.77 4.03 .00 ELA Accountability2016 D0460 D0460 ‐ Hesston District Aggregate ALL All Students 11.64 34.24 38.58 15.52 .00 ELA Accountability2016 D0461 D0461 ‐ Neodesha District Aggregate ALL All Students 27.37 39.10 25.41 8.10 .00 ELA Accountability2016 D0462 D0462 ‐ Central District Aggregate ALL All Students 30.06 41.25 26.57 2.09 .00 ELA Accountability2016 D0463 D0463 ‐ Udall District Aggregate ALL All Students 24.05 41.13 27.21 7.59 .00 ELA Accountability2016 D0464 D0464 ‐ Tonganoxie District Aggregate ALL All Students 23.05 37.84 30.05 9.04 .00 ELA Accountability2016 D0465 D0465 ‐ Winfield District Aggregate ALL All Students 22.33 40.68 28.61 8.36 .00 ELA Accountability2016 D0466 D0466 ‐ Scott County District Aggregate ALL All Students 21.80 38.40 31.80 8.00 .00 ELA Accountability2016 D0467 D0467 ‐ Leoti District Aggregate ALL All Students 22.27 42.07 28.21 7.42 .00 ELA Accountability2016 D0468 D0468 ‐ Healy Public Schoo District Aggregate ALL All Students 31.03 31.03 34.48 3.44 .00 ELA Accountability2016 D0469 D0469 ‐ Lansing District Aggregate ALL All Students 17.06 34.66 36.61 11.65 .00 ELA Accountability2016 D0470 D0470 ‐ Arkansas City District Aggregate ALL All Students 26.47 40.68 26.25 6.58 .00 ELA Accountability2016 D0471 D0471 ‐ Dexter District Aggregate ALL All Students 11.53 48.71 35.89 3.84 .00 ELA Accountability2016 D0473 D0473 ‐ Chapman District Aggregate ALL All Students 12.21 41.16 37.03 9.58 .00 ELA Accountability2016 D0474 D0474 ‐ Haviland District Aggregate ALL All Students 15.00 30.00 30.00 25.00 .00 ELA Accountability2016 D0475 D0475 ‐ Geary County Scho District Aggregate ALL All Students 23.54 36.98 31.11 8.34 .00 ELA Accountability2016 D0476 D0476 ‐ Copeland District Aggregate ALL All Students 20.48 49.39 24.09 6.02 .00 ELA Accountability
Data from: http://ksreportcard.ksde.org/2015_2016_Assessment_Full_File.xlsx991373
2017ADEQ00069

program_y Org_No Organization Building_Number GradeNam GroupName PCLevel_One PCLevel_Two PCLevel_Three PCLevel_Four PCNotValid Subject Population2016 D0477 D0477 ‐ Ingalls District Aggregate ALL All Students 18.58 39.82 34.51 7.07 .00 ELA Accountability2016 D0479 D0479 ‐ Crest District Aggregate ALL All Students 40.38 31.73 25.00 2.88 .00 ELA Accountability2016 D0480 D0480 ‐ Liberal District Aggregate ALL All Students 35.89 40.53 19.57 3.98 .00 ELA Accountability2016 D0481 D0481 ‐ Rural Vista District Aggregate ALL All Students 12.59 40.94 42.51 3.93 .00 ELA Accountability2016 D0482 D0482 ‐ Dighton District Aggregate ALL All Students 14.75 42.62 29.50 13.11 .00 ELA Accountability2016 D0483 D0483 ‐ Kismet‐Plains District Aggregate ALL All Students 33.87 39.89 22.95 3.27 .00 ELA Accountability2016 D0484 D0484 ‐ Fredonia District Aggregate ALL All Students 27.40 40.06 26.80 5.72 .00 ELA Accountability2016 D0487 D0487 ‐ Herington District Aggregate ALL All Students 28.31 31.50 32.87 7.30 .00 ELA Accountability2016 D0489 D0489 ‐ Hays District Aggregate ALL All Students 16.96 35.16 35.16 12.70 .00 ELA Accountability2016 D0490 D0490 ‐ El Dorado District Aggregate ALL All Students 24.27 43.12 24.72 7.87 .00 ELA Accountability2016 D0491 D0491 ‐ Eudora District Aggregate ALL All Students 16.22 36.15 36.26 11.35 .00 ELA Accountability2016 D0492 D0492 ‐ Flinthills District Aggregate ALL All Students 17.98 42.44 29.49 10.07 .00 ELA Accountability2016 D0493 D0493 ‐ Columbus District Aggregate ALL All Students 20.55 40.88 34.95 3.60 .00 ELA Accountability2016 D0494 D0494 ‐ Syracuse District Aggregate ALL All Students 31.95 40.66 23.23 4.14 .00 ELA Accountability2016 D0495 D0495 ‐ Ft Larned District Aggregate ALL All Students 20.27 45.55 29.15 5.01 .00 ELA Accountability2016 D0496 D0496 ‐ Pawnee Heights District Aggregate ALL All Students 20.00 29.23 38.46 12.30 .00 ELA Accountability2016 D0497 D0497 ‐ Lawrence District Aggregate ALL All Students 16.95 31.50 35.44 16.09 .00 ELA Accountability2016 D0498 D0498 ‐ Valley Heights District Aggregate ALL All Students 18.75 32.69 37.98 10.57 .00 ELA Accountability2016 D0499 D0499 ‐ Galena District Aggregate ALL All Students 24.68 42.89 27.18 5.23 .00 ELA Accountability2016 D0500 D0500 ‐ Kansas City District Aggregate ALL All Students 51.25 32.10 14.31 2.32 .00 ELA Accountability2016 D0501 D0501 ‐ Topeka Public SchoDistrict Aggregate ALL All Students 42.73 35.33 18.25 3.64 .01 ELA Accountability2016 D0502 D0502 ‐ Lewis District Aggregate ALL All Students 8.82 35.29 47.05 8.82 .00 ELA Accountability2016 D0503 D0503 ‐ Parsons District Aggregate ALL All Students 19.79 35.57 34.06 10.57 .00 ELA Accountability2016 D0504 D0504 ‐ Oswego District Aggregate ALL All Students 17.80 39.72 31.96 10.50 .00 ELA Accountability2016 D0505 D0505 ‐ Chetopa‐St. Paul District Aggregate ALL All Students 32.12 38.46 24.43 4.97 .00 ELA Accountability2016 D0506 D0506 ‐ Labette County District Aggregate ALL All Students 21.35 34.14 36.57 7.92 .00 ELA Accountability2016 D0507 D0507 ‐ Satanta District Aggregate ALL All Students 25.31 37.97 31.64 5.06 .00 ELA Accountability2016 D0508 D0508 ‐ Baxter Springs District Aggregate ALL All Students 25.91 39.53 27.63 6.90 .00 ELA Accountability2016 D0509 D0509 ‐ South Haven District Aggregate ALL All Students 30.23 44.18 22.09 3.48 .00 ELA Accountability2016 D0511 D0511 ‐ Attica District Aggregate ALL All Students 15.66 46.98 26.50 10.84 .00 ELA Accountability2016 D0512 D0512 ‐ Shawnee Mission PDistrict Aggregate ALL All Students 17.20 31.21 35.74 15.83 .00 ELA Accountability2016 S0604 S0604 ‐ School for Blind District Aggregate ALL All Students 53.84 23.07 23.07 .00 .00 ELA Accountability2016 S0610 S0610 ‐ School for Deaf District Aggregate ALL All Students 88.63 4.54 6.81 .00 .00 ELA Accountability2016 0 State of Kansas District Aggregate ALL All Students 23.33 35.32 31.16 10.17 .00 ELA Accountability2016 Z0006 Z0006 ‐ Brookridge Day Sch District Aggregate ALL All Students .00 10.52 42.10 47.36 .00 ELA Accountability2016 Z0009 Z0009 ‐ Independence BibleDistrict Aggregate ALL All Students 28.88 33.33 33.33 4.44 .00 ELA Accountability2016 Z0026 Z0026 ‐ Lutheran Schools (TDistrict Aggregate ALL All Students 11.78 27.75 40.49 19.96 .00 ELA Accountability2016 Z0028 Z0028 ‐ Dodge City CatholicDistrict Aggregate ALL All Students 8.87 28.53 41.00 21.58 .00 ELA Accountability2016 Z0029 Z0029 ‐ Kansas City CatholicDistrict Aggregate ALL All Students 7.32 25.79 45.39 21.47 .01 ELA Accountability2016 Z0030 Z0030 ‐ Salina Catholic DiocDistrict Aggregate ALL All Students 12.37 31.83 39.53 16.26 .00 ELA Accountability2016 Z0031 Z0031 ‐ Wichita Catholic DioDistrict Aggregate ALL All Students 6.10 26.52 45.62 21.75 .00 ELA Accountability2016 Z0032 Z0032 ‐ Lakemary Center PaDistrict Aggregate ALL All Students 42.10 21.05 36.84 .00 .00 ELA Accountability2016 Z0058 Z0058 ‐ Kickapoo Nation SchDistrict Aggregate ALL All Students 60.00 35.00 5.00 .00 .00 ELA Accountability2016 Z0060 Z0060 ‐ Accelerated SchoolsDistrict Aggregate ALL All Students 40.00 24.00 24.00 12.00 .00 ELA Accountability2016 Z0064 Z0064 ‐ Annoor Islamic SchoDistrict Aggregate ALL All Students 15.21 29.34 36.95 18.47 .00 ELA Accountability2016 Z0066 Z0066 ‐ Word of Life Traditi District Aggregate ALL All Students 40.90 33.33 22.72 3.03 .00 ELA Accountability2016 Z0067 Z0067 ‐ Wellington ChristianDistrict Aggregate ALL All Students .00 10.52 36.84 52.63 .00 ELA Accountability2016 Z0069 Z0069 ‐ Countryside ChristiaDistrict Aggregate ALL All Students .00 20.00 10.00 70.00 .00 ELA Accountability
Data from: http://ksreportcard.ksde.org/2015_2016_Assessment_Full_File.xlsx991373
2017ADEQ00070

program_y Org_No Organization Building_Number GradeNam GroupName PCLevel_One PCLevel_Two PCLevel_Three PCLevel_Four PCNotValid Subject Population2016 D0101 D0101 ‐ Erie‐Galesburg District Aggregate ALL All Students 34.43 45.05 15.75 4.76 .00 MATH Accountability2016 D0102 D0102 ‐ Cimarron‐Ensign District Aggregate ALL All Students 13.29 48.64 32.93 5.13 .00 MATH Accountability2016 D0103 D0103 ‐ Cheylin District Aggregate ALL All Students 14.08 56.33 25.35 4.22 .00 MATH Accountability2016 D0105 D0105 ‐ Rawlins County District Aggregate ALL All Students 26.06 45.45 21.21 7.27 .00 MATH Accountability2016 D0106 D0106 ‐ Western Plains District Aggregate ALL All Students 34.69 53.06 10.20 2.04 .00 MATH Accountability2016 D0107 D0107 ‐ Rock Hills District Aggregate ALL All Students 14.07 49.62 25.18 11.11 .00 MATH Accountability2016 D0108 D0108 ‐ Washington Co. SchDistrict Aggregate ALL All Students 25.28 53.44 17.24 4.02 .00 MATH Accountability2016 D0109 D0109 ‐ Republic County District Aggregate ALL All Students 17.55 39.18 33.06 10.20 .00 MATH Accountability2016 D0110 D0110 ‐ Thunder Ridge SchoDistrict Aggregate ALL All Students 20.86 43.47 26.08 9.56 .00 MATH Accountability2016 D0111 D0111 ‐ Doniphan West SchDistrict Aggregate ALL All Students 33.76 45.45 18.83 1.94 .00 MATH Accountability2016 D0112 D0112 ‐ Central Plains District Aggregate ALL All Students 14.09 42.72 28.63 14.54 .00 MATH Accountability2016 D0113 D0113 ‐ Prairie Hills District Aggregate ALL All Students 10.61 34.86 35.57 18.93 .00 MATH Accountability2016 D0114 D0114 ‐ Riverside District Aggregate ALL All Students 38.99 42.08 15.44 3.47 .00 MATH Accountability2016 D0115 D0115 ‐ Nemaha Central District Aggregate ALL All Students 14.50 40.00 30.19 15.29 .00 MATH Accountability2016 D0200 D0200 ‐ Greeley County SchDistrict Aggregate ALL All Students 23.01 49.20 24.60 3.17 .00 MATH Accountability2016 D0202 D0202 ‐ Turner‐Kansas City District Aggregate ALL All Students 41.13 41.89 14.11 2.84 .00 MATH Accountability2016 D0203 D0203 ‐ Piper‐Kansas City District Aggregate ALL All Students 16.93 36.51 33.39 13.15 .00 MATH Accountability2016 D0204 D0204 ‐ Bonner Springs District Aggregate ALL All Students 25.98 42.44 23.97 7.59 .00 MATH Accountability2016 D0205 D0205 ‐ Bluestem District Aggregate ALL All Students 40.00 41.48 15.92 2.59 .00 MATH Accountability2016 D0206 D0206 ‐ Remington‐WhitewDistrict Aggregate ALL All Students 18.42 44.73 27.44 9.39 .00 MATH Accountability2016 D0207 D0207 ‐ Ft Leavenworth District Aggregate ALL All Students 7.93 34.75 37.47 19.83 .00 MATH Accountability2016 D0208 D0208 ‐ Wakeeney District Aggregate ALL All Students 23.71 42.78 27.83 5.67 .00 MATH Accountability2016 D0209 D0209 ‐ Moscow Public Sch District Aggregate ALL All Students 44.18 34.88 15.11 5.81 .00 MATH Accountability2016 D0210 D0210 ‐ Hugoton Public SchDistrict Aggregate ALL All Students 33.86 40.08 22.24 3.80 .00 MATH Accountability2016 D0211 D0211 ‐ Norton CommunityDistrict Aggregate ALL All Students 19.20 40.67 30.79 9.32 .00 MATH Accountability2016 D0212 D0212 ‐ Northern Valley District Aggregate ALL All Students 11.53 51.28 32.05 5.12 .00 MATH Accountability2016 D0214 D0214 ‐ Ulysses District Aggregate ALL All Students 36.83 47.58 13.40 2.17 .00 MATH Accountability2016 D0215 D0215 ‐ Lakin District Aggregate ALL All Students 15.18 49.05 28.79 6.96 .00 MATH Accountability2016 D0216 D0216 ‐ Deerfield District Aggregate ALL All Students 49.41 32.94 15.29 2.35 .00 MATH Accountability2016 D0217 D0217 ‐ Rolla District Aggregate ALL All Students 32.91 53.16 8.86 5.06 .00 MATH Accountability2016 D0218 D0218 ‐ Elkhart District Aggregate ALL All Students 35.25 40.82 19.58 4.32 .00 MATH Accountability2016 D0219 D0219 ‐ Minneola District Aggregate ALL All Students 28.57 40.47 26.98 3.96 .00 MATH Accountability2016 D0220 D0220 ‐ Ashland District Aggregate ALL All Students 28.30 41.50 23.58 6.60 .00 MATH Accountability2016 D0223 D0223 ‐ Barnes District Aggregate ALL All Students 18.51 43.70 28.14 9.62 .00 MATH Accountability2016 D0224 D0224 ‐ Clifton‐Clyde District Aggregate ALL All Students 21.47 41.10 30.67 6.74 .00 MATH Accountability2016 D0225 D0225 ‐ Fowler District Aggregate ALL All Students 30.15 47.61 14.28 7.93 .00 MATH Accountability2016 D0226 D0226 ‐ Meade District Aggregate ALL All Students 28.48 42.40 22.78 6.32 .00 MATH Accountability2016 D0227 D0227 ‐ Hodgeman County District Aggregate ALL All Students 16.12 56.12 25.16 2.58 .00 MATH Accountability2016 D0229 D0229 ‐ Blue Valley District Aggregate ALL All Students 7.92 28.96 37.44 25.66 .00 MATH Accountability2016 D0230 D0230 ‐ Spring Hill District Aggregate ALL All Students 18.98 34.83 28.54 17.63 .00 MATH Accountability2016 D0231 D0231 ‐ Gardner Edgerton District Aggregate ALL All Students 15.14 35.64 33.02 16.18 .00 MATH Accountability2016 D0232 D0232 ‐ De Soto District Aggregate ALL All Students 9.49 35.06 36.07 19.36 .00 MATH Accountability2016 D0233 D0233 ‐ Olathe District Aggregate ALL All Students 17.83 36.59 30.12 15.44 .00 MATH Accountability2016 D0234 D0234 ‐ Fort Scott District Aggregate ALL All Students 36.69 40.72 18.76 3.81 .00 MATH Accountability2016 D0235 D0235 ‐ Uniontown District Aggregate ALL All Students 16.74 47.96 27.14 8.14 .00 MATH Accountability2016 D0237 D0237 ‐ Smith Center District Aggregate ALL All Students 25.27 50.54 20.87 3.29 .00 MATH Accountability2016 D0239 D0239 ‐ North Ottawa CounDistrict Aggregate ALL All Students 14.65 44.62 31.27 9.44 .00 MATH Accountability2016 D0240 D0240 ‐ Twin Valley District Aggregate ALL All Students 24.42 39.41 30.29 5.86 .00 MATH Accountability2016 D0241 D0241 ‐ Wallace County SchDistrict Aggregate ALL All Students 9.89 35.16 39.56 15.38 .00 MATH Accountability2016 D0242 D0242 ‐ Weskan District Aggregate ALL All Students 33.33 31.25 27.08 8.33 .00 MATH Accountability2016 D0243 D0243 ‐ Lebo‐Waverly District Aggregate ALL All Students 20.51 39.48 32.30 7.69 .00 MATH Accountability
Data from: http://ksreportcard.ksde.org/2015_2016_Assessment_Full_File.xlsx991373
2017ADEQ00071

program_y Org_No Organization Building_Number GradeNam GroupName PCLevel_One PCLevel_Two PCLevel_Three PCLevel_Four PCNotValid Subject Population2016 D0244 D0244 ‐ Burlington District Aggregate ALL All Students 19.15 43.65 27.83 9.35 .00 MATH Accountability2016 D0245 D0245 ‐ LeRoy‐Gridley District Aggregate ALL All Students 20.61 50.51 24.74 4.12 .00 MATH Accountability2016 D0246 D0246 ‐ Northeast District Aggregate ALL All Students 35.49 46.75 14.28 3.46 .00 MATH Accountability2016 D0247 D0247 ‐ Cherokee District Aggregate ALL All Students 35.53 35.53 21.90 7.02 .00 MATH Accountability2016 D0248 D0248 ‐ Girard District Aggregate ALL All Students 28.41 43.89 22.76 4.91 .00 MATH Accountability2016 D0249 D0249 ‐ Frontenac Public ScDistrict Aggregate ALL All Students 22.86 39.91 26.19 11.01 .00 MATH Accountability2016 D0250 D0250 ‐ Pittsburg District Aggregate ALL All Students 26.74 37.51 25.85 9.87 .00 MATH Accountability2016 D0251 D0251 ‐ North Lyon County District Aggregate ALL All Students 20.35 42.03 30.08 7.52 .00 MATH Accountability2016 D0252 D0252 ‐ Southern Lyon Cou District Aggregate ALL All Students 18.82 43.13 29.41 8.62 .00 MATH Accountability2016 D0253 D0253 ‐ Emporia District Aggregate ALL All Students 25.20 42.34 23.65 8.79 .00 MATH Accountability2016 D0254 D0254 ‐ Barber County NortDistrict Aggregate ALL All Students 28.50 40.27 25.33 5.88 .00 MATH Accountability2016 D0255 D0255 ‐ South Barber District Aggregate ALL All Students 17.17 46.46 27.27 9.09 .00 MATH Accountability2016 D0256 D0256 ‐ Marmaton Valley District Aggregate ALL All Students 20.27 54.72 20.94 4.05 .00 MATH Accountability2016 D0257 D0257 ‐ Iola District Aggregate ALL All Students 33.02 46.42 16.59 3.95 .00 MATH Accountability2016 D0258 D0258 ‐ Humboldt District Aggregate ALL All Students 34.04 46.20 16.71 3.03 .00 MATH Accountability2016 D0259 D0259 ‐ Wichita District Aggregate ALL All Students 41.58 38.09 15.56 4.74 .00 MATH Accountability2016 D0260 D0260 ‐ Derby District Aggregate ALL All Students 23.28 40.13 25.50 11.07 .00 MATH Accountability2016 D0261 D0261 ‐ Haysville District Aggregate ALL All Students 26.86 40.37 23.15 9.60 .00 MATH Accountability2016 D0262 D0262 ‐ Valley Center Pub SDistrict Aggregate ALL All Students 18.08 40.47 30.00 11.43 .00 MATH Accountability2016 D0263 D0263 ‐ Mulvane District Aggregate ALL All Students 20.78 49.43 23.03 6.74 .00 MATH Accountability2016 D0264 D0264 ‐ Clearwater District Aggregate ALL All Students 23.93 43.58 27.35 5.12 .00 MATH Accountability2016 D0265 D0265 ‐ Goddard District Aggregate ALL All Students 14.71 41.10 32.35 11.82 .00 MATH Accountability2016 D0266 D0266 ‐ Maize District Aggregate ALL All Students 16.30 36.59 32.47 14.60 .02 MATH Accountability2016 D0267 D0267 ‐ Renwick District Aggregate ALL All Students 14.41 42.84 31.77 10.96 .00 MATH Accountability2016 D0268 D0268 ‐ Cheney District Aggregate ALL All Students 13.25 37.50 32.75 16.50 .00 MATH Accountability2016 D0269 D0269 ‐ Palco District Aggregate ALL All Students 26.66 50.00 21.66 1.66 .00 MATH Accountability2016 D0270 D0270 ‐ Plainville District Aggregate ALL All Students 33.33 47.61 13.75 5.29 .00 MATH Accountability2016 D0271 D0271 ‐ Stockton District Aggregate ALL All Students 35.22 43.75 19.31 1.70 .00 MATH Accountability2016 D0272 D0272 ‐ Waconda District Aggregate ALL All Students 17.19 29.93 35.03 17.83 .00 MATH Accountability2016 D0273 D0273 ‐ Beloit District Aggregate ALL All Students 16.09 41.16 32.45 10.29 .00 MATH Accountability2016 D0274 D0274 ‐ Oakley District Aggregate ALL All Students 24.86 38.37 29.72 7.02 .00 MATH Accountability2016 D0275 D0275 ‐ Triplains District Aggregate ALL All Students .00 14.70 52.94 32.35 .00 MATH Accountability2016 D0281 D0281 ‐ Graham County District Aggregate ALL All Students 37.50 42.18 17.70 2.60 .00 MATH Accountability2016 D0282 D0282 ‐ West Elk District Aggregate ALL All Students 13.85 49.39 30.72 6.02 .00 MATH Accountability2016 D0283 D0283 ‐ Elk Valley District Aggregate ALL All Students 52.00 40.00 8.00 .00 .00 MATH Accountability2016 D0284 D0284 ‐ Chase County District Aggregate ALL All Students 23.29 47.15 23.86 5.68 .00 MATH Accountability2016 D0285 D0285 ‐ Cedar Vale District Aggregate ALL All Students 26.19 45.23 27.38 1.19 .00 MATH Accountability2016 D0286 D0286 ‐ Chautauqua Co ComDistrict Aggregate ALL All Students 28.04 52.38 16.93 2.64 .00 MATH Accountability2016 D0287 D0287 ‐ West Franklin District Aggregate ALL All Students 26.94 40.25 24.02 8.76 .00 MATH Accountability2016 D0288 D0288 ‐ Central Heights District Aggregate ALL All Students 29.71 35.86 26.81 7.60 .00 MATH Accountability2016 D0289 D0289 ‐ Wellsville District Aggregate ALL All Students 21.46 46.82 24.63 7.07 .00 MATH Accountability2016 D0290 D0290 ‐ Ottawa District Aggregate ALL All Students 30.89 42.71 21.64 4.74 .00 MATH Accountability2016 D0291 D0291 ‐ Grinnell Public SchoDistrict Aggregate ALL All Students 16.41 49.25 26.86 7.46 .00 MATH Accountability2016 D0292 D0292 ‐ Wheatland District Aggregate ALL All Students 24.24 51.51 15.15 9.09 .00 MATH Accountability2016 D0293 D0293 ‐ Quinter Public SchoDistrict Aggregate ALL All Students 23.57 37.85 31.42 7.14 .00 MATH Accountability2016 D0294 D0294 ‐ Oberlin District Aggregate ALL All Students 26.87 36.25 26.87 10.00 .00 MATH Accountability2016 D0297 D0297 ‐ St Francis Comm ScDistrict Aggregate ALL All Students 22.53 59.85 16.19 1.40 .00 MATH Accountability2016 D0298 D0298 ‐ Lincoln District Aggregate ALL All Students 16.66 45.67 30.24 7.40 .00 MATH Accountability2016 D0299 D0299 ‐ Sylvan Grove District Aggregate ALL All Students 20.61 38.93 33.58 6.87 .00 MATH Accountability2016 D0300 D0300 ‐ Comanche County District Aggregate ALL All Students 21.62 37.16 29.72 11.48 .00 MATH Accountability2016 D0303 D0303 ‐ Ness City District Aggregate ALL All Students 30.23 45.73 19.37 4.65 .00 MATH Accountability
Data from: http://ksreportcard.ksde.org/2015_2016_Assessment_Full_File.xlsx991373
2017ADEQ00072

program_y Org_No Organization Building_Number GradeNam GroupName PCLevel_One PCLevel_Two PCLevel_Three PCLevel_Four PCNotValid Subject Population2016 D0305 D0305 ‐ Salina District Aggregate ALL All Students 27.89 42.72 23.19 6.18 .00 MATH Accountability2016 D0306 D0306 ‐ Southeast Of SalineDistrict Aggregate ALL All Students 20.62 39.42 31.07 8.87 .00 MATH Accountability2016 D0307 D0307 ‐ Ell‐Saline District Aggregate ALL All Students 27.71 45.78 22.89 3.61 .00 MATH Accountability2016 D0308 D0308 ‐ Hutchinson Public SDistrict Aggregate ALL All Students 31.34 41.51 21.75 5.38 .00 MATH Accountability2016 D0309 D0309 ‐ Nickerson District Aggregate ALL All Students 25.65 48.86 19.54 5.93 .00 MATH Accountability2016 D0310 D0310 ‐ Fairfield District Aggregate ALL All Students 41.21 42.56 14.18 2.02 .00 MATH Accountability2016 D0311 D0311 ‐ Pretty Prairie District Aggregate ALL All Students 16.41 50.74 24.62 8.20 .00 MATH Accountability2016 D0312 D0312 ‐ Haven Public SchooDistrict Aggregate ALL All Students 27.57 44.62 20.32 7.47 .00 MATH Accountability2016 D0313 D0313 ‐ Buhler District Aggregate ALL All Students 20.03 42.66 28.49 8.80 .00 MATH Accountability2016 D0314 D0314 ‐ Brewster District Aggregate ALL All Students 45.00 38.33 15.00 1.66 .00 MATH Accountability2016 D0315 D0315 ‐ Colby Public SchoolDistrict Aggregate ALL All Students 28.92 48.51 18.22 4.32 .00 MATH Accountability2016 D0316 D0316 ‐ Golden Plains District Aggregate ALL All Students 25.53 43.61 25.53 5.31 .00 MATH Accountability2016 D0320 D0320 ‐ Wamego District Aggregate ALL All Students 23.89 42.13 24.27 9.68 .00 MATH Accountability2016 D0321 D0321 ‐ Kaw Valley District Aggregate ALL All Students 18.73 45.00 28.54 7.70 .00 MATH Accountability2016 D0322 D0322 ‐ Onaga‐Havensville‐District Aggregate ALL All Students 21.21 53.78 23.48 1.51 .00 MATH Accountability2016 D0323 D0323 ‐ Rock Creek District Aggregate ALL All Students 9.86 39.44 36.68 14.00 .00 MATH Accountability2016 D0325 D0325 ‐ Phillipsburg District Aggregate ALL All Students 24.62 41.83 22.25 11.27 .00 MATH Accountability2016 D0326 D0326 ‐ Logan District Aggregate ALL All Students 25.31 45.56 25.31 3.79 .00 MATH Accountability2016 D0327 D0327 ‐ Ellsworth District Aggregate ALL All Students 22.11 43.91 26.28 7.69 .00 MATH Accountability2016 D0329 D0329 ‐ Mill Creek Valley District Aggregate ALL All Students 18.66 37.33 34.66 9.33 .00 MATH Accountability2016 D0330 D0330 ‐ Mission Valley District Aggregate ALL All Students 30.24 55.24 14.11 .40 .00 MATH Accountability2016 D0331 D0331 ‐ Kingman ‐ Norwich District Aggregate ALL All Students 28.60 41.24 21.95 8.20 .00 MATH Accountability2016 D0332 D0332 ‐ Cunningham District Aggregate ALL All Students 18.29 40.24 28.04 13.41 .00 MATH Accountability2016 D0333 D0333 ‐ Concordia District Aggregate ALL All Students 30.65 43.10 20.88 5.36 .00 MATH Accountability2016 D0334 D0334 ‐ Southern Cloud District Aggregate ALL All Students 29.06 46.51 19.76 4.65 .00 MATH Accountability2016 D0335 D0335 ‐ North Jackson District Aggregate ALL All Students 17.24 44.33 27.58 10.83 .00 MATH Accountability2016 D0336 D0336 ‐ Holton District Aggregate ALL All Students 16.51 35.77 32.11 15.59 .00 MATH Accountability2016 D0337 D0337 ‐ Royal Valley District Aggregate ALL All Students 26.93 39.34 21.54 12.17 .00 MATH Accountability2016 D0338 D0338 ‐ Valley Falls District Aggregate ALL All Students 17.48 45.90 31.14 5.46 .00 MATH Accountability2016 D0339 D0339 ‐ Jefferson County N District Aggregate ALL All Students 17.16 37.76 33.90 11.15 .00 MATH Accountability2016 D0340 D0340 ‐ Jefferson West District Aggregate ALL All Students 19.34 39.56 30.65 10.43 .00 MATH Accountability2016 D0341 D0341 ‐ Oskaloosa Public ScDistrict Aggregate ALL All Students 37.54 38.73 18.97 4.74 .00 MATH Accountability2016 D0342 D0342 ‐ McLouth District Aggregate ALL All Students 34.37 45.70 17.96 1.95 .00 MATH Accountability2016 D0343 D0343 ‐ Perry Public School District Aggregate ALL All Students 19.68 42.48 27.72 10.10 .00 MATH Accountability2016 D0344 D0344 ‐ Pleasanton District Aggregate ALL All Students 23.78 50.27 21.62 4.32 .00 MATH Accountability2016 D0345 D0345 ‐ Seaman District Aggregate ALL All Students 19.19 39.42 30.15 11.21 .00 MATH Accountability2016 D0346 D0346 ‐ Jayhawk District Aggregate ALL All Students 19.25 36.29 34.44 10.00 .00 MATH Accountability2016 D0347 D0347 ‐ Kinsley‐Offerle District Aggregate ALL All Students 18.12 45.00 32.50 4.37 .00 MATH Accountability2016 D0348 D0348 ‐ Baldwin City District Aggregate ALL All Students 16.71 45.46 27.90 9.91 .00 MATH Accountability2016 D0349 D0349 ‐ Stafford District Aggregate ALL All Students 23.52 53.92 19.60 2.94 .00 MATH Accountability2016 D0350 D0350 ‐ St John‐Hudson District Aggregate ALL All Students 16.66 46.00 34.00 3.33 .00 MATH Accountability2016 D0351 D0351 ‐ Macksville District Aggregate ALL All Students 37.93 36.55 21.37 4.13 .00 MATH Accountability2016 D0352 D0352 ‐ Goodland District Aggregate ALL All Students 22.07 39.39 24.24 14.28 .00 MATH Accountability2016 D0353 D0353 ‐ Wellington District Aggregate ALL All Students 22.92 36.62 30.17 10.27 .00 MATH Accountability2016 D0355 D0355 ‐ Ellinwood Public ScDistrict Aggregate ALL All Students 23.41 42.43 27.80 6.34 .00 MATH Accountability2016 D0356 D0356 ‐ Conway Springs District Aggregate ALL All Students 19.49 50.84 26.69 2.96 .00 MATH Accountability2016 D0357 D0357 ‐ Belle Plaine District Aggregate ALL All Students 33.90 44.86 19.17 2.05 .00 MATH Accountability2016 D0358 D0358 ‐ Oxford District Aggregate ALL All Students 38.16 39.69 19.84 2.29 .00 MATH Accountability2016 D0359 D0359 ‐ Argonia Public SchoDistrict Aggregate ALL All Students 10.00 51.25 32.50 6.25 .00 MATH Accountability2016 D0360 D0360 ‐ Caldwell District Aggregate ALL All Students 37.19 48.76 12.39 1.65 .00 MATH Accountability2016 D0361 D0361 ‐ Chaparral Schools District Aggregate ALL All Students 23.73 41.66 28.28 6.31 .00 MATH Accountability
Data from: http://ksreportcard.ksde.org/2015_2016_Assessment_Full_File.xlsx991373
2017ADEQ00073

program_y Org_No Organization Building_Number GradeNam GroupName PCLevel_One PCLevel_Two PCLevel_Three PCLevel_Four PCNotValid Subject Population2016 D0362 D0362 ‐ Prairie View District Aggregate ALL All Students 31.90 44.57 19.90 3.61 .00 MATH Accountability2016 D0363 D0363 ‐ Holcomb District Aggregate ALL All Students 23.52 40.98 28.84 6.64 .00 MATH Accountability2016 D0364 D0364 ‐ Marysville District Aggregate ALL All Students 25.48 43.76 26.59 4.15 .00 MATH Accountability2016 D0365 D0365 ‐ Garnett District Aggregate ALL All Students 18.46 43.22 26.91 11.39 .00 MATH Accountability2016 D0366 D0366 ‐ Woodson District Aggregate ALL All Students 19.42 45.45 24.38 10.74 .00 MATH Accountability2016 D0367 D0367 ‐ Osawatomie District Aggregate ALL All Students 32.61 43.24 18.73 5.40 .00 MATH Accountability2016 D0368 D0368 ‐ Paola District Aggregate ALL All Students 18.02 44.60 28.00 9.36 .00 MATH Accountability2016 D0369 D0369 ‐ Burrton District Aggregate ALL All Students 22.50 41.66 31.66 4.16 .00 MATH Accountability2016 D0371 D0371 ‐ Montezuma District Aggregate ALL All Students 12.67 36.61 38.02 12.67 .00 MATH Accountability2016 D0372 D0372 ‐ Silver Lake District Aggregate ALL All Students 10.32 31.52 38.85 19.29 .00 MATH Accountability2016 D0373 D0373 ‐ Newton District Aggregate ALL All Students 34.14 37.49 20.02 8.33 .00 MATH Accountability2016 D0374 D0374 ‐ Sublette District Aggregate ALL All Students 25.11 48.34 21.80 4.73 .00 MATH Accountability2016 D0375 D0375 ‐ Circle District Aggregate ALL All Students 18.12 39.17 31.11 11.58 .00 MATH Accountability2016 D0376 D0376 ‐ Sterling District Aggregate ALL All Students 19.62 31.32 30.56 18.49 .00 MATH Accountability2016 D0377 D0377 ‐ Atchison Co Comm District Aggregate ALL All Students 29.02 46.15 17.48 7.34 .00 MATH Accountability2016 D0378 D0378 ‐ Riley County District Aggregate ALL All Students 17.63 38.56 31.12 12.67 .00 MATH Accountability2016 D0379 D0379 ‐ Clay Center District Aggregate ALL All Students 20.11 45.00 25.18 9.69 .00 MATH Accountability2016 D0380 D0380 ‐ Vermillion District Aggregate ALL All Students 14.06 34.60 37.26 14.06 .00 MATH Accountability2016 D0381 D0381 ‐ Spearville District Aggregate ALL All Students 17.20 41.39 29.03 12.36 .00 MATH Accountability2016 D0382 D0382 ‐ Pratt District Aggregate ALL All Students 27.46 43.37 22.72 6.43 .00 MATH Accountability2016 D0383 D0383 ‐ Manhattan‐Ogden District Aggregate ALL All Students 16.72 34.69 31.27 17.29 .00 MATH Accountability2016 D0384 D0384 ‐ Blue Valley District Aggregate ALL All Students 25.00 48.91 14.13 11.95 .00 MATH Accountability2016 D0385 D0385 ‐ Andover District Aggregate ALL All Students 9.91 31.14 36.01 22.92 .00 MATH Accountability2016 D0386 D0386 ‐ Madison‐Virgil District Aggregate ALL All Students 32.52 32.52 29.26 5.69 .00 MATH Accountability2016 D0387 D0387 ‐ Altoona‐Midway District Aggregate ALL All Students 44.08 35.48 16.12 4.30 .00 MATH Accountability2016 D0388 D0388 ‐ Ellis District Aggregate ALL All Students 16.58 42.92 30.73 9.75 .00 MATH Accountability2016 D0389 D0389 ‐ Eureka District Aggregate ALL All Students 16.87 55.93 23.12 4.06 .00 MATH Accountability2016 D0390 D0390 ‐ Hamilton District Aggregate ALL All Students 13.95 51.16 32.55 2.32 .00 MATH Accountability2016 D0392 D0392 ‐ Osborne County District Aggregate ALL All Students 22.37 30.76 30.06 16.78 .00 MATH Accountability2016 D0393 D0393 ‐ Solomon District Aggregate ALL All Students 34.50 36.61 23.23 5.63 .00 MATH Accountability2016 D0394 D0394 ‐ Rose Hill Public SchDistrict Aggregate ALL All Students 20.89 40.73 26.80 11.56 .00 MATH Accountability2016 D0395 D0395 ‐ LaCrosse District Aggregate ALL All Students 28.12 47.50 23.12 1.25 .00 MATH Accountability2016 D0396 D0396 ‐ Douglass Public SchDistrict Aggregate ALL All Students 28.61 43.71 24.84 2.83 .00 MATH Accountability2016 D0397 D0397 ‐ Centre District Aggregate ALL All Students 26.57 44.75 23.77 4.89 .00 MATH Accountability2016 D0398 D0398 ‐ Peabody‐Burns District Aggregate ALL All Students 46.42 35.71 13.39 4.46 .00 MATH Accountability2016 D0399 D0399 ‐ Paradise District Aggregate ALL All Students 30.00 42.00 26.00 2.00 .00 MATH Accountability2016 D0400 D0400 ‐ Smoky Valley District Aggregate ALL All Students 24.94 44.89 23.35 6.80 .00 MATH Accountability2016 D0401 D0401 ‐ Chase‐Raymond District Aggregate ALL All Students 51.85 35.80 9.87 2.46 .00 MATH Accountability2016 D0402 D0402 ‐ Augusta District Aggregate ALL All Students 25.84 43.21 24.02 6.91 .00 MATH Accountability2016 D0403 D0403 ‐ Otis‐Bison District Aggregate ALL All Students 21.73 42.39 25.00 10.86 .00 MATH Accountability2016 D0404 D0404 ‐ Riverton District Aggregate ALL All Students 37.81 46.19 14.21 1.77 .00 MATH Accountability2016 D0405 D0405 ‐ Lyons District Aggregate ALL All Students 23.77 41.86 24.54 9.81 .00 MATH Accountability2016 D0407 D0407 ‐ Russell County District Aggregate ALL All Students 27.11 46.97 21.06 4.84 .00 MATH Accountability2016 D0408 D0408 ‐ Marion‐Florence District Aggregate ALL All Students 17.52 38.64 28.68 15.13 .00 MATH Accountability2016 D0409 D0409 ‐ Atchison Public SchDistrict Aggregate ALL All Students 36.86 40.72 18.31 4.09 .00 MATH Accountability2016 D0410 D0410 ‐ Durham‐Hillsboro‐LDistrict Aggregate ALL All Students 19.32 36.94 32.20 11.52 .00 MATH Accountability2016 D0411 D0411 ‐ Goessel District Aggregate ALL All Students 12.92 40.81 32.65 13.60 .00 MATH Accountability2016 D0412 D0412 ‐ Hoxie Community SDistrict Aggregate ALL All Students 21.87 42.18 28.64 7.29 .00 MATH Accountability2016 D0413 D0413 ‐ Chanute Public Sch District Aggregate ALL All Students 22.08 40.37 26.28 11.25 .00 MATH Accountability2016 D0415 D0415 ‐ Hiawatha District Aggregate ALL All Students 21.34 34.60 30.33 13.70 .00 MATH Accountability2016 D0416 D0416 ‐ Louisburg District Aggregate ALL All Students 16.86 42.98 29.27 10.88 .00 MATH Accountability
Data from: http://ksreportcard.ksde.org/2015_2016_Assessment_Full_File.xlsx991373
2017ADEQ00074

program_y Org_No Organization Building_Number GradeNam GroupName PCLevel_One PCLevel_Two PCLevel_Three PCLevel_Four PCNotValid Subject Population2016 D0417 D0417 ‐ Morris County District Aggregate ALL All Students 20.00 40.84 27.32 11.83 .00 MATH Accountability2016 D0418 D0418 ‐ McPherson District Aggregate ALL All Students 28.85 44.38 21.40 5.35 .00 MATH Accountability2016 D0419 D0419 ‐ Canton‐Galva District Aggregate ALL All Students 20.00 49.26 23.41 7.31 .00 MATH Accountability2016 D0420 D0420 ‐ Osage City District Aggregate ALL All Students 22.15 37.31 32.06 8.45 .00 MATH Accountability2016 D0421 D0421 ‐ Lyndon District Aggregate ALL All Students 18.53 46.82 23.90 10.73 .00 MATH Accountability2016 D0422 D0422 ‐ Kiowa County District Aggregate ALL All Students 22.65 37.50 30.46 9.37 .00 MATH Accountability2016 D0423 D0423 ‐ Moundridge District Aggregate ALL All Students 18.18 39.20 31.25 11.36 .00 MATH Accountability2016 D0426 D0426 ‐ Pike Valley District Aggregate ALL All Students 11.21 57.00 28.03 3.73 .00 MATH Accountability2016 D0428 D0428 ‐ Great Bend District Aggregate ALL All Students 35.71 43.35 17.54 3.37 .00 MATH Accountability2016 D0429 D0429 ‐ Troy Public SchoolsDistrict Aggregate ALL All Students 35.32 39.52 20.35 4.79 .00 MATH Accountability2016 D0430 D0430 ‐ South Brown CountDistrict Aggregate ALL All Students 20.37 47.40 23.33 8.88 .00 MATH Accountability2016 D0431 D0431 ‐ Hoisington District Aggregate ALL All Students 22.34 36.17 33.24 8.24 .00 MATH Accountability2016 D0432 D0432 ‐ Victoria District Aggregate ALL All Students 17.72 43.03 34.17 5.06 .00 MATH Accountability2016 D0434 D0434 ‐ Santa Fe Trail District Aggregate ALL All Students 19.84 40.27 29.07 10.80 .00 MATH Accountability2016 D0435 D0435 ‐ Abilene District Aggregate ALL All Students 26.01 47.20 20.93 5.83 .00 MATH Accountability2016 D0436 D0436 ‐ Caney Valley District Aggregate ALL All Students 27.13 40.70 23.86 8.29 .00 MATH Accountability2016 D0437 D0437 ‐ Auburn Washburn District Aggregate ALL All Students 17.92 37.67 30.85 13.54 .00 MATH Accountability2016 D0438 D0438 ‐ Skyline Schools District Aggregate ALL All Students 22.59 45.67 25.48 6.25 .00 MATH Accountability2016 D0439 D0439 ‐ Sedgwick Public SchDistrict Aggregate ALL All Students 15.41 41.89 31.22 11.46 .00 MATH Accountability2016 D0440 D0440 ‐ Halstead District Aggregate ALL All Students 21.11 35.11 34.35 9.41 .00 MATH Accountability2016 D0443 D0443 ‐ Dodge City District Aggregate ALL All Students 38.45 41.08 15.94 4.50 .00 MATH Accountability2016 D0444 D0444 ‐ Little River District Aggregate ALL All Students 18.96 35.05 32.75 13.21 .00 MATH Accountability2016 D0445 D0445 ‐ Coffeyville District Aggregate ALL All Students 27.67 44.05 23.20 5.06 .00 MATH Accountability2016 D0446 D0446 ‐ Independence District Aggregate ALL All Students 22.31 40.73 26.31 10.63 .00 MATH Accountability2016 D0447 D0447 ‐ Cherryvale District Aggregate ALL All Students 25.75 48.02 21.80 4.40 .00 MATH Accountability2016 D0448 D0448 ‐ Inman District Aggregate ALL All Students 17.84 43.66 27.23 11.26 .00 MATH Accountability2016 D0449 D0449 ‐ Easton District Aggregate ALL All Students 23.14 41.54 22.84 12.46 .00 MATH Accountability2016 D0450 D0450 ‐ Shawnee Heights District Aggregate ALL All Students 21.25 42.17 28.33 8.23 .00 MATH Accountability2016 D0452 D0452 ‐ Stanton County District Aggregate ALL All Students 26.63 46.23 23.61 3.51 .00 MATH Accountability2016 D0453 D0453 ‐ Leavenworth District Aggregate ALL All Students 40.53 37.75 17.16 4.54 .00 MATH Accountability2016 D0454 D0454 ‐ Burlingame Public SDistrict Aggregate ALL All Students 20.60 38.78 29.69 10.90 .00 MATH Accountability2016 D0456 D0456 ‐ Marais Des Cygnes District Aggregate ALL All Students 23.58 39.62 25.47 11.32 .00 MATH Accountability2016 D0457 D0457 ‐ Garden City District Aggregate ALL All Students 40.71 42.39 14.37 2.51 .00 MATH Accountability2016 D0458 D0458 ‐ Basehor‐Linwood District Aggregate ALL All Students 22.86 41.44 25.57 10.11 .00 MATH Accountability2016 D0459 D0459 ‐ Bucklin District Aggregate ALL All Students 32.25 41.12 22.58 4.03 .00 MATH Accountability2016 D0460 D0460 ‐ Hesston District Aggregate ALL All Students 10.73 36.75 37.67 14.84 .00 MATH Accountability2016 D0461 D0461 ‐ Neodesha District Aggregate ALL All Students 24.58 44.41 21.78 9.21 .00 MATH Accountability2016 D0462 D0462 ‐ Central District Aggregate ALL All Students 28.96 41.37 25.51 4.13 .00 MATH Accountability2016 D0463 D0463 ‐ Udall District Aggregate ALL All Students 27.50 43.12 25.62 3.75 .00 MATH Accountability2016 D0464 D0464 ‐ Tonganoxie District Aggregate ALL All Students 25.36 42.27 23.03 9.32 .00 MATH Accountability2016 D0465 D0465 ‐ Winfield District Aggregate ALL All Students 22.91 42.61 24.71 9.75 .00 MATH Accountability2016 D0466 D0466 ‐ Scott County District Aggregate ALL All Students 22.37 42.57 28.31 6.73 .00 MATH Accountability2016 D0467 D0467 ‐ Leoti District Aggregate ALL All Students 17.91 47.26 26.86 7.96 .00 MATH Accountability2016 D0468 D0468 ‐ Healy Public Schoo District Aggregate ALL All Students 45.45 15.15 18.18 21.21 .00 MATH Accountability2016 D0469 D0469 ‐ Lansing District Aggregate ALL All Students 20.93 45.53 25.20 8.32 .00 MATH Accountability2016 D0470 D0470 ‐ Arkansas City District Aggregate ALL All Students 27.72 43.12 22.19 6.95 .00 MATH Accountability2016 D0471 D0471 ‐ Dexter District Aggregate ALL All Students 28.20 47.43 21.79 2.56 .00 MATH Accountability2016 D0473 D0473 ‐ Chapman District Aggregate ALL All Students 23.72 45.38 22.41 8.47 .00 MATH Accountability2016 D0474 D0474 ‐ Haviland District Aggregate ALL All Students 15.00 27.50 30.00 27.50 .00 MATH Accountability2016 D0475 D0475 ‐ Geary County Scho District Aggregate ALL All Students 30.00 40.29 22.99 6.69 .00 MATH Accountability2016 D0476 D0476 ‐ Copeland District Aggregate ALL All Students 15.29 42.35 31.76 10.58 .00 MATH Accountability
Data from: http://ksreportcard.ksde.org/2015_2016_Assessment_Full_File.xlsx991373
2017ADEQ00075

program_y Org_No Organization Building_Number GradeNam GroupName PCLevel_One PCLevel_Two PCLevel_Three PCLevel_Four PCNotValid Subject Population2016 D0477 D0477 ‐ Ingalls District Aggregate ALL All Students 20.17 38.59 27.19 14.03 .00 MATH Accountability2016 D0479 D0479 ‐ Crest District Aggregate ALL All Students 41.74 37.86 16.50 3.88 .00 MATH Accountability2016 D0480 D0480 ‐ Liberal District Aggregate ALL All Students 42.40 40.17 14.38 3.03 .00 MATH Accountability2016 D0481 D0481 ‐ Rural Vista District Aggregate ALL All Students 22.83 47.24 25.19 4.72 .00 MATH Accountability2016 D0482 D0482 ‐ Dighton District Aggregate ALL All Students 13.93 40.16 29.50 16.39 .00 MATH Accountability2016 D0483 D0483 ‐ Kismet‐Plains District Aggregate ALL All Students 27.17 47.01 22.82 2.98 .00 MATH Accountability2016 D0484 D0484 ‐ Fredonia District Aggregate ALL All Students 31.83 47.14 18.01 3.00 .00 MATH Accountability2016 D0487 D0487 ‐ Herington District Aggregate ALL All Students 22.72 47.27 25.00 5.00 .00 MATH Accountability2016 D0489 D0489 ‐ Hays District Aggregate ALL All Students 21.37 38.00 29.14 11.47 .00 MATH Accountability2016 D0490 D0490 ‐ El Dorado District Aggregate ALL All Students 28.60 41.68 22.39 7.31 .00 MATH Accountability2016 D0491 D0491 ‐ Eudora District Aggregate ALL All Students 22.59 43.80 26.88 6.72 .00 MATH Accountability2016 D0492 D0492 ‐ Flinthills District Aggregate ALL All Students 23.74 42.44 24.46 9.35 .00 MATH Accountability2016 D0493 D0493 ‐ Columbus District Aggregate ALL All Students 30.99 49.04 17.19 2.76 .00 MATH Accountability2016 D0494 D0494 ‐ Syracuse District Aggregate ALL All Students 46.31 38.52 13.93 1.22 .00 MATH Accountability2016 D0495 D0495 ‐ Ft Larned District Aggregate ALL All Students 33.56 45.57 18.14 2.72 .00 MATH Accountability2016 D0496 D0496 ‐ Pawnee Heights District Aggregate ALL All Students 16.92 41.53 27.69 13.84 .00 MATH Accountability2016 D0497 D0497 ‐ Lawrence District Aggregate ALL All Students 22.89 34.81 27.41 14.87 .00 MATH Accountability2016 D0498 D0498 ‐ Valley Heights District Aggregate ALL All Students 19.23 36.05 32.69 12.01 .00 MATH Accountability2016 D0499 D0499 ‐ Galena District Aggregate ALL All Students 28.03 47.64 20.34 3.97 .00 MATH Accountability2016 D0500 D0500 ‐ Kansas City District Aggregate ALL All Students 50.56 37.06 10.82 1.54 .00 MATH Accountability2016 D0501 D0501 ‐ Topeka Public SchoDistrict Aggregate ALL All Students 43.95 37.13 14.89 4.00 .01 MATH Accountability2016 D0502 D0502 ‐ Lewis District Aggregate ALL All Students 26.47 41.17 26.47 5.88 .00 MATH Accountability2016 D0503 D0503 ‐ Parsons District Aggregate ALL All Students 23.11 41.70 24.95 10.21 .00 MATH Accountability2016 D0504 D0504 ‐ Oswego District Aggregate ALL All Students 17.88 42.66 28.44 11.00 .00 MATH Accountability2016 D0505 D0505 ‐ Chetopa‐St. Paul District Aggregate ALL All Students 38.91 46.60 12.21 2.26 .00 MATH Accountability2016 D0506 D0506 ‐ Labette County District Aggregate ALL All Students 17.21 42.60 31.50 8.67 .00 MATH Accountability2016 D0507 D0507 ‐ Satanta District Aggregate ALL All Students 30.37 48.73 18.35 2.53 .00 MATH Accountability2016 D0508 D0508 ‐ Baxter Springs District Aggregate ALL All Students 37.71 40.76 16.95 4.57 .00 MATH Accountability2016 D0509 D0509 ‐ South Haven District Aggregate ALL All Students 36.04 39.53 22.09 2.32 .00 MATH Accountability2016 D0511 D0511 ‐ Attica District Aggregate ALL All Students 26.82 45.12 21.95 6.09 .00 MATH Accountability2016 D0512 D0512 ‐ Shawnee Mission PDistrict Aggregate ALL All Students 19.36 37.07 28.73 14.82 .00 MATH Accountability2016 S0604 S0604 ‐ School for Blind District Aggregate ALL All Students 76.92 23.07 .00 .00 .00 MATH Accountability2016 S0610 S0610 ‐ School for Deaf District Aggregate ALL All Students 88.63 9.09 2.27 .00 .00 MATH Accountability2016 0 State of Kansas District Aggregate ALL All Students 26.33 39.21 24.61 9.83 .00 MATH Accountability2016 Z0006 Z0006 ‐ Brookridge Day Sch District Aggregate ALL All Students .00 10.52 36.84 52.63 .00 MATH Accountability2016 Z0009 Z0009 ‐ Independence BibleDistrict Aggregate ALL All Students 31.11 51.11 15.55 2.22 .00 MATH Accountability2016 Z0026 Z0026 ‐ Lutheran Schools (TDistrict Aggregate ALL All Students 12.40 40.64 35.49 11.45 .00 MATH Accountability2016 Z0028 Z0028 ‐ Dodge City CatholicDistrict Aggregate ALL All Students 11.21 35.08 34.12 19.57 .00 MATH Accountability2016 Z0029 Z0029 ‐ Kansas City CatholicDistrict Aggregate ALL All Students 9.08 32.44 37.98 20.47 .01 MATH Accountability2016 Z0030 Z0030 ‐ Salina Catholic DiocDistrict Aggregate ALL All Students 12.32 41.98 34.65 10.94 .08 MATH Accountability2016 Z0031 Z0031 ‐ Wichita Catholic DioDistrict Aggregate ALL All Students 8.02 36.85 36.89 18.21 .00 MATH Accountability2016 Z0032 Z0032 ‐ Lakemary Center PaDistrict Aggregate ALL All Students 57.89 36.84 5.26 .00 .00 MATH Accountability2016 Z0058 Z0058 ‐ Kickapoo Nation SchDistrict Aggregate ALL All Students 77.27 18.18 4.54 .00 .00 MATH Accountability2016 Z0060 Z0060 ‐ Accelerated SchoolsDistrict Aggregate ALL All Students 56.00 32.00 8.00 4.00 .00 MATH Accountability2016 Z0064 Z0064 ‐ Annoor Islamic SchoDistrict Aggregate ALL All Students 4.34 31.52 41.30 22.82 .00 MATH Accountability2016 Z0066 Z0066 ‐ Word of Life Traditi District Aggregate ALL All Students 33.33 45.45 12.12 9.09 .00 MATH Accountability2016 Z0067 Z0067 ‐ Wellington ChristianDistrict Aggregate ALL All Students .00 10.52 47.36 42.10 .00 MATH Accountability2016 Z0069 Z0069 ‐ Countryside ChristiaDistrict Aggregate ALL All Students 9.09 9.09 36.36 45.45 .00 MATH Accountability
Data from: http://ksreportcard.ksde.org/2015_2016_Assessment_Full_File.xlsx991373
2017ADEQ00076
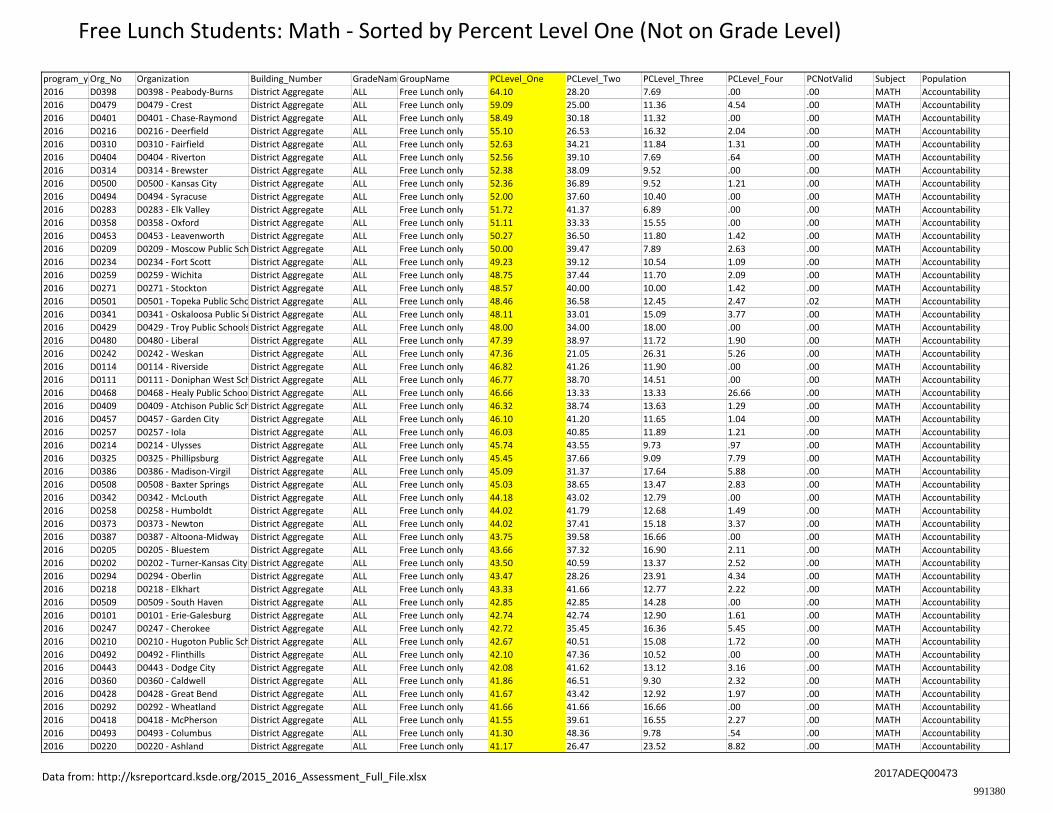
program_y Org_No Organization Building_Number GradeNam GroupName PCLevel_One PCLevel_Two PCLevel_Three PCLevel_Four PCNotValid Subject Population2016 D0398 D0398 ‐ Peabody‐Burns District Aggregate ALL Free Lunch only 64.10 28.20 7.69 .00 .00 MATH Accountability2016 D0479 D0479 ‐ Crest District Aggregate ALL Free Lunch only 59.09 25.00 11.36 4.54 .00 MATH Accountability2016 D0401 D0401 ‐ Chase‐Raymond District Aggregate ALL Free Lunch only 58.49 30.18 11.32 .00 .00 MATH Accountability2016 D0216 D0216 ‐ Deerfield District Aggregate ALL Free Lunch only 55.10 26.53 16.32 2.04 .00 MATH Accountability2016 D0310 D0310 ‐ Fairfield District Aggregate ALL Free Lunch only 52.63 34.21 11.84 1.31 .00 MATH Accountability2016 D0404 D0404 ‐ Riverton District Aggregate ALL Free Lunch only 52.56 39.10 7.69 .64 .00 MATH Accountability2016 D0314 D0314 ‐ Brewster District Aggregate ALL Free Lunch only 52.38 38.09 9.52 .00 .00 MATH Accountability2016 D0500 D0500 ‐ Kansas City District Aggregate ALL Free Lunch only 52.36 36.89 9.52 1.21 .00 MATH Accountability2016 D0494 D0494 ‐ Syracuse District Aggregate ALL Free Lunch only 52.00 37.60 10.40 .00 .00 MATH Accountability2016 D0283 D0283 ‐ Elk Valley District Aggregate ALL Free Lunch only 51.72 41.37 6.89 .00 .00 MATH Accountability2016 D0358 D0358 ‐ Oxford District Aggregate ALL Free Lunch only 51.11 33.33 15.55 .00 .00 MATH Accountability2016 D0453 D0453 ‐ Leavenworth District Aggregate ALL Free Lunch only 50.27 36.50 11.80 1.42 .00 MATH Accountability2016 D0209 D0209 ‐ Moscow Public Sch District Aggregate ALL Free Lunch only 50.00 39.47 7.89 2.63 .00 MATH Accountability2016 D0234 D0234 ‐ Fort Scott District Aggregate ALL Free Lunch only 49.23 39.12 10.54 1.09 .00 MATH Accountability2016 D0259 D0259 ‐ Wichita District Aggregate ALL Free Lunch only 48.75 37.44 11.70 2.09 .00 MATH Accountability2016 D0271 D0271 ‐ Stockton District Aggregate ALL Free Lunch only 48.57 40.00 10.00 1.42 .00 MATH Accountability2016 D0501 D0501 ‐ Topeka Public SchoDistrict Aggregate ALL Free Lunch only 48.46 36.58 12.45 2.47 .02 MATH Accountability2016 D0341 D0341 ‐ Oskaloosa Public ScDistrict Aggregate ALL Free Lunch only 48.11 33.01 15.09 3.77 .00 MATH Accountability2016 D0429 D0429 ‐ Troy Public SchoolsDistrict Aggregate ALL Free Lunch only 48.00 34.00 18.00 .00 .00 MATH Accountability2016 D0480 D0480 ‐ Liberal District Aggregate ALL Free Lunch only 47.39 38.97 11.72 1.90 .00 MATH Accountability2016 D0242 D0242 ‐ Weskan District Aggregate ALL Free Lunch only 47.36 21.05 26.31 5.26 .00 MATH Accountability2016 D0114 D0114 ‐ Riverside District Aggregate ALL Free Lunch only 46.82 41.26 11.90 .00 .00 MATH Accountability2016 D0111 D0111 ‐ Doniphan West SchDistrict Aggregate ALL Free Lunch only 46.77 38.70 14.51 .00 .00 MATH Accountability2016 D0468 D0468 ‐ Healy Public Schoo District Aggregate ALL Free Lunch only 46.66 13.33 13.33 26.66 .00 MATH Accountability2016 D0409 D0409 ‐ Atchison Public SchDistrict Aggregate ALL Free Lunch only 46.32 38.74 13.63 1.29 .00 MATH Accountability2016 D0457 D0457 ‐ Garden City District Aggregate ALL Free Lunch only 46.10 41.20 11.65 1.04 .00 MATH Accountability2016 D0257 D0257 ‐ Iola District Aggregate ALL Free Lunch only 46.03 40.85 11.89 1.21 .00 MATH Accountability2016 D0214 D0214 ‐ Ulysses District Aggregate ALL Free Lunch only 45.74 43.55 9.73 .97 .00 MATH Accountability2016 D0325 D0325 ‐ Phillipsburg District Aggregate ALL Free Lunch only 45.45 37.66 9.09 7.79 .00 MATH Accountability2016 D0386 D0386 ‐ Madison‐Virgil District Aggregate ALL Free Lunch only 45.09 31.37 17.64 5.88 .00 MATH Accountability2016 D0508 D0508 ‐ Baxter Springs District Aggregate ALL Free Lunch only 45.03 38.65 13.47 2.83 .00 MATH Accountability2016 D0342 D0342 ‐ McLouth District Aggregate ALL Free Lunch only 44.18 43.02 12.79 .00 .00 MATH Accountability2016 D0258 D0258 ‐ Humboldt District Aggregate ALL Free Lunch only 44.02 41.79 12.68 1.49 .00 MATH Accountability2016 D0373 D0373 ‐ Newton District Aggregate ALL Free Lunch only 44.02 37.41 15.18 3.37 .00 MATH Accountability2016 D0387 D0387 ‐ Altoona‐Midway District Aggregate ALL Free Lunch only 43.75 39.58 16.66 .00 .00 MATH Accountability2016 D0205 D0205 ‐ Bluestem District Aggregate ALL Free Lunch only 43.66 37.32 16.90 2.11 .00 MATH Accountability2016 D0202 D0202 ‐ Turner‐Kansas City District Aggregate ALL Free Lunch only 43.50 40.59 13.37 2.52 .00 MATH Accountability2016 D0294 D0294 ‐ Oberlin District Aggregate ALL Free Lunch only 43.47 28.26 23.91 4.34 .00 MATH Accountability2016 D0218 D0218 ‐ Elkhart District Aggregate ALL Free Lunch only 43.33 41.66 12.77 2.22 .00 MATH Accountability2016 D0509 D0509 ‐ South Haven District Aggregate ALL Free Lunch only 42.85 42.85 14.28 .00 .00 MATH Accountability2016 D0101 D0101 ‐ Erie‐Galesburg District Aggregate ALL Free Lunch only 42.74 42.74 12.90 1.61 .00 MATH Accountability2016 D0247 D0247 ‐ Cherokee District Aggregate ALL Free Lunch only 42.72 35.45 16.36 5.45 .00 MATH Accountability2016 D0210 D0210 ‐ Hugoton Public SchDistrict Aggregate ALL Free Lunch only 42.67 40.51 15.08 1.72 .00 MATH Accountability2016 D0492 D0492 ‐ Flinthills District Aggregate ALL Free Lunch only 42.10 47.36 10.52 .00 .00 MATH Accountability2016 D0443 D0443 ‐ Dodge City District Aggregate ALL Free Lunch only 42.08 41.62 13.12 3.16 .00 MATH Accountability2016 D0360 D0360 ‐ Caldwell District Aggregate ALL Free Lunch only 41.86 46.51 9.30 2.32 .00 MATH Accountability2016 D0428 D0428 ‐ Great Bend District Aggregate ALL Free Lunch only 41.67 43.42 12.92 1.97 .00 MATH Accountability2016 D0292 D0292 ‐ Wheatland District Aggregate ALL Free Lunch only 41.66 41.66 16.66 .00 .00 MATH Accountability2016 D0418 D0418 ‐ McPherson District Aggregate ALL Free Lunch only 41.55 39.61 16.55 2.27 .00 MATH Accountability2016 D0493 D0493 ‐ Columbus District Aggregate ALL Free Lunch only 41.30 48.36 9.78 .54 .00 MATH Accountability2016 D0220 D0220 ‐ Ashland District Aggregate ALL Free Lunch only 41.17 26.47 23.52 8.82 .00 MATH Accountability
Data from: http://ksreportcard.ksde.org/2015_2016_Assessment_Full_File.xlsx
Free Lunch Students: Math - Sorted by Percent Level One (Not on Grade Level)
991380
2017ADEQ00473

program_y Org_No Organization Building_Number GradeNam GroupName PCLevel_One PCLevel_Two PCLevel_Three PCLevel_Four PCNotValid Subject Population2016 D0284 D0284 ‐ Chase County District Aggregate ALL Free Lunch only 40.74 46.29 12.96 .00 .00 MATH Accountability2016 D0357 D0357 ‐ Belle Plaine District Aggregate ALL Free Lunch only 40.74 40.74 12.96 5.55 .00 MATH Accountability2016 D0362 D0362 ‐ Prairie View District Aggregate ALL Free Lunch only 40.36 45.18 13.85 .60 .00 MATH Accountability2016 D0297 D0297 ‐ St Francis Comm ScDistrict Aggregate ALL Free Lunch only 40.00 45.00 10.00 5.00 .00 MATH Accountability2016 D0377 D0377 ‐ Atchison Co Comm District Aggregate ALL Free Lunch only 40.00 43.47 11.30 5.21 .00 MATH Accountability2016 D0393 D0393 ‐ Solomon District Aggregate ALL Free Lunch only 40.00 40.00 17.77 2.22 .00 MATH Accountability2016 D0511 D0511 ‐ Attica District Aggregate ALL Free Lunch only 40.00 46.66 13.33 .00 .00 MATH Accountability2016 D0315 D0315 ‐ Colby Public SchoolDistrict Aggregate ALL Free Lunch only 39.84 43.75 14.06 2.34 .00 MATH Accountability2016 0 State of Kansas District Aggregate ALL Free Lunch only 39.82 41.46 15.46 3.24 .00 MATH Accountability2016 D0395 D0395 ‐ LaCrosse District Aggregate ALL Free Lunch only 39.68 46.03 14.28 .00 .00 MATH Accountability2016 D0333 D0333 ‐ Concordia District Aggregate ALL Free Lunch only 39.65 48.85 9.19 2.29 .00 MATH Accountability2016 D0475 D0475 ‐ Geary County Scho District Aggregate ALL Free Lunch only 39.61 39.69 17.31 3.37 .00 MATH Accountability2016 D0300 D0300 ‐ Comanche County District Aggregate ALL Free Lunch only 39.47 26.31 23.68 10.52 .00 MATH Accountability2016 D0484 D0484 ‐ Fredonia District Aggregate ALL Free Lunch only 39.39 46.96 12.87 .75 .00 MATH Accountability2016 D0505 D0505 ‐ Chetopa‐St. Paul District Aggregate ALL Free Lunch only 39.39 52.52 6.06 2.02 .00 MATH Accountability2016 D0351 D0351 ‐ Macksville District Aggregate ALL Free Lunch only 39.21 41.17 15.68 3.92 .00 MATH Accountability2016 D0108 D0108 ‐ Washington Co. SchDistrict Aggregate ALL Free Lunch only 39.06 50.00 7.81 3.12 .00 MATH Accountability2016 D0308 D0308 ‐ Hutchinson Public SDistrict Aggregate ALL Free Lunch only 38.78 41.11 17.40 2.70 .00 MATH Accountability2016 D0306 D0306 ‐ Southeast Of SalineDistrict Aggregate ALL Free Lunch only 38.77 40.81 18.36 2.04 .00 MATH Accountability2016 D0400 D0400 ‐ Smoky Valley District Aggregate ALL Free Lunch only 38.73 43.24 16.21 1.80 .00 MATH Accountability2016 D0288 D0288 ‐ Central Heights District Aggregate ALL Free Lunch only 38.58 33.07 23.62 4.72 .00 MATH Accountability2016 D0246 D0246 ‐ Northeast District Aggregate ALL Free Lunch only 38.40 49.27 9.42 2.89 .00 MATH Accountability2016 D0469 D0469 ‐ Lansing District Aggregate ALL Free Lunch only 38.31 41.76 16.85 3.06 .00 MATH Accountability2016 D0290 D0290 ‐ Ottawa District Aggregate ALL Free Lunch only 38.20 44.48 15.44 1.86 .00 MATH Accountability2016 D0495 D0495 ‐ Ft Larned District Aggregate ALL Free Lunch only 38.20 50.00 10.67 1.12 .00 MATH Accountability2016 D0320 D0320 ‐ Wamego District Aggregate ALL Free Lunch only 38.09 47.61 12.92 1.36 .00 MATH Accountability2016 D0384 D0384 ‐ Blue Valley District Aggregate ALL Free Lunch only 38.09 47.61 9.52 4.76 .00 MATH Accountability2016 D0226 D0226 ‐ Meade District Aggregate ALL Free Lunch only 38.00 40.00 14.00 8.00 .00 MATH Accountability2016 D0208 D0208 ‐ Wakeeney District Aggregate ALL Free Lunch only 37.93 39.65 15.51 6.89 .00 MATH Accountability2016 D0293 D0293 ‐ Quinter Public SchoDistrict Aggregate ALL Free Lunch only 37.93 37.93 20.68 3.44 .00 MATH Accountability2016 D0367 D0367 ‐ Osawatomie District Aggregate ALL Free Lunch only 37.89 45.61 12.98 3.50 .00 MATH Accountability2016 D0497 D0497 ‐ Lawrence District Aggregate ALL Free Lunch only 37.82 40.84 16.16 5.16 .00 MATH Accountability2016 D0464 D0464 ‐ Tonganoxie District Aggregate ALL Free Lunch only 37.81 45.37 12.60 4.20 .00 MATH Accountability2016 D0490 D0490 ‐ El Dorado District Aggregate ALL Free Lunch only 37.75 43.25 16.00 3.00 .00 MATH Accountability2016 D0233 D0233 ‐ Olathe District Aggregate ALL Free Lunch only 37.61 43.42 15.83 3.12 .00 MATH Accountability2016 D0502 D0502 ‐ Lewis District Aggregate ALL Free Lunch only 37.50 18.75 37.50 6.25 .00 MATH Accountability2016 D0281 D0281 ‐ Graham County District Aggregate ALL Free Lunch only 37.25 41.17 17.64 3.92 .00 MATH Accountability2016 D0331 D0331 ‐ Kingman ‐ Norwich District Aggregate ALL Free Lunch only 37.08 43.70 13.24 5.96 .00 MATH Accountability2016 D0491 D0491 ‐ Eudora District Aggregate ALL Free Lunch only 36.59 42.55 17.87 2.97 .00 MATH Accountability2016 D0477 D0477 ‐ Ingalls District Aggregate ALL Free Lunch only 36.58 31.70 21.95 9.75 .00 MATH Accountability2016 D0436 D0436 ‐ Caney Valley District Aggregate ALL Free Lunch only 36.30 40.47 20.23 2.97 .00 MATH Accountability2016 D0334 D0334 ‐ Southern Cloud District Aggregate ALL Free Lunch only 36.17 44.68 17.02 2.12 .00 MATH Accountability2016 D0382 D0382 ‐ Pratt District Aggregate ALL Free Lunch only 36.05 45.67 15.38 2.88 .00 MATH Accountability2016 D0462 D0462 ‐ Central District Aggregate ALL Free Lunch only 35.71 40.00 21.42 2.85 .00 MATH Accountability2016 D0305 D0305 ‐ Salina District Aggregate ALL Free Lunch only 35.70 43.42 17.51 3.35 .00 MATH Accountability2016 D0337 D0337 ‐ Royal Valley District Aggregate ALL Free Lunch only 35.46 43.60 13.37 7.55 .00 MATH Accountability2016 D0230 D0230 ‐ Spring Hill District Aggregate ALL Free Lunch only 35.44 38.32 20.46 5.76 .00 MATH Accountability2016 D0223 D0223 ‐ Barnes District Aggregate ALL Free Lunch only 35.29 33.33 27.45 3.92 .00 MATH Accountability2016 D0250 D0250 ‐ Pittsburg District Aggregate ALL Free Lunch only 35.29 40.80 19.27 4.63 .00 MATH Accountability2016 D0224 D0224 ‐ Clifton‐Clyde District Aggregate ALL Free Lunch only 35.13 45.94 16.21 2.70 .00 MATH Accountability2016 D0286 D0286 ‐ Chautauqua Co ComDistrict Aggregate ALL Free Lunch only 34.78 47.82 16.30 1.08 .00 MATH Accountability
Data from: http://ksreportcard.ksde.org/2015_2016_Assessment_Full_File.xlsx991380
2017ADEQ00474

program_y Org_No Organization Building_Number GradeNam GroupName PCLevel_One PCLevel_Two PCLevel_Three PCLevel_Four PCNotValid Subject Population2016 D0396 D0396 ‐ Douglass Public SchDistrict Aggregate ALL Free Lunch only 34.69 44.89 20.40 .00 .00 MATH Accountability2016 D0421 D0421 ‐ Lyndon District Aggregate ALL Free Lunch only 34.69 42.85 22.44 .00 .00 MATH Accountability2016 D0512 D0512 ‐ Shawnee Mission PDistrict Aggregate ALL Free Lunch only 34.64 43.97 17.37 4.00 .00 MATH Accountability2016 D0364 D0364 ‐ Marysville District Aggregate ALL Free Lunch only 34.61 40.38 23.07 1.92 .00 MATH Accountability2016 D0110 D0110 ‐ Thunder Ridge SchoDistrict Aggregate ALL Free Lunch only 34.54 43.63 14.54 7.27 .00 MATH Accountability2016 D0248 D0248 ‐ Girard District Aggregate ALL Free Lunch only 34.54 45.00 15.90 4.54 .00 MATH Accountability2016 D0403 D0403 ‐ Otis‐Bison District Aggregate ALL Free Lunch only 34.48 34.48 20.68 10.34 .00 MATH Accountability2016 D0274 D0274 ‐ Oakley District Aggregate ALL Free Lunch only 34.37 40.62 21.87 3.12 .00 MATH Accountability2016 D0356 D0356 ‐ Conway Springs District Aggregate ALL Free Lunch only 34.37 43.75 18.75 3.12 .00 MATH Accountability2016 D0458 D0458 ‐ Basehor‐Linwood District Aggregate ALL Free Lunch only 34.37 51.87 9.37 4.37 .00 MATH Accountability2016 D0461 D0461 ‐ Neodesha District Aggregate ALL Free Lunch only 34.35 44.78 17.79 3.06 .00 MATH Accountability2016 D0330 D0330 ‐ Mission Valley District Aggregate ALL Free Lunch only 34.32 53.73 11.94 .00 .00 MATH Accountability2016 D0452 D0452 ‐ Stanton County District Aggregate ALL Free Lunch only 34.31 45.09 16.66 3.92 .00 MATH Accountability2016 D0489 D0489 ‐ Hays District Aggregate ALL Free Lunch only 34.08 43.04 18.38 4.48 .00 MATH Accountability2016 D0420 D0420 ‐ Osage City District Aggregate ALL Free Lunch only 34.07 38.51 25.18 2.22 .00 MATH Accountability2016 D0200 D0200 ‐ Greeley County SchDistrict Aggregate ALL Free Lunch only 34.00 54.00 10.00 2.00 .00 MATH Accountability2016 D0407 D0407 ‐ Russell County District Aggregate ALL Free Lunch only 34.00 47.33 17.33 1.33 .00 MATH Accountability2016 D0260 D0260 ‐ Derby District Aggregate ALL Free Lunch only 33.44 42.55 18.55 5.45 .00 MATH Accountability2016 D0253 D0253 ‐ Emporia District Aggregate ALL Free Lunch only 33.39 45.25 17.33 4.01 .00 MATH Accountability2016 D0225 D0225 ‐ Fowler District Aggregate ALL Free Lunch only 33.33 51.51 12.12 3.03 .00 MATH Accountability2016 D0291 D0291 ‐ Grinnell Public SchoDistrict Aggregate ALL Free Lunch only 33.33 50.00 16.66 .00 .00 MATH Accountability2016 D0303 D0303 ‐ Ness City District Aggregate ALL Free Lunch only 33.33 39.58 22.91 4.16 .00 MATH Accountability2016 D0388 D0388 ‐ Ellis District Aggregate ALL Free Lunch only 33.33 40.47 19.04 7.14 .00 MATH Accountability2016 D0392 D0392 ‐ Osborne County District Aggregate ALL Free Lunch only 33.33 31.25 27.08 8.33 .00 MATH Accountability2016 D0499 D0499 ‐ Galena District Aggregate ALL Free Lunch only 33.33 48.44 16.88 1.33 .00 MATH Accountability2016 D0470 D0470 ‐ Arkansas City District Aggregate ALL Free Lunch only 33.28 45.58 16.71 4.41 .00 MATH Accountability2016 D0204 D0204 ‐ Bonner Springs District Aggregate ALL Free Lunch only 33.26 45.31 17.59 3.82 .00 MATH Accountability2016 D0483 D0483 ‐ Kismet‐Plains District Aggregate ALL Free Lunch only 33.19 49.57 16.38 .84 .00 MATH Accountability2016 D0363 D0363 ‐ Holcomb District Aggregate ALL Free Lunch only 33.18 42.24 19.39 5.17 .00 MATH Accountability2016 D0437 D0437 ‐ Auburn Washburn District Aggregate ALL Free Lunch only 33.15 43.97 18.63 4.24 .00 MATH Accountability2016 D0256 D0256 ‐ Marmaton Valley District Aggregate ALL Free Lunch only 32.83 53.73 11.94 1.49 .00 MATH Accountability2016 D0307 D0307 ‐ Ell‐Saline District Aggregate ALL Free Lunch only 32.75 51.72 15.51 .00 .00 MATH Accountability2016 D0449 D0449 ‐ Easton District Aggregate ALL Free Lunch only 32.55 43.02 17.44 6.97 .00 MATH Accountability2016 D0507 D0507 ‐ Satanta District Aggregate ALL Free Lunch only 32.55 51.16 13.95 2.32 .00 MATH Accountability2016 D0353 D0353 ‐ Wellington District Aggregate ALL Free Lunch only 32.26 43.76 20.12 3.83 .00 MATH Accountability2016 D0338 D0338 ‐ Valley Falls District Aggregate ALL Free Lunch only 32.20 47.45 18.64 1.69 .00 MATH Accountability2016 D0374 D0374 ‐ Sublette District Aggregate ALL Free Lunch only 32.17 45.21 20.00 2.60 .00 MATH Accountability2016 D0432 D0432 ‐ Victoria District Aggregate ALL Free Lunch only 32.14 46.42 21.42 .00 .00 MATH Accountability2016 D0471 D0471 ‐ Dexter District Aggregate ALL Free Lunch only 32.14 57.14 7.14 3.57 .00 MATH Accountability2016 D0435 D0435 ‐ Abilene District Aggregate ALL Free Lunch only 32.04 47.18 16.19 4.57 .00 MATH Accountability2016 D0264 D0264 ‐ Clearwater District Aggregate ALL Free Lunch only 31.91 46.09 19.85 2.12 .00 MATH Accountability2016 D0402 D0402 ‐ Augusta District Aggregate ALL Free Lunch only 31.85 45.16 19.58 3.39 .00 MATH Accountability2016 D0459 D0459 ‐ Bucklin District Aggregate ALL Free Lunch only 31.81 50.00 18.18 .00 .00 MATH Accountability2016 D0262 D0262 ‐ Valley Center Pub SDistrict Aggregate ALL Free Lunch only 31.69 43.52 20.31 4.46 .00 MATH Accountability2016 D0336 D0336 ‐ Holton District Aggregate ALL Free Lunch only 31.69 41.53 20.76 6.01 .00 MATH Accountability2016 D0287 D0287 ‐ West Franklin District Aggregate ALL Free Lunch only 31.37 46.07 18.62 3.92 .00 MATH Accountability2016 D0345 D0345 ‐ Seaman District Aggregate ALL Free Lunch only 31.29 42.48 22.02 4.19 .00 MATH Accountability2016 D0352 D0352 ‐ Goodland District Aggregate ALL Free Lunch only 31.21 41.04 18.49 9.24 .00 MATH Accountability2016 D0106 D0106 ‐ Western Plains District Aggregate ALL Free Lunch only 31.03 58.62 10.34 .00 .00 MATH Accountability2016 D0254 D0254 ‐ Barber County NortDistrict Aggregate ALL Free Lunch only 31.03 37.93 25.86 5.17 .00 MATH Accountability2016 D0261 D0261 ‐ Haysville District Aggregate ALL Free Lunch only 30.98 42.69 19.10 7.22 .00 MATH Accountability
Data from: http://ksreportcard.ksde.org/2015_2016_Assessment_Full_File.xlsx991380
2017ADEQ00475

program_y Org_No Organization Building_Number GradeNam GroupName PCLevel_One PCLevel_Two PCLevel_Three PCLevel_Four PCNotValid Subject Population2016 D0445 D0445 ‐ Coffeyville District Aggregate ALL Free Lunch only 30.84 47.31 18.71 3.11 .00 MATH Accountability2016 D0289 D0289 ‐ Wellsville District Aggregate ALL Free Lunch only 30.69 50.49 13.86 4.95 .00 MATH Accountability2016 D0394 D0394 ‐ Rose Hill Public SchDistrict Aggregate ALL Free Lunch only 30.67 39.26 20.85 9.20 .00 MATH Accountability2016 D0422 D0422 ‐ Kiowa County District Aggregate ALL Free Lunch only 30.55 55.55 13.88 .00 .00 MATH Accountability2016 D0444 D0444 ‐ Little River District Aggregate ALL Free Lunch only 30.55 47.22 16.66 5.55 .00 MATH Accountability2016 D0440 D0440 ‐ Halstead District Aggregate ALL Free Lunch only 30.50 38.98 24.57 5.93 .00 MATH Accountability2016 D0450 D0450 ‐ Shawnee Heights District Aggregate ALL Free Lunch only 30.49 47.12 18.61 3.76 .00 MATH Accountability2016 D0343 D0343 ‐ Perry Public School District Aggregate ALL Free Lunch only 30.47 48.57 18.09 2.85 .00 MATH Accountability2016 D0217 D0217 ‐ Rolla District Aggregate ALL Free Lunch only 30.43 43.47 21.73 4.34 .00 MATH Accountability2016 D0399 D0399 ‐ Paradise District Aggregate ALL Free Lunch only 30.43 39.13 26.08 4.34 .00 MATH Accountability2016 D0473 D0473 ‐ Chapman District Aggregate ALL Free Lunch only 30.39 44.60 16.66 8.33 .00 MATH Accountability2016 D0419 D0419 ‐ Canton‐Galva District Aggregate ALL Free Lunch only 30.30 45.45 21.21 3.03 .00 MATH Accountability2016 D0115 D0115 ‐ Nemaha Central District Aggregate ALL Free Lunch only 30.23 51.16 13.95 4.65 .00 MATH Accountability2016 D0379 D0379 ‐ Clay Center District Aggregate ALL Free Lunch only 30.19 49.00 15.84 4.95 .00 MATH Accountability2016 D0383 D0383 ‐ Manhattan‐Ogden District Aggregate ALL Free Lunch only 30.19 41.43 22.02 6.35 .00 MATH Accountability2016 D0211 D0211 ‐ Norton CommunityDistrict Aggregate ALL Free Lunch only 30.18 41.50 22.64 5.66 .00 MATH Accountability2016 D0339 D0339 ‐ Jefferson County N District Aggregate ALL Free Lunch only 30.18 43.39 18.86 7.54 .00 MATH Accountability2016 D0447 D0447 ‐ Cherryvale District Aggregate ALL Free Lunch only 30.13 50.21 16.15 3.49 .00 MATH Accountability2016 D0326 D0326 ‐ Logan District Aggregate ALL Free Lunch only 30.00 60.00 10.00 .00 .00 MATH Accountability2016 D0348 D0348 ‐ Baldwin City District Aggregate ALL Free Lunch only 29.94 47.05 17.64 5.34 .00 MATH Accountability2016 D0415 D0415 ‐ Hiawatha District Aggregate ALL Free Lunch only 29.94 40.10 22.99 6.95 .00 MATH Accountability2016 D0355 D0355 ‐ Ellinwood Public ScDistrict Aggregate ALL Free Lunch only 29.88 37.93 26.43 5.74 .00 MATH Accountability2016 D0456 D0456 ‐ Marais Des Cygnes District Aggregate ALL Free Lunch only 29.82 36.84 22.80 10.52 .00 MATH Accountability2016 D0237 D0237 ‐ Smith Center District Aggregate ALL Free Lunch only 29.68 51.56 17.18 1.56 .00 MATH Accountability2016 D0263 D0263 ‐ Mulvane District Aggregate ALL Free Lunch only 29.68 50.88 15.90 3.53 .00 MATH Accountability2016 D0503 D0503 ‐ Parsons District Aggregate ALL Free Lunch only 29.61 45.45 17.00 7.91 .00 MATH Accountability2016 D0321 D0321 ‐ Kaw Valley District Aggregate ALL Free Lunch only 29.53 43.62 23.48 3.35 .00 MATH Accountability2016 D0446 D0446 ‐ Independence District Aggregate ALL Free Lunch only 29.49 43.03 22.62 4.84 .00 MATH Accountability2016 D0309 D0309 ‐ Nickerson District Aggregate ALL Free Lunch only 29.45 52.32 14.34 3.87 .00 MATH Accountability2016 D0466 D0466 ‐ Scott County District Aggregate ALL Free Lunch only 29.34 43.11 22.75 4.79 .00 MATH Accountability2016 D0369 D0369 ‐ Burrton District Aggregate ALL Free Lunch only 29.23 46.15 23.07 1.53 .00 MATH Accountability2016 D0219 D0219 ‐ Minneola District Aggregate ALL Free Lunch only 29.09 43.63 25.45 1.81 .00 MATH Accountability2016 D0329 D0329 ‐ Mill Creek Valley District Aggregate ALL Free Lunch only 29.09 40.00 27.27 3.63 .00 MATH Accountability2016 D0375 D0375 ‐ Circle District Aggregate ALL Free Lunch only 29.08 47.44 18.87 4.59 .00 MATH Accountability2016 D0245 D0245 ‐ LeRoy‐Gridley District Aggregate ALL Free Lunch only 29.03 48.38 22.58 .00 .00 MATH Accountability2016 D0203 D0203 ‐ Piper‐Kansas City District Aggregate ALL Free Lunch only 28.88 46.66 18.51 5.92 .00 MATH Accountability2016 D0312 D0312 ‐ Haven Public SchooDistrict Aggregate ALL Free Lunch only 28.88 51.85 16.29 2.96 .00 MATH Accountability2016 D0463 D0463 ‐ Udall District Aggregate ALL Free Lunch only 28.88 44.44 22.22 4.44 .00 MATH Accountability2016 D0448 D0448 ‐ Inman District Aggregate ALL Free Lunch only 28.84 40.38 25.00 5.76 .00 MATH Accountability2016 D0344 D0344 ‐ Pleasanton District Aggregate ALL Free Lunch only 28.57 53.84 15.38 2.19 .00 MATH Accountability2016 D0340 D0340 ‐ Jefferson West District Aggregate ALL Free Lunch only 28.42 47.36 18.94 5.26 .00 MATH Accountability2016 D0397 D0397 ‐ Centre District Aggregate ALL Free Lunch only 28.26 52.17 19.56 .00 .00 MATH Accountability2016 D0313 D0313 ‐ Buhler District Aggregate ALL Free Lunch only 28.16 49.01 19.15 3.66 .00 MATH Accountability2016 D0227 D0227 ‐ Hodgeman County District Aggregate ALL Free Lunch only 28.12 59.37 9.37 3.12 .00 MATH Accountability2016 D0249 D0249 ‐ Frontenac Public ScDistrict Aggregate ALL Free Lunch only 28.08 41.78 22.60 7.53 .00 MATH Accountability2016 D0417 D0417 ‐ Morris County District Aggregate ALL Free Lunch only 27.88 41.34 24.03 6.73 .00 MATH Accountability2016 D0365 D0365 ‐ Garnett District Aggregate ALL Free Lunch only 27.87 55.15 13.33 3.63 .00 MATH Accountability2016 D0366 D0366 ‐ Woodson District Aggregate ALL Free Lunch only 27.86 50.81 17.21 4.09 .00 MATH Accountability2016 D0465 D0465 ‐ Winfield District Aggregate ALL Free Lunch only 27.85 47.40 19.33 5.40 .00 MATH Accountability2016 D0243 D0243 ‐ Lebo‐Waverly District Aggregate ALL Free Lunch only 27.53 44.92 24.63 2.89 .00 MATH Accountability2016 D0381 D0381 ‐ Spearville District Aggregate ALL Free Lunch only 27.45 41.17 21.56 9.80 .00 MATH Accountability
Data from: http://ksreportcard.ksde.org/2015_2016_Assessment_Full_File.xlsx991380
2017ADEQ00476

program_y Org_No Organization Building_Number GradeNam GroupName PCLevel_One PCLevel_Two PCLevel_Three PCLevel_Four PCNotValid Subject Population2016 D0298 D0298 ‐ Lincoln District Aggregate ALL Free Lunch only 27.41 37.09 29.03 6.45 .00 MATH Accountability2016 D0361 D0361 ‐ Chaparral Schools District Aggregate ALL Free Lunch only 27.31 43.41 27.31 1.95 .00 MATH Accountability2016 D0269 D0269 ‐ Palco District Aggregate ALL Free Lunch only 27.27 50.00 18.18 4.54 .00 MATH Accountability2016 D0327 D0327 ‐ Ellsworth District Aggregate ALL Free Lunch only 27.27 49.35 19.48 3.89 .00 MATH Accountability2016 D0423 D0423 ‐ Moundridge District Aggregate ALL Free Lunch only 27.27 36.36 27.27 9.09 .00 MATH Accountability2016 D0454 D0454 ‐ Burlingame Public SDistrict Aggregate ALL Free Lunch only 26.98 38.09 28.57 6.34 .00 MATH Accountability2016 D0368 D0368 ‐ Paola District Aggregate ALL Free Lunch only 26.92 47.90 20.62 4.54 .00 MATH Accountability2016 D0431 D0431 ‐ Hoisington District Aggregate ALL Free Lunch only 26.92 35.25 27.56 10.25 .00 MATH Accountability2016 D0239 D0239 ‐ North Ottawa CounDistrict Aggregate ALL Free Lunch only 26.88 48.38 22.58 2.15 .00 MATH Accountability2016 D0240 D0240 ‐ Twin Valley District Aggregate ALL Free Lunch only 26.88 48.38 20.43 4.30 .00 MATH Accountability2016 D0266 D0266 ‐ Maize District Aggregate ALL Free Lunch only 26.81 43.95 22.98 6.04 .20 MATH Accountability2016 D0506 D0506 ‐ Labette County District Aggregate ALL Free Lunch only 26.54 44.24 25.07 4.12 .00 MATH Accountability2016 D0405 D0405 ‐ Lyons District Aggregate ALL Free Lunch only 26.50 42.97 25.70 4.81 .00 MATH Accountability2016 D0244 D0244 ‐ Burlington District Aggregate ALL Free Lunch only 26.40 57.60 13.60 2.40 .00 MATH Accountability2016 D0359 D0359 ‐ Argonia Public SchoDistrict Aggregate ALL Free Lunch only 26.31 57.89 15.78 .00 .00 MATH Accountability2016 D0413 D0413 ‐ Chanute Public Sch District Aggregate ALL Free Lunch only 26.26 44.11 22.05 7.56 .00 MATH Accountability2016 D0378 D0378 ‐ Riley County District Aggregate ALL Free Lunch only 26.25 45.00 26.25 2.50 .00 MATH Accountability2016 D0267 D0267 ‐ Renwick District Aggregate ALL Free Lunch only 26.08 44.56 21.73 7.60 .00 MATH Accountability2016 D0434 D0434 ‐ Santa Fe Trail District Aggregate ALL Free Lunch only 26.06 44.68 23.40 5.85 .00 MATH Accountability2016 D0380 D0380 ‐ Vermillion District Aggregate ALL Free Lunch only 26.00 44.00 20.00 10.00 .00 MATH Accountability2016 D0273 D0273 ‐ Beloit District Aggregate ALL Free Lunch only 25.68 55.04 17.43 1.83 .00 MATH Accountability2016 D0251 D0251 ‐ North Lyon County District Aggregate ALL Free Lunch only 25.53 45.74 22.34 6.38 .00 MATH Accountability2016 D0105 D0105 ‐ Rawlins County District Aggregate ALL Free Lunch only 25.45 52.72 18.18 3.63 .00 MATH Accountability2016 D0410 D0410 ‐ Durham‐Hillsboro‐LDistrict Aggregate ALL Free Lunch only 25.33 52.00 21.33 1.33 .00 MATH Accountability2016 D0332 D0332 ‐ Cunningham District Aggregate ALL Free Lunch only 25.00 65.00 10.00 .00 .00 MATH Accountability2016 D0335 D0335 ‐ North Jackson District Aggregate ALL Free Lunch only 25.00 42.18 23.43 9.37 .00 MATH Accountability2016 D0349 D0349 ‐ Stafford District Aggregate ALL Free Lunch only 25.00 65.38 9.61 .00 .00 MATH Accountability2016 D0206 D0206 ‐ Remington‐WhitewDistrict Aggregate ALL Free Lunch only 24.65 47.94 23.28 4.10 .00 MATH Accountability2016 D0487 D0487 ‐ Herington District Aggregate ALL Free Lunch only 24.52 50.94 20.75 3.77 .00 MATH Accountability2016 D0412 D0412 ‐ Hoxie Community SDistrict Aggregate ALL Free Lunch only 24.44 46.66 26.66 2.22 .00 MATH Accountability2016 D0416 D0416 ‐ Louisburg District Aggregate ALL Free Lunch only 24.20 49.68 22.92 3.18 .00 MATH Accountability2016 D0109 D0109 ‐ Republic County District Aggregate ALL Free Lunch only 24.09 44.57 20.48 10.84 .00 MATH Accountability2016 D0311 D0311 ‐ Pretty Prairie District Aggregate ALL Free Lunch only 24.00 56.00 12.00 8.00 .00 MATH Accountability2016 D0270 D0270 ‐ Plainville District Aggregate ALL Free Lunch only 23.91 58.69 10.86 6.52 .00 MATH Accountability2016 D0481 D0481 ‐ Rural Vista District Aggregate ALL Free Lunch only 23.63 58.18 14.54 3.63 .00 MATH Accountability2016 D0241 D0241 ‐ Wallace County SchDistrict Aggregate ALL Free Lunch only 23.52 35.29 35.29 5.88 .00 MATH Accountability2016 D0285 D0285 ‐ Cedar Vale District Aggregate ALL Free Lunch only 23.52 52.94 23.52 .00 .00 MATH Accountability2016 D0430 D0430 ‐ South Brown CountDistrict Aggregate ALL Free Lunch only 23.33 51.33 19.33 6.00 .00 MATH Accountability2016 D0347 D0347 ‐ Kinsley‐Offerle District Aggregate ALL Free Lunch only 23.21 51.78 23.21 1.78 .00 MATH Accountability2016 D0215 D0215 ‐ Lakin District Aggregate ALL Free Lunch only 23.12 55.78 18.36 2.72 .00 MATH Accountability2016 D0255 D0255 ‐ South Barber District Aggregate ALL Free Lunch only 23.07 61.53 15.38 .00 .00 MATH Accountability2016 D0350 D0350 ‐ St John‐Hudson District Aggregate ALL Free Lunch only 23.07 60.00 15.38 1.53 .00 MATH Accountability2016 D0390 D0390 ‐ Hamilton District Aggregate ALL Free Lunch only 23.07 53.84 19.23 3.84 .00 MATH Accountability2016 D0496 D0496 ‐ Pawnee Heights District Aggregate ALL Free Lunch only 23.07 46.15 19.23 11.53 .00 MATH Accountability2016 D0504 D0504 ‐ Oswego District Aggregate ALL Free Lunch only 23.00 40.70 25.66 10.61 .00 MATH Accountability2016 D0322 D0322 ‐ Onaga‐Havensville‐District Aggregate ALL Free Lunch only 22.85 57.14 20.00 .00 .00 MATH Accountability2016 D0476 D0476 ‐ Copeland District Aggregate ALL Free Lunch only 22.85 51.42 20.00 5.71 .00 MATH Accountability2016 D0265 D0265 ‐ Goddard District Aggregate ALL Free Lunch only 22.80 47.40 26.20 3.60 .00 MATH Accountability2016 D0467 D0467 ‐ Leoti District Aggregate ALL Free Lunch only 22.72 43.18 28.40 5.68 .00 MATH Accountability2016 D0408 D0408 ‐ Marion‐Florence District Aggregate ALL Free Lunch only 22.61 53.57 20.23 3.57 .00 MATH Accountability2016 D0229 D0229 ‐ Blue Valley District Aggregate ALL Free Lunch only 22.41 43.66 24.45 9.46 .00 MATH Accountability
Data from: http://ksreportcard.ksde.org/2015_2016_Assessment_Full_File.xlsx991380
2017ADEQ00477

program_y Org_No Organization Building_Number GradeNam GroupName PCLevel_One PCLevel_Two PCLevel_Three PCLevel_Four PCNotValid Subject Population2016 D0346 D0346 ‐ Jayhawk District Aggregate ALL Free Lunch only 22.01 42.20 32.11 3.66 .00 MATH Accountability2016 D0316 D0316 ‐ Golden Plains District Aggregate ALL Free Lunch only 21.73 58.69 15.21 4.34 .00 MATH Accountability2016 D0389 D0389 ‐ Eureka District Aggregate ALL Free Lunch only 21.70 56.58 18.60 3.10 .00 MATH Accountability2016 D0372 D0372 ‐ Silver Lake District Aggregate ALL Free Lunch only 21.56 31.37 37.25 9.80 .00 MATH Accountability2016 D0376 D0376 ‐ Sterling District Aggregate ALL Free Lunch only 21.33 36.00 32.00 10.66 .00 MATH Accountability2016 D0232 D0232 ‐ De Soto District Aggregate ALL Free Lunch only 21.28 48.64 25.00 5.06 .00 MATH Accountability2016 D0385 D0385 ‐ Andover District Aggregate ALL Free Lunch only 21.25 44.61 26.94 7.18 .00 MATH Accountability2016 D0323 D0323 ‐ Rock Creek District Aggregate ALL Free Lunch only 21.23 47.78 28.31 2.65 .00 MATH Accountability2016 D0272 D0272 ‐ Waconda District Aggregate ALL Free Lunch only 21.15 38.46 34.61 5.76 .00 MATH Accountability2016 D0102 D0102 ‐ Cimarron‐Ensign District Aggregate ALL Free Lunch only 21.05 56.14 20.17 2.63 .00 MATH Accountability2016 D0498 D0498 ‐ Valley Heights District Aggregate ALL Free Lunch only 20.77 44.15 29.87 5.19 .00 MATH Accountability2016 D0231 D0231 ‐ Gardner Edgerton District Aggregate ALL Free Lunch only 20.75 41.06 27.87 10.30 .00 MATH Accountability2016 D0438 D0438 ‐ Skyline Schools District Aggregate ALL Free Lunch only 20.51 53.84 23.07 2.56 .00 MATH Accountability2016 D0212 D0212 ‐ Northern Valley District Aggregate ALL Free Lunch only 20.00 56.66 23.33 .00 .00 MATH Accountability2016 D0299 D0299 ‐ Sylvan Grove District Aggregate ALL Free Lunch only 20.00 55.00 22.50 2.50 .00 MATH Accountability2016 D0113 D0113 ‐ Prairie Hills District Aggregate ALL Free Lunch only 19.70 42.33 27.73 10.21 .00 MATH Accountability2016 D0439 D0439 ‐ Sedgwick Public SchDistrict Aggregate ALL Free Lunch only 19.40 52.23 25.37 2.98 .00 MATH Accountability2016 D0482 D0482 ‐ Dighton District Aggregate ALL Free Lunch only 19.04 40.47 26.19 14.28 .00 MATH Accountability2016 D0235 D0235 ‐ Uniontown District Aggregate ALL Free Lunch only 18.55 60.82 15.46 5.15 .00 MATH Accountability2016 D0107 D0107 ‐ Rock Hills District Aggregate ALL Free Lunch only 17.85 50.00 26.78 5.35 .00 MATH Accountability2016 D0207 D0207 ‐ Ft Leavenworth District Aggregate ALL Free Lunch only 17.50 62.50 20.00 .00 .00 MATH Accountability2016 D0282 D0282 ‐ West Elk District Aggregate ALL Free Lunch only 17.39 60.86 20.28 1.44 .00 MATH Accountability2016 D0103 D0103 ‐ Cheylin District Aggregate ALL Free Lunch only 17.14 48.57 34.28 .00 .00 MATH Accountability2016 D0268 D0268 ‐ Cheney District Aggregate ALL Free Lunch only 16.43 45.20 27.39 10.95 .00 MATH Accountability2016 D0252 D0252 ‐ Southern Lyon Cou District Aggregate ALL Free Lunch only 15.94 53.62 24.63 5.79 .00 MATH Accountability2016 D0112 D0112 ‐ Central Plains District Aggregate ALL Free Lunch only 15.06 46.57 26.02 12.32 .00 MATH Accountability2016 D0460 D0460 ‐ Hesston District Aggregate ALL Free Lunch only 10.58 50.58 35.29 3.52 .00 MATH Accountability2016 D0426 D0426 ‐ Pike Valley District Aggregate ALL Free Lunch only 10.00 54.00 32.00 4.00 .00 MATH Accountability2016 D0411 D0411 ‐ Goessel District Aggregate ALL Free Lunch only 7.40 51.85 29.62 11.11 .00 MATH Accountability2016 D0371 D0371 ‐ Montezuma District Aggregate ALL Free Lunch only 6.66 66.66 20.00 6.66 .00 MATH Accountability2016 D0275 D0275 ‐ Triplains District Aggregate ALL Free Lunch only .00 8.33 58.33 33.33 .00 MATH Accountability
Data from: http://ksreportcard.ksde.org/2015_2016_Assessment_Full_File.xlsx991380
2017ADEQ00478

program_y Org_No Organization Building_Number GradeNam GroupName PCLevel_One PCLevel_Two PCLevel_Three PCLevel_Four PCNotValid Subject Population2016 D0314 D0314 ‐ Brewster District Aggregate ALL Self‐Paid Lunch only 47.05 41.17 11.76 .00 .00 MATH Accountability2016 D0468 D0468 ‐ Healy Public Schoo District Aggregate ALL Self‐Paid Lunch only 47.05 17.64 23.52 11.76 .00 MATH Accountability2016 D0283 D0283 ‐ Elk Valley District Aggregate ALL Self‐Paid Lunch only 46.15 38.46 15.38 .00 .00 MATH Accountability2016 D0500 D0500 ‐ Kansas City District Aggregate ALL Self‐Paid Lunch only 45.85 35.99 15.28 2.86 .00 MATH Accountability2016 D0106 D0106 ‐ Western Plains District Aggregate ALL Self‐Paid Lunch only 42.85 50.00 7.14 .00 .00 MATH Accountability2016 D0398 D0398 ‐ Peabody‐Burns District Aggregate ALL Self‐Paid Lunch only 42.59 35.18 14.81 7.40 .00 MATH Accountability2016 D0387 D0387 ‐ Altoona‐Midway District Aggregate ALL Self‐Paid Lunch only 41.17 29.41 17.64 11.76 .00 MATH Accountability2016 D0209 D0209 ‐ Moscow Public Sch District Aggregate ALL Self‐Paid Lunch only 40.74 25.92 22.22 11.11 .00 MATH Accountability2016 D0270 D0270 ‐ Plainville District Aggregate ALL Self‐Paid Lunch only 38.84 39.66 16.52 4.95 .00 MATH Accountability2016 D0216 D0216 ‐ Deerfield District Aggregate ALL Self‐Paid Lunch only 37.50 41.66 16.66 4.16 .00 MATH Accountability2016 D0351 D0351 ‐ Macksville District Aggregate ALL Self‐Paid Lunch only 37.50 31.25 26.56 4.68 .00 MATH Accountability2016 D0205 D0205 ‐ Bluestem District Aggregate ALL Self‐Paid Lunch only 37.39 46.95 12.17 3.47 .00 MATH Accountability2016 D0509 D0509 ‐ South Haven District Aggregate ALL Self‐Paid Lunch only 36.95 30.43 28.26 4.34 .00 MATH Accountability2016 D0281 D0281 ‐ Graham County District Aggregate ALL Self‐Paid Lunch only 36.93 41.44 18.91 2.70 .00 MATH Accountability2016 D0202 D0202 ‐ Turner‐Kansas City District Aggregate ALL Self‐Paid Lunch only 34.59 44.30 17.29 3.79 .00 MATH Accountability2016 D0217 D0217 ‐ Rolla District Aggregate ALL Self‐Paid Lunch only 33.33 57.14 2.38 7.14 .00 MATH Accountability2016 D0360 D0360 ‐ Caldwell District Aggregate ALL Self‐Paid Lunch only 33.33 48.48 16.66 1.51 .00 MATH Accountability2016 D0471 D0471 ‐ Dexter District Aggregate ALL Self‐Paid Lunch only 33.33 36.11 30.55 .00 .00 MATH Accountability2016 D0494 D0494 ‐ Syracuse District Aggregate ALL Self‐Paid Lunch only 32.92 40.24 23.17 3.65 .00 MATH Accountability2016 D0246 D0246 ‐ Northeast District Aggregate ALL Self‐Paid Lunch only 32.83 41.79 19.40 5.97 .00 MATH Accountability2016 D0399 D0399 ‐ Paradise District Aggregate ALL Self‐Paid Lunch only 31.81 40.90 27.27 .00 .00 MATH Accountability2016 D0501 D0501 ‐ Topeka Public SchoDistrict Aggregate ALL Self‐Paid Lunch only 31.80 38.03 21.66 8.48 .00 MATH Accountability2016 D0505 D0505 ‐ Chetopa‐St. Paul District Aggregate ALL Self‐Paid Lunch only 31.64 44.30 20.25 3.79 .00 MATH Accountability2016 D0457 D0457 ‐ Garden City District Aggregate ALL Self‐Paid Lunch only 31.39 42.28 20.68 5.63 .00 MATH Accountability2016 D0358 D0358 ‐ Oxford District Aggregate ALL Self‐Paid Lunch only 31.25 46.87 20.31 1.56 .00 MATH Accountability2016 D0459 D0459 ‐ Bucklin District Aggregate ALL Self‐Paid Lunch only 31.25 32.81 28.12 7.81 .00 MATH Accountability2016 D0357 D0357 ‐ Belle Plaine District Aggregate ALL Self‐Paid Lunch only 30.94 47.53 20.62 .89 .00 MATH Accountability2016 D0225 D0225 ‐ Fowler District Aggregate ALL Self‐Paid Lunch only 30.76 38.46 19.23 11.53 .00 MATH Accountability2016 D0330 D0330 ‐ Mission Valley District Aggregate ALL Self‐Paid Lunch only 29.67 54.83 15.48 .00 .00 MATH Accountability2016 D0218 D0218 ‐ Elkhart District Aggregate ALL Self‐Paid Lunch only 29.62 39.09 25.51 5.76 .00 MATH Accountability2016 D0342 D0342 ‐ McLouth District Aggregate ALL Self‐Paid Lunch only 29.53 48.32 18.79 3.35 .00 MATH Accountability2016 D0429 D0429 ‐ Troy Public SchoolsDistrict Aggregate ALL Self‐Paid Lunch only 29.03 38.70 23.65 8.60 .00 MATH Accountability2016 D0114 D0114 ‐ Riverside District Aggregate ALL Self‐Paid Lunch only 28.84 43.26 19.23 8.65 .00 MATH Accountability2016 D0285 D0285 ‐ Cedar Vale District Aggregate ALL Self‐Paid Lunch only 28.57 33.33 33.33 4.76 .00 MATH Accountability2016 D0397 D0397 ‐ Centre District Aggregate ALL Self‐Paid Lunch only 28.35 40.29 25.37 5.97 .00 MATH Accountability2016 D0254 D0254 ‐ Barber County NortDistrict Aggregate ALL Self‐Paid Lunch only 28.12 35.93 29.68 6.25 .00 MATH Accountability2016 D0443 D0443 ‐ Dodge City District Aggregate ALL Self‐Paid Lunch only 27.72 37.95 24.09 10.22 .00 MATH Accountability2016 D0479 D0479 ‐ Crest District Aggregate ALL Self‐Paid Lunch only 27.58 48.27 20.68 3.44 .00 MATH Accountability2016 D0484 D0484 ‐ Fredonia District Aggregate ALL Self‐Paid Lunch only 26.99 45.39 22.69 4.90 .00 MATH Accountability2016 D0495 D0495 ‐ Ft Larned District Aggregate ALL Self‐Paid Lunch only 26.98 41.79 25.92 5.29 .00 MATH Accountability2016 D0453 D0453 ‐ Leavenworth District Aggregate ALL Self‐Paid Lunch only 26.88 40.40 23.58 9.11 .00 MATH Accountability2016 D0287 D0287 ‐ West Franklin District Aggregate ALL Self‐Paid Lunch only 26.81 35.75 26.81 10.61 .00 MATH Accountability2016 D0508 D0508 ‐ Baxter Springs District Aggregate ALL Self‐Paid Lunch only 26.81 45.81 19.55 7.82 .00 MATH Accountability2016 D0480 D0480 ‐ Liberal District Aggregate ALL Self‐Paid Lunch only 26.76 40.48 25.00 7.74 .00 MATH Accountability2016 D0226 D0226 ‐ Meade District Aggregate ALL Self‐Paid Lunch only 26.50 43.37 24.09 6.02 .00 MATH Accountability2016 D0341 D0341 ‐ Oskaloosa Public ScDistrict Aggregate ALL Self‐Paid Lunch only 26.49 42.73 23.93 6.83 .00 MATH Accountability2016 D0312 D0312 ‐ Haven Public SchooDistrict Aggregate ALL Self‐Paid Lunch only 26.38 41.27 22.97 9.36 .00 MATH Accountability2016 D0210 D0210 ‐ Hugoton Public SchDistrict Aggregate ALL Self‐Paid Lunch only 25.75 38.38 29.79 6.06 .00 MATH Accountability2016 D0271 D0271 ‐ Stockton District Aggregate ALL Self‐Paid Lunch only 25.30 49.39 22.89 2.40 .00 MATH Accountability2016 D0428 D0428 ‐ Great Bend District Aggregate ALL Self‐Paid Lunch only 25.21 43.64 24.78 6.35 .00 MATH Accountability2016 D0242 D0242 ‐ Weskan District Aggregate ALL Self‐Paid Lunch only 25.00 33.33 33.33 8.33 .00 MATH Accountability
Data from: http://ksreportcard.ksde.org/2015_2016_Assessment_Full_File.xlsx
Paid Lunch Students: Math - Sorted by Percent Level One (Not on Grade Level)
991380
2017ADEQ00479

program_y Org_No Organization Building_Number GradeNam GroupName PCLevel_One PCLevel_Two PCLevel_Three PCLevel_Four PCNotValid Subject Population2016 D0309 D0309 ‐ Nickerson District Aggregate ALL Self‐Paid Lunch only 25.00 44.67 22.95 7.37 .00 MATH Accountability2016 D0214 D0214 ‐ Ulysses District Aggregate ALL Self‐Paid Lunch only 24.75 52.14 18.48 4.62 .00 MATH Accountability2016 D0247 D0247 ‐ Cherokee District Aggregate ALL Self‐Paid Lunch only 24.75 36.63 29.70 8.91 .00 MATH Accountability2016 D0303 D0303 ‐ Ness City District Aggregate ALL Self‐Paid Lunch only 24.59 52.45 19.67 3.27 .00 MATH Accountability2016 D0507 D0507 ‐ Satanta District Aggregate ALL Self‐Paid Lunch only 24.56 45.61 26.31 3.50 .00 MATH Accountability2016 D0219 D0219 ‐ Minneola District Aggregate ALL Self‐Paid Lunch only 24.52 39.62 28.30 7.54 .00 MATH Accountability2016 D0373 D0373 ‐ Newton District Aggregate ALL Self‐Paid Lunch only 24.51 37.48 24.64 13.35 .00 MATH Accountability2016 D0362 D0362 ‐ Prairie View District Aggregate ALL Self‐Paid Lunch only 24.44 45.77 24.00 5.77 .00 MATH Accountability2016 D0101 D0101 ‐ Erie‐Galesburg District Aggregate ALL Self‐Paid Lunch only 24.29 45.79 20.56 9.34 .00 MATH Accountability2016 D0316 D0316 ‐ Golden Plains District Aggregate ALL Self‐Paid Lunch only 24.24 39.39 33.33 3.03 .00 MATH Accountability2016 D0307 D0307 ‐ Ell‐Saline District Aggregate ALL Self‐Paid Lunch only 23.84 46.35 24.50 5.29 .00 MATH Accountability2016 D0261 D0261 ‐ Haysville District Aggregate ALL Self‐Paid Lunch only 23.77 37.22 27.24 11.75 .00 MATH Accountability2016 D0258 D0258 ‐ Humboldt District Aggregate ALL Self‐Paid Lunch only 23.52 49.67 22.22 4.57 .00 MATH Accountability2016 D0367 D0367 ‐ Osawatomie District Aggregate ALL Self‐Paid Lunch only 23.52 40.19 28.92 7.35 .00 MATH Accountability2016 D0418 D0418 ‐ McPherson District Aggregate ALL Self‐Paid Lunch only 23.47 46.66 23.18 6.66 .00 MATH Accountability2016 D0310 D0310 ‐ Fairfield District Aggregate ALL Self‐Paid Lunch only 23.40 53.19 23.40 .00 .00 MATH Accountability2016 D0259 D0259 ‐ Wichita District Aggregate ALL Self‐Paid Lunch only 23.32 38.83 25.67 12.16 .00 MATH Accountability2016 D0393 D0393 ‐ Solomon District Aggregate ALL Self‐Paid Lunch only 23.28 36.98 30.13 9.58 .00 MATH Accountability2016 D0331 D0331 ‐ Kingman ‐ Norwich District Aggregate ALL Self‐Paid Lunch only 23.26 36.32 29.79 10.61 .00 MATH Accountability2016 D0475 D0475 ‐ Geary County Scho District Aggregate ALL Self‐Paid Lunch only 23.18 39.61 28.08 9.10 .00 MATH Accountability2016 D0396 D0396 ‐ Douglass Public SchDistrict Aggregate ALL Self‐Paid Lunch only 23.15 44.21 28.42 4.21 .00 MATH Accountability2016 D0248 D0248 ‐ Girard District Aggregate ALL Self‐Paid Lunch only 23.10 42.41 28.96 5.51 .00 MATH Accountability2016 D0404 D0404 ‐ Riverton District Aggregate ALL Self‐Paid Lunch only 23.07 53.84 21.30 1.77 .00 MATH Accountability2016 D0412 D0412 ‐ Hoxie Community SDistrict Aggregate ALL Self‐Paid Lunch only 23.01 41.26 26.98 8.73 .00 MATH Accountability2016 D0111 D0111 ‐ Doniphan West SchDistrict Aggregate ALL Self‐Paid Lunch only 22.97 51.35 21.62 4.05 .00 MATH Accountability2016 D0322 D0322 ‐ Onaga‐Havensville‐District Aggregate ALL Self‐Paid Lunch only 22.97 52.70 21.62 2.70 .00 MATH Accountability2016 D0240 D0240 ‐ Twin Valley District Aggregate ALL Self‐Paid Lunch only 22.94 33.52 36.47 7.05 .00 MATH Accountability2016 D0290 D0290 ‐ Ottawa District Aggregate ALL Self‐Paid Lunch only 22.92 40.84 27.74 8.47 .00 MATH Accountability2016 D0105 D0105 ‐ Rawlins County District Aggregate ALL Self‐Paid Lunch only 22.89 40.96 25.30 10.84 .00 MATH Accountability2016 D0326 D0326 ‐ Logan District Aggregate ALL Self‐Paid Lunch only 22.64 41.50 30.18 5.66 .00 MATH Accountability2016 D0402 D0402 ‐ Augusta District Aggregate ALL Self‐Paid Lunch only 22.63 41.52 26.98 8.84 .00 MATH Accountability2016 D0220 D0220 ‐ Ashland District Aggregate ALL Self‐Paid Lunch only 22.41 43.10 27.58 6.89 .00 MATH Accountability2016 D0407 D0407 ‐ Russell County District Aggregate ALL Self‐Paid Lunch only 22.33 43.65 25.38 8.62 .00 MATH Accountability2016 D0344 D0344 ‐ Pleasanton District Aggregate ALL Self‐Paid Lunch only 22.22 42.85 30.15 4.76 .00 MATH Accountability2016 D0438 D0438 ‐ Skyline Schools District Aggregate ALL Self‐Paid Lunch only 22.22 43.79 26.14 7.84 .00 MATH Accountability2016 D0315 D0315 ‐ Colby Public SchoolDistrict Aggregate ALL Self‐Paid Lunch only 22.09 51.31 20.59 5.99 .00 MATH Accountability2016 D0234 D0234 ‐ Fort Scott District Aggregate ALL Self‐Paid Lunch only 22.05 42.35 28.32 7.26 .00 MATH Accountability2016 D0409 D0409 ‐ Atchison Public SchDistrict Aggregate ALL Self‐Paid Lunch only 21.56 43.49 27.13 7.80 .00 MATH Accountability2016 D0264 D0264 ‐ Clearwater District Aggregate ALL Self‐Paid Lunch only 21.42 42.60 29.59 6.37 .00 MATH Accountability2016 D0452 D0452 ‐ Stanton County District Aggregate ALL Self‐Paid Lunch only 21.42 40.00 35.71 2.85 .00 MATH Accountability2016 D0463 D0463 ‐ Udall District Aggregate ALL Self‐Paid Lunch only 21.34 47.19 26.96 4.49 .00 MATH Accountability2016 D0401 D0401 ‐ Chase‐Raymond District Aggregate ALL Self‐Paid Lunch only 21.05 63.15 5.26 10.52 .00 MATH Accountability2016 D0458 D0458 ‐ Basehor‐Linwood District Aggregate ALL Self‐Paid Lunch only 20.92 39.63 28.22 11.21 .00 MATH Accountability2016 D0349 D0349 ‐ Stafford District Aggregate ALL Self‐Paid Lunch only 20.68 41.37 31.03 6.89 .00 MATH Accountability2016 D0204 D0204 ‐ Bonner Springs District Aggregate ALL Self‐Paid Lunch only 20.64 38.37 29.96 11.00 .00 MATH Accountability2016 D0384 D0384 ‐ Blue Valley District Aggregate ALL Self‐Paid Lunch only 20.63 49.20 14.28 15.87 .00 MATH Accountability2016 D0493 D0493 ‐ Columbus District Aggregate ALL Self‐Paid Lunch only 20.60 53.21 23.17 3.00 .00 MATH Accountability2016 D0364 D0364 ‐ Marysville District Aggregate ALL Self‐Paid Lunch only 20.48 43.41 30.24 5.85 .00 MATH Accountability2016 D0308 D0308 ‐ Hutchinson Public SDistrict Aggregate ALL Self‐Paid Lunch only 20.43 39.50 29.35 10.69 .00 MATH Accountability2016 D0333 D0333 ‐ Concordia District Aggregate ALL Self‐Paid Lunch only 20.32 40.65 31.30 7.72 .00 MATH Accountability2016 D0447 D0447 ‐ Cherryvale District Aggregate ALL Self‐Paid Lunch only 20.26 44.44 28.75 6.53 .00 MATH Accountability
Data from: http://ksreportcard.ksde.org/2015_2016_Assessment_Full_File.xlsx991380
2017ADEQ00480

program_y Org_No Organization Building_Number GradeNam GroupName PCLevel_One PCLevel_Two PCLevel_Three PCLevel_Four PCNotValid Subject Population2016 D0286 D0286 ‐ Chautauqua Co ComDistrict Aggregate ALL Self‐Paid Lunch only 20.25 58.22 18.98 2.53 .00 MATH Accountability2016 D0288 D0288 ‐ Central Heights District Aggregate ALL Self‐Paid Lunch only 20.17 39.47 29.82 10.52 .00 MATH Accountability2016 D0249 D0249 ‐ Frontenac Public ScDistrict Aggregate ALL Self‐Paid Lunch only 20.06 39.11 26.87 13.94 .00 MATH Accountability2016 D0386 D0386 ‐ Madison‐Virgil District Aggregate ALL Self‐Paid Lunch only 20.00 31.66 41.66 6.66 .00 MATH Accountability2016 D0487 D0487 ‐ Herington District Aggregate ALL Self‐Paid Lunch only 20.00 40.00 31.76 8.23 .00 MATH Accountability2016 D0252 D0252 ‐ Southern Lyon Cou District Aggregate ALL Self‐Paid Lunch only 19.86 35.61 34.24 10.27 .00 MATH Accountability2016 D0293 D0293 ‐ Quinter Public SchoDistrict Aggregate ALL Self‐Paid Lunch only 19.79 34.37 37.50 8.33 .00 MATH Accountability2016 D0294 D0294 ‐ Oberlin District Aggregate ALL Self‐Paid Lunch only 19.79 39.58 28.12 12.50 .00 MATH Accountability2016 D0435 D0435 ‐ Abilene District Aggregate ALL Self‐Paid Lunch only 19.70 48.87 24.93 6.48 .00 MATH Accountability2016 D0245 D0245 ‐ LeRoy‐Gridley District Aggregate ALL Self‐Paid Lunch only 19.64 48.21 25.00 7.14 .00 MATH Accountability2016 D0400 D0400 ‐ Smoky Valley District Aggregate ALL Self‐Paid Lunch only 19.62 45.92 24.81 9.62 .00 MATH Accountability2016 D0436 D0436 ‐ Caney Valley District Aggregate ALL Self‐Paid Lunch only 19.57 41.26 28.04 11.11 .00 MATH Accountability2016 D0511 D0511 ‐ Attica District Aggregate ALL Self‐Paid Lunch only 19.56 41.30 28.26 10.86 .00 MATH Accountability2016 D0334 D0334 ‐ Southern Cloud District Aggregate ALL Self‐Paid Lunch only 19.35 45.16 25.80 9.67 .00 MATH Accountability2016 D0395 D0395 ‐ LaCrosse District Aggregate ALL Self‐Paid Lunch only 19.35 49.46 29.03 2.15 .00 MATH Accountability2016 D0464 D0464 ‐ Tonganoxie District Aggregate ALL Self‐Paid Lunch only 19.31 41.05 27.75 11.87 .00 MATH Accountability2016 D0269 D0269 ‐ Palco District Aggregate ALL Self‐Paid Lunch only 19.23 57.69 23.07 .00 .00 MATH Accountability2016 D0332 D0332 ‐ Cunningham District Aggregate ALL Self‐Paid Lunch only 19.23 30.76 30.76 19.23 .00 MATH Accountability2016 D0237 D0237 ‐ Smith Center District Aggregate ALL Self‐Paid Lunch only 19.10 49.43 26.96 4.49 .00 MATH Accountability2016 D0382 D0382 ‐ Pratt District Aggregate ALL Self‐Paid Lunch only 19.06 43.16 27.69 10.07 .00 MATH Accountability2016 D0337 D0337 ‐ Royal Valley District Aggregate ALL Self‐Paid Lunch only 18.98 36.11 27.31 17.59 .00 MATH Accountability2016 D0377 D0377 ‐ Atchison Co Comm District Aggregate ALL Self‐Paid Lunch only 18.97 50.36 21.16 9.48 .00 MATH Accountability2016 D0320 D0320 ‐ Wamego District Aggregate ALL Self‐Paid Lunch only 18.86 40.30 28.47 12.34 .00 MATH Accountability2016 D0445 D0445 ‐ Coffeyville District Aggregate ALL Self‐Paid Lunch only 18.84 36.71 34.29 10.14 .00 MATH Accountability2016 D0417 D0417 ‐ Morris County District Aggregate ALL Self‐Paid Lunch only 18.55 39.69 27.83 13.91 .00 MATH Accountability2016 D0465 D0465 ‐ Winfield District Aggregate ALL Self‐Paid Lunch only 18.51 36.11 30.69 14.67 .00 MATH Accountability2016 D0274 D0274 ‐ Oakley District Aggregate ALL Self‐Paid Lunch only 18.44 38.83 32.03 10.67 .00 MATH Accountability2016 D0456 D0456 ‐ Marais Des Cygnes District Aggregate ALL Self‐Paid Lunch only 18.42 42.10 28.94 10.52 .00 MATH Accountability2016 D0405 D0405 ‐ Lyons District Aggregate ALL Self‐Paid Lunch only 18.26 41.34 22.11 18.26 .00 MATH Accountability2016 D0376 D0376 ‐ Sterling District Aggregate ALL Self‐Paid Lunch only 18.12 29.37 30.00 22.50 .00 MATH Accountability2016 D0490 D0490 ‐ El Dorado District Aggregate ALL Self‐Paid Lunch only 18.02 40.98 29.38 11.60 .00 MATH Accountability2016 D0305 D0305 ‐ Salina District Aggregate ALL Self‐Paid Lunch only 17.97 40.50 31.33 10.18 .00 MATH Accountability2016 D0462 D0462 ‐ Central District Aggregate ALL Self‐Paid Lunch only 17.85 44.64 32.14 5.35 .00 MATH Accountability2016 D0257 D0257 ‐ Iola District Aggregate ALL Self‐Paid Lunch only 17.82 52.71 22.86 6.58 .00 MATH Accountability2016 D0361 D0361 ‐ Chaparral Schools District Aggregate ALL Self‐Paid Lunch only 17.82 39.53 30.23 12.40 .00 MATH Accountability2016 D0470 D0470 ‐ Arkansas City District Aggregate ALL Self‐Paid Lunch only 17.80 37.44 32.64 12.10 .00 MATH Accountability2016 D0449 D0449 ‐ Easton District Aggregate ALL Self‐Paid Lunch only 17.75 41.12 24.76 16.35 .00 MATH Accountability2016 D0422 D0422 ‐ Kiowa County District Aggregate ALL Self‐Paid Lunch only 17.72 30.37 36.70 15.18 .00 MATH Accountability2016 D0394 D0394 ‐ Rose Hill Public SchDistrict Aggregate ALL Self‐Paid Lunch only 17.30 39.54 30.03 13.11 .00 MATH Accountability2016 D0473 D0473 ‐ Chapman District Aggregate ALL Self‐Paid Lunch only 17.27 46.32 26.47 9.92 .00 MATH Accountability2016 D0327 D0327 ‐ Ellsworth District Aggregate ALL Self‐Paid Lunch only 17.11 41.17 31.55 10.16 .00 MATH Accountability2016 D0466 D0466 ‐ Scott County District Aggregate ALL Self‐Paid Lunch only 17.10 39.77 34.94 8.17 .00 MATH Accountability2016 D0340 D0340 ‐ Jefferson West District Aggregate ALL Self‐Paid Lunch only 17.02 35.91 34.05 13.00 .00 MATH Accountability2016 D0208 D0208 ‐ Wakeeney District Aggregate ALL Self‐Paid Lunch only 16.93 41.93 35.48 5.64 .00 MATH Accountability2016 D0250 D0250 ‐ Pittsburg District Aggregate ALL Self‐Paid Lunch only 16.93 32.44 33.15 17.46 .00 MATH Accountability2016 D0297 D0297 ‐ St Francis Comm ScDistrict Aggregate ALL Self‐Paid Lunch only 16.86 65.06 18.07 .00 .00 MATH Accountability2016 D0454 D0454 ‐ Burlingame Public SDistrict Aggregate ALL Self‐Paid Lunch only 16.86 38.55 31.32 13.25 .00 MATH Accountability2016 D0498 D0498 ‐ Valley Heights District Aggregate ALL Self‐Paid Lunch only 16.83 28.71 37.62 16.83 .00 MATH Accountability2016 D0299 D0299 ‐ Sylvan Grove District Aggregate ALL Self‐Paid Lunch only 16.66 30.30 42.42 10.60 .00 MATH Accountability2016 D0306 D0306 ‐ Southeast Of SalineDistrict Aggregate ALL Self‐Paid Lunch only 16.66 37.33 35.66 10.33 .00 MATH Accountability2016 D0403 D0403 ‐ Otis‐Bison District Aggregate ALL Self‐Paid Lunch only 16.66 46.29 24.07 12.96 .00 MATH Accountability
Data from: http://ksreportcard.ksde.org/2015_2016_Assessment_Full_File.xlsx991380
2017ADEQ00481

program_y Org_No Organization Building_Number GradeNam GroupName PCLevel_One PCLevel_Two PCLevel_Three PCLevel_Four PCNotValid Subject Population2016 D0431 D0431 ‐ Hoisington District Aggregate ALL Self‐Paid Lunch only 16.66 35.80 40.12 7.40 .00 MATH Accountability2016 D0450 D0450 ‐ Shawnee Heights District Aggregate ALL Self‐Paid Lunch only 16.63 38.90 33.36 11.09 .00 MATH Accountability2016 D0289 D0289 ‐ Wellsville District Aggregate ALL Self‐Paid Lunch only 16.60 45.93 28.97 8.48 .00 MATH Accountability2016 D0440 D0440 ‐ Halstead District Aggregate ALL Self‐Paid Lunch only 16.59 31.12 40.66 11.61 .00 MATH Accountability2016 D0300 D0300 ‐ Comanche County District Aggregate ALL Self‐Paid Lunch only 16.49 41.23 30.92 11.34 .00 MATH Accountability2016 D0108 D0108 ‐ Washington Co. SchDistrict Aggregate ALL Self‐Paid Lunch only 16.25 52.50 27.50 3.75 .00 MATH Accountability2016 D0343 D0343 ‐ Perry Public School District Aggregate ALL Self‐Paid Lunch only 16.25 35.83 32.91 15.00 .00 MATH Accountability2016 D0313 D0313 ‐ Buhler District Aggregate ALL Self‐Paid Lunch only 16.13 39.31 32.82 11.72 .00 MATH Accountability2016 D0243 D0243 ‐ Lebo‐Waverly District Aggregate ALL Self‐Paid Lunch only 16.03 34.90 36.79 12.26 .00 MATH Accountability2016 D0260 D0260 ‐ Derby District Aggregate ALL Self‐Paid Lunch only 16.03 38.30 30.45 15.20 .00 MATH Accountability2016 D0434 D0434 ‐ Santa Fe Trail District Aggregate ALL Self‐Paid Lunch only 15.98 34.57 35.31 14.12 .00 MATH Accountability2016 D0272 D0272 ‐ Waconda District Aggregate ALL Self‐Paid Lunch only 15.90 19.31 37.50 27.27 .00 MATH Accountability2016 D0481 D0481 ‐ Rural Vista District Aggregate ALL Self‐Paid Lunch only 15.87 44.44 33.33 6.34 .00 MATH Accountability2016 D0491 D0491 ‐ Eudora District Aggregate ALL Self‐Paid Lunch only 15.86 44.09 30.81 9.22 .00 MATH Accountability2016 0 State of Kansas District Aggregate ALL Self‐Paid Lunch only 15.82 36.75 31.98 15.43 .00 MATH Accountability2016 D0499 D0499 ‐ Galena District Aggregate ALL Self‐Paid Lunch only 15.70 48.76 27.27 8.26 .00 MATH Accountability2016 D0251 D0251 ‐ North Lyon County District Aggregate ALL Self‐Paid Lunch only 15.51 39.65 36.20 8.62 .00 MATH Accountability2016 D0263 D0263 ‐ Mulvane District Aggregate ALL Self‐Paid Lunch only 15.51 49.61 27.01 7.85 .00 MATH Accountability2016 D0496 D0496 ‐ Pawnee Heights District Aggregate ALL Self‐Paid Lunch only 15.38 46.15 30.76 7.69 .00 MATH Accountability2016 D0461 D0461 ‐ Neodesha District Aggregate ALL Self‐Paid Lunch only 15.27 46.52 26.38 11.80 .00 MATH Accountability2016 D0469 D0469 ‐ Lansing District Aggregate ALL Self‐Paid Lunch only 15.27 46.12 28.34 10.25 .00 MATH Accountability2016 D0356 D0356 ‐ Conway Springs District Aggregate ALL Self‐Paid Lunch only 15.13 51.97 30.26 2.63 .00 MATH Accountability2016 D0374 D0374 ‐ Sublette District Aggregate ALL Self‐Paid Lunch only 14.92 49.25 26.86 8.95 .00 MATH Accountability2016 D0430 D0430 ‐ South Brown CountDistrict Aggregate ALL Self‐Paid Lunch only 14.89 39.36 29.78 15.95 .00 MATH Accountability2016 D0379 D0379 ‐ Clay Center District Aggregate ALL Self‐Paid Lunch only 14.82 42.21 30.15 12.81 .00 MATH Accountability2016 D0410 D0410 ‐ Durham‐Hillsboro‐LDistrict Aggregate ALL Self‐Paid Lunch only 14.67 32.06 36.95 16.30 .00 MATH Accountability2016 D0416 D0416 ‐ Louisburg District Aggregate ALL Self‐Paid Lunch only 14.66 40.33 32.01 12.97 .00 MATH Accountability2016 D0408 D0408 ‐ Marion‐Florence District Aggregate ALL Self‐Paid Lunch only 14.59 32.84 30.65 21.89 .00 MATH Accountability2016 D0489 D0489 ‐ Hays District Aggregate ALL Self‐Paid Lunch only 14.58 34.30 34.88 16.21 .00 MATH Accountability2016 D0368 D0368 ‐ Paola District Aggregate ALL Self‐Paid Lunch only 14.57 42.16 31.97 11.28 .00 MATH Accountability2016 D0375 D0375 ‐ Circle District Aggregate ALL Self‐Paid Lunch only 14.50 35.56 35.98 13.94 .00 MATH Accountability2016 D0378 D0378 ‐ Riley County District Aggregate ALL Self‐Paid Lunch only 14.46 35.12 33.47 16.94 .00 MATH Accountability2016 D0112 D0112 ‐ Central Plains District Aggregate ALL Self‐Paid Lunch only 14.40 38.13 33.05 14.40 .00 MATH Accountability2016 D0206 D0206 ‐ Remington‐WhitewDistrict Aggregate ALL Self‐Paid Lunch only 14.37 42.51 30.53 12.57 .00 MATH Accountability2016 D0353 D0353 ‐ Wellington District Aggregate ALL Self‐Paid Lunch only 14.32 28.65 40.40 16.61 .00 MATH Accountability2016 D0266 D0266 ‐ Maize District Aggregate ALL Self‐Paid Lunch only 14.29 34.73 34.96 16.00 .00 MATH Accountability2016 D0200 D0200 ‐ Greeley County SchDistrict Aggregate ALL Self‐Paid Lunch only 14.28 44.89 36.73 4.08 .00 MATH Accountability2016 D0211 D0211 ‐ Norton CommunityDistrict Aggregate ALL Self‐Paid Lunch only 14.28 39.40 34.97 11.33 .00 MATH Accountability2016 D0355 D0355 ‐ Ellinwood Public ScDistrict Aggregate ALL Self‐Paid Lunch only 14.28 41.55 35.06 9.09 .00 MATH Accountability2016 D0419 D0419 ‐ Canton‐Galva District Aggregate ALL Self‐Paid Lunch only 14.28 48.73 26.05 10.92 .00 MATH Accountability2016 D0432 D0432 ‐ Victoria District Aggregate ALL Self‐Paid Lunch only 14.28 43.75 35.71 6.25 .00 MATH Accountability2016 D0439 D0439 ‐ Sedgwick Public SchDistrict Aggregate ALL Self‐Paid Lunch only 14.28 37.50 32.73 15.47 .00 MATH Accountability2016 D0492 D0492 ‐ Flinthills District Aggregate ALL Self‐Paid Lunch only 14.28 44.04 27.38 14.28 .00 MATH Accountability2016 D0203 D0203 ‐ Piper‐Kansas City District Aggregate ALL Self‐Paid Lunch only 14.21 33.96 36.89 14.92 .00 MATH Accountability2016 D0253 D0253 ‐ Emporia District Aggregate ALL Self‐Paid Lunch only 14.14 38.04 33.41 14.38 .00 MATH Accountability2016 D0413 D0413 ‐ Chanute Public Sch District Aggregate ALL Self‐Paid Lunch only 14.12 37.67 31.30 16.89 .00 MATH Accountability2016 D0366 D0366 ‐ Woodson District Aggregate ALL Self‐Paid Lunch only 14.11 43.52 28.23 14.11 .00 MATH Accountability2016 D0325 D0325 ‐ Phillipsburg District Aggregate ALL Self‐Paid Lunch only 14.08 45.07 26.76 14.08 .00 MATH Accountability2016 D0497 D0497 ‐ Lawrence District Aggregate ALL Self‐Paid Lunch only 14.03 31.23 34.04 20.68 .00 MATH Accountability2016 D0371 D0371 ‐ Montezuma District Aggregate ALL Self‐Paid Lunch only 13.95 32.55 39.53 13.95 .00 MATH Accountability2016 D0444 D0444 ‐ Little River District Aggregate ALL Self‐Paid Lunch only 13.91 33.91 37.39 14.78 .00 MATH Accountability
Data from: http://ksreportcard.ksde.org/2015_2016_Assessment_Full_File.xlsx991380
2017ADEQ00482
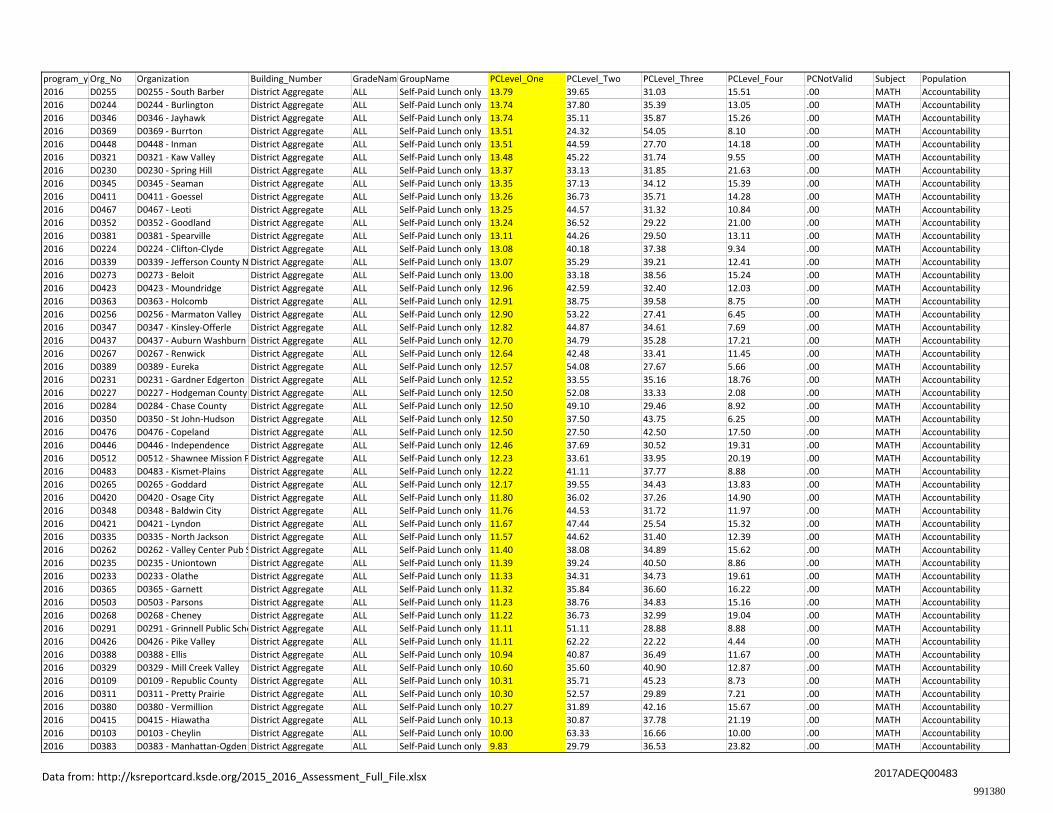
program_y Org_No Organization Building_Number GradeNam GroupName PCLevel_One PCLevel_Two PCLevel_Three PCLevel_Four PCNotValid Subject Population2016 D0255 D0255 ‐ South Barber District Aggregate ALL Self‐Paid Lunch only 13.79 39.65 31.03 15.51 .00 MATH Accountability2016 D0244 D0244 ‐ Burlington District Aggregate ALL Self‐Paid Lunch only 13.74 37.80 35.39 13.05 .00 MATH Accountability2016 D0346 D0346 ‐ Jayhawk District Aggregate ALL Self‐Paid Lunch only 13.74 35.11 35.87 15.26 .00 MATH Accountability2016 D0369 D0369 ‐ Burrton District Aggregate ALL Self‐Paid Lunch only 13.51 24.32 54.05 8.10 .00 MATH Accountability2016 D0448 D0448 ‐ Inman District Aggregate ALL Self‐Paid Lunch only 13.51 44.59 27.70 14.18 .00 MATH Accountability2016 D0321 D0321 ‐ Kaw Valley District Aggregate ALL Self‐Paid Lunch only 13.48 45.22 31.74 9.55 .00 MATH Accountability2016 D0230 D0230 ‐ Spring Hill District Aggregate ALL Self‐Paid Lunch only 13.37 33.13 31.85 21.63 .00 MATH Accountability2016 D0345 D0345 ‐ Seaman District Aggregate ALL Self‐Paid Lunch only 13.35 37.13 34.12 15.39 .00 MATH Accountability2016 D0411 D0411 ‐ Goessel District Aggregate ALL Self‐Paid Lunch only 13.26 36.73 35.71 14.28 .00 MATH Accountability2016 D0467 D0467 ‐ Leoti District Aggregate ALL Self‐Paid Lunch only 13.25 44.57 31.32 10.84 .00 MATH Accountability2016 D0352 D0352 ‐ Goodland District Aggregate ALL Self‐Paid Lunch only 13.24 36.52 29.22 21.00 .00 MATH Accountability2016 D0381 D0381 ‐ Spearville District Aggregate ALL Self‐Paid Lunch only 13.11 44.26 29.50 13.11 .00 MATH Accountability2016 D0224 D0224 ‐ Clifton‐Clyde District Aggregate ALL Self‐Paid Lunch only 13.08 40.18 37.38 9.34 .00 MATH Accountability2016 D0339 D0339 ‐ Jefferson County N District Aggregate ALL Self‐Paid Lunch only 13.07 35.29 39.21 12.41 .00 MATH Accountability2016 D0273 D0273 ‐ Beloit District Aggregate ALL Self‐Paid Lunch only 13.00 33.18 38.56 15.24 .00 MATH Accountability2016 D0423 D0423 ‐ Moundridge District Aggregate ALL Self‐Paid Lunch only 12.96 42.59 32.40 12.03 .00 MATH Accountability2016 D0363 D0363 ‐ Holcomb District Aggregate ALL Self‐Paid Lunch only 12.91 38.75 39.58 8.75 .00 MATH Accountability2016 D0256 D0256 ‐ Marmaton Valley District Aggregate ALL Self‐Paid Lunch only 12.90 53.22 27.41 6.45 .00 MATH Accountability2016 D0347 D0347 ‐ Kinsley‐Offerle District Aggregate ALL Self‐Paid Lunch only 12.82 44.87 34.61 7.69 .00 MATH Accountability2016 D0437 D0437 ‐ Auburn Washburn District Aggregate ALL Self‐Paid Lunch only 12.70 34.79 35.28 17.21 .00 MATH Accountability2016 D0267 D0267 ‐ Renwick District Aggregate ALL Self‐Paid Lunch only 12.64 42.48 33.41 11.45 .00 MATH Accountability2016 D0389 D0389 ‐ Eureka District Aggregate ALL Self‐Paid Lunch only 12.57 54.08 27.67 5.66 .00 MATH Accountability2016 D0231 D0231 ‐ Gardner Edgerton District Aggregate ALL Self‐Paid Lunch only 12.52 33.55 35.16 18.76 .00 MATH Accountability2016 D0227 D0227 ‐ Hodgeman County District Aggregate ALL Self‐Paid Lunch only 12.50 52.08 33.33 2.08 .00 MATH Accountability2016 D0284 D0284 ‐ Chase County District Aggregate ALL Self‐Paid Lunch only 12.50 49.10 29.46 8.92 .00 MATH Accountability2016 D0350 D0350 ‐ St John‐Hudson District Aggregate ALL Self‐Paid Lunch only 12.50 37.50 43.75 6.25 .00 MATH Accountability2016 D0476 D0476 ‐ Copeland District Aggregate ALL Self‐Paid Lunch only 12.50 27.50 42.50 17.50 .00 MATH Accountability2016 D0446 D0446 ‐ Independence District Aggregate ALL Self‐Paid Lunch only 12.46 37.69 30.52 19.31 .00 MATH Accountability2016 D0512 D0512 ‐ Shawnee Mission PDistrict Aggregate ALL Self‐Paid Lunch only 12.23 33.61 33.95 20.19 .00 MATH Accountability2016 D0483 D0483 ‐ Kismet‐Plains District Aggregate ALL Self‐Paid Lunch only 12.22 41.11 37.77 8.88 .00 MATH Accountability2016 D0265 D0265 ‐ Goddard District Aggregate ALL Self‐Paid Lunch only 12.17 39.55 34.43 13.83 .00 MATH Accountability2016 D0420 D0420 ‐ Osage City District Aggregate ALL Self‐Paid Lunch only 11.80 36.02 37.26 14.90 .00 MATH Accountability2016 D0348 D0348 ‐ Baldwin City District Aggregate ALL Self‐Paid Lunch only 11.76 44.53 31.72 11.97 .00 MATH Accountability2016 D0421 D0421 ‐ Lyndon District Aggregate ALL Self‐Paid Lunch only 11.67 47.44 25.54 15.32 .00 MATH Accountability2016 D0335 D0335 ‐ North Jackson District Aggregate ALL Self‐Paid Lunch only 11.57 44.62 31.40 12.39 .00 MATH Accountability2016 D0262 D0262 ‐ Valley Center Pub SDistrict Aggregate ALL Self‐Paid Lunch only 11.40 38.08 34.89 15.62 .00 MATH Accountability2016 D0235 D0235 ‐ Uniontown District Aggregate ALL Self‐Paid Lunch only 11.39 39.24 40.50 8.86 .00 MATH Accountability2016 D0233 D0233 ‐ Olathe District Aggregate ALL Self‐Paid Lunch only 11.33 34.31 34.73 19.61 .00 MATH Accountability2016 D0365 D0365 ‐ Garnett District Aggregate ALL Self‐Paid Lunch only 11.32 35.84 36.60 16.22 .00 MATH Accountability2016 D0503 D0503 ‐ Parsons District Aggregate ALL Self‐Paid Lunch only 11.23 38.76 34.83 15.16 .00 MATH Accountability2016 D0268 D0268 ‐ Cheney District Aggregate ALL Self‐Paid Lunch only 11.22 36.73 32.99 19.04 .00 MATH Accountability2016 D0291 D0291 ‐ Grinnell Public SchoDistrict Aggregate ALL Self‐Paid Lunch only 11.11 51.11 28.88 8.88 .00 MATH Accountability2016 D0426 D0426 ‐ Pike Valley District Aggregate ALL Self‐Paid Lunch only 11.11 62.22 22.22 4.44 .00 MATH Accountability2016 D0388 D0388 ‐ Ellis District Aggregate ALL Self‐Paid Lunch only 10.94 40.87 36.49 11.67 .00 MATH Accountability2016 D0329 D0329 ‐ Mill Creek Valley District Aggregate ALL Self‐Paid Lunch only 10.60 35.60 40.90 12.87 .00 MATH Accountability2016 D0109 D0109 ‐ Republic County District Aggregate ALL Self‐Paid Lunch only 10.31 35.71 45.23 8.73 .00 MATH Accountability2016 D0311 D0311 ‐ Pretty Prairie District Aggregate ALL Self‐Paid Lunch only 10.30 52.57 29.89 7.21 .00 MATH Accountability2016 D0380 D0380 ‐ Vermillion District Aggregate ALL Self‐Paid Lunch only 10.27 31.89 42.16 15.67 .00 MATH Accountability2016 D0415 D0415 ‐ Hiawatha District Aggregate ALL Self‐Paid Lunch only 10.13 30.87 37.78 21.19 .00 MATH Accountability2016 D0103 D0103 ‐ Cheylin District Aggregate ALL Self‐Paid Lunch only 10.00 63.33 16.66 10.00 .00 MATH Accountability2016 D0383 D0383 ‐ Manhattan‐Ogden District Aggregate ALL Self‐Paid Lunch only 9.83 29.79 36.53 23.82 .00 MATH Accountability
Data from: http://ksreportcard.ksde.org/2015_2016_Assessment_Full_File.xlsx991380
2017ADEQ00483

program_y Org_No Organization Building_Number GradeNam GroupName PCLevel_One PCLevel_Two PCLevel_Three PCLevel_Four PCNotValid Subject Population2016 D0223 D0223 ‐ Barnes District Aggregate ALL Self‐Paid Lunch only 9.72 48.61 26.38 15.27 .00 MATH Accountability2016 D0477 D0477 ‐ Ingalls District Aggregate ALL Self‐Paid Lunch only 9.67 37.09 33.87 19.35 .00 MATH Accountability2016 D0482 D0482 ‐ Dighton District Aggregate ALL Self‐Paid Lunch only 9.67 38.70 32.25 19.35 .00 MATH Accountability2016 D0474 D0474 ‐ Haviland District Aggregate ALL Self‐Paid Lunch only 9.52 14.28 42.85 33.33 .00 MATH Accountability2016 D0506 D0506 ‐ Labette County District Aggregate ALL Self‐Paid Lunch only 9.48 39.36 38.50 12.64 .00 MATH Accountability2016 D0115 D0115 ‐ Nemaha Central District Aggregate ALL Self‐Paid Lunch only 9.42 38.74 34.03 17.80 .00 MATH Accountability2016 D0460 D0460 ‐ Hesston District Aggregate ALL Self‐Paid Lunch only 9.26 34.18 37.69 18.84 .00 MATH Accountability2016 D0215 D0215 ‐ Lakin District Aggregate ALL Self‐Paid Lunch only 9.23 40.00 38.46 12.30 .00 MATH Accountability2016 D0107 D0107 ‐ Rock Hills District Aggregate ALL Self‐Paid Lunch only 9.09 43.63 30.90 16.36 .00 MATH Accountability2016 D0239 D0239 ‐ North Ottawa CounDistrict Aggregate ALL Self‐Paid Lunch only 9.09 43.18 34.65 13.06 .00 MATH Accountability2016 D0282 D0282 ‐ West Elk District Aggregate ALL Self‐Paid Lunch only 8.82 35.29 45.58 10.29 .00 MATH Accountability2016 D0338 D0338 ‐ Valley Falls District Aggregate ALL Self‐Paid Lunch only 8.51 48.93 35.10 7.44 .00 MATH Accountability2016 D0232 D0232 ‐ De Soto District Aggregate ALL Self‐Paid Lunch only 8.32 33.21 37.25 21.20 .00 MATH Accountability2016 D0385 D0385 ‐ Andover District Aggregate ALL Self‐Paid Lunch only 8.25 28.81 37.35 25.57 .00 MATH Accountability2016 D0241 D0241 ‐ Wallace County SchDistrict Aggregate ALL Self‐Paid Lunch only 7.93 34.92 39.68 17.46 .00 MATH Accountability2016 D0502 D0502 ‐ Lewis District Aggregate ALL Self‐Paid Lunch only 7.69 61.53 23.07 7.69 .00 MATH Accountability2016 D0504 D0504 ‐ Oswego District Aggregate ALL Self‐Paid Lunch only 7.69 43.58 34.61 14.10 .00 MATH Accountability2016 D0113 D0113 ‐ Prairie Hills District Aggregate ALL Self‐Paid Lunch only 7.61 31.23 38.84 22.30 .00 MATH Accountability2016 D0110 D0110 ‐ Thunder Ridge SchoDistrict Aggregate ALL Self‐Paid Lunch only 7.50 45.00 37.50 10.00 .00 MATH Accountability2016 D0292 D0292 ‐ Wheatland District Aggregate ALL Self‐Paid Lunch only 7.14 57.14 21.42 14.28 .00 MATH Accountability2016 D0229 D0229 ‐ Blue Valley District Aggregate ALL Self‐Paid Lunch only 6.87 27.53 38.50 27.08 .00 MATH Accountability2016 D0336 D0336 ‐ Holton District Aggregate ALL Self‐Paid Lunch only 6.86 31.34 40.00 21.79 .00 MATH Accountability2016 D0372 D0372 ‐ Silver Lake District Aggregate ALL Self‐Paid Lunch only 6.80 31.63 40.47 21.08 .00 MATH Accountability2016 D0207 D0207 ‐ Ft Leavenworth District Aggregate ALL Self‐Paid Lunch only 6.72 32.95 38.88 21.43 .00 MATH Accountability2016 D0102 D0102 ‐ Cimarron‐Ensign District Aggregate ALL Self‐Paid Lunch only 6.59 44.50 41.20 7.69 .00 MATH Accountability2016 D0359 D0359 ‐ Argonia Public SchoDistrict Aggregate ALL Self‐Paid Lunch only 6.52 43.47 39.13 10.86 .00 MATH Accountability2016 D0323 D0323 ‐ Rock Creek District Aggregate ALL Self‐Paid Lunch only 6.11 36.11 39.72 18.05 .00 MATH Accountability2016 D0212 D0212 ‐ Northern Valley District Aggregate ALL Self‐Paid Lunch only 5.55 44.44 38.88 11.11 .00 MATH Accountability2016 D0298 D0298 ‐ Lincoln District Aggregate ALL Self‐Paid Lunch only 5.55 51.38 34.72 8.33 .00 MATH Accountability2016 D0392 D0392 ‐ Osborne County District Aggregate ALL Self‐Paid Lunch only 4.61 33.84 32.30 29.23 .00 MATH Accountability2016 D0275 D0275 ‐ Triplains District Aggregate ALL Self‐Paid Lunch only .00 22.22 50.00 27.77 .00 MATH Accountability2016 D0390 D0390 ‐ Hamilton District Aggregate ALL Self‐Paid Lunch only .00 47.05 52.94 .00 .00 MATH Accountability
Data from: http://ksreportcard.ksde.org/2015_2016_Assessment_Full_File.xlsx991380
2017ADEQ00484

program_y Org_No Organization Building_Number GradeNam GroupName PCLevel_One PCLevel_Two PCLevel_Three PCLevel_Four PCNotValid Subject Population2016 D0291 D0291 ‐ Grinnell Public SchoDistrict Aggregate ALL Free Lunch only 66.66 16.66 16.66 .00 .00 ELA Accountability2016 D0314 D0314 ‐ Brewster District Aggregate ALL Free Lunch only 64.28 21.42 14.28 .00 .00 ELA Accountability2016 D0479 D0479 ‐ Crest District Aggregate ALL Free Lunch only 60.00 24.44 11.11 4.44 .00 ELA Accountability2016 D0500 D0500 ‐ Kansas City District Aggregate ALL Free Lunch only 53.64 31.68 12.78 1.88 .00 ELA Accountability2016 D0398 D0398 ‐ Peabody‐Burns District Aggregate ALL Free Lunch only 51.28 35.89 12.82 .00 .00 ELA Accountability2016 D0468 D0468 ‐ Healy Public Schoo District Aggregate ALL Free Lunch only 50.00 21.42 21.42 7.14 .00 ELA Accountability2016 D0453 D0453 ‐ Leavenworth District Aggregate ALL Free Lunch only 49.72 29.59 17.93 2.75 .00 ELA Accountability2016 D0111 D0111 ‐ Doniphan West SchDistrict Aggregate ALL Free Lunch only 48.33 31.66 18.33 1.66 .00 ELA Accountability2016 D0501 D0501 ‐ Topeka Public SchoDistrict Aggregate ALL Free Lunch only 48.02 35.14 14.63 2.16 .02 ELA Accountability2016 D0401 D0401 ‐ Chase‐Raymond District Aggregate ALL Free Lunch only 47.16 32.07 16.98 3.77 .00 ELA Accountability2016 D0509 D0509 ‐ South Haven District Aggregate ALL Free Lunch only 46.42 35.71 14.28 3.57 .00 ELA Accountability2016 D0214 D0214 ‐ Ulysses District Aggregate ALL Free Lunch only 46.28 37.87 15.09 .74 .00 ELA Accountability2016 D0404 D0404 ‐ Riverton District Aggregate ALL Free Lunch only 45.16 29.67 20.64 4.51 .00 ELA Accountability2016 D0259 D0259 ‐ Wichita District Aggregate ALL Free Lunch only 44.88 36.06 16.32 2.72 .00 ELA Accountability2016 D0403 D0403 ‐ Otis‐Bison District Aggregate ALL Free Lunch only 44.82 17.24 27.58 10.34 .00 ELA Accountability2016 D0387 D0387 ‐ Altoona‐Midway District Aggregate ALL Free Lunch only 43.75 33.33 22.91 .00 .00 ELA Accountability2016 D0208 D0208 ‐ Wakeeney District Aggregate ALL Free Lunch only 43.10 37.93 12.06 6.89 .00 ELA Accountability2016 D0202 D0202 ‐ Turner‐Kansas City District Aggregate ALL Free Lunch only 43.04 36.01 18.00 2.92 .00 ELA Accountability2016 D0200 D0200 ‐ Greeley County SchDistrict Aggregate ALL Free Lunch only 42.85 32.65 16.32 8.16 .00 ELA Accountability2016 D0483 D0483 ‐ Kismet‐Plains District Aggregate ALL Free Lunch only 42.79 40.25 14.40 2.54 .00 ELA Accountability2016 D0271 D0271 ‐ Stockton District Aggregate ALL Free Lunch only 42.25 26.76 25.35 5.63 .00 ELA Accountability2016 D0377 D0377 ‐ Atchison Co Comm District Aggregate ALL Free Lunch only 41.52 29.66 22.03 6.77 .00 ELA Accountability2016 D0480 D0480 ‐ Liberal District Aggregate ALL Free Lunch only 41.25 40.35 16.12 2.26 .00 ELA Accountability2016 D0382 D0382 ‐ Pratt District Aggregate ALL Free Lunch only 41.14 41.14 15.31 2.39 .00 ELA Accountability2016 D0310 D0310 ‐ Fairfield District Aggregate ALL Free Lunch only 40.78 40.78 13.15 5.26 .00 ELA Accountability2016 D0443 D0443 ‐ Dodge City District Aggregate ALL Free Lunch only 40.41 38.89 17.99 2.69 .00 ELA Accountability2016 D0101 D0101 ‐ Erie‐Galesburg District Aggregate ALL Free Lunch only 40.32 37.09 19.35 3.22 .00 ELA Accountability2016 D0457 D0457 ‐ Garden City District Aggregate ALL Free Lunch only 40.29 41.65 15.99 2.05 .00 ELA Accountability2016 D0114 D0114 ‐ Riverside District Aggregate ALL Free Lunch only 40.15 39.37 19.68 .78 .00 ELA Accountability2016 D0216 D0216 ‐ Deerfield District Aggregate ALL Free Lunch only 40.00 42.00 14.00 4.00 .00 ELA Accountability2016 D0430 D0430 ‐ South Brown CountDistrict Aggregate ALL Free Lunch only 39.73 37.08 21.85 1.32 .00 ELA Accountability2016 D0315 D0315 ‐ Colby Public SchoolDistrict Aggregate ALL Free Lunch only 39.51 32.25 25.00 3.22 .00 ELA Accountability2016 D0444 D0444 ‐ Little River District Aggregate ALL Free Lunch only 39.39 30.30 27.27 3.03 .00 ELA Accountability2016 D0349 D0349 ‐ Stafford District Aggregate ALL Free Lunch only 39.21 45.09 13.72 1.96 .00 ELA Accountability2016 D0217 D0217 ‐ Rolla District Aggregate ALL Free Lunch only 39.13 26.08 26.08 8.69 .00 ELA Accountability2016 D0210 D0210 ‐ Hugoton Public SchDistrict Aggregate ALL Free Lunch only 38.69 42.17 16.52 2.60 .00 ELA Accountability2016 D0220 D0220 ‐ Ashland District Aggregate ALL Free Lunch only 38.23 35.29 23.52 2.94 .00 ELA Accountability2016 D0209 D0209 ‐ Moscow Public Sch District Aggregate ALL Free Lunch only 37.83 43.24 16.21 2.70 .00 ELA Accountability2016 D0418 D0418 ‐ McPherson District Aggregate ALL Free Lunch only 37.58 39.54 17.64 5.22 .00 ELA Accountability2016 D0409 D0409 ‐ Atchison Public SchDistrict Aggregate ALL Free Lunch only 37.55 44.20 15.23 3.00 .00 ELA Accountability2016 D0341 D0341 ‐ Oskaloosa Public ScDistrict Aggregate ALL Free Lunch only 37.38 42.05 17.75 2.80 .00 ELA Accountability2016 D0338 D0338 ‐ Valley Falls District Aggregate ALL Free Lunch only 37.28 35.59 23.72 3.38 .00 ELA Accountability2016 D0452 D0452 ‐ Stanton County District Aggregate ALL Free Lunch only 37.25 44.11 13.72 4.90 .00 ELA Accountability2016 0 State of Kansas District Aggregate ALL Free Lunch only 37.17 38.34 20.69 3.78 .00 ELA Accountability2016 D0464 D0464 ‐ Tonganoxie District Aggregate ALL Free Lunch only 36.97 39.49 20.16 3.36 .00 ELA Accountability2016 D0300 D0300 ‐ Comanche County District Aggregate ALL Free Lunch only 36.84 34.21 21.05 7.89 .00 ELA Accountability2016 D0234 D0234 ‐ Fort Scott District Aggregate ALL Free Lunch only 36.78 41.18 19.16 2.86 .00 ELA Accountability2016 D0462 D0462 ‐ Central District Aggregate ALL Free Lunch only 36.76 39.70 22.05 1.47 .00 ELA Accountability2016 D0306 D0306 ‐ Southeast Of SalineDistrict Aggregate ALL Free Lunch only 36.73 34.69 26.53 2.04 .00 ELA Accountability2016 D0286 D0286 ‐ Chautauqua Co ComDistrict Aggregate ALL Free Lunch only 36.55 41.93 20.43 1.07 .00 ELA Accountability2016 D0225 D0225 ‐ Fowler District Aggregate ALL Free Lunch only 36.36 42.42 21.21 .00 .00 ELA Accountability
Data from: http://ksreportcard.ksde.org/2015_2016_Assessment_Full_File.xlsx
Free Lunch Students: Reading (ELA) - Sorted by Percent Level One (Not on Grade Level)
991380
2017ADEQ00485

program_y Org_No Organization Building_Number GradeNam GroupName PCLevel_One PCLevel_Two PCLevel_Three PCLevel_Four PCNotValid Subject Population2016 D0269 D0269 ‐ Palco District Aggregate ALL Free Lunch only 36.36 36.36 22.72 4.54 .00 ELA Accountability2016 D0449 D0449 ‐ Easton District Aggregate ALL Free Lunch only 36.36 36.36 21.59 5.68 .00 ELA Accountability2016 D0373 D0373 ‐ Newton District Aggregate ALL Free Lunch only 36.29 37.85 21.04 4.80 .00 ELA Accountability2016 D0287 D0287 ‐ West Franklin District Aggregate ALL Free Lunch only 36.27 40.19 19.60 3.92 .00 ELA Accountability2016 D0243 D0243 ‐ Lebo‐Waverly District Aggregate ALL Free Lunch only 36.23 34.78 26.08 2.89 .00 ELA Accountability2016 D0337 D0337 ‐ Royal Valley District Aggregate ALL Free Lunch only 36.04 40.11 18.02 5.81 .00 ELA Accountability2016 D0461 D0461 ‐ Neodesha District Aggregate ALL Free Lunch only 35.58 39.26 20.24 4.90 .00 ELA Accountability2016 D0505 D0505 ‐ Chetopa‐St. Paul District Aggregate ALL Free Lunch only 35.35 37.37 25.25 2.02 .00 ELA Accountability2016 D0440 D0440 ‐ Halstead District Aggregate ALL Free Lunch only 35.29 32.77 26.89 5.04 .00 ELA Accountability2016 D0336 D0336 ‐ Holton District Aggregate ALL Free Lunch only 35.13 40.00 21.62 3.24 .00 ELA Accountability2016 D0508 D0508 ‐ Baxter Springs District Aggregate ALL Free Lunch only 35.12 42.29 18.63 3.94 .00 ELA Accountability2016 D0330 D0330 ‐ Mission Valley District Aggregate ALL Free Lunch only 34.84 28.78 34.84 1.51 .00 ELA Accountability2016 D0308 D0308 ‐ Hutchinson Public SDistrict Aggregate ALL Free Lunch only 34.80 36.45 24.23 4.50 .00 ELA Accountability2016 D0294 D0294 ‐ Oberlin District Aggregate ALL Free Lunch only 34.78 47.82 17.39 .00 .00 ELA Accountability2016 D0257 D0257 ‐ Iola District Aggregate ALL Free Lunch only 34.75 38.71 22.86 3.65 .00 ELA Accountability2016 D0352 D0352 ‐ Goodland District Aggregate ALL Free Lunch only 34.68 34.68 23.12 7.51 .00 ELA Accountability2016 D0106 D0106 ‐ Western Plains District Aggregate ALL Free Lunch only 34.48 48.27 17.24 .00 .00 ELA Accountability2016 D0283 D0283 ‐ Elk Valley District Aggregate ALL Free Lunch only 34.48 44.82 20.68 .00 .00 ELA Accountability2016 D0284 D0284 ‐ Chase County District Aggregate ALL Free Lunch only 34.48 37.93 27.58 .00 .00 ELA Accountability2016 D0355 D0355 ‐ Ellinwood Public ScDistrict Aggregate ALL Free Lunch only 34.48 33.33 28.73 3.44 .00 ELA Accountability2016 D0353 D0353 ‐ Wellington District Aggregate ALL Free Lunch only 34.40 39.54 22.82 3.21 .00 ELA Accountability2016 D0362 D0362 ‐ Prairie View District Aggregate ALL Free Lunch only 34.33 36.74 25.30 3.61 .00 ELA Accountability2016 D0258 D0258 ‐ Humboldt District Aggregate ALL Free Lunch only 34.30 31.38 26.27 8.02 .00 ELA Accountability2016 D0343 D0343 ‐ Perry Public School District Aggregate ALL Free Lunch only 34.28 31.42 30.47 3.80 .00 ELA Accountability2016 D0422 D0422 ‐ Kiowa County District Aggregate ALL Free Lunch only 34.28 31.42 31.42 2.85 .00 ELA Accountability2016 D0205 D0205 ‐ Bluestem District Aggregate ALL Free Lunch only 34.26 44.75 19.58 1.39 .00 ELA Accountability2016 D0250 D0250 ‐ Pittsburg District Aggregate ALL Free Lunch only 34.22 35.75 23.37 6.64 .00 ELA Accountability2016 D0494 D0494 ‐ Syracuse District Aggregate ALL Free Lunch only 34.14 43.90 20.32 1.62 .00 ELA Accountability2016 D0459 D0459 ‐ Bucklin District Aggregate ALL Free Lunch only 34.09 47.72 18.18 .00 .00 ELA Accountability2016 D0420 D0420 ‐ Osage City District Aggregate ALL Free Lunch only 34.07 35.55 27.40 2.96 .00 ELA Accountability2016 D0334 D0334 ‐ Southern Cloud District Aggregate ALL Free Lunch only 34.04 44.68 17.02 4.25 .00 ELA Accountability2016 D0273 D0273 ‐ Beloit District Aggregate ALL Free Lunch only 33.94 33.02 30.27 2.75 .00 ELA Accountability2016 D0428 D0428 ‐ Great Bend District Aggregate ALL Free Lunch only 33.76 44.98 18.41 2.83 .00 ELA Accountability2016 D0512 D0512 ‐ Shawnee Mission PDistrict Aggregate ALL Free Lunch only 33.74 38.60 22.97 4.67 .00 ELA Accountability2016 D0342 D0342 ‐ McLouth District Aggregate ALL Free Lunch only 33.72 38.37 26.74 1.16 .00 ELA Accountability2016 D0344 D0344 ‐ Pleasanton District Aggregate ALL Free Lunch only 33.69 44.56 20.65 1.08 .00 ELA Accountability2016 D0340 D0340 ‐ Jefferson West District Aggregate ALL Free Lunch only 33.68 45.26 17.89 3.15 .00 ELA Accountability2016 D0484 D0484 ‐ Fredonia District Aggregate ALL Free Lunch only 33.58 45.03 19.08 2.29 .00 ELA Accountability2016 D0361 D0361 ‐ Chaparral Schools District Aggregate ALL Free Lunch only 33.49 36.84 25.35 4.30 .00 ELA Accountability2016 D0320 D0320 ‐ Wamego District Aggregate ALL Free Lunch only 33.33 45.57 19.04 2.04 .00 ELA Accountability2016 D0392 D0392 ‐ Osborne County District Aggregate ALL Free Lunch only 33.33 37.50 20.83 8.33 .00 ELA Accountability2016 D0290 D0290 ‐ Ottawa District Aggregate ALL Free Lunch only 33.10 44.42 19.42 3.04 .00 ELA Accountability2016 D0470 D0470 ‐ Arkansas City District Aggregate ALL Free Lunch only 33.01 41.37 22.23 3.36 .00 ELA Accountability2016 D0233 D0233 ‐ Olathe District Aggregate ALL Free Lunch only 32.86 41.13 22.39 3.59 .00 ELA Accountability2016 D0204 D0204 ‐ Bonner Springs District Aggregate ALL Free Lunch only 32.82 42.03 21.68 3.45 .00 ELA Accountability2016 D0358 D0358 ‐ Oxford District Aggregate ALL Free Lunch only 32.60 47.82 17.39 2.17 .00 ELA Accountability2016 D0490 D0490 ‐ El Dorado District Aggregate ALL Free Lunch only 32.58 43.10 20.05 4.26 .00 ELA Accountability2016 D0115 D0115 ‐ Nemaha Central District Aggregate ALL Free Lunch only 32.55 44.18 18.60 4.65 .00 ELA Accountability2016 D0360 D0360 ‐ Caldwell District Aggregate ALL Free Lunch only 32.55 44.18 16.27 6.97 .00 ELA Accountability2016 D0366 D0366 ‐ Woodson District Aggregate ALL Free Lunch only 32.52 39.02 22.76 5.69 .00 ELA Accountability2016 D0246 D0246 ‐ Northeast District Aggregate ALL Free Lunch only 32.37 45.32 18.70 3.59 .00 ELA Accountability
Data from: http://ksreportcard.ksde.org/2015_2016_Assessment_Full_File.xlsx991380
2017ADEQ00486

program_y Org_No Organization Building_Number GradeNam GroupName PCLevel_One PCLevel_Two PCLevel_Three PCLevel_Four PCNotValid Subject Population2016 D0446 D0446 ‐ Independence District Aggregate ALL Free Lunch only 32.32 39.19 24.44 4.04 .00 ELA Accountability2016 D0497 D0497 ‐ Lawrence District Aggregate ALL Free Lunch only 32.24 37.89 24.32 5.54 .00 ELA Accountability2016 D0262 D0262 ‐ Valley Center Pub SDistrict Aggregate ALL Free Lunch only 32.21 38.25 23.93 5.59 .00 ELA Accountability2016 D0367 D0367 ‐ Osawatomie District Aggregate ALL Free Lunch only 32.04 46.12 20.07 1.76 .00 ELA Accountability2016 D0447 D0447 ‐ Cherryvale District Aggregate ALL Free Lunch only 32.01 41.66 24.12 2.19 .00 ELA Accountability2016 D0223 D0223 ‐ Barnes District Aggregate ALL Free Lunch only 32.00 32.00 24.00 12.00 .00 ELA Accountability2016 D0429 D0429 ‐ Troy Public SchoolsDistrict Aggregate ALL Free Lunch only 32.00 40.00 24.00 4.00 .00 ELA Accountability2016 D0475 D0475 ‐ Geary County Scho District Aggregate ALL Free Lunch only 31.79 38.79 25.01 4.38 .00 ELA Accountability2016 D0299 D0299 ‐ Sylvan Grove District Aggregate ALL Free Lunch only 31.70 36.58 29.26 2.43 .00 ELA Accountability2016 D0218 D0218 ‐ Elkhart District Aggregate ALL Free Lunch only 31.66 36.11 24.44 7.77 .00 ELA Accountability2016 D0396 D0396 ‐ Douglass Public SchDistrict Aggregate ALL Free Lunch only 31.63 30.61 33.67 4.08 .00 ELA Accountability2016 D0492 D0492 ‐ Flinthills District Aggregate ALL Free Lunch only 31.57 50.00 15.78 2.63 .00 ELA Accountability2016 D0469 D0469 ‐ Lansing District Aggregate ALL Free Lunch only 31.53 41.53 21.92 5.00 .00 ELA Accountability2016 D0431 D0431 ‐ Hoisington District Aggregate ALL Free Lunch only 31.41 40.38 25.00 3.20 .00 ELA Accountability2016 D0285 D0285 ‐ Cedar Vale District Aggregate ALL Free Lunch only 31.37 41.17 21.56 5.88 .00 ELA Accountability2016 D0256 D0256 ‐ Marmaton Valley District Aggregate ALL Free Lunch only 31.34 52.23 13.43 2.98 .00 ELA Accountability2016 D0274 D0274 ‐ Oakley District Aggregate ALL Free Lunch only 31.25 31.25 29.68 7.81 .00 ELA Accountability2016 D0303 D0303 ‐ Ness City District Aggregate ALL Free Lunch only 31.25 47.91 14.58 6.25 .00 ELA Accountability2016 D0335 D0335 ‐ North Jackson District Aggregate ALL Free Lunch only 31.25 32.81 29.68 6.25 .00 ELA Accountability2016 D0402 D0402 ‐ Augusta District Aggregate ALL Free Lunch only 31.25 37.76 26.56 4.42 .00 ELA Accountability2016 D0253 D0253 ‐ Emporia District Aggregate ALL Free Lunch only 31.08 40.47 23.70 4.74 .00 ELA Accountability2016 D0410 D0410 ‐ Durham‐Hillsboro‐LDistrict Aggregate ALL Free Lunch only 31.08 47.29 14.86 6.75 .00 ELA Accountability2016 D0507 D0507 ‐ Satanta District Aggregate ALL Free Lunch only 31.03 37.93 28.73 2.29 .00 ELA Accountability2016 D0388 D0388 ‐ Ellis District Aggregate ALL Free Lunch only 30.95 33.33 35.71 .00 .00 ELA Accountability2016 D0240 D0240 ‐ Twin Valley District Aggregate ALL Free Lunch only 30.76 42.85 20.87 5.49 .00 ELA Accountability2016 D0390 D0390 ‐ Hamilton District Aggregate ALL Free Lunch only 30.76 23.07 42.30 3.84 .00 ELA Accountability2016 D0305 D0305 ‐ Salina District Aggregate ALL Free Lunch only 30.75 39.39 24.18 5.66 .00 ELA Accountability2016 D0356 D0356 ‐ Conway Springs District Aggregate ALL Free Lunch only 30.64 38.70 22.58 8.06 .00 ELA Accountability2016 D0407 D0407 ‐ Russell County District Aggregate ALL Free Lunch only 30.46 43.70 22.51 3.31 .00 ELA Accountability2016 D0270 D0270 ‐ Plainville District Aggregate ALL Free Lunch only 30.43 50.00 17.39 2.17 .00 ELA Accountability2016 D0374 D0374 ‐ Sublette District Aggregate ALL Free Lunch only 30.43 40.00 25.21 4.34 .00 ELA Accountability2016 D0397 D0397 ‐ Centre District Aggregate ALL Free Lunch only 30.43 34.78 30.43 4.34 .00 ELA Accountability2016 D0399 D0399 ‐ Paradise District Aggregate ALL Free Lunch only 30.43 43.47 21.73 4.34 .00 ELA Accountability2016 D0456 D0456 ‐ Marais Des Cygnes District Aggregate ALL Free Lunch only 30.35 41.07 21.42 7.14 .00 ELA Accountability2016 D0476 D0476 ‐ Copeland District Aggregate ALL Free Lunch only 30.30 57.57 9.09 3.03 .00 ELA Accountability2016 D0230 D0230 ‐ Spring Hill District Aggregate ALL Free Lunch only 30.08 40.97 22.34 6.59 .00 ELA Accountability2016 D0260 D0260 ‐ Derby District Aggregate ALL Free Lunch only 30.01 39.72 25.44 4.81 .00 ELA Accountability2016 D0499 D0499 ‐ Galena District Aggregate ALL Free Lunch only 29.91 42.85 23.21 4.01 .00 ELA Accountability2016 D0450 D0450 ‐ Shawnee Heights District Aggregate ALL Free Lunch only 29.90 40.00 25.14 4.95 .00 ELA Accountability2016 D0506 D0506 ‐ Labette County District Aggregate ALL Free Lunch only 29.88 34.91 29.88 5.32 .00 ELA Accountability2016 D0364 D0364 ‐ Marysville District Aggregate ALL Free Lunch only 29.80 36.53 30.76 2.88 .00 ELA Accountability2016 D0224 D0224 ‐ Clifton‐Clyde District Aggregate ALL Free Lunch only 29.72 54.05 10.81 5.40 .00 ELA Accountability2016 D0394 D0394 ‐ Rose Hill Public SchDistrict Aggregate ALL Free Lunch only 29.69 38.78 23.63 7.87 .00 ELA Accountability2016 D0345 D0345 ‐ Seaman District Aggregate ALL Free Lunch only 29.54 38.98 27.62 3.84 .00 ELA Accountability2016 D0368 D0368 ‐ Paola District Aggregate ALL Free Lunch only 29.43 35.81 30.49 4.25 .00 ELA Accountability2016 D0437 D0437 ‐ Auburn Washburn District Aggregate ALL Free Lunch only 29.43 37.27 27.64 5.63 .00 ELA Accountability2016 D0110 D0110 ‐ Thunder Ridge SchoDistrict Aggregate ALL Free Lunch only 29.41 35.29 33.33 1.96 .00 ELA Accountability2016 D0241 D0241 ‐ Wallace County SchDistrict Aggregate ALL Free Lunch only 29.41 29.41 23.52 17.64 .00 ELA Accountability2016 D0381 D0381 ‐ Spearville District Aggregate ALL Free Lunch only 29.41 41.17 23.52 5.88 .00 ELA Accountability2016 D0254 D0254 ‐ Barber County NortDistrict Aggregate ALL Free Lunch only 29.31 39.65 24.13 6.89 .00 ELA Accountability2016 D0400 D0400 ‐ Smoky Valley District Aggregate ALL Free Lunch only 29.09 50.00 15.45 5.45 .00 ELA Accountability
Data from: http://ksreportcard.ksde.org/2015_2016_Assessment_Full_File.xlsx991380
2017ADEQ00487

program_y Org_No Organization Building_Number GradeNam GroupName PCLevel_One PCLevel_Two PCLevel_Three PCLevel_Four PCNotValid Subject Population2016 D0239 D0239 ‐ North Ottawa CounDistrict Aggregate ALL Free Lunch only 29.03 45.16 19.35 6.45 .00 ELA Accountability2016 D0298 D0298 ‐ Lincoln District Aggregate ALL Free Lunch only 29.03 33.87 33.87 3.22 .00 ELA Accountability2016 D0445 D0445 ‐ Coffeyville District Aggregate ALL Free Lunch only 28.91 44.77 22.12 4.18 .00 ELA Accountability2016 D0331 D0331 ‐ Kingman ‐ Norwich District Aggregate ALL Free Lunch only 28.75 39.86 26.79 4.57 .00 ELA Accountability2016 D0333 D0333 ‐ Concordia District Aggregate ALL Free Lunch only 28.73 43.10 22.41 5.74 .00 ELA Accountability2016 D0107 D0107 ‐ Rock Hills District Aggregate ALL Free Lunch only 28.57 42.85 25.00 3.57 .00 ELA Accountability2016 D0282 D0282 ‐ West Elk District Aggregate ALL Free Lunch only 28.57 48.57 20.00 2.85 .00 ELA Accountability2016 D0395 D0395 ‐ LaCrosse District Aggregate ALL Free Lunch only 28.57 42.85 25.39 3.17 .00 ELA Accountability2016 D0436 D0436 ‐ Caney Valley District Aggregate ALL Free Lunch only 28.57 41.66 28.57 1.19 .00 ELA Accountability2016 D0454 D0454 ‐ Burlingame Public SDistrict Aggregate ALL Free Lunch only 28.57 47.61 22.22 1.58 .00 ELA Accountability2016 D0498 D0498 ‐ Valley Heights District Aggregate ALL Free Lunch only 28.57 31.16 32.46 7.79 .00 ELA Accountability2016 D0465 D0465 ‐ Winfield District Aggregate ALL Free Lunch only 28.51 41.50 25.15 4.82 .00 ELA Accountability2016 D0313 D0313 ‐ Buhler District Aggregate ALL Free Lunch only 28.45 40.84 27.04 3.66 .00 ELA Accountability2016 D0323 D0323 ‐ Rock Creek District Aggregate ALL Free Lunch only 28.31 40.70 25.66 5.30 .00 ELA Accountability2016 D0339 D0339 ‐ Jefferson County N District Aggregate ALL Free Lunch only 28.30 37.73 30.18 3.77 .00 ELA Accountability2016 D0261 D0261 ‐ Haysville District Aggregate ALL Free Lunch only 28.21 39.58 26.80 5.39 .00 ELA Accountability2016 D0491 D0491 ‐ Eudora District Aggregate ALL Free Lunch only 28.08 40.00 26.80 5.10 .00 ELA Accountability2016 D0307 D0307 ‐ Ell‐Saline District Aggregate ALL Free Lunch only 28.07 49.12 19.29 3.50 .00 ELA Accountability2016 D0405 D0405 ‐ Lyons District Aggregate ALL Free Lunch only 28.04 45.52 21.13 5.28 .00 ELA Accountability2016 D0386 D0386 ‐ Madison‐Virgil District Aggregate ALL Free Lunch only 28.00 44.00 26.00 2.00 .00 ELA Accountability2016 D0435 D0435 ‐ Abilene District Aggregate ALL Free Lunch only 27.91 42.04 25.79 4.24 .00 ELA Accountability2016 D0348 D0348 ‐ Baldwin City District Aggregate ALL Free Lunch only 27.89 40.52 26.84 4.73 .00 ELA Accountability2016 D0327 D0327 ‐ Ellsworth District Aggregate ALL Free Lunch only 27.84 39.24 21.51 11.39 .00 ELA Accountability2016 D0206 D0206 ‐ Remington‐WhitewDistrict Aggregate ALL Free Lunch only 27.77 36.11 31.94 4.16 .00 ELA Accountability2016 D0379 D0379 ‐ Clay Center District Aggregate ALL Free Lunch only 27.72 44.05 24.75 3.46 .00 ELA Accountability2016 D0263 D0263 ‐ Mulvane District Aggregate ALL Free Lunch only 27.65 44.32 24.11 3.90 .00 ELA Accountability2016 D0434 D0434 ‐ Santa Fe Trail District Aggregate ALL Free Lunch only 27.65 35.10 28.72 8.51 .00 ELA Accountability2016 D0487 D0487 ‐ Herington District Aggregate ALL Free Lunch only 27.61 38.09 29.52 4.76 .00 ELA Accountability2016 D0293 D0293 ‐ Quinter Public SchoDistrict Aggregate ALL Free Lunch only 27.58 34.48 27.58 10.34 .00 ELA Accountability2016 D0493 D0493 ‐ Columbus District Aggregate ALL Free Lunch only 27.56 47.02 23.24 2.16 .00 ELA Accountability2016 D0252 D0252 ‐ Southern Lyon Cou District Aggregate ALL Free Lunch only 27.53 39.13 27.53 5.79 .00 ELA Accountability2016 D0321 D0321 ‐ Kaw Valley District Aggregate ALL Free Lunch only 27.51 44.96 22.81 4.69 .00 ELA Accountability2016 D0477 D0477 ‐ Ingalls District Aggregate ALL Free Lunch only 27.50 42.50 25.00 5.00 .00 ELA Accountability2016 D0503 D0503 ‐ Parsons District Aggregate ALL Free Lunch only 27.35 39.70 28.23 4.70 .00 ELA Accountability2016 D0383 D0383 ‐ Manhattan‐Ogden District Aggregate ALL Free Lunch only 27.30 37.90 27.76 7.02 .00 ELA Accountability2016 D0105 D0105 ‐ Rawlins County District Aggregate ALL Free Lunch only 27.27 34.54 32.72 5.45 .00 ELA Accountability2016 D0248 D0248 ‐ Girard District Aggregate ALL Free Lunch only 27.27 42.72 24.54 5.45 .00 ELA Accountability2016 D0458 D0458 ‐ Basehor‐Linwood District Aggregate ALL Free Lunch only 27.27 46.10 22.72 3.89 .00 ELA Accountability2016 D0495 D0495 ‐ Ft Larned District Aggregate ALL Free Lunch only 27.27 50.56 20.45 1.70 .00 ELA Accountability2016 D0309 D0309 ‐ Nickerson District Aggregate ALL Free Lunch only 27.23 42.80 25.29 4.66 .00 ELA Accountability2016 D0264 D0264 ‐ Clearwater District Aggregate ALL Free Lunch only 26.95 36.17 33.33 3.54 .00 ELA Accountability2016 D0255 D0255 ‐ South Barber District Aggregate ALL Free Lunch only 26.92 61.53 11.53 .00 .00 ELA Accountability2016 D0417 D0417 ‐ Morris County District Aggregate ALL Free Lunch only 26.92 41.34 25.00 6.73 .00 ELA Accountability2016 D0496 D0496 ‐ Pawnee Heights District Aggregate ALL Free Lunch only 26.92 30.76 30.76 11.53 .00 ELA Accountability2016 D0439 D0439 ‐ Sedgwick Public SchDistrict Aggregate ALL Free Lunch only 26.86 31.34 32.83 8.95 .00 ELA Accountability2016 D0212 D0212 ‐ Northern Valley District Aggregate ALL Free Lunch only 26.66 53.33 20.00 .00 .00 ELA Accountability2016 D0463 D0463 ‐ Udall District Aggregate ALL Free Lunch only 26.66 44.44 17.77 11.11 .00 ELA Accountability2016 D0489 D0489 ‐ Hays District Aggregate ALL Free Lunch only 26.56 42.41 24.77 6.25 .00 ELA Accountability2016 D0103 D0103 ‐ Cheylin District Aggregate ALL Free Lunch only 26.47 41.17 29.41 2.94 .00 ELA Accountability2016 D0369 D0369 ‐ Burrton District Aggregate ALL Free Lunch only 26.15 40.00 27.69 6.15 .00 ELA Accountability2016 D0267 D0267 ‐ Renwick District Aggregate ALL Free Lunch only 26.08 32.60 34.78 6.52 .00 ELA Accountability
Data from: http://ksreportcard.ksde.org/2015_2016_Assessment_Full_File.xlsx991380
2017ADEQ00488

program_y Org_No Organization Building_Number GradeNam GroupName PCLevel_One PCLevel_Two PCLevel_Three PCLevel_Four PCNotValid Subject Population2016 D0365 D0365 ‐ Garnett District Aggregate ALL Free Lunch only 26.06 46.06 25.45 2.42 .00 ELA Accountability2016 D0351 D0351 ‐ Macksville District Aggregate ALL Free Lunch only 26.00 34.00 36.00 4.00 .00 ELA Accountability2016 D0325 D0325 ‐ Phillipsburg District Aggregate ALL Free Lunch only 25.97 40.25 31.16 2.59 .00 ELA Accountability2016 D0203 D0203 ‐ Piper‐Kansas City District Aggregate ALL Free Lunch only 25.92 39.25 25.92 8.88 .00 ELA Accountability2016 D0357 D0357 ‐ Belle Plaine District Aggregate ALL Free Lunch only 25.92 40.74 25.92 7.40 .00 ELA Accountability2016 D0411 D0411 ‐ Goessel District Aggregate ALL Free Lunch only 25.92 25.92 40.74 7.40 .00 ELA Accountability2016 D0266 D0266 ‐ Maize District Aggregate ALL Free Lunch only 25.60 40.24 28.25 5.89 .00 ELA Accountability2016 D0316 D0316 ‐ Golden Plains District Aggregate ALL Free Lunch only 25.58 41.86 30.23 2.32 .00 ELA Accountability2016 D0113 D0113 ‐ Prairie Hills District Aggregate ALL Free Lunch only 25.54 35.03 32.11 7.29 .00 ELA Accountability2016 D0281 D0281 ‐ Graham County District Aggregate ALL Free Lunch only 25.49 41.17 31.37 1.96 .00 ELA Accountability2016 D0219 D0219 ‐ Minneola District Aggregate ALL Free Lunch only 25.45 40.00 21.81 12.72 .00 ELA Accountability2016 D0329 D0329 ‐ Mill Creek Valley District Aggregate ALL Free Lunch only 25.45 38.18 32.72 3.63 .00 ELA Accountability2016 D0231 D0231 ‐ Gardner Edgerton District Aggregate ALL Free Lunch only 25.41 40.94 29.07 4.56 .00 ELA Accountability2016 D0108 D0108 ‐ Washington Co. SchDistrict Aggregate ALL Free Lunch only 25.39 50.79 20.63 3.17 .00 ELA Accountability2016 D0109 D0109 ‐ Republic County District Aggregate ALL Free Lunch only 25.30 37.34 30.12 7.22 .00 ELA Accountability2016 D0215 D0215 ‐ Lakin District Aggregate ALL Free Lunch only 25.00 53.57 19.28 2.14 .00 ELA Accountability2016 D0289 D0289 ‐ Wellsville District Aggregate ALL Free Lunch only 25.00 47.00 20.00 8.00 .00 ELA Accountability2016 D0347 D0347 ‐ Kinsley‐Offerle District Aggregate ALL Free Lunch only 25.00 37.50 33.92 3.57 .00 ELA Accountability2016 D0448 D0448 ‐ Inman District Aggregate ALL Free Lunch only 25.00 34.61 32.69 7.69 .00 ELA Accountability2016 D0466 D0466 ‐ Scott County District Aggregate ALL Free Lunch only 25.00 40.85 30.48 3.65 .00 ELA Accountability2016 D0467 D0467 ‐ Leoti District Aggregate ALL Free Lunch only 24.71 49.43 21.34 4.49 .00 ELA Accountability2016 D0413 D0413 ‐ Chanute Public Sch District Aggregate ALL Free Lunch only 24.63 42.10 27.15 6.10 .00 ELA Accountability2016 D0247 D0247 ‐ Cherokee District Aggregate ALL Free Lunch only 24.54 41.81 30.90 2.72 .00 ELA Accountability2016 D0346 D0346 ‐ Jayhawk District Aggregate ALL Free Lunch only 24.54 39.09 30.90 5.45 .00 ELA Accountability2016 D0211 D0211 ‐ Norton CommunityDistrict Aggregate ALL Free Lunch only 24.52 35.84 28.30 11.32 .00 ELA Accountability2016 D0421 D0421 ‐ Lyndon District Aggregate ALL Free Lunch only 24.48 51.02 24.48 .00 .00 ELA Accountability2016 D0312 D0312 ‐ Haven Public SchooDistrict Aggregate ALL Free Lunch only 24.44 48.14 24.44 2.96 .00 ELA Accountability2016 D0412 D0412 ‐ Hoxie Community SDistrict Aggregate ALL Free Lunch only 24.44 28.88 40.00 6.66 .00 ELA Accountability2016 D0419 D0419 ‐ Canton‐Galva District Aggregate ALL Free Lunch only 24.24 37.87 34.84 3.03 .00 ELA Accountability2016 D0232 D0232 ‐ De Soto District Aggregate ALL Free Lunch only 24.06 41.01 28.47 6.44 .00 ELA Accountability2016 D0226 D0226 ‐ Meade District Aggregate ALL Free Lunch only 24.00 40.00 24.00 12.00 .00 ELA Accountability2016 D0415 D0415 ‐ Hiawatha District Aggregate ALL Free Lunch only 23.80 39.15 31.21 5.82 .00 ELA Accountability2016 D0249 D0249 ‐ Frontenac Public ScDistrict Aggregate ALL Free Lunch only 23.28 41.09 26.71 8.90 .00 ELA Accountability2016 D0288 D0288 ‐ Central Heights District Aggregate ALL Free Lunch only 22.83 41.73 27.55 7.87 .00 ELA Accountability2016 D0102 D0102 ‐ Cimarron‐Ensign District Aggregate ALL Free Lunch only 22.80 47.36 23.68 6.14 .00 ELA Accountability2016 D0504 D0504 ‐ Oswego District Aggregate ALL Free Lunch only 22.80 41.22 27.19 8.77 .00 ELA Accountability2016 D0423 D0423 ‐ Moundridge District Aggregate ALL Free Lunch only 22.72 27.27 40.90 9.09 .00 ELA Accountability2016 D0244 D0244 ‐ Burlington District Aggregate ALL Free Lunch only 22.40 44.00 24.80 8.80 .00 ELA Accountability2016 D0393 D0393 ‐ Solomon District Aggregate ALL Free Lunch only 22.22 53.33 17.77 6.66 .00 ELA Accountability2016 D0350 D0350 ‐ St John‐Hudson District Aggregate ALL Free Lunch only 21.87 59.37 15.62 3.12 .00 ELA Accountability2016 D0481 D0481 ‐ Rural Vista District Aggregate ALL Free Lunch only 21.81 43.63 30.90 3.63 .00 ELA Accountability2016 D0375 D0375 ‐ Circle District Aggregate ALL Free Lunch only 21.71 44.94 29.79 3.53 .00 ELA Accountability2016 D0385 D0385 ‐ Andover District Aggregate ALL Free Lunch only 21.62 36.93 35.73 5.70 .00 ELA Accountability2016 D0251 D0251 ‐ North Lyon County District Aggregate ALL Free Lunch only 21.50 43.01 32.25 3.22 .00 ELA Accountability2016 D0432 D0432 ‐ Victoria District Aggregate ALL Free Lunch only 21.42 53.57 25.00 .00 .00 ELA Accountability2016 D0482 D0482 ‐ Dighton District Aggregate ALL Free Lunch only 21.42 47.61 23.80 7.14 .00 ELA Accountability2016 D0376 D0376 ‐ Sterling District Aggregate ALL Free Lunch only 21.33 41.33 29.33 8.00 .00 ELA Accountability2016 D0227 D0227 ‐ Hodgeman County District Aggregate ALL Free Lunch only 21.21 39.39 36.36 3.03 .00 ELA Accountability2016 D0272 D0272 ‐ Waconda District Aggregate ALL Free Lunch only 21.15 32.69 36.53 9.61 .00 ELA Accountability2016 D0242 D0242 ‐ Weskan District Aggregate ALL Free Lunch only 21.05 36.84 42.10 .00 .00 ELA Accountability2016 D0359 D0359 ‐ Argonia Public SchoDistrict Aggregate ALL Free Lunch only 21.05 52.63 26.31 .00 .00 ELA Accountability
Data from: http://ksreportcard.ksde.org/2015_2016_Assessment_Full_File.xlsx991380
2017ADEQ00489

program_y Org_No Organization Building_Number GradeNam GroupName PCLevel_One PCLevel_Two PCLevel_Three PCLevel_Four PCNotValid Subject Population2016 D0378 D0378 ‐ Riley County District Aggregate ALL Free Lunch only 20.98 41.97 32.09 4.93 .00 ELA Accountability2016 D0112 D0112 ‐ Central Plains District Aggregate ALL Free Lunch only 20.83 40.27 26.38 12.50 .00 ELA Accountability2016 D0265 D0265 ‐ Goddard District Aggregate ALL Free Lunch only 20.52 42.05 29.97 7.44 .00 ELA Accountability2016 D0416 D0416 ‐ Louisburg District Aggregate ALL Free Lunch only 20.26 46.40 26.14 7.18 .00 ELA Accountability2016 D0408 D0408 ‐ Marion‐Florence District Aggregate ALL Free Lunch only 20.23 46.42 29.76 3.57 .00 ELA Accountability2016 D0207 D0207 ‐ Ft Leavenworth District Aggregate ALL Free Lunch only 20.00 55.00 25.00 .00 .00 ELA Accountability2016 D0371 D0371 ‐ Montezuma District Aggregate ALL Free Lunch only 20.00 40.00 33.33 6.66 .00 ELA Accountability2016 D0363 D0363 ‐ Holcomb District Aggregate ALL Free Lunch only 19.82 50.00 26.29 3.87 .00 ELA Accountability2016 D0245 D0245 ‐ LeRoy‐Gridley District Aggregate ALL Free Lunch only 19.35 45.16 32.25 3.22 .00 ELA Accountability2016 D0511 D0511 ‐ Attica District Aggregate ALL Free Lunch only 19.35 58.06 19.35 3.22 .00 ELA Accountability2016 D0229 D0229 ‐ Blue Valley District Aggregate ALL Free Lunch only 19.21 41.33 29.40 10.04 .00 ELA Accountability2016 D0332 D0332 ‐ Cunningham District Aggregate ALL Free Lunch only 19.04 42.85 33.33 4.76 .00 ELA Accountability2016 D0473 D0473 ‐ Chapman District Aggregate ALL Free Lunch only 18.53 47.31 28.29 5.85 .00 ELA Accountability2016 D0380 D0380 ‐ Vermillion District Aggregate ALL Free Lunch only 18.00 42.00 30.00 10.00 .00 ELA Accountability2016 D0426 D0426 ‐ Pike Valley District Aggregate ALL Free Lunch only 18.00 40.00 30.00 12.00 .00 ELA Accountability2016 D0372 D0372 ‐ Silver Lake District Aggregate ALL Free Lunch only 17.64 39.21 31.37 11.76 .00 ELA Accountability2016 D0235 D0235 ‐ Uniontown District Aggregate ALL Free Lunch only 17.52 38.14 37.11 7.21 .00 ELA Accountability2016 D0292 D0292 ‐ Wheatland District Aggregate ALL Free Lunch only 16.66 41.66 41.66 .00 .00 ELA Accountability2016 D0389 D0389 ‐ Eureka District Aggregate ALL Free Lunch only 16.27 49.61 26.35 7.75 .00 ELA Accountability2016 D0311 D0311 ‐ Pretty Prairie District Aggregate ALL Free Lunch only 16.00 48.00 28.00 8.00 .00 ELA Accountability2016 D0237 D0237 ‐ Smith Center District Aggregate ALL Free Lunch only 15.62 40.62 37.50 6.25 .00 ELA Accountability2016 D0460 D0460 ‐ Hesston District Aggregate ALL Free Lunch only 15.29 48.23 31.76 4.70 .00 ELA Accountability2016 D0326 D0326 ‐ Logan District Aggregate ALL Free Lunch only 15.00 70.00 15.00 .00 .00 ELA Accountability2016 D0322 D0322 ‐ Onaga‐Havensville‐District Aggregate ALL Free Lunch only 14.28 45.71 31.42 8.57 .00 ELA Accountability2016 D0384 D0384 ‐ Blue Valley District Aggregate ALL Free Lunch only 14.28 38.09 42.85 4.76 .00 ELA Accountability2016 D0297 D0297 ‐ St Francis Comm ScDistrict Aggregate ALL Free Lunch only 13.15 50.00 34.21 2.63 .00 ELA Accountability2016 D0502 D0502 ‐ Lewis District Aggregate ALL Free Lunch only 12.50 25.00 50.00 12.50 .00 ELA Accountability2016 D0268 D0268 ‐ Cheney District Aggregate ALL Free Lunch only 12.32 47.94 30.13 9.58 .00 ELA Accountability2016 D0471 D0471 ‐ Dexter District Aggregate ALL Free Lunch only 10.71 57.14 28.57 3.57 .00 ELA Accountability2016 D0438 D0438 ‐ Skyline Schools District Aggregate ALL Free Lunch only 9.37 50.00 34.37 6.25 .00 ELA Accountability2016 D0275 D0275 ‐ Triplains District Aggregate ALL Free Lunch only 8.33 41.66 25.00 25.00 .00 ELA Accountability
Data from: http://ksreportcard.ksde.org/2015_2016_Assessment_Full_File.xlsx991380
2017ADEQ00490

program_y Org_No Organization Building_Number GradeNam GroupName PCLevel_One PCLevel_Two PCLevel_Three PCLevel_Four PCNotValid Subject Population2016 D0314 D0314 ‐ Brewster District Aggregate ALL Self‐Paid Lunch only 64.00 20.00 12.00 4.00 .00 ELA Accountability2016 D0500 D0500 ‐ Kansas City District Aggregate ALL Self‐Paid Lunch only 41.94 32.94 20.47 4.62 .00 ELA Accountability2016 D0285 D0285 ‐ Cedar Vale District Aggregate ALL Self‐Paid Lunch only 33.33 19.04 33.33 14.28 .00 ELA Accountability2016 D0205 D0205 ‐ Bluestem District Aggregate ALL Self‐Paid Lunch only 33.04 37.39 24.34 5.21 .00 ELA Accountability2016 D0387 D0387 ‐ Altoona‐Midway District Aggregate ALL Self‐Paid Lunch only 32.35 29.41 26.47 11.76 .00 ELA Accountability2016 D0202 D0202 ‐ Turner‐Kansas City District Aggregate ALL Self‐Paid Lunch only 31.63 38.00 26.32 4.03 .00 ELA Accountability2016 D0398 D0398 ‐ Peabody‐Burns District Aggregate ALL Self‐Paid Lunch only 31.48 40.74 12.96 14.81 .00 ELA Accountability2016 D0303 D0303 ‐ Ness City District Aggregate ALL Self‐Paid Lunch only 29.03 46.77 19.35 4.83 .00 ELA Accountability2016 D0334 D0334 ‐ Southern Cloud District Aggregate ALL Self‐Paid Lunch only 29.03 38.70 25.80 6.45 .00 ELA Accountability2016 D0106 D0106 ‐ Western Plains District Aggregate ALL Self‐Paid Lunch only 28.57 35.71 28.57 7.14 .00 ELA Accountability2016 D0501 D0501 ‐ Topeka Public SchoDistrict Aggregate ALL Self‐Paid Lunch only 28.07 36.02 28.20 7.68 .00 ELA Accountability2016 D0454 D0454 ‐ Burlingame Public SDistrict Aggregate ALL Self‐Paid Lunch only 27.71 33.73 30.12 8.43 .00 ELA Accountability2016 D0316 D0316 ‐ Golden Plains District Aggregate ALL Self‐Paid Lunch only 27.27 30.30 36.36 6.06 .00 ELA Accountability2016 D0399 D0399 ‐ Paradise District Aggregate ALL Self‐Paid Lunch only 27.27 31.81 27.27 13.63 .00 ELA Accountability2016 D0367 D0367 ‐ Osawatomie District Aggregate ALL Self‐Paid Lunch only 27.09 39.40 25.12 8.37 .00 ELA Accountability2016 D0101 D0101 ‐ Erie‐Galesburg District Aggregate ALL Self‐Paid Lunch only 26.85 37.03 25.00 11.11 .00 ELA Accountability2016 D0281 D0281 ‐ Graham County District Aggregate ALL Self‐Paid Lunch only 26.12 38.73 30.63 4.50 .00 ELA Accountability2016 D0479 D0479 ‐ Crest District Aggregate ALL Self‐Paid Lunch only 25.86 36.20 36.20 1.72 .00 ELA Accountability2016 D0452 D0452 ‐ Stanton County District Aggregate ALL Self‐Paid Lunch only 25.71 34.28 32.85 7.14 .00 ELA Accountability2016 D0214 D0214 ‐ Ulysses District Aggregate ALL Self‐Paid Lunch only 25.49 40.72 26.82 6.95 .00 ELA Accountability2016 D0459 D0459 ‐ Bucklin District Aggregate ALL Self‐Paid Lunch only 25.00 43.75 23.43 7.81 .00 ELA Accountability2016 D0271 D0271 ‐ Stockton District Aggregate ALL Self‐Paid Lunch only 24.39 34.14 32.92 8.53 .00 ELA Accountability2016 D0111 D0111 ‐ Doniphan West SchDistrict Aggregate ALL Self‐Paid Lunch only 24.32 43.24 31.08 1.35 .00 ELA Accountability2016 D0453 D0453 ‐ Leavenworth District Aggregate ALL Self‐Paid Lunch only 24.20 33.06 34.49 8.22 .00 ELA Accountability2016 D0505 D0505 ‐ Chetopa‐St. Paul District Aggregate ALL Self‐Paid Lunch only 24.05 37.97 27.84 10.12 .00 ELA Accountability2016 D0509 D0509 ‐ South Haven District Aggregate ALL Self‐Paid Lunch only 23.91 47.82 23.91 4.34 .00 ELA Accountability2016 D0381 D0381 ‐ Spearville District Aggregate ALL Self‐Paid Lunch only 23.77 31.96 32.78 11.47 .00 ELA Accountability2016 D0254 D0254 ‐ Barber County NortDistrict Aggregate ALL Self‐Paid Lunch only 23.62 37.00 29.92 9.44 .00 ELA Accountability2016 D0351 D0351 ‐ Macksville District Aggregate ALL Self‐Paid Lunch only 23.43 32.81 29.68 14.06 .00 ELA Accountability2016 D0462 D0462 ‐ Central District Aggregate ALL Self‐Paid Lunch only 23.21 42.85 32.14 1.78 .00 ELA Accountability2016 D0225 D0225 ‐ Fowler District Aggregate ALL Self‐Paid Lunch only 23.07 34.61 30.76 11.53 .00 ELA Accountability2016 D0269 D0269 ‐ Palco District Aggregate ALL Self‐Paid Lunch only 23.07 34.61 42.30 .00 .00 ELA Accountability2016 D0283 D0283 ‐ Elk Valley District Aggregate ALL Self‐Paid Lunch only 23.07 53.84 23.07 .00 .00 ELA Accountability2016 D0258 D0258 ‐ Humboldt District Aggregate ALL Self‐Paid Lunch only 22.87 30.06 34.64 12.41 .00 ELA Accountability2016 D0326 D0326 ‐ Logan District Aggregate ALL Self‐Paid Lunch only 22.64 33.96 39.62 3.77 .00 ELA Accountability2016 D0299 D0299 ‐ Sylvan Grove District Aggregate ALL Self‐Paid Lunch only 22.38 25.37 44.77 7.46 .00 ELA Accountability2016 D0487 D0487 ‐ Herington District Aggregate ALL Self‐Paid Lunch only 22.35 29.41 36.47 11.76 .00 ELA Accountability2016 D0114 D0114 ‐ Riverside District Aggregate ALL Self‐Paid Lunch only 22.33 41.74 31.06 4.85 .00 ELA Accountability2016 D0209 D0209 ‐ Moscow Public Sch District Aggregate ALL Self‐Paid Lunch only 22.22 51.85 18.51 7.40 .00 ELA Accountability2016 D0287 D0287 ‐ West Franklin District Aggregate ALL Self‐Paid Lunch only 21.78 32.40 34.07 11.73 .00 ELA Accountability2016 D0300 D0300 ‐ Comanche County District Aggregate ALL Self‐Paid Lunch only 21.64 38.14 35.05 5.15 .00 ELA Accountability2016 D0463 D0463 ‐ Udall District Aggregate ALL Self‐Paid Lunch only 21.59 38.63 32.95 6.81 .00 ELA Accountability2016 D0484 D0484 ‐ Fredonia District Aggregate ALL Self‐Paid Lunch only 21.47 36.19 33.12 9.20 .00 ELA Accountability2016 D0217 D0217 ‐ Rolla District Aggregate ALL Self‐Paid Lunch only 21.42 42.85 30.95 4.76 .00 ELA Accountability2016 D0401 D0401 ‐ Chase‐Raymond District Aggregate ALL Self‐Paid Lunch only 21.05 52.63 21.05 5.26 .00 ELA Accountability2016 D0494 D0494 ‐ Syracuse District Aggregate ALL Self‐Paid Lunch only 20.98 39.50 30.86 8.64 .00 ELA Accountability2016 D0309 D0309 ‐ Nickerson District Aggregate ALL Self‐Paid Lunch only 20.90 36.47 34.83 7.78 .00 ELA Accountability2016 D0219 D0219 ‐ Minneola District Aggregate ALL Self‐Paid Lunch only 20.75 22.64 39.62 16.98 .00 ELA Accountability2016 D0255 D0255 ‐ South Barber District Aggregate ALL Self‐Paid Lunch only 20.68 24.13 39.65 15.51 .00 ELA Accountability2016 D0288 D0288 ‐ Central Heights District Aggregate ALL Self‐Paid Lunch only 20.68 32.75 39.65 6.89 .00 ELA Accountability2016 D0349 D0349 ‐ Stafford District Aggregate ALL Self‐Paid Lunch only 20.68 20.68 34.48 24.13 .00 ELA Accountability
Data from: http://ksreportcard.ksde.org/2015_2016_Assessment_Full_File.xlsx
Paid Lunch Students: Reading (ELA) - Sorted by Percent Level One (Not on Grade Level)
991380
2017ADEQ00491

program_y Org_No Organization Building_Number GradeNam GroupName PCLevel_One PCLevel_Two PCLevel_Three PCLevel_Four PCNotValid Subject Population2016 D0377 D0377 ‐ Atchison Co Comm District Aggregate ALL Self‐Paid Lunch only 20.43 41.60 30.65 7.29 .00 ELA Accountability2016 D0431 D0431 ‐ Hoisington District Aggregate ALL Self‐Paid Lunch only 20.37 40.12 32.09 7.40 .00 ELA Accountability2016 D0322 D0322 ‐ Onaga‐Havensville‐District Aggregate ALL Self‐Paid Lunch only 20.27 44.59 28.37 6.75 .00 ELA Accountability2016 D0342 D0342 ‐ McLouth District Aggregate ALL Self‐Paid Lunch only 20.13 30.20 38.25 11.40 .00 ELA Accountability2016 D0291 D0291 ‐ Grinnell Public SchoDistrict Aggregate ALL Self‐Paid Lunch only 20.00 42.22 31.11 6.66 .00 ELA Accountability2016 D0362 D0362 ‐ Prairie View District Aggregate ALL Self‐Paid Lunch only 20.00 37.77 33.33 8.88 .00 ELA Accountability2016 D0358 D0358 ‐ Oxford District Aggregate ALL Self‐Paid Lunch only 19.69 34.84 39.39 6.06 .00 ELA Accountability2016 D0341 D0341 ‐ Oskaloosa Public ScDistrict Aggregate ALL Self‐Paid Lunch only 19.65 41.88 29.91 8.54 .00 ELA Accountability2016 D0438 D0438 ‐ Skyline Schools District Aggregate ALL Self‐Paid Lunch only 19.41 30.09 38.83 11.65 .00 ELA Accountability2016 D0443 D0443 ‐ Dodge City District Aggregate ALL Self‐Paid Lunch only 19.41 38.47 31.02 11.09 .00 ELA Accountability2016 D0397 D0397 ‐ Centre District Aggregate ALL Self‐Paid Lunch only 19.40 37.31 31.34 11.94 .00 ELA Accountability2016 D0330 D0330 ‐ Mission Valley District Aggregate ALL Self‐Paid Lunch only 19.35 45.16 28.38 7.09 .00 ELA Accountability2016 D0366 D0366 ‐ Woodson District Aggregate ALL Self‐Paid Lunch only 19.04 34.52 32.14 14.28 .00 ELA Accountability2016 D0447 D0447 ‐ Cherryvale District Aggregate ALL Self‐Paid Lunch only 18.95 41.83 30.06 9.15 .00 ELA Accountability2016 D0457 D0457 ‐ Garden City District Aggregate ALL Self‐Paid Lunch only 18.90 42.81 30.76 7.50 .00 ELA Accountability2016 D0357 D0357 ‐ Belle Plaine District Aggregate ALL Self‐Paid Lunch only 18.83 39.01 36.77 5.38 .00 ELA Accountability2016 D0315 D0315 ‐ Colby Public SchoolDistrict Aggregate ALL Self‐Paid Lunch only 18.72 39.32 34.83 7.11 .00 ELA Accountability2016 D0466 D0466 ‐ Scott County District Aggregate ALL Self‐Paid Lunch only 18.72 33.70 36.70 10.86 .00 ELA Accountability2016 D0394 D0394 ‐ Rose Hill Public SchDistrict Aggregate ALL Self‐Paid Lunch only 18.66 36.38 32.95 12.00 .00 ELA Accountability2016 D0337 D0337 ‐ Royal Valley District Aggregate ALL Self‐Paid Lunch only 18.60 30.69 35.81 14.88 .00 ELA Accountability2016 D0307 D0307 ‐ Ell‐Saline District Aggregate ALL Self‐Paid Lunch only 18.54 39.07 33.11 9.27 .00 ELA Accountability2016 D0240 D0240 ‐ Twin Valley District Aggregate ALL Self‐Paid Lunch only 18.45 34.52 36.30 10.71 .00 ELA Accountability2016 D0396 D0396 ‐ Douglass Public SchDistrict Aggregate ALL Self‐Paid Lunch only 18.42 36.31 38.94 6.31 .00 ELA Accountability2016 D0382 D0382 ‐ Pratt District Aggregate ALL Self‐Paid Lunch only 18.34 37.05 34.53 10.07 .00 ELA Accountability2016 D0327 D0327 ‐ Ellsworth District Aggregate ALL Self‐Paid Lunch only 18.18 31.55 33.68 16.57 .00 ELA Accountability2016 D0430 D0430 ‐ South Brown CountDistrict Aggregate ALL Self‐Paid Lunch only 18.08 27.65 44.68 9.57 .00 ELA Accountability2016 D0418 D0418 ‐ McPherson District Aggregate ALL Self‐Paid Lunch only 18.02 36.90 35.62 9.44 .00 ELA Accountability2016 D0259 D0259 ‐ Wichita District Aggregate ALL Self‐Paid Lunch only 17.95 33.67 34.95 13.41 .00 ELA Accountability2016 D0456 D0456 ‐ Marais Des Cygnes District Aggregate ALL Self‐Paid Lunch only 17.94 33.33 38.46 10.25 .00 ELA Accountability2016 D0343 D0343 ‐ Perry Public School District Aggregate ALL Self‐Paid Lunch only 17.91 39.58 34.16 8.33 .00 ELA Accountability2016 D0428 D0428 ‐ Great Bend District Aggregate ALL Self‐Paid Lunch only 17.72 36.70 37.34 8.22 .00 ELA Accountability2016 D0294 D0294 ‐ Oberlin District Aggregate ALL Self‐Paid Lunch only 17.70 36.45 31.25 14.58 .00 ELA Accountability2016 D0210 D0210 ‐ Hugoton Public SchDistrict Aggregate ALL Self‐Paid Lunch only 17.67 32.82 38.38 11.11 .00 ELA Accountability2016 D0306 D0306 ‐ Southeast Of SalineDistrict Aggregate ALL Self‐Paid Lunch only 17.60 36.54 35.88 9.96 .00 ELA Accountability2016 D0480 D0480 ‐ Liberal District Aggregate ALL Self‐Paid Lunch only 17.51 39.46 31.92 11.08 .00 ELA Accountability2016 D0108 D0108 ‐ Washington Co. SchDistrict Aggregate ALL Self‐Paid Lunch only 17.50 36.25 38.75 7.50 .00 ELA Accountability2016 D0216 D0216 ‐ Deerfield District Aggregate ALL Self‐Paid Lunch only 17.39 34.78 43.47 4.34 .00 ELA Accountability2016 D0461 D0461 ‐ Neodesha District Aggregate ALL Self‐Paid Lunch only 17.36 40.27 31.25 11.11 .00 ELA Accountability2016 D0402 D0402 ‐ Augusta District Aggregate ALL Self‐Paid Lunch only 17.24 36.58 36.58 9.59 .00 ELA Accountability2016 D0429 D0429 ‐ Troy Public SchoolsDistrict Aggregate ALL Self‐Paid Lunch only 17.20 35.48 33.33 13.97 .00 ELA Accountability2016 D0407 D0407 ‐ Russell County District Aggregate ALL Self‐Paid Lunch only 17.17 37.37 33.33 12.12 .00 ELA Accountability2016 D0475 D0475 ‐ Geary County Scho District Aggregate ALL Self‐Paid Lunch only 17.10 35.02 35.41 12.46 .00 ELA Accountability2016 D0470 D0470 ‐ Arkansas City District Aggregate ALL Self‐Paid Lunch only 16.96 37.33 33.71 11.99 .00 ELA Accountability2016 D0361 D0361 ‐ Chaparral Schools District Aggregate ALL Self‐Paid Lunch only 16.92 33.07 36.15 13.84 .00 ELA Accountability2016 D0331 D0331 ‐ Kingman ‐ Norwich District Aggregate ALL Self‐Paid Lunch only 16.80 38.52 34.01 10.65 .00 ELA Accountability2016 D0409 D0409 ‐ Atchison Public SchDistrict Aggregate ALL Self‐Paid Lunch only 16.79 38.43 35.44 9.32 .00 ELA Accountability2016 D0103 D0103 ‐ Cheylin District Aggregate ALL Self‐Paid Lunch only 16.66 36.66 36.66 10.00 .00 ELA Accountability2016 D0360 D0360 ‐ Caldwell District Aggregate ALL Self‐Paid Lunch only 16.66 54.54 24.24 4.54 .00 ELA Accountability2016 D0499 D0499 ‐ Galena District Aggregate ALL Self‐Paid Lunch only 16.66 40.00 35.00 8.33 .00 ELA Accountability2016 D0204 D0204 ‐ Bonner Springs District Aggregate ALL Self‐Paid Lunch only 16.61 34.75 34.29 14.32 .00 ELA Accountability2016 D0436 D0436 ‐ Caney Valley District Aggregate ALL Self‐Paid Lunch only 16.58 37.30 35.75 10.36 .00 ELA Accountability
Data from: http://ksreportcard.ksde.org/2015_2016_Assessment_Full_File.xlsx991380
2017ADEQ00492

program_y Org_No Organization Building_Number GradeNam GroupName PCLevel_One PCLevel_Two PCLevel_Three PCLevel_Four PCNotValid Subject Population2016 D0270 D0270 ‐ Plainville District Aggregate ALL Self‐Paid Lunch only 16.52 43.80 29.75 9.91 .00 ELA Accountability2016 D0290 D0290 ‐ Ottawa District Aggregate ALL Self‐Paid Lunch only 16.40 38.22 37.25 8.10 .00 ELA Accountability2016 D0261 D0261 ‐ Haysville District Aggregate ALL Self‐Paid Lunch only 16.24 38.49 34.85 10.40 .00 ELA Accountability2016 D0421 D0421 ‐ Lyndon District Aggregate ALL Self‐Paid Lunch only 16.17 33.82 40.44 9.55 .00 ELA Accountability2016 D0264 D0264 ‐ Clearwater District Aggregate ALL Self‐Paid Lunch only 16.16 36.36 39.89 7.57 .00 ELA Accountability2016 D0410 D0410 ‐ Durham‐Hillsboro‐LDistrict Aggregate ALL Self‐Paid Lunch only 16.11 30.00 41.11 12.77 .00 ELA Accountability2016 D0245 D0245 ‐ LeRoy‐Gridley District Aggregate ALL Self‐Paid Lunch only 16.07 48.21 30.35 5.35 .00 ELA Accountability2016 D0226 D0226 ‐ Meade District Aggregate ALL Self‐Paid Lunch only 15.85 37.80 40.24 6.09 .00 ELA Accountability2016 D0465 D0465 ‐ Winfield District Aggregate ALL Self‐Paid Lunch only 15.80 39.72 31.60 12.86 .00 ELA Accountability2016 D0252 D0252 ‐ Southern Lyon Cou District Aggregate ALL Self‐Paid Lunch only 15.75 30.13 43.15 10.95 .00 ELA Accountability2016 D0464 D0464 ‐ Tonganoxie District Aggregate ALL Self‐Paid Lunch only 15.75 36.96 35.24 12.03 .00 ELA Accountability2016 D0467 D0467 ‐ Leoti District Aggregate ALL Self‐Paid Lunch only 15.66 33.73 37.34 13.25 .00 ELA Accountability2016 D0218 D0218 ‐ Elkhart District Aggregate ALL Self‐Paid Lunch only 15.63 42.38 33.74 8.23 .00 ELA Accountability2016 D0483 D0483 ‐ Kismet‐Plains District Aggregate ALL Self‐Paid Lunch only 15.55 38.88 41.11 4.44 .00 ELA Accountability2016 D0379 D0379 ‐ Clay Center District Aggregate ALL Self‐Paid Lunch only 15.53 37.09 34.08 13.28 .00 ELA Accountability2016 D0492 D0492 ‐ Flinthills District Aggregate ALL Self‐Paid Lunch only 15.47 36.90 34.52 13.09 .00 ELA Accountability2016 D0493 D0493 ‐ Columbus District Aggregate ALL Self‐Paid Lunch only 15.45 34.76 45.06 4.72 .00 ELA Accountability2016 D0496 D0496 ‐ Pawnee Heights District Aggregate ALL Self‐Paid Lunch only 15.38 26.92 46.15 11.53 .00 ELA Accountability2016 D0239 D0239 ‐ North Ottawa CounDistrict Aggregate ALL Self‐Paid Lunch only 15.34 31.81 39.77 13.06 .00 ELA Accountability2016 D0311 D0311 ‐ Pretty Prairie District Aggregate ALL Self‐Paid Lunch only 15.30 33.67 44.89 6.12 .00 ELA Accountability2016 D0413 D0413 ‐ Chanute Public Sch District Aggregate ALL Self‐Paid Lunch only 15.27 34.44 36.38 13.88 .00 ELA Accountability2016 D0112 D0112 ‐ Central Plains District Aggregate ALL Self‐Paid Lunch only 15.25 28.81 45.76 10.16 .00 ELA Accountability2016 D0312 D0312 ‐ Haven Public SchooDistrict Aggregate ALL Self‐Paid Lunch only 15.25 36.86 34.32 13.55 .00 ELA Accountability2016 D0308 D0308 ‐ Hutchinson Public SDistrict Aggregate ALL Self‐Paid Lunch only 15.22 31.41 41.42 11.93 .00 ELA Accountability2016 D0511 D0511 ‐ Attica District Aggregate ALL Self‐Paid Lunch only 15.21 39.13 32.60 13.04 .00 ELA Accountability2016 D0235 D0235 ‐ Uniontown District Aggregate ALL Self‐Paid Lunch only 15.18 17.72 60.75 6.32 .00 ELA Accountability2016 D0422 D0422 ‐ Kiowa County District Aggregate ALL Self‐Paid Lunch only 15.18 29.11 40.50 15.18 .00 ELA Accountability2016 D0373 D0373 ‐ Newton District Aggregate ALL Self‐Paid Lunch only 15.17 32.94 37.35 14.52 .00 ELA Accountability2016 D0247 D0247 ‐ Cherokee District Aggregate ALL Self‐Paid Lunch only 15.15 34.34 46.46 4.04 .00 ELA Accountability2016 D0419 D0419 ‐ Canton‐Galva District Aggregate ALL Self‐Paid Lunch only 15.12 35.29 32.77 16.80 .00 ELA Accountability2016 D0445 D0445 ‐ Coffeyville District Aggregate ALL Self‐Paid Lunch only 14.97 33.33 40.57 11.11 .00 ELA Accountability2016 D0320 D0320 ‐ Wamego District Aggregate ALL Self‐Paid Lunch only 14.92 33.79 38.42 12.86 .00 ELA Accountability2016 D0310 D0310 ‐ Fairfield District Aggregate ALL Self‐Paid Lunch only 14.89 38.29 40.42 6.38 .00 ELA Accountability2016 D0439 D0439 ‐ Sedgwick Public SchDistrict Aggregate ALL Self‐Paid Lunch only 14.79 34.31 38.46 12.42 .00 ELA Accountability2016 D0263 D0263 ‐ Mulvane District Aggregate ALL Self‐Paid Lunch only 14.77 41.26 35.70 8.25 .00 ELA Accountability2016 D0490 D0490 ‐ El Dorado District Aggregate ALL Self‐Paid Lunch only 14.74 43.98 29.97 11.30 .00 ELA Accountability2016 D0435 D0435 ‐ Abilene District Aggregate ALL Self‐Paid Lunch only 14.71 31.42 41.39 12.46 .00 ELA Accountability2016 D0293 D0293 ‐ Quinter Public SchoDistrict Aggregate ALL Self‐Paid Lunch only 14.58 25.00 46.87 13.54 .00 ELA Accountability2016 D0333 D0333 ‐ Concordia District Aggregate ALL Self‐Paid Lunch only 14.57 35.22 36.43 13.76 .00 ELA Accountability2016 D0450 D0450 ‐ Shawnee Heights District Aggregate ALL Self‐Paid Lunch only 14.56 33.42 39.67 12.33 .00 ELA Accountability2016 D0340 D0340 ‐ Jefferson West District Aggregate ALL Self‐Paid Lunch only 14.55 33.74 39.00 12.69 .00 ELA Accountability2016 D0208 D0208 ‐ Wakeeney District Aggregate ALL Self‐Paid Lunch only 14.51 34.67 38.70 12.09 .00 ELA Accountability2016 D0417 D0417 ‐ Morris County District Aggregate ALL Self‐Paid Lunch only 14.43 41.23 32.98 11.34 .00 ELA Accountability2016 D0102 D0102 ‐ Cimarron‐Ensign District Aggregate ALL Self‐Paid Lunch only 14.36 32.04 42.54 11.04 .00 ELA Accountability2016 D0241 D0241 ‐ Wallace County SchDistrict Aggregate ALL Self‐Paid Lunch only 14.28 25.39 46.03 14.28 .00 ELA Accountability2016 D0292 D0292 ‐ Wheatland District Aggregate ALL Self‐Paid Lunch only 14.28 21.42 50.00 14.28 .00 ELA Accountability2016 D0344 D0344 ‐ Pleasanton District Aggregate ALL Self‐Paid Lunch only 14.28 41.26 39.68 4.76 .00 ELA Accountability2016 D0468 D0468 ‐ Healy Public Schoo District Aggregate ALL Self‐Paid Lunch only 14.28 42.85 42.85 .00 .00 ELA Accountability2016 D0234 D0234 ‐ Fort Scott District Aggregate ALL Self‐Paid Lunch only 14.21 35.91 41.89 7.98 .00 ELA Accountability2016 D0404 D0404 ‐ Riverton District Aggregate ALL Self‐Paid Lunch only 14.11 45.29 32.94 7.64 .00 ELA Accountability2016 D0335 D0335 ‐ North Jackson District Aggregate ALL Self‐Paid Lunch only 14.04 37.19 33.88 14.87 .00 ELA Accountability
Data from: http://ksreportcard.ksde.org/2015_2016_Assessment_Full_File.xlsx991380
2017ADEQ00493

program_y Org_No Organization Building_Number GradeNam GroupName PCLevel_One PCLevel_Two PCLevel_Three PCLevel_Four PCNotValid Subject Population2016 D0289 D0289 ‐ Wellsville District Aggregate ALL Self‐Paid Lunch only 13.98 34.96 37.76 13.28 .00 ELA Accountability2016 D0286 D0286 ‐ Chautauqua Co ComDistrict Aggregate ALL Self‐Paid Lunch only 13.92 63.29 17.72 5.06 .00 ELA Accountability2016 D0434 D0434 ‐ Santa Fe Trail District Aggregate ALL Self‐Paid Lunch only 13.75 34.94 43.86 7.43 .00 ELA Accountability2016 D0339 D0339 ‐ Jefferson County N District Aggregate ALL Self‐Paid Lunch only 13.72 24.18 44.44 17.64 .00 ELA Accountability2016 D0393 D0393 ‐ Solomon District Aggregate ALL Self‐Paid Lunch only 13.69 43.83 34.24 8.21 .00 ELA Accountability2016 D0364 D0364 ‐ Marysville District Aggregate ALL Self‐Paid Lunch only 13.65 42.43 32.68 11.21 .00 ELA Accountability2016 D0249 D0249 ‐ Frontenac Public ScDistrict Aggregate ALL Self‐Paid Lunch only 13.60 32.65 40.81 12.92 .00 ELA Accountability2016 D0420 D0420 ‐ Osage City District Aggregate ALL Self‐Paid Lunch only 13.58 32.09 41.97 12.34 .00 ELA Accountability2016 D0449 D0449 ‐ Easton District Aggregate ALL Self‐Paid Lunch only 13.55 33.17 41.58 11.68 .00 ELA Accountability2016 D0506 D0506 ‐ Labette County District Aggregate ALL Self‐Paid Lunch only 13.54 33.14 42.36 10.95 .00 ELA Accountability2016 D0353 D0353 ‐ Wellington District Aggregate ALL Self‐Paid Lunch only 13.46 36.96 40.97 8.59 .00 ELA Accountability2016 D0386 D0386 ‐ Madison‐Virgil District Aggregate ALL Self‐Paid Lunch only 13.33 30.00 45.00 11.66 .00 ELA Accountability2016 D0426 D0426 ‐ Pike Valley District Aggregate ALL Self‐Paid Lunch only 13.33 35.55 44.44 6.66 .00 ELA Accountability2016 D0352 D0352 ‐ Goodland District Aggregate ALL Self‐Paid Lunch only 13.24 35.61 38.81 12.32 .00 ELA Accountability2016 D0224 D0224 ‐ Clifton‐Clyde District Aggregate ALL Self‐Paid Lunch only 13.08 28.97 42.99 14.95 .00 ELA Accountability2016 D0446 D0446 ‐ Independence District Aggregate ALL Self‐Paid Lunch only 13.08 33.64 38.62 14.64 .00 ELA Accountability2016 D0248 D0248 ‐ Girard District Aggregate ALL Self‐Paid Lunch only 13.05 36.76 38.48 11.68 .00 ELA Accountability2016 D0273 D0273 ‐ Beloit District Aggregate ALL Self‐Paid Lunch only 13.00 33.18 39.01 14.79 .00 ELA Accountability2016 D0469 D0469 ‐ Lansing District Aggregate ALL Self‐Paid Lunch only 12.98 32.14 40.94 13.92 .00 ELA Accountability2016 D0346 D0346 ‐ Jayhawk District Aggregate ALL Self‐Paid Lunch only 12.97 32.82 41.98 12.21 .00 ELA Accountability2016 D0477 D0477 ‐ Ingalls District Aggregate ALL Self‐Paid Lunch only 12.90 33.87 45.16 8.06 .00 ELA Accountability2016 D0482 D0482 ‐ Dighton District Aggregate ALL Self‐Paid Lunch only 12.90 33.87 32.25 20.96 .00 ELA Accountability2016 D0458 D0458 ‐ Basehor‐Linwood District Aggregate ALL Self‐Paid Lunch only 12.87 32.99 39.13 14.98 .00 ELA Accountability2016 D0498 D0498 ‐ Valley Heights District Aggregate ALL Self‐Paid Lunch only 12.87 31.68 41.58 13.86 .00 ELA Accountability2016 D0347 D0347 ‐ Kinsley‐Offerle District Aggregate ALL Self‐Paid Lunch only 12.82 43.58 33.33 10.25 .00 ELA Accountability2016 D0365 D0365 ‐ Garnett District Aggregate ALL Self‐Paid Lunch only 12.78 28.57 43.23 15.41 .00 ELA Accountability2016 D0403 D0403 ‐ Otis‐Bison District Aggregate ALL Self‐Paid Lunch only 12.72 43.63 36.36 7.27 .00 ELA Accountability2016 D0260 D0260 ‐ Derby District Aggregate ALL Self‐Paid Lunch only 12.69 36.13 38.69 12.47 .00 ELA Accountability2016 D0384 D0384 ‐ Blue Valley District Aggregate ALL Self‐Paid Lunch only 12.69 31.74 44.44 11.11 .00 ELA Accountability2016 0 State of Kansas District Aggregate ALL Self‐Paid Lunch only 12.59 32.27 39.53 15.59 .00 ELA Accountability2016 D0223 D0223 ‐ Barnes District Aggregate ALL Self‐Paid Lunch only 12.50 25.00 41.66 20.83 .00 ELA Accountability2016 D0242 D0242 ‐ Weskan District Aggregate ALL Self‐Paid Lunch only 12.50 50.00 25.00 12.50 .00 ELA Accountability2016 D0272 D0272 ‐ Waconda District Aggregate ALL Self‐Paid Lunch only 12.50 27.27 43.18 17.04 .00 ELA Accountability2016 D0412 D0412 ‐ Hoxie Community SDistrict Aggregate ALL Self‐Paid Lunch only 12.50 35.93 38.28 13.28 .00 ELA Accountability2016 D0432 D0432 ‐ Victoria District Aggregate ALL Self‐Paid Lunch only 12.50 41.07 34.82 11.60 .00 ELA Accountability2016 D0476 D0476 ‐ Copeland District Aggregate ALL Self‐Paid Lunch only 12.50 45.00 32.50 10.00 .00 ELA Accountability2016 D0507 D0507 ‐ Satanta District Aggregate ALL Self‐Paid Lunch only 12.50 39.28 37.50 10.71 .00 ELA Accountability2016 D0313 D0313 ‐ Buhler District Aggregate ALL Self‐Paid Lunch only 12.41 38.48 37.65 11.44 .00 ELA Accountability2016 D0405 D0405 ‐ Lyons District Aggregate ALL Self‐Paid Lunch only 12.38 40.00 36.19 11.42 .00 ELA Accountability2016 D0215 D0215 ‐ Lakin District Aggregate ALL Self‐Paid Lunch only 12.30 38.46 33.07 16.15 .00 ELA Accountability2016 D0508 D0508 ‐ Baxter Springs District Aggregate ALL Self‐Paid Lunch only 12.29 38.54 38.54 10.61 .00 ELA Accountability2016 D0368 D0368 ‐ Paola District Aggregate ALL Self‐Paid Lunch only 12.26 38.05 39.15 10.53 .00 ELA Accountability2016 D0250 D0250 ‐ Pittsburg District Aggregate ALL Self‐Paid Lunch only 12.25 29.36 40.00 18.37 .00 ELA Accountability2016 D0200 D0200 ‐ Greeley County SchDistrict Aggregate ALL Self‐Paid Lunch only 12.24 32.65 44.89 10.20 .00 ELA Accountability2016 D0489 D0489 ‐ Hays District Aggregate ALL Self‐Paid Lunch only 12.14 30.02 41.00 16.82 .00 ELA Accountability2016 D0246 D0246 ‐ Northeast District Aggregate ALL Self‐Paid Lunch only 12.12 40.90 42.42 4.54 .00 ELA Accountability2016 D0495 D0495 ‐ Ft Larned District Aggregate ALL Self‐Paid Lunch only 12.10 37.36 41.05 9.47 .00 ELA Accountability2016 D0220 D0220 ‐ Ashland District Aggregate ALL Self‐Paid Lunch only 12.06 39.65 41.37 6.89 .00 ELA Accountability2016 D0251 D0251 ‐ North Lyon County District Aggregate ALL Self‐Paid Lunch only 12.06 31.89 43.10 12.93 .00 ELA Accountability2016 D0444 D0444 ‐ Little River District Aggregate ALL Self‐Paid Lunch only 12.06 37.93 35.34 14.65 .00 ELA Accountability2016 D0297 D0297 ‐ St Francis Comm ScDistrict Aggregate ALL Self‐Paid Lunch only 12.04 34.93 42.16 10.84 .00 ELA Accountability
Data from: http://ksreportcard.ksde.org/2015_2016_Assessment_Full_File.xlsx991380
2017ADEQ00494

program_y Org_No Organization Building_Number GradeNam GroupName PCLevel_One PCLevel_Two PCLevel_Three PCLevel_Four PCNotValid Subject Population2016 D0376 D0376 ‐ Sterling District Aggregate ALL Self‐Paid Lunch only 12.02 29.11 43.67 15.18 .00 ELA Accountability2016 D0231 D0231 ‐ Gardner Edgerton District Aggregate ALL Self‐Paid Lunch only 12.01 35.42 38.94 13.61 .00 ELA Accountability2016 D0253 D0253 ‐ Emporia District Aggregate ALL Self‐Paid Lunch only 11.87 32.66 40.49 14.96 .00 ELA Accountability2016 D0395 D0395 ‐ LaCrosse District Aggregate ALL Self‐Paid Lunch only 11.82 39.78 35.48 12.90 .00 ELA Accountability2016 D0390 D0390 ‐ Hamilton District Aggregate ALL Self‐Paid Lunch only 11.76 35.29 47.05 5.88 .00 ELA Accountability2016 D0440 D0440 ‐ Halstead District Aggregate ALL Self‐Paid Lunch only 11.61 38.58 40.66 9.12 .00 ELA Accountability2016 D0348 D0348 ‐ Baldwin City District Aggregate ALL Self‐Paid Lunch only 11.57 33.26 42.31 12.84 .00 ELA Accountability2016 D0227 D0227 ‐ Hodgeman County District Aggregate ALL Self‐Paid Lunch only 11.45 30.20 44.79 13.54 .00 ELA Accountability2016 D0262 D0262 ‐ Valley Center Pub SDistrict Aggregate ALL Self‐Paid Lunch only 11.41 34.81 41.32 12.44 .00 ELA Accountability2016 D0400 D0400 ‐ Smoky Valley District Aggregate ALL Self‐Paid Lunch only 11.39 36.39 38.23 13.97 .00 ELA Accountability2016 D0363 D0363 ‐ Holcomb District Aggregate ALL Self‐Paid Lunch only 11.29 40.58 38.49 9.62 .00 ELA Accountability2016 D0113 D0113 ‐ Prairie Hills District Aggregate ALL Self‐Paid Lunch only 11.25 30.89 42.67 15.18 .00 ELA Accountability2016 D0411 D0411 ‐ Goessel District Aggregate ALL Self‐Paid Lunch only 11.22 31.63 38.77 18.36 .00 ELA Accountability2016 D0345 D0345 ‐ Seaman District Aggregate ALL Self‐Paid Lunch only 11.17 33.93 39.39 15.49 .00 ELA Accountability2016 D0305 D0305 ‐ Salina District Aggregate ALL Self‐Paid Lunch only 11.16 34.80 39.15 14.86 .00 ELA Accountability2016 D0212 D0212 ‐ Northern Valley District Aggregate ALL Self‐Paid Lunch only 11.11 22.22 52.77 13.88 .00 ELA Accountability2016 D0275 D0275 ‐ Triplains District Aggregate ALL Self‐Paid Lunch only 11.11 55.55 27.77 5.55 .00 ELA Accountability2016 D0471 D0471 ‐ Dexter District Aggregate ALL Self‐Paid Lunch only 11.11 38.88 44.44 5.55 .00 ELA Accountability2016 D0266 D0266 ‐ Maize District Aggregate ALL Self‐Paid Lunch only 11.00 31.50 41.83 15.65 .00 ELA Accountability2016 D0230 D0230 ‐ Spring Hill District Aggregate ALL Self‐Paid Lunch only 10.98 32.53 37.64 18.82 .00 ELA Accountability2016 D0267 D0267 ‐ Renwick District Aggregate ALL Self‐Paid Lunch only 10.85 36.39 40.57 12.17 .00 ELA Accountability2016 D0105 D0105 ‐ Rawlins County District Aggregate ALL Self‐Paid Lunch only 10.84 36.14 39.75 13.25 .00 ELA Accountability2016 D0211 D0211 ‐ Norton CommunityDistrict Aggregate ALL Self‐Paid Lunch only 10.83 34.97 34.48 19.70 .00 ELA Accountability2016 D0448 D0448 ‐ Inman District Aggregate ALL Self‐Paid Lunch only 10.81 37.16 42.56 9.45 .00 ELA Accountability2016 D0325 D0325 ‐ Phillipsburg District Aggregate ALL Self‐Paid Lunch only 10.79 30.98 47.41 10.79 .00 ELA Accountability2016 D0375 D0375 ‐ Circle District Aggregate ALL Self‐Paid Lunch only 10.58 31.33 45.35 12.73 .00 ELA Accountability2016 D0491 D0491 ‐ Eudora District Aggregate ALL Self‐Paid Lunch only 10.33 34.68 40.95 14.02 .00 ELA Accountability2016 D0282 D0282 ‐ West Elk District Aggregate ALL Self‐Paid Lunch only 10.29 38.23 30.88 20.58 .00 ELA Accountability2016 D0408 D0408 ‐ Marion‐Florence District Aggregate ALL Self‐Paid Lunch only 10.21 32.11 39.41 18.24 .00 ELA Accountability2016 D0268 D0268 ‐ Cheney District Aggregate ALL Self‐Paid Lunch only 10.20 31.29 43.19 15.30 .00 ELA Accountability2016 D0423 D0423 ‐ Moundridge District Aggregate ALL Self‐Paid Lunch only 10.18 34.25 39.81 15.74 .00 ELA Accountability2016 D0321 D0321 ‐ Kaw Valley District Aggregate ALL Self‐Paid Lunch only 10.11 35.39 45.50 8.98 .00 ELA Accountability2016 D0389 D0389 ‐ Eureka District Aggregate ALL Self‐Paid Lunch only 10.06 40.88 37.73 11.32 .00 ELA Accountability2016 D0244 D0244 ‐ Burlington District Aggregate ALL Self‐Paid Lunch only 9.93 33.90 40.75 15.41 .00 ELA Accountability2016 D0332 D0332 ‐ Cunningham District Aggregate ALL Self‐Paid Lunch only 9.80 31.37 39.21 19.60 .00 ELA Accountability2016 D0298 D0298 ‐ Lincoln District Aggregate ALL Self‐Paid Lunch only 9.72 44.44 34.72 11.11 .00 ELA Accountability2016 D0233 D0233 ‐ Olathe District Aggregate ALL Self‐Paid Lunch only 9.70 30.03 41.58 18.67 .00 ELA Accountability2016 D0203 D0203 ‐ Piper‐Kansas City District Aggregate ALL Self‐Paid Lunch only 9.69 29.07 42.43 18.79 .00 ELA Accountability2016 D0257 D0257 ‐ Iola District Aggregate ALL Self‐Paid Lunch only 9.68 32.94 46.51 10.85 .00 ELA Accountability2016 D0512 D0512 ‐ Shawnee Mission PDistrict Aggregate ALL Self‐Paid Lunch only 9.66 27.48 41.40 21.44 .00 ELA Accountability2016 D0460 D0460 ‐ Hesston District Aggregate ALL Self‐Paid Lunch only 9.58 31.94 38.97 19.48 .00 ELA Accountability2016 D0437 D0437 ‐ Auburn Washburn District Aggregate ALL Self‐Paid Lunch only 9.57 29.87 42.26 18.29 .00 ELA Accountability2016 D0474 D0474 ‐ Haviland District Aggregate ALL Self‐Paid Lunch only 9.52 23.80 42.85 23.80 .00 ELA Accountability2016 D0336 D0336 ‐ Holton District Aggregate ALL Self‐Paid Lunch only 9.49 27.59 43.62 19.28 .00 ELA Accountability2016 D0243 D0243 ‐ Lebo‐Waverly District Aggregate ALL Self‐Paid Lunch only 9.43 39.62 39.62 11.32 .00 ELA Accountability2016 D0415 D0415 ‐ Hiawatha District Aggregate ALL Self‐Paid Lunch only 9.25 27.31 44.90 18.51 .00 ELA Accountability2016 D0274 D0274 ‐ Oakley District Aggregate ALL Self‐Paid Lunch only 8.73 34.95 46.60 9.70 .00 ELA Accountability2016 D0378 D0378 ‐ Riley County District Aggregate ALL Self‐Paid Lunch only 8.67 38.84 35.95 16.52 .00 ELA Accountability2016 D0356 D0356 ‐ Conway Springs District Aggregate ALL Self‐Paid Lunch only 8.66 47.33 37.33 6.66 .00 ELA Accountability2016 D0497 D0497 ‐ Lawrence District Aggregate ALL Self‐Paid Lunch only 8.50 27.68 41.35 22.45 .00 ELA Accountability2016 D0416 D0416 ‐ Louisburg District Aggregate ALL Self‐Paid Lunch only 8.30 34.22 41.54 15.91 .00 ELA Accountability
Data from: http://ksreportcard.ksde.org/2015_2016_Assessment_Full_File.xlsx991380
2017ADEQ00495

program_y Org_No Organization Building_Number GradeNam GroupName PCLevel_One PCLevel_Two PCLevel_Three PCLevel_Four PCNotValid Subject Population2016 D0369 D0369 ‐ Burrton District Aggregate ALL Self‐Paid Lunch only 8.10 27.02 45.94 18.91 .00 ELA Accountability2016 D0388 D0388 ‐ Ellis District Aggregate ALL Self‐Paid Lunch only 8.02 35.76 43.79 12.40 .00 ELA Accountability2016 D0109 D0109 ‐ Republic County District Aggregate ALL Self‐Paid Lunch only 7.93 48.41 32.53 11.11 .00 ELA Accountability2016 D0256 D0256 ‐ Marmaton Valley District Aggregate ALL Self‐Paid Lunch only 7.93 47.61 31.74 12.69 .00 ELA Accountability2016 D0265 D0265 ‐ Goddard District Aggregate ALL Self‐Paid Lunch only 7.91 32.46 43.88 15.73 .00 ELA Accountability2016 D0237 D0237 ‐ Smith Center District Aggregate ALL Self‐Paid Lunch only 7.86 34.83 37.07 20.22 .00 ELA Accountability2016 D0350 D0350 ‐ St John‐Hudson District Aggregate ALL Self‐Paid Lunch only 7.81 34.37 50.00 7.81 .00 ELA Accountability2016 D0323 D0323 ‐ Rock Creek District Aggregate ALL Self‐Paid Lunch only 7.79 30.91 46.79 14.48 .00 ELA Accountability2016 D0355 D0355 ‐ Ellinwood Public ScDistrict Aggregate ALL Self‐Paid Lunch only 7.79 38.96 44.15 9.09 .00 ELA Accountability2016 D0392 D0392 ‐ Osborne County District Aggregate ALL Self‐Paid Lunch only 7.69 29.23 40.00 23.07 .00 ELA Accountability2016 D0329 D0329 ‐ Mill Creek Valley District Aggregate ALL Self‐Paid Lunch only 7.57 33.33 45.45 13.63 .00 ELA Accountability2016 D0372 D0372 ‐ Silver Lake District Aggregate ALL Self‐Paid Lunch only 7.48 31.29 43.87 17.34 .00 ELA Accountability2016 D0374 D0374 ‐ Sublette District Aggregate ALL Self‐Paid Lunch only 7.46 40.29 41.79 10.44 .00 ELA Accountability2016 D0115 D0115 ‐ Nemaha Central District Aggregate ALL Self‐Paid Lunch only 7.32 37.17 41.88 13.61 .00 ELA Accountability2016 D0284 D0284 ‐ Chase County District Aggregate ALL Self‐Paid Lunch only 7.14 33.92 44.64 14.28 .00 ELA Accountability2016 D0232 D0232 ‐ De Soto District Aggregate ALL Self‐Paid Lunch only 7.09 30.44 45.17 17.27 .00 ELA Accountability2016 D0371 D0371 ‐ Montezuma District Aggregate ALL Self‐Paid Lunch only 6.97 25.58 55.81 11.62 .00 ELA Accountability2016 D0385 D0385 ‐ Andover District Aggregate ALL Self‐Paid Lunch only 6.83 28.53 44.13 20.50 .00 ELA Accountability2016 D0503 D0503 ‐ Parsons District Aggregate ALL Self‐Paid Lunch only 6.74 29.21 42.13 21.91 .00 ELA Accountability2016 D0383 D0383 ‐ Manhattan‐Ogden District Aggregate ALL Self‐Paid Lunch only 6.59 27.99 43.01 22.39 .00 ELA Accountability2016 D0359 D0359 ‐ Argonia Public SchoDistrict Aggregate ALL Self‐Paid Lunch only 6.52 41.30 39.13 13.04 .00 ELA Accountability2016 D0504 D0504 ‐ Oswego District Aggregate ALL Self‐Paid Lunch only 6.41 35.89 43.58 14.10 .00 ELA Accountability2016 D0338 D0338 ‐ Valley Falls District Aggregate ALL Self‐Paid Lunch only 6.38 41.48 43.61 8.51 .00 ELA Accountability2016 D0473 D0473 ‐ Chapman District Aggregate ALL Self‐Paid Lunch only 6.25 34.92 45.58 13.23 .00 ELA Accountability2016 D0206 D0206 ‐ Remington‐WhitewDistrict Aggregate ALL Self‐Paid Lunch only 5.98 35.32 44.91 13.77 .00 ELA Accountability2016 D0380 D0380 ‐ Vermillion District Aggregate ALL Self‐Paid Lunch only 5.94 25.94 52.97 15.13 .00 ELA Accountability2016 D0207 D0207 ‐ Ft Leavenworth District Aggregate ALL Self‐Paid Lunch only 5.93 20.04 46.73 27.28 .00 ELA Accountability2016 D0107 D0107 ‐ Rock Hills District Aggregate ALL Self‐Paid Lunch only 5.45 41.81 43.63 9.09 .00 ELA Accountability2016 D0229 D0229 ‐ Blue Valley District Aggregate ALL Self‐Paid Lunch only 5.37 23.81 45.41 25.39 .00 ELA Accountability2016 D0110 D0110 ‐ Thunder Ridge SchoDistrict Aggregate ALL Self‐Paid Lunch only 4.87 41.46 41.46 12.19 .00 ELA Accountability2016 D0481 D0481 ‐ Rural Vista District Aggregate ALL Self‐Paid Lunch only 3.17 38.09 53.96 4.76 .00 ELA Accountability2016 D0502 D0502 ‐ Lewis District Aggregate ALL Self‐Paid Lunch only .00 46.15 53.84 .00 .00 ELA Accountability
Data from: http://ksreportcard.ksde.org/2015_2016_Assessment_Full_File.xlsx991380
2017ADEQ00496

Appendix L-1:
Demonstrative Exhibit Regarding State Special Education
Funding
This demonstrative exhibit was created from the publically available data within the KSBE’s July Board Materials (Appx. L-2).

State Special Education Funding of 92% Excess Costs
Data from July 2016 State Board of Education Meeting Materials:http://www.ksde.org/Portals/0/Board/Materials%20%26%20Agendas/JULY%202016%20PACKET%20rfs.pdf 991175
$427
,753
,137
$424
,057
,630
$443
,858
,843
$428
,140
,397
$427
,724
,000
$428
,360
,566
$428
,360
,566
$434
,902
,949
$433
,980
,455
$435
,980
,455
$15,776,665 $17,435,582 $47,524,889
$63,639,085 $59,376,712 $65,235,442 $69,502,544 $57,502,544
$12,000,000 Increase81.5%
$0
$100,000,000
$200,000,000
$300,000,000
$400,000,000
$500,000,000
$600,000,000
2008‐09 2009‐10 2010‐11 2011‐12 2012‐13 2013‐14 2014‐15 2015‐16 2016‐17 2017‐18 Est.
Total State Funding of Excess Costs Increase in SB19 Unfunded to 92% Excess Costs
92% 88.7%92%
88.4% 82.8% 80.1% 80.8% 80% 79.3%
2017ADEQ00299

Appendix L-2:
KSBE’s July Board Materials
These materials of the KSBE are publically available at:http://www.ksde.org/Portals/0/Board/Materials%20%26%20Agendas/JULY%202016%20PACKET%20rfs.pdf. It is appropriate to take judicial notice of the materials, and Plaintiffs respectfully request that this Court do so. K.S.A. 60-409(b)(4); K.S.A. 60-412(c).

DISCUSS FY 2018 AND FY 2019 KSDE BUDGETS
Listed below are options to begin the discussion on recommendations for the FY 2018 and FY 2019 KSDE budgets.
BASE STATE AID PER PUPIL (BSAPP)
History: 2005-06 $ 4,257 2006-07 $ 4,316 2007-08 $4,374 2008-09 $ 4,400
Reduced from $4,433 2009-10 $ 4,012 2010-11 $ 3,937 2011-12 $ 3,780 2012-13 $ 3,838 2013-14 $ 3,838 2014-15 $ 3,852 2015-16 $ 3,852 2016-17 $ 3,852
Additional Cost* Options: 2017-18 $ 3,852 $ 13,100,000
2017-18 $ 4,000 $ 102,120,000 2017-18 $ 4,200 $ 240,120,000 2017-18 $ 4,400 $ 378,120,000 2017-18 $ 4,433 $ 400,890,000 2017-18 $ 4,492 $ 441,600,000 2017-18 $ 4,650 $ 550,620,000
2018-19 $ 100 $ 69,400,000 2018-19 $ 200 $ 138,800,000 2018-19 $ 300 $ 208,200,000 2018-19 $ 400 $ 277,600,000 2018-19 $ 500 $ 347,000,000 2018-19 $ 600 $ 416,400,000 2018-19 $ 700 $ 485,800,000 2018-19 $ 800 $ 555,200,000
*Assumes a BSAPP of $3,852.
Item 13 Attachment
89http://www.ksde.org/Portals/0/Board/Materials%20%26%20Agendas/JULY%202016%20PACKET%20rfs.pdf 9911752017ADEQ00388

SUPPLEMENTAL GENERAL STATE AID (LOCAL OPTION BUDGET)
History: 2008-09 $ 324,145,881 2009-10 $ 339,212,000 (90.0%) 2010-11 $ 339,212,000 (91.7%) 2011-12 $ 339,212,000 (86.1%) 2012-13 $ 339,224,000 (79.0%) 2013-14 $ 339,212,000 (78.0%) 2014-15 $ 448,973,840 (100.0%) 2015-16 $ 450,500,000 (100.0%) 2016-17 $ 460,500,000 (old law) $ 367,600,000 (new law)
Old Law New Law Options: 2017-18 $ 470,500,000 (100.0%) $ 372,000,000
2018-19 $ 480,500,000 (100.0%) $ 375,000,000
CAPITAL OUTLAY STATE AID
History: 2008-09 $ 22,600,000 2009-10 $ 0 2010-11 $ 0 2011-12 $ 0 2012-13 $ 0 2013-14 $ 0 2014-15 $ 28,927,119 2015-16 $ 27,047,902 2016-17 $ 50,780,296 (new law)
Additional Cost Options: 2017-18 KSA 72-8814 Fund law $ 2,000,000
2018-19 Fund Law $ 2,000,000
90http://www.ksde.org/Portals/0/Board/Materials%20%26%20Agendas/JULY%202016%20PACKET%20rfs.pdf 9911752017ADEQ00389

SPECIAL EDUCATION
History: 2008-09 $ 427,753,137 (92.0%) 2009-10 $ 367,540,630 (88.7%) (Rec. $56,517,000-ARRA) 2010-11 $ 389,404,843 (92.0%) (Rec. $54,454,000-ARRA) 2011-12 $ 428,140,397 (88.4%) 2012-13 $ 427,724,000 (82.8%) 2013-14 $ 427,717,000 (80.1%) 2014-15 $ 428,360,566 (80.8%) 2015-16 $ 434,902,949 (80.0%) 2016-17 $ 433,980,455 (79.3%) Additional Cost Options: 2017-18 KSA 72-978 & 978a $ 503,482,999 (92.0%) $ 69,502,544 2017-18 $ 465,174,510 (85.0%) $ 31,194,055 2017-18 $ 433,980,455 (MOE) $ 0 2018-19 $ 513,552,659 (92.0%) $ 79,572,204 2018-19 $ 474,478,000 (85.0%) $ 40,497,545 2018-19 $ 433,980,455 (MOE) $ 0
ALL-DAY KINDERGARTEN
Additional Cost Options: 2017-18 &
2018-19 Implement all at once
$ 90,000,000
2017-18 & 2018-19
Implement over 5-year period
$ 18,000,000 per year
91http://www.ksde.org/Portals/0/Board/Materials%20%26%20Agendas/JULY%202016%20PACKET%20rfs.pdf 9911752017ADEQ00390

PARENTS AS TEACHERS Helps parent become child's first teacher. Improves school readiness and provides screening for undetected health problems, disabilities, and developmental delays. Serve an estimated 18,000 children and parents.
History: 2008-09 $ 7,521,357 2009-10 $ 7,527,019 2010-11 $ 7,359,130 2011-12 $ 7,237,635 2012-13 $ 7,237,635 2013-14 $ 7,237,635 2014-15 $ 7,237,635 2015-16 $ 7,237,635 2016-17 $ 7,237,635 Additional Cost Options: 2017-18 Increase number of children by 1,000 $ 460,000 2017-18 Fund at 2016-17 level 0 2018-19 Increase number of children by 2,000 $ 920,000 2018-19 Fund at 2016-17 level 0
MENTOR TEACHER PROGRAM Voluntary program that provides probationary teachers with three years of professional support and assistance by an on-site mentor.
History: 2008-09 $ 1,650,000 2009-10 $ 1,450,000 2010-11 $ 1,450,000 2011-12 $ 0 2012-13 $ 0 2013-14 $ 0 2014-15 $ 0 2015-16 $ 0 2016-17 $ 0 Additional Cost Options: 2017-18 KSA 72-1412 Fund 100% of law $ 3,000,000 & 2018-19 Fund 50% of law $ 1,500,000
92http://www.ksde.org/Portals/0/Board/Materials%20%26%20Agendas/JULY%202016%20PACKET%20rfs.pdf 9911752017ADEQ00391

PROFESSIONAL DEVELOPMENT State law allows a district to receive state aid up to one-half percent of its general fund budget or 50 percent of its actual expenditures, whichever is less.
History: 2008-09 $ 1,750,000 2009-10 $ 0 2010-11 $ 0 2011-12 $ 0 2012-13 $ 0 2013-14 $ 0 2014-15 $ 0 2015-16 $ 0 2016-17 $ 0 Additional Cost Options: 2017-18 KSA 72-9601 Fund 100% of law $ 8,500,000 & 2018-19 Fund 75% of law $ 6,375,000 Fund 50% of law $ 4,250,000
TRANSPORTATION Legislative study recommended the threshold for computing state aid should be reduced from 2.5 to 1.25 miles.
Additional Cost Options: 2017-18 Decrease mileage limit from 2.5 to 2.0 $ 8,925,000 & 2018-19 Decrease mileage limit from 2.5 to 1.5 $ 17,850,000 Decrease mileage limit from 2.5 to 1.25 $ 21,000,000
93http://www.ksde.org/Portals/0/Board/Materials%20%26%20Agendas/JULY%202016%20PACKET%20rfs.pdf 9911752017ADEQ00392

SCHOOL LUNCH Reimburse local education agencies six cents per school lunch as provided by Kansas law.
History: 2008-09 $ 2,510,486 (4.4 cents per lunch) 2009-10 $ 2,435,171 (4.3 cents per lunch) 2010-11 $ 2,435,171 (4.3 cents per lunch) 2011-12 $ 2,487,458 (4.3 cents per lunch) 2012-13 $ 2,510,486 (4.4 cents per lunch) 2013-14 $ 2,510,486 (4.4 cents per lunch) 2014-15 $ 2,510,429 (4.4 cents per lunch) 2015-16 $ 2,510,429 (4.4 cents per lunch) 2016-17 $ 2,510,429 (4.4 cents per lunch) Additional Cost Options: 2017-18 KSA 72-5112 $ 3,586,000 (6.0 cents per lunch) $ 1,075,571 & 2018-19 2017-18 & 2018-19 Maintenance of Effort $ 0
AGRICULTURE IN THE CLASSROOM
History: 2008-09 $ 35,000 2009-10 $ 35,000 2010-11 $ 35,000 2011-12 $ 0 2012-13 $ 0 2013-14 $ 0 2014-15 $ 0 2015-16 $ 0 2016-17 $ 0 Additional Cost Options: 2017-18 & 2018-19 Fund at 2010-11 level $ 35,000
94http://www.ksde.org/Portals/0/Board/Materials%20%26%20Agendas/JULY%202016%20PACKET%20rfs.pdf 9911752017ADEQ00393

COMMUNITIES IN SCHOOLS
History: 2008-09 $ 35,000 2009-10 $ 35,000 2010-11 $ 35,000 2011-12 $ 0 2012-13 $ 0 2013-14 $ 250,000 2014-15 $ 250,000 2015-16 $ 0 2016-17 $ 0 Additional Cost Options: 2017-18 & 2018-19 Fund at 2014-15 level $ 250,000
KANSAS ASSOCIATION OF CONSERVATION AND ENVIRONMENTAL EDUCATION
History: 2008-09 $ 35,000 2009-10 $ 0 2010-11 $ 0 2011-12 $ 0 2012-13 $ 0 2013-14 $ 0 2014-15 $ 0 2015-16 $ 0 2016-17 $ 0 Additional Cost Options: 2017-18 & 2018-19 Fund at 2008-09 level $ 35,000
95http://www.ksde.org/Portals/0/Board/Materials%20%26%20Agendas/JULY%202016%20PACKET%20rfs.pdf 9911752017ADEQ00394

NATIONAL BOARD CERTIFICATION
History: 2008-09 $ 285,000 2009-10 $ 55,000 (scholarships only) 2010-11 $ 55,000 (scholarships only) 2011-12 $ 50,000 (scholarships only) 2012-13 $ 16,694 2013-14 $ 0 2014-15 $ 217,444 2015-16 $ 228,886 2016-17 $ 327,500 Additional Cost Options: 2017-18 KSA 72-1398 Fund law--$ 375,000 $ 47,500 2017-18 Fund at 2016-17 level 0 2018-19 Fund law--$ 375,000 $ 47,500 2018-19 Fund at 2016-17 level 0
PRE-K PILOT
History: 2009-10 $ 5,000,000 2010-11 $ 4,880,370 2011-12 $ 4,799,812 2012-13 $ 4,799,812 2013-14 $ 4,799,812 2014-15 $ 4,799,812 2015-16 $ 4,799,812 2016-17 $ 4,799,812 Additional Cost Options: 2017-18 & 2018-19 Fund at 2009-10 level $ 200,188 2017-18 & 2018-19 Fund at 2016-17 level $ 0
TECHNICAL EDUCATION - TRANSPORTATION
History: 2012-13 $ 554,442 2013-14 $ 695,558 (63.7% proration) 2014-15 $ 650,849 (49.2% proration) 2015-16 $ 650,000 (45.0% proration) 2016-17 $ 650,000 (45.0% proration) Additional Cost Options: 2017-18 Fund at original level $ 650,000 2018-19 Fund at original level $ 700,000
96http://www.ksde.org/Portals/0/Board/Materials%20%26%20Agendas/JULY%202016%20PACKET%20rfs.pdf 9911752017ADEQ00395

DISCRETIONARY GRANTS Appropriation for Discretionary Grants is as follows.
2010-11 2011-12 2012-13 2013-14 2014-15 2015-16 2016-17
After School Programs $ 375,000 $ 187,500 $ 187,500 $ 187,500 $ 187,500 $ 375,000 $ 375,000 Middle School After School Programs
$ 250,000
$125,000
$125,000
$ 125,000
$ 125,000
$ 250,000
$ 250,000
TOTAL $625,000 $312,500 $ 312,500 $ 312,500 $ 312,500 $ 625,000 $ 625,000
2017-18 2018-19
After School Programs $ 375,000 $ 375,000 Middle School After School Programs
$ 250,000
$ 250,000
TOTAL $625,000 $625,000
h:sbe:2018 & 2019 Budget Options—6-16
97http://www.ksde.org/Portals/0/Board/Materials%20%26%20Agendas/JULY%202016%20PACKET%20rfs.pdf 9911752017ADEQ00396

Appendix M:
Demonstrative Charge Comparing Effects of Weightings Under
Different Bases
This demonstrative exhibit compares the total funding that would be provided to at-risk students using various bases and weightings. The LPA recommendation of $428 million was calculated by multiplying the free lunch headcount (189,909, see Appx. B-1, at 2017ADEQ00024) by the 0.484 at-risk weighting and the LPA’s recommended base ($4,659, see R.Vol. 81, pp. 3966-68).

Free Lunch Headcount from: http://www.ksde.org/Portals/0/School%20Finance/Action%20Items/SF17‐232.xlsxLPA Recommendation from Plaintiffs Exhibit 199 page 35-37 991347
‐
50,000,000
100,000,000
150,000,000
200,000,000
250,000,000
300,000,000
350,000,000
400,000,000
450,000,000
Regular At‐Risk Weighting Comparison with Different Bases(Excludes High Density At‐Risk)
189,909 Free Lunch Headcount
x$4659 Base
LPA Recommended for FY07x
0.484 Weighting for At‐Risk=
$428M
LPA consultants calculated the cost of a regular student, and the added cost of an at‐risk student. LPA removed federal funds from both the calculated base and the calculated weighting, and adjusted
the base for inflation. The recommended weighting was for use with the recommended base.
189,909 Free Lunch Headcount
x$4006 Base
as passed in SB19x
0.484 Weighting for At‐Risk=
$368M
This is $60M short from the LPA calculated cost.
Just because the Legislature has chosen to fund a lower base, does not mean that at‐risk students are magically less
expensive to educate.
189,909 Free Lunch Headcount
x$4006 Base
as passed in SB19x
0.563 Weighting for At‐Risk=
$428M
Because the base is lower, the weighting must be increased to fund the actual costs of at‐
risk students.
LPA Recommendation
SB19
SB19 Recalculated
2017ADEQ00077

Appendix N:
Demonstrative Charge Comparing Various At-Risk Funding
Scenarios
This demonstrative exhibit compares the level of at-risk funding available to school districts under various scenarios. The exhibit was created using the calculations attached, which all relied on data from the LPA Study (R.Vol. 81, pp. 3966-68 (Tr. Ex. 199)), the data contained in Appx. B, and the FY15 LegalMax, which is available at http://www.ksde.org/LinkClick.aspx?fileticket=6XDdZiXMb8I%3d&[Time]abid=398&[Page]ortalid=0&mid=2427. It is appropriate to take judicial notice of this information, and Plaintiffs respectfully request that this Court do so. K.S.A. 60-409(b)(4); K.S.A. 60-412(c).

390,387,488 401,720,478
423,019,579
497,034,019
450,456,412
496,499,396 499,392,906
‐
50,000,000
100,000,000
150,000,000
200,000,000
250,000,000
300,000,000
350,000,000
400,000,000
450,000,000
500,000,000
Statewide At‐Risk Funding Scenarios
SB19
4006 Base
if At‐RiskWeightingat 0.456
FY15 Actual
3852 Base
At‐RiskWeightingat 0.456
SB19 Actual
4006 Base
At‐RiskWeightingat 0.484
LPA
FY074659 Base
At‐RiskWeightingat 0.484and 0.726
Montoy
FY104492 Base
At‐RiskWeightingat 0.456
Trial Court
FY 144654 Base
At‐RiskWeightingat 0.484and 0.726
Trial Court
FY144980 Base
At‐RiskWeightingat 0.456
$107MShort
from LPA Study
$95MShort
from LPA Study
$74MShort
from LPA
$47MShort
Data from: http://www.ksde.org/Portals/0/School%20Finance/Action%20Items/SF17‐232.xlsx LPA recommendation from Plantiffs Exhibit 199, page 35-37 991347 Columns with 0.484 / 0.726 were calculated with 0.726 weighting to 4 LPA recommended districts. Other columns have High Density At-Risk as calculated in SB19. FY15 Actual At-Risk funding from FY15 LegalMax: http://www.ksde.org/LinkClick.aspx?fileticket=6XDdZiXMb8I%3d&[Time]abid=398&[Page]ortalid=0&mid=2427
991347
2017ADEQ00078

SB19 AT‐RISK FUNDING WITH 0.456 AT‐RISK WEIGHTING SB19 AT‐RISK FUNDING WITH 0.484 AT‐RISK WEIGHTINGSF17‐232 KSDE SF17‐232 KSDE SF17‐232 SF17‐232 SF17‐232 0.484 / 0.726 0.456 0.484 / 0.726 0.456
SF17‐147 Col 2 0.456 SF17‐224 Col 3 $4,006 0.484 SF17‐224 Col 3 Col 7 $4,006 At‐Risk Weight x At‐Risk Weight x At‐Risk Weight x At‐Risk Weight xAdjusted Regular Proposed Estimated Funding Regular Proposed Estimated Funding LPA FY07 Base Montoy FY10 Base Trial Court Base Trial Court BaseFree Lunch At‐Risk High At‐Risk At‐Risk Provided for At‐Risk High At‐Risk At‐Risk Provided for $4,659 $4,492 $4,654 $4,980
USD # County District Name HdCt WTD FTE WTD FTE WTD FTE At Risk at 0.456 WTD FTE WTD FTE WTD FTE At‐Risk at 0.484Total STATE TOTALS 189,909 86,598.9 13,680.8 100,279.7 401,720,478 91,915.7 13,680.8 105,596.5 423,019,579 497,034,019 450,456,412 496,499,396 499,392,906 101 Neosho Erie‐Galesburg 255 116.3 25.3 141.6 567,250 123.4 25.3 148.7 595,692 575,014 636,067 574,304 705,168 102 Gray Cimmaron‐Ensign 227 103.5 3.8 107.3 429,844 109.9 3.8 113.7 455,482 511,875 481,992 511,475 534,354 103 Cheyenne Cheylin 62 28.3 5.7 34.0 136,204 30.0 5.7 35.7 143,014 139,807 152,728 139,620 169,320 105 Rawlins Rawlins County 111 50.6 1.5 52.1 208,713 53.7 1.5 55.2 221,131 250,300 234,033 249,920 259,458 106 Ness Western Plains 60 27.4 6.3 33.7 135,002 29.0 6.3 35.3 141,412 135,297 151,380 134,966 167,826 107 Jewell Rock Hills 132 60.2 7.9 68.1 272,809 63.9 7.9 71.8 287,631 297,654 305,905 297,391 339,138 108 Washington Washington Co. Schools 125 57.0 6.6 63.6 254,782 60.5 6.6 67.1 268,803 281,870 285,691 281,567 316,728 109 Republic Republic County 212 96.7 11.1 107.8 431,847 102.6 11.1 113.7 455,482 478,051 484,238 477,500 536,844 110 Phillips Thunder Ridge Schools 108 49.2 10.5 59.7 239,158 52.3 10.5 62.8 251,577 243,535 268,172 243,404 297,306 111 Doniphan Doniphan West Schools 126 57.5 2.6 60.1 240,761 61.0 2.6 63.6 254,782 284,124 269,969 283,894 299,298 112 Ellsworth Central Plains 180 82.1 4.3 86.4 346,118 87.1 4.3 91.4 366,148 405,892 388,109 405,363 430,272 113 Nemaha Prairie Hills 307 140.0 7.7 147.7 591,686 148.6 7.7 156.3 626,138 692,271 663,468 691,584 735,546 114 Doniphan Riverside 287 130.9 23.1 154.0 616,924 138.9 23.1 162.0 648,972 647,172 691,768 646,441 766,920 115 Nemaha Nemaha Central 85 38.8 0.0 38.8 155,433 41.1 0.0 41.1 164,647 191,671 174,290 191,279 193,224 200 Greeley Greeley County Schools 92 42.0 1.9 43.9 175,863 44.5 1.9 46.4 185,878 207,456 197,199 207,103 218,622 202 Wyandotte Turner‐Kansas City 2,607 1,188.8 274.1 1,462.9 5,860,377 1,261.8 274.1 1,535.9 6,152,815 8,818,005 6,571,347 8,808,542 7,285,242 203 Wyandotte Piper‐Kansas City 286 130.4 0.0 130.4 522,382 138.4 0.0 138.4 554,430 644,917 585,757 644,114 649,392 204 Wyandotte Bonner Springs 1,068 487.0 39.9 526.9 2,110,761 516.9 39.9 556.8 2,230,541 2,408,293 2,366,835 2,405,653 2,623,962 205 Butler Bluestem 215 98.0 13.5 111.5 446,669 104.1 13.5 117.6 471,106 484,816 500,858 484,481 555,270 206 Butler Remington‐Whitewater 152 69.3 0.0 69.3 277,616 73.6 0.0 73.6 294,842 342,753 311,296 342,534 345,114 207 Leavenworth Ft Leavenworth 72 32.8 0.0 32.8 131,397 34.8 0.0 34.8 139,409 162,357 147,338 161,959 163,344 208 Trego Wakeeney 105 47.9 0.0 47.9 191,887 50.8 0.0 50.8 203,505 236,770 215,167 236,423 238,542 209 Stevens Moscow Public Schools 106 48.3 11.1 59.4 237,956 51.3 11.1 62.4 249,974 239,025 266,825 238,750 295,812 210 Stevens Hugoton Public Schools 526 239.9 51.5 291.4 1,167,348 254.6 51.5 306.1 1,226,237 1,186,107 1,308,969 1,184,908 1,451,172 211 Norton Norton Community Schools 208 94.8 2.1 96.9 388,181 100.7 2.1 102.8 411,817 469,031 435,275 468,658 482,562 212 Norton Northern Valley 57 26.0 1.6 27.6 110,566 27.6 1.6 29.2 116,975 128,532 123,979 128,450 137,448 214 Grant Ulysses 887 404.5 93.1 497.6 1,993,386 429.3 93.1 522.4 2,092,734 2,000,146 2,235,219 1,997,962 2,478,048 215 Kearny Lakin 271 123.6 16.8 140.4 562,442 131.2 16.8 148.0 592,888 611,093 630,677 610,605 699,192 216 Kearny Deerfield 143 65.2 15.0 80.2 321,281 69.2 15.0 84.2 337,305 322,459 360,258 322,057 399,396 217 Morton Rolla 46 21.0 2.6 23.6 94,542 22.3 2.6 24.9 99,749 103,728 106,011 103,784 117,528 218 Morton Elkhart 187 85.3 9.1 94.4 378,166 90.5 9.1 99.6 398,998 421,677 424,045 421,187 470,112 219 Clark Minneola 124 56.5 13.0 69.5 278,417 60.0 13.0 73.0 292,438 279,615 312,194 279,240 346,110 220 Clark Ashland 61 27.8 2.0 29.8 119,379 29.5 2.0 31.5 126,189 137,552 133,862 137,293 148,404 223 Washington Barnes 99 45.1 0.0 45.1 180,671 47.9 0.0 47.9 191,887 223,241 202,589 222,927 224,598 224 Washington Clifton‐Clyde 92 42.0 0.0 42.0 168,252 44.5 0.0 44.5 178,267 207,456 188,664 207,103 209,160 225 Meade Fowler 55 25.1 1.3 26.4 105,758 26.6 1.3 27.9 111,767 124,023 118,589 123,796 131,472 226 Meade Meade 105 47.9 0.0 47.9 191,887 50.8 0.0 50.8 203,505 236,770 215,167 236,423 238,542 227 Hodgeman Hodgeman County Schools 72 32.8 0.0 32.8 131,397 34.8 0.0 34.8 139,409 162,357 147,338 161,959 163,344 229 Johnson Blue Valley 2,226 1,015.1 0.0 1,015.1 4,066,491 1,077.4 0.0 1,077.4 4,316,064 5,019,532 4,559,829 5,014,220 5,055,198 230 Johnson Spring Hill 441 201.1 0.0 201.1 805,607 213.4 0.0 213.4 854,880 994,436 903,341 993,164 1,001,478 231 Johnson Gardner Edgerton 1,339 610.6 2.2 612.8 2,454,877 648.1 2.2 650.3 2,605,102 3,019,386 2,752,698 3,016,257 3,051,744 232 Johnson De Soto 708 322.8 7.1 329.9 1,321,579 342.7 7.1 349.8 1,401,299 1,596,509 1,481,911 1,594,926 1,642,902 233 Johnson Olathe 5,971 2,722.8 203.4 2,926.2 11,722,357 2,890.0 203.4 3,093.4 12,392,160 13,464,342 13,144,490 13,450,060 14,572,476 234 Bourbon Fort Scott 933 425.4 97.3 522.7 2,093,936 451.6 97.3 548.9 2,198,893 2,103,874 2,347,968 2,101,746 2,603,046 235 Bourbon Uniontown 199 90.7 14.1 104.8 419,829 96.3 14.1 110.4 442,262 448,736 470,762 448,180 521,904 237 Smith Smith Center 148 67.5 3.6 71.1 284,827 71.6 3.6 75.2 301,251 333,733 319,381 333,226 354,078 239 Ottawa North Ottawa County 195 88.9 0.0 88.9 356,133 94.4 0.0 94.4 378,166 439,716 399,339 439,338 442,722 240 Ottawa Twin Valley 205 93.5 9.7 103.2 413,419 99.2 9.7 108.9 436,253 462,266 463,574 461,677 513,936 241 Wallace Wallace County Schools 59 26.9 0.0 26.9 107,761 28.6 0.0 28.6 114,572 133,042 120,835 133,104 133,962 242 Wallace Weskan 27 12.3 0.0 12.3 49,274 13.1 0.0 13.1 52,479 60,884 55,252 60,967 61,254 243 Coffey Lebo‐Waverly 129 58.8 0.0 58.8 235,553 62.4 0.0 62.4 249,974 290,889 264,130 290,410 292,824 244 Coffey Burlington 257 117.2 1.1 118.3 473,910 124.4 1.1 125.5 502,753 579,524 531,404 578,958 589,134 245 Coffey LeRoy‐Gridley 66 30.1 2.0 32.1 128,593 31.9 2.0 33.9 135,803 148,827 144,193 148,463 159,858 246 Crawford Northeast 287 130.9 30.1 161.0 644,966 138.9 30.1 169.0 677,014 647,172 723,212 646,441 801,780 247 Crawford Cherokee 221 100.8 16.1 116.9 468,301 107.0 16.1 123.1 493,139 498,345 525,115 497,978 582,162 248 Crawford Girard 398 181.5 13.5 195.0 781,170 192.6 13.5 206.1 825,637 897,472 875,940 896,360 971,100 249 Crawford Frontenac Public Schools 294 134.1 0.0 134.1 537,205 142.3 0.0 142.3 570,054 662,957 602,377 662,264 667,818 250 Crawford Pittsburg 1,785 814.0 187.4 1,001.4 4,011,608 863.9 187.4 1,051.3 4,211,508 4,025,096 4,498,289 4,020,591 4,986,972 251 Lyon North Lyon County 171 78.0 10.8 88.8 355,733 82.8 10.8 93.6 374,962 385,597 398,890 385,351 442,224 252 Lyon Southern Lyon County 167 76.2 11.9 88.1 352,929 80.8 11.9 92.7 371,356 376,578 395,745 376,043 438,738 253 Lyon Emporia 2,171 990.0 200.6 1,190.6 4,769,544 1,050.8 200.6 1,251.4 5,013,108 4,895,509 5,348,175 4,890,423 5,929,188 254 Barber Barber County North 185 84.4 7.3 91.7 367,350 89.5 7.3 96.8 387,781 417,167 411,916 416,533 456,666 255 Barber South Barber 92 42.0 1.9 43.9 175,863 44.5 1.9 46.4 185,878 207,456 197,199 207,103 218,622 256 Allen Marmaton Valley 127 57.9 8.8 66.7 267,200 61.5 8.8 70.3 281,622 286,379 299,616 286,221 332,166 257 Allen Iola 654 298.2 68.7 366.9 1,469,801 316.5 68.7 385.2 1,543,111 1,474,741 1,648,115 1,472,991 1,827,162 258 Allen Humboldt 223 101.7 5.7 107.4 430,244 107.9 5.7 113.6 455,082 502,855 482,441 502,167 534,852
Data from: http://www.ksde.org/Portals/0/School%20Finance/Action%20Items/SF17‐232.xlsxLPA recommendation from Plantiffs Exhibit 199, page 35-37 991347
Columns with 0.484 / 0.726 were calculated with 0.726 weighting to 4 LPA recommended districts. Other columns have High Density At-Risk as calculated in SB19.
2017ADEQ00079

SB19 AT‐RISK FUNDING WITH 0.456 AT‐RISK WEIGHTING SB19 AT‐RISK FUNDING WITH 0.484 AT‐RISK WEIGHTINGSF17‐232 KSDE SF17‐232 KSDE SF17‐232 SF17‐232 SF17‐232 0.484 / 0.726 0.456 0.484 / 0.726 0.456
SF17‐147 Col 2 0.456 SF17‐224 Col 3 $4,006 0.484 SF17‐224 Col 3 Col 7 $4,006 At‐Risk Weight x At‐Risk Weight x At‐Risk Weight x At‐Risk Weight xAdjusted Regular Proposed Estimated Funding Regular Proposed Estimated Funding LPA FY07 Base Montoy FY10 Base Trial Court Base Trial Court BaseFree Lunch At‐Risk High At‐Risk At‐Risk Provided for At‐Risk High At‐Risk At‐Risk Provided for $4,659 $4,492 $4,654 $4,980
USD # County District Name HdCt WTD FTE WTD FTE WTD FTE At Risk at 0.456 WTD FTE WTD FTE WTD FTE At‐Risk at 0.484Total STATE TOTALS 189,909 86,598.9 13,680.8 100,279.7 401,720,478 91,915.7 13,680.8 105,596.5 423,019,579 497,034,019 450,456,412 496,499,396 499,392,906 259 Sedgwick Wichita 32,481 14,811.3 3,410.5 18,221.8 72,996,531 15,720.8 3,410.5 19,131.3 76,639,988 109,864,839 81,852,326 109,746,933 90,744,564 260 Sedgwick Derby 2,519 1,148.7 85.6 1,234.3 4,944,606 1,219.2 85.6 1,304.8 5,227,029 5,680,234 5,544,476 5,674,157 6,146,814 261 Sedgwick Haysville 2,581 1,176.9 216.8 1,393.7 5,583,162 1,249.2 216.8 1,466.0 5,872,796 5,820,041 6,260,500 5,813,777 6,940,626 262 Sedgwick Valley Center Pub Sch 856 390.3 7.2 397.5 1,592,385 414.3 7.2 421.5 1,688,529 1,930,242 1,785,570 1,928,152 1,979,550 263 Sedgwick Mulvane 558 254.4 7.2 261.6 1,047,970 270.1 7.2 277.3 1,110,864 1,258,265 1,175,107 1,257,045 1,302,768 264 Sedgwick Clearwater 262 119.5 0.0 119.5 478,717 126.8 0.0 126.8 507,961 590,798 536,794 590,127 595,110 265 Sedgwick Goddard 1,034 471.5 0.0 471.5 1,888,829 500.5 0.0 500.5 2,005,003 2,331,625 2,117,978 2,329,327 2,348,070 266 Sedgwick Maize 1,016 463.3 0.0 463.3 1,855,980 491.7 0.0 491.7 1,969,750 2,291,035 2,081,144 2,288,372 2,307,234 267 Sedgwick Renwick 189 86.2 0.0 86.2 345,317 91.5 0.0 91.5 366,549 426,187 387,210 425,841 429,276 268 Sedgwick Cheney 174 79.3 0.0 79.3 317,676 84.2 0.0 84.2 337,305 392,362 356,216 391,867 394,914 269 Rooks Palco 25 11.4 0.0 11.4 45,668 12.1 0.0 12.1 48,473 56,374 51,209 56,313 56,772 270 Rooks Plainville 95 43.3 0.8 44.1 176,665 46.0 0.8 46.8 187,481 214,221 198,097 214,084 219,618 271 Rooks Stockton 137 62.5 6.7 69.2 277,215 66.3 6.7 73.0 292,438 308,929 310,846 308,560 344,616 272 Mitchell Waconda 116 52.9 3.2 56.1 224,737 56.1 3.2 59.3 237,556 261,575 252,001 261,089 279,378 273 Mitchell Beloit 239 109.0 0.0 109.0 436,654 115.7 0.0 115.7 463,494 538,934 489,628 538,468 542,820 274 Logan Oakley 153 69.8 6.2 76.0 304,456 74.1 6.2 80.3 321,682 345,008 341,392 344,861 378,480 275 Logan Triplains 18 8.2 0.0 8.2 32,849 8.7 0.0 8.7 34,852 40,589 36,834 40,490 40,836 281 Graham Graham County 124 56.5 2.9 59.4 237,956 60.0 2.9 62.9 251,977 279,615 266,825 279,240 295,812 282 Elk West Elk 161 73.4 13.4 86.8 347,721 77.9 13.4 91.3 365,748 363,048 389,906 362,547 432,264 283 Elk Elk Valley 81 36.9 8.5 45.4 181,872 39.2 8.5 47.7 191,086 182,651 203,937 182,437 226,092 284 Chase Chase County 83 37.8 0.0 37.8 151,427 40.2 0.0 40.2 161,041 187,161 169,798 187,091 188,244 285 Chautauqua Cedar Vale 109 49.7 11.5 61.2 245,167 52.8 11.5 64.3 257,586 245,790 274,910 245,731 304,776 286 Chautauqua Chautauqua Co Community 197 89.8 20.7 110.5 442,663 95.3 20.7 116.0 464,696 444,226 496,366 443,526 550,290 287 Franklin West Franklin 253 115.4 13.8 129.2 517,575 122.5 13.8 136.3 546,018 570,504 580,366 570,115 643,416 288 Franklin Central Heights 295 134.5 31.0 165.5 662,993 142.8 31.0 173.8 696,243 665,212 743,426 664,591 824,190 289 Franklin Wellsville 178 81.2 0.0 81.2 325,287 86.2 0.0 86.2 345,317 401,382 364,750 401,175 404,376 290 Franklin Ottawa 1,039 473.8 58.2 532.0 2,131,192 502.9 58.2 561.1 2,247,767 2,342,899 2,389,744 2,340,497 2,649,360 291 Gove Grinnell Public Schools 29 13.2 1.9 15.1 60,491 14.0 1.9 15.9 63,695 65,394 67,829 65,156 75,198 292 Gove Wheatland 27 12.3 0.0 12.3 49,274 13.1 0.0 13.1 52,479 60,884 55,252 60,967 61,254 293 Gove Quinter Public Schools 72 32.8 0.0 32.8 131,397 34.8 0.0 34.8 139,409 162,357 147,338 161,959 163,344 294 Decatur Oberlin 109 49.7 0.5 50.2 201,101 52.8 0.5 53.3 213,520 245,790 225,498 245,731 249,996 297 Cheyenne St Francis Comm Sch 86 39.2 1.7 40.9 163,845 41.6 1.7 43.3 173,460 193,926 183,723 193,606 203,682 298 Lincoln Lincoln 145 66.1 6.5 72.6 290,836 70.2 6.5 76.7 307,260 326,969 326,119 326,711 361,548 299 Lincoln Sylvan Grove 85 38.8 2.0 40.8 163,445 41.1 2.0 43.1 172,659 191,671 183,274 191,279 203,184 300 Comanche Comanche County 100 45.6 1.9 47.5 190,285 48.4 1.9 50.3 201,502 225,496 213,370 225,254 236,550 303 Ness Ness City 119 54.3 7.3 61.6 246,770 57.6 7.3 64.9 259,989 268,340 276,707 268,070 306,768 305 Saline Salina 3,484 1,588.7 334.1 1,922.8 7,702,737 1,686.3 334.1 2,020.4 8,093,722 7,856,267 8,637,218 7,848,040 9,575,544 306 Saline Southeast Of Saline 126 57.5 0.0 57.5 230,345 61.0 0.0 61.0 244,366 284,124 258,290 283,894 286,350 307 Saline Ell‐Saline 98 44.7 0.0 44.7 179,068 47.4 0.0 47.4 189,884 220,986 200,792 220,600 222,606 308 Reno Hutchinson Public Schools 2,549 1,162.3 267.6 1,429.9 5,728,179 1,233.7 267.6 1,501.3 6,014,208 5,747,883 6,423,111 5,741,640 7,120,902 309 Reno Nickerson 488 222.5 30.7 253.2 1,014,319 236.2 30.7 266.9 1,069,201 1,100,419 1,137,374 1,099,275 1,260,936 310 Reno Fairfield 148 67.5 15.5 83.0 332,498 71.6 15.5 87.1 348,923 333,733 372,836 333,226 413,340 311 Reno Pretty Prairie 61 27.8 0.0 27.8 111,367 29.5 0.0 29.5 118,177 137,552 124,878 137,293 138,444 312 Reno Haven Public Schools 272 124.0 1.8 125.8 503,955 131.6 1.8 133.4 534,400 613,348 565,094 612,466 626,484 313 Reno Buhler 670 305.5 3.3 308.8 1,237,053 324.3 3.3 327.6 1,312,366 1,510,821 1,387,130 1,509,292 1,537,824 314 Thomas Brewster 54 24.6 1.7 26.3 105,358 26.1 1.7 27.8 111,367 121,768 118,140 121,469 130,974 315 Thomas Colby Public Schools 236 107.6 0.0 107.6 431,046 114.2 0.0 114.2 457,485 532,170 483,339 531,487 535,848 316 Thomas Golden Plains 102 46.5 10.8 57.3 229,544 49.4 10.8 60.2 241,161 230,006 257,392 229,908 285,354 320 Pottawatomie Wamego 309 140.9 0.0 140.9 564,445 149.6 0.0 149.6 599,298 696,781 632,923 696,238 701,682 321 Pottawatomie Kaw Valley 314 143.2 0.0 143.2 573,659 152.0 0.0 152.0 608,912 708,056 643,254 707,408 713,136 322 Pottawatomie Onaga‐Havensville‐Wheato 101 46.1 1.2 47.3 189,484 48.9 1.2 50.1 200,701 227,751 212,472 227,581 235,554 323 Pottawatomie Rock Creek 225 102.6 0.0 102.6 411,016 108.9 0.0 108.9 436,253 507,365 460,879 506,821 510,948 325 Phillips Phillipsburg 163 74.3 0.0 74.3 297,646 78.9 0.0 78.9 316,073 367,558 333,756 367,201 370,014 326 Phillips Logan 46 21.0 0.0 21.0 84,126 22.3 0.0 22.3 89,334 103,728 94,332 103,784 104,580 327 Ellsworth Ellsworth 156 71.1 0.0 71.1 284,827 75.5 0.0 75.5 302,453 351,773 319,381 351,377 354,078 329 Wabaunsee Mill Creek Valley 104 47.4 0.0 47.4 189,884 50.3 0.0 50.3 201,502 234,515 212,921 234,096 236,052 330 Wabaunsee Mission Valley 137 62.5 0.0 62.5 250,375 66.3 0.0 66.3 265,598 308,929 280,750 308,560 311,250 331 Kingman Kingman ‐ Norwich 316 144.1 7.6 151.7 607,710 152.9 7.6 160.5 642,963 712,566 681,436 711,597 755,466 332 Kingman Cunningham 46 21.0 0.0 21.0 84,126 22.3 0.0 22.3 89,334 103,728 94,332 103,784 104,580 333 Cloud Concordia 372 169.6 5.8 175.4 702,652 180.0 5.8 185.8 744,315 838,844 787,897 837,720 873,492 334 Cloud Southern Cloud 95 43.3 10.0 53.3 213,520 46.0 10.0 56.0 224,336 214,221 239,424 214,084 265,434 335 Jackson North Jackson 114 52.0 0.0 52.0 208,312 55.2 0.0 55.2 221,131 257,065 233,584 256,901 258,960 336 Jackson Holton 380 173.3 4.8 178.1 713,469 183.9 4.8 188.7 755,932 856,883 800,025 855,871 886,938 337 Jackson Royal Valley 335 152.8 12.0 164.8 660,189 162.1 12.0 174.1 697,445 755,410 740,282 754,413 820,704 338 Jefferson Valley Falls 117 53.4 0.0 53.4 213,920 56.6 0.0 56.6 226,740 263,830 239,873 263,416 265,932 339 Jefferson Jefferson County North 108 49.2 0.0 49.2 197,095 52.3 0.0 52.3 209,514 243,535 221,006 243,404 245,016
Data from: http://www.ksde.org/Portals/0/School%20Finance/Action%20Items/SF17‐232.xlsxLPA recommendation from Plantiffs Exhibit 199, page 35-37 991347
Columns with 0.484 / 0.726 were calculated with 0.726 weighting to 4 LPA recommended districts. Other columns have High Density At-Risk as calculated in SB19.
2017ADEQ00080

SB19 AT‐RISK FUNDING WITH 0.456 AT‐RISK WEIGHTING SB19 AT‐RISK FUNDING WITH 0.484 AT‐RISK WEIGHTINGSF17‐232 KSDE SF17‐232 KSDE SF17‐232 SF17‐232 SF17‐232 0.484 / 0.726 0.456 0.484 / 0.726 0.456
SF17‐147 Col 2 0.456 SF17‐224 Col 3 $4,006 0.484 SF17‐224 Col 3 Col 7 $4,006 At‐Risk Weight x At‐Risk Weight x At‐Risk Weight x At‐Risk Weight xAdjusted Regular Proposed Estimated Funding Regular Proposed Estimated Funding LPA FY07 Base Montoy FY10 Base Trial Court Base Trial Court BaseFree Lunch At‐Risk High At‐Risk At‐Risk Provided for At‐Risk High At‐Risk At‐Risk Provided for $4,659 $4,492 $4,654 $4,980
USD # County District Name HdCt WTD FTE WTD FTE WTD FTE At Risk at 0.456 WTD FTE WTD FTE WTD FTE At‐Risk at 0.484Total STATE TOTALS 189,909 86,598.9 13,680.8 100,279.7 401,720,478 91,915.7 13,680.8 105,596.5 423,019,579 497,034,019 450,456,412 496,499,396 499,392,906 340 Jefferson Jefferson West 181 82.5 0.0 82.5 330,495 87.6 0.0 87.6 350,926 408,147 370,590 407,690 410,850 341 Jefferson Oskaloosa Public Schools 254 115.8 13.9 129.7 519,578 122.9 13.9 136.8 548,021 572,759 582,612 571,977 645,906 342 Jefferson McLouth 157 71.6 2.3 73.9 296,043 76.0 2.3 78.3 313,670 354,028 331,959 353,704 368,022 343 Jefferson Perry Public Schools 219 99.9 0.1 100.0 400,600 106.0 0.1 106.1 425,037 493,835 449,200 493,324 498,000 344 Linn Pleasanton 164 74.8 14.1 88.9 356,133 79.4 14.1 93.5 374,561 369,813 399,339 369,528 442,722 345 Shawnee Seaman 1,071 488.4 30.5 518.9 2,078,713 518.4 30.5 548.9 2,198,893 2,415,058 2,330,899 2,412,634 2,584,122 346 Linn Jayhawk 282 128.6 29.6 158.2 633,749 136.5 29.6 166.1 665,397 635,898 710,634 635,271 787,836 347 Edwards Kinsley‐Offerle 158 72.0 12.9 84.9 340,109 76.5 12.9 89.4 358,136 356,283 381,371 356,031 422,802 348 Douglas Baldwin City 367 167.4 0.0 167.4 670,604 177.6 0.0 177.6 711,466 827,569 751,961 826,550 833,652 349 Stafford Stafford 107 48.8 11.2 60.0 240,360 51.8 11.2 63.0 252,378 241,280 269,520 241,077 298,800 350 Stafford St John‐Hudson 128 58.4 5.2 63.6 254,782 62.0 5.2 67.2 269,203 288,634 285,691 288,548 316,728 351 Stafford Macksville 114 52.0 11.5 63.5 254,381 55.2 11.5 66.7 267,200 257,065 285,242 256,901 316,230 352 Sherman Goodland 351 160.1 9.1 169.2 677,815 169.9 9.1 179.0 717,074 791,490 760,046 790,715 842,616 353 Sumner Wellington 738 336.5 57.9 394.4 1,579,966 357.2 57.9 415.1 1,662,891 1,664,158 1,771,645 1,662,409 1,964,112 355 Barton Ellinwood Public Schools 167 76.2 2.6 78.8 315,673 80.8 2.6 83.4 334,100 376,578 353,970 376,043 392,424 356 Sumner Conway Springs 104 47.4 0.0 47.4 189,884 50.3 0.0 50.3 201,502 234,515 212,921 234,096 236,052 357 Sumner Belle Plaine 203 92.6 2.9 95.5 382,573 98.3 2.9 101.2 405,407 457,756 428,986 457,488 475,590 358 Sumner Oxford 113 51.5 3.2 54.7 219,128 54.7 3.2 57.9 231,947 254,810 245,712 254,574 272,406 359 Sumner Argonia Public Schools 77 35.1 5.4 40.5 162,243 37.3 5.4 42.7 171,056 173,632 181,926 173,594 201,690 360 Sumner Caldwell 98 44.7 6.1 50.8 203,505 47.4 6.1 53.5 214,321 220,986 228,194 220,600 252,984 361 Harper Anthony‐Harper 418 190.6 43.9 234.5 939,407 202.3 43.9 246.2 986,277 942,572 1,053,374 941,504 1,167,810 362 Linn Prairie View 351 160.1 8.9 169.0 677,014 169.9 8.9 178.8 716,273 791,490 759,148 790,715 841,620 363 Finney Holcomb 455 207.5 34.4 241.9 969,051 220.2 34.4 254.6 1,019,928 1,026,005 1,086,615 1,024,811 1,204,662 364 Marshall Marysville 232 105.8 5.4 111.2 445,467 112.3 5.4 117.7 471,506 523,150 499,510 522,644 553,776 365 Anderson Garnett 352 160.5 6.5 167.0 669,002 170.4 6.5 176.9 708,661 793,745 750,164 793,042 831,660 366 Woodson Woodson 219 99.9 21.2 121.1 485,127 106.0 21.2 127.2 509,563 493,835 543,981 493,324 603,078 367 Miami Osawatomie 611 278.6 64.2 342.8 1,373,257 295.7 64.2 359.9 1,441,759 1,377,778 1,539,858 1,376,188 1,707,144 368 Miami Paola 555 253.1 0.0 253.1 1,013,919 268.6 0.0 268.6 1,076,012 1,251,501 1,136,925 1,250,064 1,260,438 369 Harvey Burrton 113 51.5 8.7 60.2 241,161 54.7 8.7 63.4 253,980 254,810 270,418 254,574 299,796 371 Gray Montezuma 68 31.0 1.0 32.0 128,192 32.9 1.0 33.9 135,803 153,337 143,744 153,117 159,360 372 Shawnee Silver Lake 97 44.2 0.0 44.2 177,065 46.9 0.0 46.9 187,881 218,731 198,546 218,273 220,116 373 Harvey Newton 1,448 660.3 88.3 748.6 2,998,892 700.8 88.3 789.1 3,161,135 3,265,176 3,362,711 3,261,523 3,728,028 374 Haskell Sublette 228 104.0 23.0 127.0 508,762 110.4 23.0 133.4 534,400 514,130 570,484 513,802 632,460 375 Butler Circle 359 163.7 0.0 163.7 655,782 173.8 0.0 173.8 696,243 809,529 735,340 808,865 815,226 376 Rice Sterling 143 65.2 0.0 65.2 261,191 69.2 0.0 69.2 277,215 322,459 292,878 322,057 324,696 377 Atchison Atchison Co Comm Schools 211 96.2 7.9 104.1 417,025 102.1 7.9 110.0 440,660 475,796 467,617 475,173 518,418 378 Riley Riley County 135 61.6 0.0 61.6 246,770 65.3 0.0 65.3 261,592 304,419 276,707 303,906 306,768 379 Clay Clay Center 418 190.6 2.7 193.3 774,360 202.3 2.7 205.0 821,230 942,572 868,304 941,504 962,634 380 Marshall Vermillion 130 59.3 0.0 59.3 237,556 62.9 0.0 62.9 251,977 293,144 266,376 292,737 295,314 381 Ford Spearville 95 43.3 0.0 43.3 173,460 46.0 0.0 46.0 184,276 214,221 194,504 214,084 215,634 382 Pratt Pratt 489 223.0 28.4 251.4 1,007,108 236.7 28.4 265.1 1,061,991 1,102,673 1,129,289 1,101,602 1,251,972 383 Riley Manhattan‐Ogden 1,848 842.7 56.6 899.3 3,602,596 894.4 56.6 951.0 3,809,706 4,167,159 4,039,656 4,162,538 4,478,514 384 Riley Blue Valley 37 16.9 0.0 16.9 67,701 17.9 0.0 17.9 71,707 83,433 75,915 83,307 84,162 385 Butler Andover 675 307.8 0.0 307.8 1,233,047 326.7 0.0 326.7 1,308,760 1,522,095 1,382,638 1,520,462 1,532,844 386 Greenwood Madison‐Virgil 87 39.7 4.5 44.2 177,065 42.1 4.5 46.6 186,680 196,181 198,546 195,933 220,116 387 Wilson Altoona‐Midway 81 36.9 5.7 42.6 170,656 39.2 5.7 44.9 179,869 182,651 191,359 182,437 212,148 388 Ellis Ellis 104 47.4 0.0 47.4 189,884 50.3 0.0 50.3 201,502 234,515 212,921 234,096 236,052 389 Greenwood Eureka 343 156.4 36.0 192.4 770,754 166.0 36.0 202.0 809,212 773,450 864,261 772,564 958,152 390 Greenwood Hamilton 28 12.8 2.0 14.8 59,289 13.6 2.0 15.6 62,494 63,139 66,482 63,294 73,704 392 Osborne Osborne County 106 48.3 2.4 50.7 203,104 51.3 2.4 53.7 215,122 239,025 227,744 238,750 252,486 393 Dickinson Solomon 121 55.2 3.0 58.2 233,149 58.6 3.0 61.6 246,770 272,850 261,434 272,724 289,836 394 Butler Rose Hill Public Schools 351 160.1 0.0 160.1 641,361 169.9 0.0 169.9 680,619 791,490 719,169 790,715 797,298 395 Rush LaCrosse 104 47.4 0.7 48.1 192,689 50.3 0.7 51.0 204,306 234,515 216,065 234,096 239,538 396 Butler Douglass Public Schools 190 86.6 0.0 86.6 346,920 92.0 0.0 92.0 368,552 428,442 389,007 428,168 431,268 397 Marion Centre 65 29.6 0.0 29.6 118,578 31.5 0.0 31.5 126,189 146,572 132,963 146,601 147,408 398 Marion Peabody‐Burns 122 55.6 11.8 67.4 270,004 59.0 11.8 70.8 283,625 275,105 302,761 274,586 335,652 399 Russell Paradise 42 19.2 2.3 21.5 86,129 20.3 2.3 22.6 90,536 94,708 96,578 94,476 107,070 400 McPherson Smoky Valley 208 94.8 0.0 94.8 379,769 100.7 0.0 100.7 403,404 469,031 425,842 468,658 472,104 401 Rice Chase‐Raymond 93 42.4 9.8 52.2 209,113 45.0 9.8 54.8 219,529 209,711 234,482 209,430 259,956 402 Butler Augusta 739 337.0 17.5 354.5 1,420,127 357.7 17.5 375.2 1,503,051 1,666,412 1,592,414 1,664,736 1,765,410 403 Rush Otis‐Bison 91 41.5 4.8 46.3 185,478 44.0 4.8 48.8 195,493 205,201 207,980 204,776 230,574 404 Cherokee Riverton 310 141.4 16.4 157.8 632,147 150.0 16.4 166.4 666,598 699,036 708,838 698,100 785,844 405 Rice Lyons 466 212.5 52.2 264.7 1,060,388 225.5 52.2 277.7 1,112,466 1,050,809 1,189,032 1,049,477 1,318,206 407 Russell Russell County 351 160.1 20.6 180.7 723,884 169.9 20.6 190.5 763,143 791,490 811,704 790,715 899,886 408 Marion Marion‐Florence 174 79.3 4.9 84.2 337,305 84.2 4.9 89.1 356,935 392,362 378,226 391,867 419,316 409 Atchison Atchison Public Schools 962 438.7 101.0 539.7 2,162,038 465.6 101.0 566.6 2,269,800 2,169,268 2,424,332 2,166,902 2,687,706
Data from: http://www.ksde.org/Portals/0/School%20Finance/Action%20Items/SF17‐232.xlsxLPA recommendation from Plantiffs Exhibit 199, page 35-37 991347
Columns with 0.484 / 0.726 were calculated with 0.726 weighting to 4 LPA recommended districts. Other columns have High Density At-Risk as calculated in SB19.
2017ADEQ00081
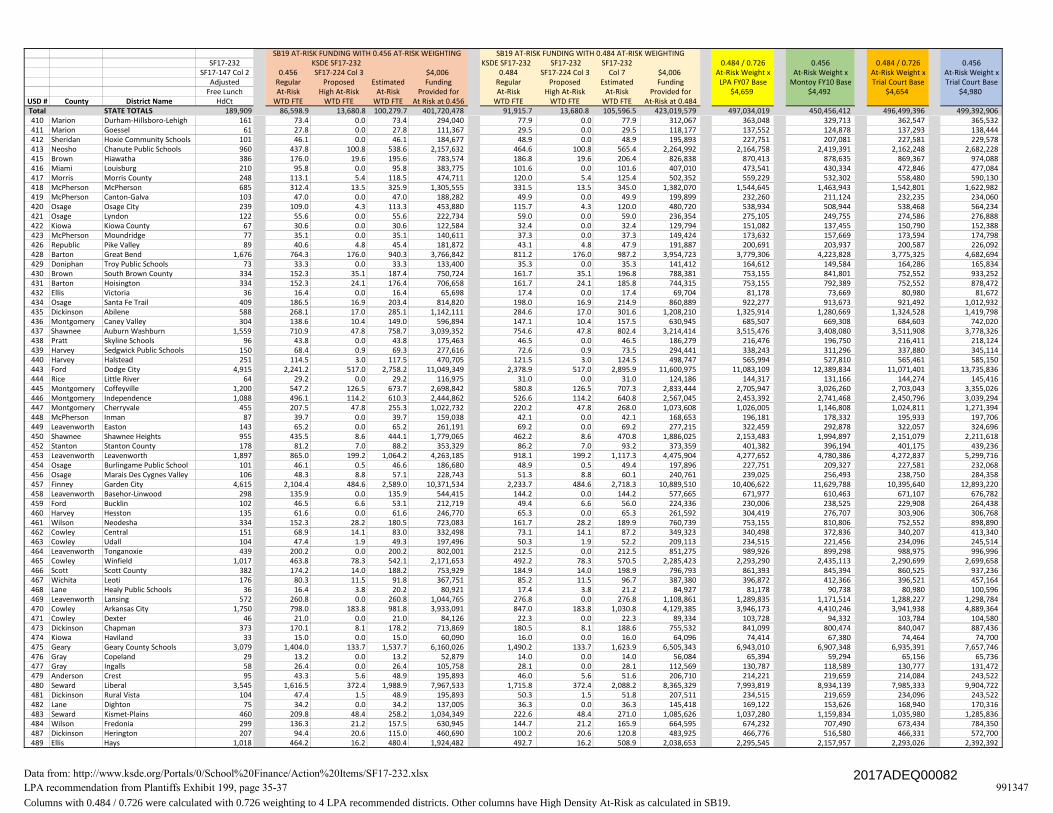
SB19 AT‐RISK FUNDING WITH 0.456 AT‐RISK WEIGHTING SB19 AT‐RISK FUNDING WITH 0.484 AT‐RISK WEIGHTINGSF17‐232 KSDE SF17‐232 KSDE SF17‐232 SF17‐232 SF17‐232 0.484 / 0.726 0.456 0.484 / 0.726 0.456
SF17‐147 Col 2 0.456 SF17‐224 Col 3 $4,006 0.484 SF17‐224 Col 3 Col 7 $4,006 At‐Risk Weight x At‐Risk Weight x At‐Risk Weight x At‐Risk Weight xAdjusted Regular Proposed Estimated Funding Regular Proposed Estimated Funding LPA FY07 Base Montoy FY10 Base Trial Court Base Trial Court BaseFree Lunch At‐Risk High At‐Risk At‐Risk Provided for At‐Risk High At‐Risk At‐Risk Provided for $4,659 $4,492 $4,654 $4,980
USD # County District Name HdCt WTD FTE WTD FTE WTD FTE At Risk at 0.456 WTD FTE WTD FTE WTD FTE At‐Risk at 0.484Total STATE TOTALS 189,909 86,598.9 13,680.8 100,279.7 401,720,478 91,915.7 13,680.8 105,596.5 423,019,579 497,034,019 450,456,412 496,499,396 499,392,906 410 Marion Durham‐Hillsboro‐Lehigh 161 73.4 0.0 73.4 294,040 77.9 0.0 77.9 312,067 363,048 329,713 362,547 365,532 411 Marion Goessel 61 27.8 0.0 27.8 111,367 29.5 0.0 29.5 118,177 137,552 124,878 137,293 138,444 412 Sheridan Hoxie Community Schools 101 46.1 0.0 46.1 184,677 48.9 0.0 48.9 195,893 227,751 207,081 227,581 229,578 413 Neosho Chanute Public Schools 960 437.8 100.8 538.6 2,157,632 464.6 100.8 565.4 2,264,992 2,164,758 2,419,391 2,162,248 2,682,228 415 Brown Hiawatha 386 176.0 19.6 195.6 783,574 186.8 19.6 206.4 826,838 870,413 878,635 869,367 974,088 416 Miami Louisburg 210 95.8 0.0 95.8 383,775 101.6 0.0 101.6 407,010 473,541 430,334 472,846 477,084 417 Morris Morris County 248 113.1 5.4 118.5 474,711 120.0 5.4 125.4 502,352 559,229 532,302 558,480 590,130 418 McPherson McPherson 685 312.4 13.5 325.9 1,305,555 331.5 13.5 345.0 1,382,070 1,544,645 1,463,943 1,542,801 1,622,982 419 McPherson Canton‐Galva 103 47.0 0.0 47.0 188,282 49.9 0.0 49.9 199,899 232,260 211,124 232,235 234,060 420 Osage Osage City 239 109.0 4.3 113.3 453,880 115.7 4.3 120.0 480,720 538,934 508,944 538,468 564,234 421 Osage Lyndon 122 55.6 0.0 55.6 222,734 59.0 0.0 59.0 236,354 275,105 249,755 274,586 276,888 422 Kiowa Kiowa County 67 30.6 0.0 30.6 122,584 32.4 0.0 32.4 129,794 151,082 137,455 150,790 152,388 423 McPherson Moundridge 77 35.1 0.0 35.1 140,611 37.3 0.0 37.3 149,424 173,632 157,669 173,594 174,798 426 Republic Pike Valley 89 40.6 4.8 45.4 181,872 43.1 4.8 47.9 191,887 200,691 203,937 200,587 226,092 428 Barton Great Bend 1,676 764.3 176.0 940.3 3,766,842 811.2 176.0 987.2 3,954,723 3,779,306 4,223,828 3,775,325 4,682,694 429 Doniphan Troy Public Schools 73 33.3 0.0 33.3 133,400 35.3 0.0 35.3 141,412 164,612 149,584 164,286 165,834 430 Brown South Brown County 334 152.3 35.1 187.4 750,724 161.7 35.1 196.8 788,381 753,155 841,801 752,552 933,252 431 Barton Hoisington 334 152.3 24.1 176.4 706,658 161.7 24.1 185.8 744,315 753,155 792,389 752,552 878,472 432 Ellis Victoria 36 16.4 0.0 16.4 65,698 17.4 0.0 17.4 69,704 81,178 73,669 80,980 81,672 434 Osage Santa Fe Trail 409 186.5 16.9 203.4 814,820 198.0 16.9 214.9 860,889 922,277 913,673 921,492 1,012,932 435 Dickinson Abilene 588 268.1 17.0 285.1 1,142,111 284.6 17.0 301.6 1,208,210 1,325,914 1,280,669 1,324,528 1,419,798 436 Montgomery Caney Valley 304 138.6 10.4 149.0 596,894 147.1 10.4 157.5 630,945 685,507 669,308 684,603 742,020 437 Shawnee Auburn Washburn 1,559 710.9 47.8 758.7 3,039,352 754.6 47.8 802.4 3,214,414 3,515,476 3,408,080 3,511,908 3,778,326 438 Pratt Skyline Schools 96 43.8 0.0 43.8 175,463 46.5 0.0 46.5 186,279 216,476 196,750 216,411 218,124 439 Harvey Sedgwick Public Schools 150 68.4 0.9 69.3 277,616 72.6 0.9 73.5 294,441 338,243 311,296 337,880 345,114 440 Harvey Halstead 251 114.5 3.0 117.5 470,705 121.5 3.0 124.5 498,747 565,994 527,810 565,461 585,150 443 Ford Dodge City 4,915 2,241.2 517.0 2,758.2 11,049,349 2,378.9 517.0 2,895.9 11,600,975 11,083,109 12,389,834 11,071,401 13,735,836 444 Rice Little River 64 29.2 0.0 29.2 116,975 31.0 0.0 31.0 124,186 144,317 131,166 144,274 145,416 445 Montgomery Coffeyville 1,200 547.2 126.5 673.7 2,698,842 580.8 126.5 707.3 2,833,444 2,705,947 3,026,260 2,703,043 3,355,026 446 Montgomery Independence 1,088 496.1 114.2 610.3 2,444,862 526.6 114.2 640.8 2,567,045 2,453,392 2,741,468 2,450,796 3,039,294 447 Montgomery Cherryvale 455 207.5 47.8 255.3 1,022,732 220.2 47.8 268.0 1,073,608 1,026,005 1,146,808 1,024,811 1,271,394 448 McPherson Inman 87 39.7 0.0 39.7 159,038 42.1 0.0 42.1 168,653 196,181 178,332 195,933 197,706 449 Leavenworth Easton 143 65.2 0.0 65.2 261,191 69.2 0.0 69.2 277,215 322,459 292,878 322,057 324,696 450 Shawnee Shawnee Heights 955 435.5 8.6 444.1 1,779,065 462.2 8.6 470.8 1,886,025 2,153,483 1,994,897 2,151,079 2,211,618 452 Stanton Stanton County 178 81.2 7.0 88.2 353,329 86.2 7.0 93.2 373,359 401,382 396,194 401,175 439,236 453 Leavenworth Leavenworth 1,897 865.0 199.2 1,064.2 4,263,185 918.1 199.2 1,117.3 4,475,904 4,277,652 4,780,386 4,272,837 5,299,716 454 Osage Burlingame Public School 101 46.1 0.5 46.6 186,680 48.9 0.5 49.4 197,896 227,751 209,327 227,581 232,068 456 Osage Marais Des Cygnes Valley 106 48.3 8.8 57.1 228,743 51.3 8.8 60.1 240,761 239,025 256,493 238,750 284,358 457 Finney Garden City 4,615 2,104.4 484.6 2,589.0 10,371,534 2,233.7 484.6 2,718.3 10,889,510 10,406,622 11,629,788 10,395,640 12,893,220 458 Leavenworth Basehor‐Linwood 298 135.9 0.0 135.9 544,415 144.2 0.0 144.2 577,665 671,977 610,463 671,107 676,782 459 Ford Bucklin 102 46.5 6.6 53.1 212,719 49.4 6.6 56.0 224,336 230,006 238,525 229,908 264,438 460 Harvey Hesston 135 61.6 0.0 61.6 246,770 65.3 0.0 65.3 261,592 304,419 276,707 303,906 306,768 461 Wilson Neodesha 334 152.3 28.2 180.5 723,083 161.7 28.2 189.9 760,739 753,155 810,806 752,552 898,890 462 Cowley Central 151 68.9 14.1 83.0 332,498 73.1 14.1 87.2 349,323 340,498 372,836 340,207 413,340 463 Cowley Udall 104 47.4 1.9 49.3 197,496 50.3 1.9 52.2 209,113 234,515 221,456 234,096 245,514 464 Leavenworth Tonganoxie 439 200.2 0.0 200.2 802,001 212.5 0.0 212.5 851,275 989,926 899,298 988,975 996,996 465 Cowley Winfield 1,017 463.8 78.3 542.1 2,171,653 492.2 78.3 570.5 2,285,423 2,293,290 2,435,113 2,290,699 2,699,658 466 Scott Scott County 382 174.2 14.0 188.2 753,929 184.9 14.0 198.9 796,793 861,393 845,394 860,525 937,236 467 Wichita Leoti 176 80.3 11.5 91.8 367,751 85.2 11.5 96.7 387,380 396,872 412,366 396,521 457,164 468 Lane Healy Public Schools 36 16.4 3.8 20.2 80,921 17.4 3.8 21.2 84,927 81,178 90,738 80,980 100,596 469 Leavenworth Lansing 572 260.8 0.0 260.8 1,044,765 276.8 0.0 276.8 1,108,861 1,289,835 1,171,514 1,288,227 1,298,784 470 Cowley Arkansas City 1,750 798.0 183.8 981.8 3,933,091 847.0 183.8 1,030.8 4,129,385 3,946,173 4,410,246 3,941,938 4,889,364 471 Cowley Dexter 46 21.0 0.0 21.0 84,126 22.3 0.0 22.3 89,334 103,728 94,332 103,784 104,580 473 Dickinson Chapman 373 170.1 8.1 178.2 713,869 180.5 8.1 188.6 755,532 841,099 800,474 840,047 887,436 474 Kiowa Haviland 33 15.0 0.0 15.0 60,090 16.0 0.0 16.0 64,096 74,414 67,380 74,464 74,700 475 Geary Geary County Schools 3,079 1,404.0 133.7 1,537.7 6,160,026 1,490.2 133.7 1,623.9 6,505,343 6,943,010 6,907,348 6,935,391 7,657,746 476 Gray Copeland 29 13.2 0.0 13.2 52,879 14.0 0.0 14.0 56,084 65,394 59,294 65,156 65,736 477 Gray Ingalls 58 26.4 0.0 26.4 105,758 28.1 0.0 28.1 112,569 130,787 118,589 130,777 131,472 479 Anderson Crest 95 43.3 5.6 48.9 195,893 46.0 5.6 51.6 206,710 214,221 219,659 214,084 243,522 480 Seward Liberal 3,545 1,616.5 372.4 1,988.9 7,967,533 1,715.8 372.4 2,088.2 8,365,329 7,993,819 8,934,139 7,985,333 9,904,722 481 Dickinson Rural Vista 104 47.4 1.5 48.9 195,893 50.3 1.5 51.8 207,511 234,515 219,659 234,096 243,522 482 Lane Dighton 75 34.2 0.0 34.2 137,005 36.3 0.0 36.3 145,418 169,122 153,626 168,940 170,316 483 Seward Kismet‐Plains 460 209.8 48.4 258.2 1,034,349 222.6 48.4 271.0 1,085,626 1,037,280 1,159,834 1,035,980 1,285,836 484 Wilson Fredonia 299 136.3 21.2 157.5 630,945 144.7 21.2 165.9 664,595 674,232 707,490 673,434 784,350 487 Dickinson Herington 207 94.4 20.6 115.0 460,690 100.2 20.6 120.8 483,925 466,776 516,580 466,331 572,700 489 Ellis Hays 1,018 464.2 16.2 480.4 1,924,482 492.7 16.2 508.9 2,038,653 2,295,545 2,157,957 2,293,026 2,392,392
Data from: http://www.ksde.org/Portals/0/School%20Finance/Action%20Items/SF17‐232.xlsxLPA recommendation from Plantiffs Exhibit 199, page 35-37 991347
Columns with 0.484 / 0.726 were calculated with 0.726 weighting to 4 LPA recommended districts. Other columns have High Density At-Risk as calculated in SB19.
2017ADEQ00082

SB19 AT‐RISK FUNDING WITH 0.456 AT‐RISK WEIGHTING SB19 AT‐RISK FUNDING WITH 0.484 AT‐RISK WEIGHTINGSF17‐232 KSDE SF17‐232 KSDE SF17‐232 SF17‐232 SF17‐232 0.484 / 0.726 0.456 0.484 / 0.726 0.456
SF17‐147 Col 2 0.456 SF17‐224 Col 3 $4,006 0.484 SF17‐224 Col 3 Col 7 $4,006 At‐Risk Weight x At‐Risk Weight x At‐Risk Weight x At‐Risk Weight xAdjusted Regular Proposed Estimated Funding Regular Proposed Estimated Funding LPA FY07 Base Montoy FY10 Base Trial Court Base Trial Court BaseFree Lunch At‐Risk High At‐Risk At‐Risk Provided for At‐Risk High At‐Risk At‐Risk Provided for $4,659 $4,492 $4,654 $4,980
USD # County District Name HdCt WTD FTE WTD FTE WTD FTE At Risk at 0.456 WTD FTE WTD FTE WTD FTE At‐Risk at 0.484Total STATE TOTALS 189,909 86,598.9 13,680.8 100,279.7 401,720,478 91,915.7 13,680.8 105,596.5 423,019,579 497,034,019 450,456,412 496,499,396 499,392,906 490 Butler El Dorado 889 405.4 72.8 478.2 1,915,669 430.3 72.8 503.1 2,015,419 2,004,656 2,148,074 2,002,616 2,381,436 491 Douglas Eudora 496 226.2 0.0 226.2 906,157 240.1 0.0 240.1 961,841 1,118,458 1,016,090 1,117,425 1,126,476 492 Butler Flinthills 87 39.7 2.1 41.8 167,451 42.1 2.1 44.2 177,065 196,181 187,766 195,933 208,164 493 Cherokee Columbus 454 207.0 37.8 244.8 980,669 219.7 37.8 257.5 1,031,545 1,023,750 1,099,642 1,022,484 1,219,104 494 Hamilton Syracuse 258 117.6 24.9 142.5 570,855 124.9 24.9 149.8 600,099 581,779 640,110 581,285 709,650 495 Pawnee Ft Larned 396 180.6 23.0 203.6 815,622 191.7 23.0 214.7 860,088 892,963 914,571 892,172 1,013,928 496 Pawnee Pawnee Heights 38 17.3 0.0 17.3 69,304 18.4 0.0 18.4 73,710 85,688 77,712 85,634 86,154 497 Douglas Lawrence 3,314 1,511.2 127.6 1,638.8 6,565,033 1,604.0 127.6 1,731.6 6,936,790 7,472,924 7,361,490 7,465,016 8,161,224 498 Marshall Valley Heights 150 68.4 3.2 71.6 286,830 72.6 3.2 75.8 303,655 338,243 321,627 337,880 356,568 499 Cherokee Galena 449 204.7 47.1 251.8 1,008,711 217.3 47.1 264.4 1,059,186 1,012,475 1,131,086 1,011,314 1,253,964 500 Wyandotte Kansas City 16,816 7,668.1 1,765.7 9,433.8 37,791,803 8,138.9 1,765.7 9,904.6 39,677,828 56,879,010 42,376,630 56,817,968 46,980,324 501 Shawnee Topeka Public Schools 9,115 4,156.4 957.1 5,113.5 20,484,681 4,411.7 957.1 5,368.8 21,507,413 30,830,886 22,969,842 30,797,798 25,465,230 502 Edwards Lewis 57 26.0 5.6 31.6 126,590 27.6 5.6 33.2 132,999 128,532 141,947 128,450 157,368 503 Labette Parsons 772 352.0 81.1 433.1 1,734,999 373.6 81.1 454.7 1,821,528 1,740,826 1,945,485 1,738,734 2,156,838 504 Labette Oswego 225 102.6 21.6 124.2 497,545 108.9 21.6 130.5 522,783 507,365 557,906 506,821 618,516 505 Labette Chetopa‐St. Paul 184 83.9 10.3 94.2 377,365 89.1 10.3 99.4 398,196 414,912 423,146 414,671 469,116 506 Labette Labette County 724 330.1 59.8 389.9 1,561,939 350.4 59.8 410.2 1,643,261 1,632,588 1,751,431 1,630,762 1,941,702 507 Haskell Satanta 180 82.1 18.9 101.0 404,606 87.1 18.9 106.0 424,636 405,892 453,692 405,363 502,980 508 Cherokee Baxter Springs 543 247.6 57.0 304.6 1,220,228 262.8 57.0 319.8 1,281,119 1,224,441 1,368,263 1,223,071 1,516,908 509 Sumner South Haven 75 34.2 1.1 35.3 141,412 36.3 1.1 37.4 149,824 169,122 158,568 168,940 175,794 511 Harper Attica 59 26.9 0.2 27.1 108,563 28.6 0.2 28.8 115,373 133,042 121,733 133,104 134,958 512 Johnson Shawnee Mission Pub Sch 7,648 3,487.5 283.8 3,771.3 15,107,828 3,701.6 283.8 3,985.4 15,965,512 17,245,903 16,940,680 17,227,246 18,781,074
Data from: http://www.ksde.org/Portals/0/School%20Finance/Action%20Items/SF17‐232.xlsxLPA recommendation from Plantiffs Exhibit 199, page 35-37 991347
Columns with 0.484 / 0.726 were calculated with 0.726 weighting to 4 LPA recommended districts. Other columns have High Density At-Risk as calculated in SB19.
2017ADEQ00083

Appendix O:
Kansas Legislative Research Department’s State General Fund
Overview for FY18-FY21
This is part of the legislative history of S.B. 19 that was introduced on June 6, 2017. See https://twitter.com/SmithForKansas/status/872270301840715777. This Court should take judicial notice of the projected ending balance. K.S.A. 60-409(b)(4); K.S.A. 60-412(c).

991369