Plain English, Readability, and 10-K Filingstloughra/Plain_English.pdf · Plain English,...
48
Plain English, Readability, and 10-K Filings Tim Loughran Mendoza College of Business University of Notre Dame Notre Dame, IN 46556-5646 574.631.8432 voice [email protected] Bill McDonald Mendoza College of Business University of Notre Dame Notre Dame, IN 46556-5646 574.631.5137 voice [email protected] August 4, 2009 Abstract: We examine readability of company disclosures by applying three different measures to a sample of 42,357 10-Ks during 1994-2007. Although all three measures find that better written documents have stronger announcement effects around the filing date, only one measure indicates an upward trend in readability over the sample period. Our readability measure, derived from SEC documentation surrounding the plain English initiative, appears to better capture text informativeness when compared with traditional measures that were originally designed to identify textbook grade levels. Our results indicate that the use of syllable counts in traditional readability measures does not translate well into business applications. We find significant relations between improved 10-K readability and increased small investor trading, the likelihood of seasoned equity issuance, and better corporate governance. Key words: Readability; disclosure; Fog; Flesch; textual analysis. Data Availability: From publicly available data sets. We thank Robert Battalio, Andrew Ellul, Margaret Forster, Paul Gao, Kathleen Hanley, Steven Kachelmeier (editor), Feng Li, Ray Pfeiffer, Jennifer Marietta-Westberg, two anonymous referees, and seminar participants at the 2009 American Finance Association annual meeting and University of Notre Dame for helpful comments. We are grateful to Betsy Laydon for research assistance.
Transcript of Plain English, Readability, and 10-K Filingstloughra/Plain_English.pdf · Plain English,...

Plain English, Readability, and 10-K Filings
Tim Loughran Mendoza College of Business
University of Notre Dame Notre Dame, IN 46556-5646
574.631.8432 voice [email protected]
Bill McDonald
Mendoza College of Business University of Notre Dame
Notre Dame, IN 46556-5646 574.631.5137 voice [email protected]
August 4, 2009
Abstract: We examine readability of company disclosures by applying three different measures to a sample of 42,357 10-Ks during 1994-2007. Although all three measures find that better written documents have stronger announcement effects around the filing date, only one measure indicates an upward trend in readability over the sample period. Our readability measure, derived from SEC documentation surrounding the plain English initiative, appears to better capture text informativeness when compared with traditional measures that were originally designed to identify textbook grade levels. Our results indicate that the use of syllable counts in traditional readability measures does not translate well into business applications. We find significant relations between improved 10-K readability and increased small investor trading, the likelihood of seasoned equity issuance, and better corporate governance. Key words: Readability; disclosure; Fog; Flesch; textual analysis. Data Availability: From publicly available data sets.
We thank Robert Battalio, Andrew Ellul, Margaret Forster, Paul Gao, Kathleen Hanley, Steven Kachelmeier (editor), Feng Li, Ray Pfeiffer, Jennifer Marietta-Westberg, two anonymous referees, and seminar participants at the 2009 American Finance Association annual meeting and University of Notre Dame for helpful comments. We are grateful to Betsy Laydon for research assistance.

Plain English, Readability, and 10-K Filings
We examine the SEC’s plain English rule of October 1998 in the general context of
readability measures, using a broad sample of 42,357 10-K filings over 1994-2007. The plain
English rule is an attempt to make firm disclosures easier to read and understand. The idea is
that investors, brokers, advisers, and others in the financial services industry will be more able to
assess and more likely to invest in companies whose financial disclosures are not buried in legal
jargon and obtuse language. The SEC recognizes that all consumers of firm disclosures should
benefit from better writing, however they emphasize that clear writing will most benefit a firm’s
“least sophisticated investors (A Plain English Handbook, 1998).” Although the rule is restricted
to prospectuses, SEC documents clearly encourage firms to adopt the principles in all their
filings and communications with shareholders.1
We first consider whether or not the plain English rule did indeed make reports more
readable. To accomplish this, we initially discuss what “readability” means in the context of firm
disclosures and compare our measure of plain English with traditional readability measures. We
then examine whether the dimensions of readability encouraged by the rule lead to different
behavior by investors and managers. Specifically, we consider whether improved 10-K
readability is related to increased trading by “average” investors or the likelihood of issuing
seasoned equity. We also examine whether firms whose governance emphasizes shareholder
rights are more likely to write more accessible documents. We argue that both investors and
firms benefit from improvements in writing style, to the extent that increased readability impacts
the response of stock returns to a firm’s disclosure.
1 See page 4 of A Plain English Handbook (1998) and page 68 of SEC Release #34-38164.
1

To evaluate the readability of 10-Ks, we use three different measures: the Fog Index
(Fog), the Flesch Reading Ease Score (Flesch), and a measure derived from SEC documentation
surrounding the plain English initiative. There are hundreds of potential readability measures
evolving from the early development of these formulas in the 1930s (see Dubay, 2007). We
chose Fog and Flesch as two that have long been dominate in general usage and also have
appeared in prior accounting literature (see Li, 2008 or Jones and Shoemaker, 1994).
The Fog measure is defined as a linear combination of average sentence length and
proportion of complex words (words with three or more syllables) whose scale provides an
estimate of grade level. Flesch uses the same two components, except instead of the binary
classification of complex words, an explicit count of syllables is included. The Flesch measure
is opposite in scale than Fog, with higher scores indicating greater ease in reading.2 For both the
Fog and Flesch measures, a longer average sentence length or a higher proportion of multi-
syllable words indicates that the text is less readable.
Our readability measure, Plain English, is a standardized statistic that uses a series of six
writing components specifically identified by the SEC. Plain English incorporates sentence
length, word length, legalese, personal pronouns, and other style directives from the SEC
documentation to serve as a measure of 10-K readability. Through a series of tests, we provide
evidence that the traditional readability formulas, derived primarily in the context of grade-
leveling kindergarten through high school texts, are measured with substantial noise. Our results
suggest that the Plain English measure provides a more robust measure of readability, which
should reduce measurement error and, in turn, attenuation bias when using such measures in
regression tests.
2 The Flesch-Kincaid readability measure rescales the Flesch Reading Ease Score to produce grade scores. We use the Reading Ease Score simply because it appears to be more common in application.
2

While the Fog and Flesch measures indicate no change in 10-K readability during the
1994-2007 time period, we find that our measure of plain English does notably improve after the
regulation is enacted. By definition, Fog and Flesch indicate that an increase in the average
number of syllables decreases readability, with this factor accounting for half of each measure’s
inputs. However, business text commonly contains multi-syllable words used to describe
operations. Words like corporation, company, directors, and executive are multi-syllable, yet are
presumably easy to comprehend for anyone we consider as “average” investors. One of the
longest words occurring with reasonable frequency is telecommunications.
We show that, based on frequency of occurrence, all of the top quartile of multi-syllable
words would likely be known to a typical investor reading a 10-K. Our evidence suggests that
syllable counts are not a robust measure of readability in the context of firm disclosures. Instead
of using readability measures created outside of the business domain, we advocate the use of
multidimensional measures, such as Plain English, to document readability in business and
financial documents.
Importantly, all three readability measures are linked to investor responses around the 10-
K filing date. That is, better written documents are more informative to investors. We measure
information content as the absolute value of the average market-adjusted returns for days 0-3
around the filing date.
When we use period-to-period differences to control for market structure changes
occurring over the time period, we find the plain English rule appears to have its intended effect
of encouraging engagement by “average” investors. That is, there is a clear positive relation
between the improvement in a firm’s plain English measure and increases in the proportion of
100-share trades.
3

We then apply the three readability measures to a logit model predicting seasoned equity
offerings (SEOs). Only the plain English variable is significantly linked to equity issuance. We
find that firms showing a higher year-to-year change in plain English usage are more likely to
issue seasoned equity in the following year.
The SEO results indicate that managers value the improved transparency of more
readable documents as measured by the plain English variable when issuing additional shares.
When we link the 10-K data to the Gompers, Ishii, and Metrick (2003) corporate governance
index, we find that firms with shareholder-friendly governance structures are more likely to file
10-Ks that score high on the plain English measure or Flesch Score.
Our paper makes several contributions. First, we show that words matter. All three
readability measures report a significant linkage with investor response. Better written 10-Ks are
more informative to the market. Second, the debate over improved 10-K readability depends on
the measure. In the time series, neither the Fog Index nor Flesch Score show any improvement.
The plain English measure, however, reports a significant improvement in 10-K readability after
the initiative’s enactment in 1998. Thus, it appears that the SEC was successful in encouraging
firms to improve 10-K readability.
We show that business text has a high proportion of multi-syllable words which lower the
readability values of the traditional readability measures. Yet, the most frequently occurring 10-
K complex words should be simple for the typical reader to comprehend.
Finally, 10-K readability is related to the behavior of both managers and investors.
Managers improve the readability of the 10-Ks prior to issuing seasoned equity. Small investors
trade a higher proportion of shares when the 10-K is better written. Companies that are more
shareholder friendly produce more readable documents.
4

I. The Plain English Rule
The plain English rule became effective October 1, 1998. Arthur Levitt as the Chairman
of the SEC championed the cause of improving disclosure documents:
Investors need to read and understand disclosure documents to benefit fully from the protections offered by our federal securities laws. Because many investors are neither lawyers, accountants, nor investment bankers, we need to start writing disclosure documents in a language investors can understand: plain English (A Plain English Handbook, p. 3).
The SEC Staff Legal Bulletin No. 7 provides a summary of the rule and corresponding
amendments:
“Companies filing registration statements under the Securities Act of 1933 must: • write the forepart of these registration statements in plain English; • write the remaining portions of these registration statements in a clear,
understandable manner; and • design these registration statements to be visually inviting and easy to read.”
Rule 421(d) specifically requires that issuers must:
“Substantially comply with these plain English principles: • short sentences; • definite, concrete everyday language; • active voice; • tabular presentation of complex information; • no legal jargon; and • no multiple negatives.”
The regulation was later amended, prescribing stylistic approaches to avoid, such as “legal and
highly technical business terminology,” or “legalistic or overly complex presentations that make
the substance of the disclosure difficult to understand.”
Although the plain English rule is mandated only for prospectuses, in documentation
surrounding the rule’s release the SEC clearly encourages firms’ conformance in all filings.
Arthur Levitt, then-Chairman of the SEC, in his foreword to A Plain English Handbook,
5

concludes with: “I urge you—in long and short documents, in prospectuses and shareholder
reports—to speak to investors in words they can understand” (p. 4). The SEC in its proposed
rules document states: “Our ultimate goal is to have all disclosure documents written in plain
English” (release #34-38164, p. 24), and later in the document: “We also encourage you to use
these techniques for drafting your other disclosure documents.”
Other papers have used textual analysis to study newspaper articles, company press
releases, and message board postings. The best known of these papers is Tetlock (2007), who
links the content of the popular “Abreast of the Market” column with the following day’s stock
returns. He finds that higher pessimism in the newspaper column predicts lower following day
stock returns.
Our paper is not the only research examining the overall readability of 10-K reports.3 Li
(2008), using a comparable sized sample to ours, finds that annual reports with lower earnings
are more difficult to read. He uses a Fog Index to gauge changes in readability and reports that
the mean and median index increases (i.e., 10-K readability declines) over the 1994-2004 sample
period. Unlike our paper, his main focus is on linking 10-K readability with current firm earnings
and earnings persistence.
In a contemporaneous paper, Miller (2008) examines how small and large investor
trading behavior is affected by 10-K length and readability. He finds that only small investors are
affected by readability and document length. Longer 10-Ks reduce small investor trading
volume. Miller (2008) presents evidence that less readable 10-Ks actually increase small investor
trading. He states that this finding might be caused by increased disagreement among traders.
Like Li (2008), Miller (2008) uses the Fog Index as his measure of readability.
3 Several earlier papers addressed readability concerns with relatively small sample sizes (see Lebar, 1982, Smith and Smith, 1971, and Soper and Dolphin, 1964).
6

Although we share a similar time period, Miller (2008) has only 13,249 observations
available for primary analysis compared to our sample of 42,357. Our sample is much larger
even though we remove firms with stock price less than $5 while Miller (2008) has a $1 price
screen. Although both papers obtain 10-K filings from EDGAR, Miller’s initial sample before
additional screens are implemented is less than half of our final sample.
II. Data
10-K Sample
Although electronic filing was not required by the SEC until May 1996, a significant
number of documents are available on EDGAR beginning in 1994. The initial 10-K sample
(including both 10-K and 10-K405 forms) covering 1994-2007 contains 113,196 documents. We
exclude amended documents, 10-K/A or 10-K405/A, from the sample. For our tests we link the
10-K sample to three databases: the Center for Research in Security Prices (CRSP), Compustat,
and the NYSE Trade and Quote (TAQ) databases.
Parsing 10-K Documents
To parse the 10-K filings we need to download the filings from the EDGAR web site,
clean extraneous coding from the document (HTML, embedded jpg’s, etc.), and parse the
document into words and sentences. Palmer (2000) provides a useful discussion from the natural
language processing literature on the challenges of this process and emphasizes a simple but
important theme that is common throughout the natural language processing literature—“an
algorithm that performs very well on a specific corpus may not be successful on another corpus.”
The formatting and structure of 10-K documents are far more complex than those of a traditional
novel, which is why we design custom software to parse the documents. A detailed discussion of
7

the parsing process is provided in the appendix.
Sample Composition
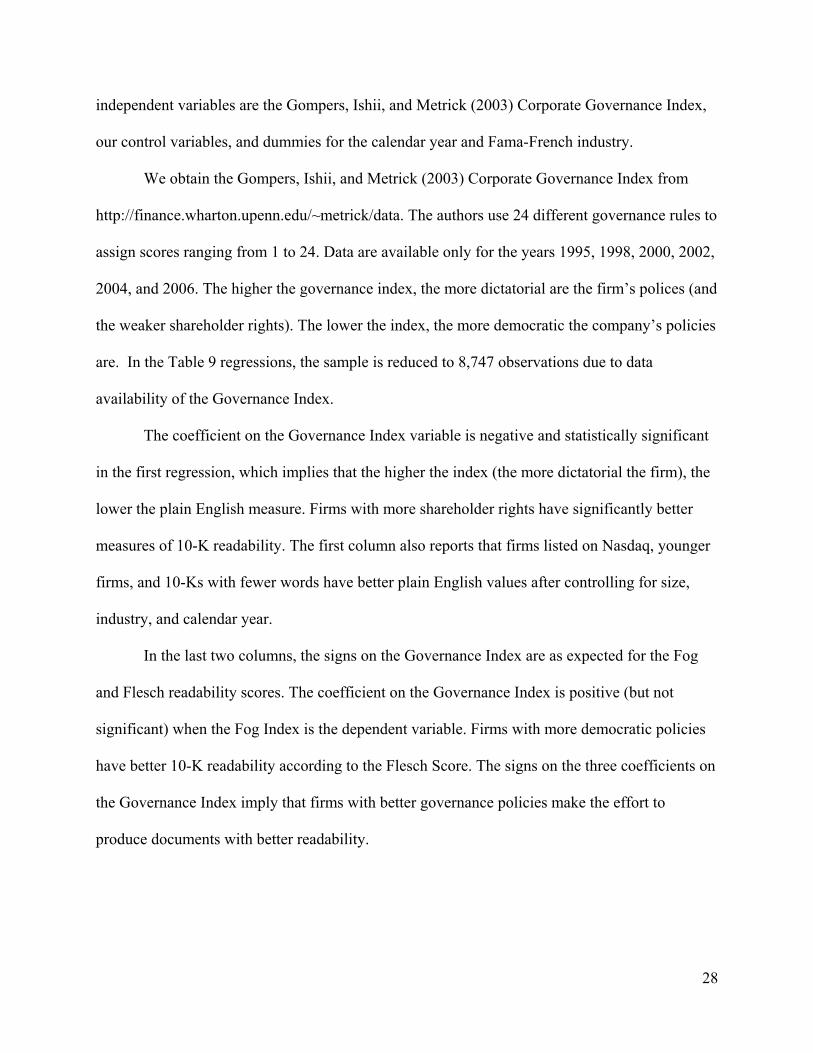
Table 1 documents the sample formation process. We start with a total of 113,196 10-K
firm-year observations. Requiring the 10-K to be present on CRSP and to be an ordinary
common equity firm (CRSP share type code of 10 or 11) substantially reduces the original
sample of 10-Ks. For example, there were over 10,000 observations for asset-backed securities in
the original 10-K sample, primarily attributable to filings for security offerings such as exchange
traded funds. These funds were removed from the sample by applying the CRSP ID match and
the ordinary common equity filter.
To minimize the effects of market microstructure bid-ask bounce, we eliminate firms
with a stock price of less than $5. This screen removes 13,518 mostly smaller market value firm-
year observations. We further require the firm to have Compustat and TAQ data. These two
requirements remove more than 5,000 observations. After applying these filters, the final sample
totals 42,357 firm-year observations. In our initial regressions, following Tetlock (2007), we will
examine the standardized change in readability. Thus, the final 10-K sample with differenced
variables is 32,939.
In untabulated results, we find that approximately 58% of the 10-Ks are filed in the
month of March. Most firms have December 31st fiscal year-ends and will wait to file until the
latest possible date. On average, 67%, 80%, and 90% of the 10-Ks are filed by the end of the
first, second, and third quarters, respectively. Because the sample size and composition is so
heterogeneous across months, our unit of analysis for time series will be years. Throughout the
8

paper, “year” is the calendar year of the 10-K filing. So, Google’s December 31, 2004, 10-K
which was filed on March 30, 2005, would be classified as a 2005 observation.4
III. Readability Measures
Readability is not a precisely defined construct. While some definitions refer only to the
general notion of “ease of reading words and sentences (Hargis, et. al, 1998),” others note the
problem of context. For example, McLaughlin (1969) defines readability as “the degree to
which a given class of people find certain reading matter compelling and comprehensible,”
acknowledging the notion of a targeted audience.
In a study of editing text to improve readability, Davison and Kantor (1982) emphasize
that changes based on context, such as the “background knowledge assumed in the reader,” are
more effective than “trying to make a text fit a level of readability defined by a formula.”
Clearly the SEC’s intent in mandating improved readability of firm disclosures is not to make
them accessible to everyone regardless of age or educational background. Measures primarily
designed to grade-level precollege text books will not necessarily capture the components of
clear business writing.
Lacking a precise definition of readability, we will assess the concept from an operational
perspective in multiple dimensions. We will first consider the relation between readability
measures and price impact of firm disclosures around the publication date. In this case we
operationalize the definition of readability as the informativeness of the disclosure. Other things
4 We also initially considered separately testing the Management Discussion and Analysis (MD&A) segment of the 10-Ks. Parsing out the MD&A section is challenging because of inconsistencies in how it is identified. Also, in a sample subset, we found more than 20 percent of the MD&A segments indicated that the discussion was “incorporated by reference” to the annual report. Many times the text explaining where and why the discussion was incorporated by reference was relatively lengthy, making it difficult to programmatically exclude such instances. Our primary readability regressions in Table 4, when applied to the MD&A subset, found none of the readability measures significant in explaining event period absolute returns.
9

being equal, a clearly written document should communicate more information, thus causing
greater price reaction. Once we establish that the plain English initiative affected writing style,
which in turn affects market reaction, we consider how readability influences investor and firm
actions.
Fog Index
First published in Gunning (1952), the Fog Index’s popularity is primarily attributable to
its ease of calculation and adaptability to computational measure. Unlike earlier measures, such
as Dale and Chall (1948), that require parsing sentences for grammatical structure or comparing
words with proprietary lists, the Fog Index is a simple function of two variables: 1) average
sentence length (in words) and 2) complex words (defined as the number of words with three or
more syllables). As is common with many readability measures, the two factors are combined in
a manner that is intended to predict grade level:
Fog = 0.4 (average # of words per sentence + percent of complex words)
Flesch Reading Ease Score
Although many of the readability studies in the accounting literature have focused on the
Fog Index, the Flesch Reading Ease Score is one of the most widely used (see Dubay, 2007).
After publishing an initial formula that involved counting affixes, personal pronouns, and names,
he subsequently simplified his measure to:
Flesch = 206.835 – (1.015*average # of words per sentence)
– (84.6 * average number of syllables per word)
Higher scores indicate documents that are easier to read. Scores below 30 are considered
appropriate for someone with an undergraduate degree.
10
Plain English
We create a new readability measure labeled Plain English that is anchored in specific
examples provided by the SEC documentation surrounding the plain English initiative. To
measure plain English we tabulate the following components for each document:
• Sentence length: The average number of words per sentence in the document. Rule 421(d) emphasizes this characteristic and sentence length is mentioned in specific examples in the Plain English handbook (e.g., pp. 28-29). Note that sentence length is also used in the Fog and Flesch measures of readability.
• Average word length: The SEC’s documentation emphasizes the use of “short, common words.” We count the character length of each word in the 10-K and average this across all words in the document.
• Passive: Pages 19-21 of the handbook emphasize the importance of avoiding passive voice. Passive voice can take many forms. We first identify auxiliary verb variants of “to be” including: “to be”, “to have”, “will be”, “has been”, “have been”, “had been”, “will have been”, “being”, “am”, “are”, “is”, “was”, and “were”. Auxiliary verbs followed by a word ending in “ed” or one of 158 tabulated irregular verbs are tabulated as passive.
• Legalese: A count of the words and phrases paralleling those identified in Staff Legal
Bulletin No. 7 (http://www.sec.gov/interps/legal/cfslb7a.htm) as inappropriate legal jargon (e.g., “by such forward looking” or “hereinafter so surrendered”). We use a list of 12 phrases and 48 words.
• Personal pronouns: A count of personal pronouns, whose usage the handbook (p. 22) indicates will “dramatically” improve the clarity of writing. The handbook targets first-person plural and second-person singular personal pronouns. Counts are tabulated for “we”, “us”, “our”, “ours”, “you”, “your”, “yours”.
• Other: We combine categories identified in the Plain English handbook whose
frequency of occurrence is relatively low. This includes negative phrases, superfluous words and the use of the word “respectively” (see pages 17-35 of the handbook). Specifically
− Negative phrases: Is a count of 11 negative compound phrases identified on page 27 of the handbook (e.g., “does not have” or “not certain”).
− Superfluous - A count of the eight phrases identified as superfluous on page 25 of the handbook (e.g., “because of the fact that” or “in order to”).
− Respectively - A count of each occurrence of the word “respectively”.
11

We then need to combine the six groups described above into an aggregate measure of
plain English. All word/phrase counts are expressed as a proportion relative to the total number
of words occurring in the document. Because some of the variables are measured on different
scales or their expected proportions might substantially differ, we standardize each of the six
components into a mean zero, standard deviation one variable and sum. All of the components
except personal pronouns are negatively signed in the summation. This process provides the
variable we label plain English, where higher values represent documents that better conform to
the writing standards promulgated by the SEC.
Li (2008) uses Fog and document length as his measures of readability. As emphasized
on page 11 of A Plain English Handbook, however, the goal of the regulation “is clarity, not
brevity” and “writing a disclosure in plain English can sometimes increase the length of
particular sections …” Therefore we use document length as a control variable (measured as the
natural log of the number of words) in our regressions but do not include it in our plain English
measure.
Time Series Patterns in Readability Measures
The mean values of the three readability measures are reported by year in Figure 1. Both
the Fog Index and the Flesch Reading Ease Score have fairly stable values throughout the time
period. The Flesch Score varies only slightly in a tight band around 32 which would be
considered a difficult to very difficult style according to Flesch (1949). The Fog Index stays just
below 20 during the period. Li (2008) reports an average Fog Index range for 10-Ks of about
19.05 to 19.57 during 1994-2004. Our range is almost identical, 19.24 to 19.57. Generally, a Fog
value greater than 18 is considered to be unreadable text.
12

Unlike the other readability measures, plain English varies widely. Plain English is fairly
flat initially with a range of -0.86 to -0.99 during 1994 to 1998. After implementation in 1998,
there is a continuing positive trend in the plain English measure through 2007. This result
indicates that in the 10-K sample, the plain English rule had a substantial impact on textual
presentation. In our subsequent presentation of sample statistics we will see that all of the
components of Plain English, except word length, improve over this period.
The three different measures of readability paint a conflicting picture on the impact of the
SEC’s directive. Fog and Flesch report no substantial trend in 10-K readability. This is consistent
with the evidence in both Li (2008) and Miller (2008). In his Figure 1A, Li (2008) finds that
readability declines from 1998 to 2001 and then increases, however the changes only range from
about 19.0 to 19.6. Miller (2008) finds a slight decrease in 10-K readability during 1995-2006.
Later in the paper we will highlight potential problems in the use of traditional two dimensional
reading measures to measure readability in financial documents like 10-Ks.
IV. Descriptive Statistics
Summary Statistics
Summary statistics for the sample variables are reported in Table 2. The sample is
divided into two periods: before the October 1, 1998, plain English rule [column (1)] and after
[column (2)]. The last column of the table lists the summary statistics for the entire period. The
average event period abnormal return is close to zero for both subperiods (-0.028% and -
0.227%). As was shown in Figure 1, the plain English measure reports substantially higher
values during the second period while Fog and Flesch show little change.
13

Consistent with the evidence in Li (2008), we find that the 10-K filings have become
more verbose. In untabulated results, we find that the median number of words rises from 21,500
in 1997, the first full year of mandatory electronic filing, to over 33,600 in the final sample year
of 2007. As the number of words in a 10-K has increased, Table 2 reports a decrease in the
average words per sentence. The average number of complex words (three or more syllables),
syllables per word, and word length are all slightly higher in the second period.
For the individual components of plain English, all report the trend advocated by the SEC
with the exception of word length. For example, the percent of legalese in the average 10-K
document drops from 0.491% to 0.349%. The largest change between the periods is in the
increased use of personal pronouns (0.193% versus 1.163%).
The average size of the sample firm is $3.3 billion with average share price of over $26.
Due to our Compustat data requirement and the $5 price screen, the sample is tilted towards
larger market capitalization firms. Table 2 also reports a slightly higher percentage of the sample
universe listing their shares on the Nasdaq exchange, versus the Amex or the NYSE in the later
period. The occurrence of seasoned equity issuance increased from 4.1% to 5.7%.
The Gompers, Ishii, and Metrick (2003) Governance Index is a measure of shareholder
rights for 8,747 firms during our sample period. The index, as defined, can range from 1 to 24—
democratic to dictatorship, respectively, using the terminology of the authors—and averages
approximately 9 in each period.
From the TAQ data, we tabulate the proportion of trades between 1 and 100 shares. We
tabulate this proportion for the period beginning with the document filing date and for the
subsequent 20 days, creating a 21-day sample window. Firms must have at least one day of
trading in the 21-day window to be included in the sample. For 1994 through September 1998,
14

17.0% of all trades were between 1 and 100 shares. In the second period (October 1998 to 2007),
that proportion jumped to 46.5%.
As the NYSE, Amex, and Nasdaq have moved toward quoting stock prices in decimals,
the quoted depth has dropped in size. Investors received better prices (i.e., closer to the mid-
point) while simultaneously being able to trade fewer shares at the improved price.5 Following
decimalization and the advent of electronic communication networks (ECNs), investors
increasingly split up their orders for trade execution (see Werner, 2003 and Chung,
Chuwonganant, and McCormick, 2004). Rather than submit an order to buy 5,000 shares of
Microsoft, investors might break the order into 50 different segments of 100 shares.
Also, when retail investors submit market orders, the brokerage house might execute
trades at prices that differ by one penny. These factors are the major drivers in the increase in
100-share trades observed over the sample interval. In our subsequent regressions, we use a
differencing method to control for this overall shift in trades.
Industry Results
Does the plain English measure vary across industries? Figure 2 documents the
variability of our plain English measure across the Fama and French (1997) 48 industries. Firms
are classified into the 48 categories based on SIC codes taken from the 10-K filings (self-
reported by the firms). The worst industries in terms of the plain English measure are Aircraft,
Precious Metals, Textiles, and Tobacco Products. The four industries with the highest values of
Plain English are Pharmaceutical Products, Medical Equipment, Alcoholic Beverages, and
Entertainment. There appears to be a slight pattern of industries that are more consumer oriented
(versus traditional manufacturing) having better Plain English values.
5 Starting January 29, 2001, all NYSE-listed stocks could be priced in decimals. For Nasdaq, all listed firms could be priced in decimals by April 9, 2001.
15

To control for the year-to-year changes in plain English documented in Figure 1 and the
large differences in plain English across industries, our subsequent regressions will include year
and Fama-French industry dummies.
Benchmarking the Traditional Readability Measures across Diverse Documents
To provide the reader with insights into the readability scores, Table 3 reports a
comparison of the traditional readability measures across a variety of different text. The Fog and
Flesch values are reported along with the average words per sentence, percent of complex words,
syllables per word, and word length. Since the plain English measure was initiated by the SEC
specifically for business documents and contains components we would never see in some of the
benchmarks, we did not include it in the comparison.
The documents are sorted from low to high by the Fog Index (low Fog values indicate the
text is easier to read). The table provides a sense of scale, highlights how the measures’ two
components impact the numerical estimate, and show how the measures, in spite of their
similarity, can indicate different levels of readability.
As one should expect, Dr. Seuss’ Green Eggs and Ham has a considerably lower Fog
Index (2.9) than either Adam Smith’s classic The Wealth of Nations (18.3) or Charles Darwin’s
On the Origin of Species (20.6).6 Table 3 reports that the children’s book Green Eggs and Ham
has both a low number of words per sentence (6.0) and few complex words (only 1.3%). On the
Origin of Species has the highest Fog Index with an average of 38.4 words per sentence and over
13% of all words being complex.
For Flesch, higher values indicate more readable text. Since Fog and Flesch have
different components, their relative ranking of the text is not identical. Notice that Nature
6 As noted in the appendix, we do not include single letter words in our counts. This will cause our measures to report texts as slightly less readable. The effect is more apparent for the children’s level books.
16

magazine and On the Origin of Species have almost identical Flesch Scores (40.3 versus 40.8).
The two documents, however, have considerably different Fog Indexes (15.2 versus 20.6).
Although the two common readability measures are correlated, they can differ dramatically
between documents.
Historically, readability measures have been used primarily to place textbooks into grade
level categories. Other applications include measuring readability of loan applications, insurance
contracts, military documentation, and technical manuals. There is some evidence that
traditional readability measures do a poor job gauging the text of technical material (see Redish
and Selzer, 1985 and Redish, 2000). The results in Table 3 support this contention.
Table 3 reports that a number of documents, including The Wealth of Nations, Harvard
Law Review, The Accounting Review (TAR), and 10-Ks have a Fog Index above 18 and hence
would be considered unreadable. Yet this is inaccurate. Both the 10-K sample and articles in The
Accounting Review use technical language to explain concepts. More than 20% of the words
contained in 10-K or TAR articles are complex.
In both TAR and the 10-Ks, the authors are writing to the educational backgrounds of
their respective audiences. People with only a high school degree are very unlikely to read TAR.
Survey results indicate that individuals with only a high school degree are also unlikely to have a
motive for reading 10-Ks. According to the Federal Reserve Bulletin survey of consumer
finances (February 2009), less than 10% of households headed by individuals with only a high
school diploma even hold any stocks. Over 30% of households with college graduates own
individual stocks. For money managers, the typical educational background is quite high.
Chevalier and Ellison (1999) find that 60% of mutual fund managers have an MBA degree. Just
17

because the average 10-K has a poor Fog or Flesch readability score does not indicate that the
typical reader cannot understand it.
V. Regression Results
Readability Measures and the Information Content of 10-Ks
The price response of stocks to 10-K releases is not substantial. In a pre-EDGAR
sample, Easton and Zmijewski (1993) find only weak evidence of a market reaction to 10-K
filings. Griffin (2003) shows a statistically significant reaction to 10-Ks using an EDGAR
sample, which is consistent with Christensen, et. al (2007) who find that the impact is only
discernable post-EDGAR. Our initial tests relate the market reaction of 10-K releases to the
various measures of readability.
More readable 10-Ks should be more revealing for investors. The use of plain English
should make documents more informative for all readers, whether the reader is an average retail
investor or a professional money manager. We measure information content as the absolute value
of the cumulative market-adjusted returns from the filing date to three days following the filing
date. The event window is based on the results reported in Griffin’s (2003) Table 2. The CRSP
value-weighted index is used as the market adjustment.
In Table 4 we first consider a regression of the information content measure with the
three measures of readability. Each regression contains 32,939 firm-year observations. The first
column reports the results with only the control variables. The firm specific control variables are:
1) Log(Words) - the log of the 10-K’s word count; 2) Log(Size) – the log of market
capitalization on the day before the file date (day t-1); 3) Log(Price) – the log of the firm’s stock
price on day t-1; 4) Intensity – the proportion of total 10-K filings occurring on a firm’s file date;
18

5) Pre-alpha – the alpha from a market model regression of daily data from the year prior to the
filing date using the CRSP value-weighted market index as the market proxy and excluding the
five days prior to the file date; 6) Pre-rmse – the root mean-square-error from the prior market
model regression; 7) Book-to-market – the book-to-market ratio taken from data reported within
the prior year and as defined in Fama and French (2001); and 8) Nasdaq dummy – a dummy
variable set equal to one for firms trading on the Nasdaq stock exchange. 7
All regressions also include an intercept, year dummies, and industry dummies. The
readability measures are based on normalized changes, as in Tetlock (2007) and Tetlock, Saar-
Tsechansky, and Macskassy (2008). The change is normalized based on the mean and standard
deviation of data from the same Fama-French 48 industry category in the past year. In column
(2), the variable of interest is the Fog Index. In column (3), the readability measure is the Flesch
score while the last column focuses on plain English.
For the results in column (1), where we only consider the control variables, Log(Words)
has an insignificant coefficient, indicating that longer documents do not affect information
impact. The fact that Log(Words) is at best only marginally significant in any of the regressions
supports the SEC’s contention that brevity is not the same as clarity.
Log(size) is significantly negative, indicating that smaller firms’ 10-Ks have a greater
influence on the underlying stock. This evidence is consistent with Griffin’s (2003) finding that
investor response is much stronger for small firms during the 1996-2001 time period. Older firms
have a lower response while firms with higher pre-filing volatility (measured by Pre-rmse) have
a stronger response.
7 Price and number of shares must be available within the prior 22 days and there must be at least 60 observations for the market model regressions to be included in the sample. In our initial tests we also included measures of earnings and unexpected earnings, however including these variables reduced the sample size and had no impact on the reported results.
19

If readability matters, improvements in the three measures should lead to higher market
responses. This is exactly what we find in the last three regressions of Table 4. In the second
column, the year-to-year change in the Fog Index leads to higher filing date announcement
returns. Recall that lower values of the Fog Index indicate better readability. Both the Flesch
Score and the plain English variable have positive and statistically significant coefficients. Thus,
improved 10-K readability has a positive and significant impact on the information content
measure.
Bloomfield (2008) notes that there are potentially many explanations for why firms might
produce longer and more complex documents. While in some cases the intent might be to
somehow diffuse bad news (“obfuscation,” “attribution”, or “misdirection”), some firm events
could simply require longer and more detailed explanation. While our results cannot discern
why some documents are poorly written, they do indicate that well-written documents are more
informative to investors. These results are consistent with Boomfield’s (2002) incomplete
revelation hypothesis, which is a logical extension of Grossman and Stiglitz (1980), that
“markets under-react (or at least react slowly) to information that is made obscure.”8
The Components of the Readability Measures
While the two traditional readability measures consist of one identical component (words
per sentence) and one very similar component (syllable count versus “complex words”), Plain
English is more of an omnibus measure. As previously defined, the plain English measure
includes the six components based on items encouraged by the SEC. Table 4 has shown that
there is a relationship between the three readability measures and the market’s reaction around to
8 In our sample we do not find that the correlations between the daily event period returns and readability decay in a manner that is consistent with a slow reaction for less readable disclosures.
20

the 10-K filing. Which of the various components have the strongest linkage with announcement
returns?
Table 5 reports regression results using the event period absolute returns as the dependent
variable. The independent variables are the components of each readability measure (expressed
as normalized differences). As before, each regression includes an intercept, year and industry
dummies. The control variables from Table 4 are also included in the regressions.
The intent of Table 5 is to provide some insights into the importance of the components
in each measure. However the results are qualified by the impact of multicollinearity attributable
to the relatively high levels of correlations between the components, especially for the Plain
English measure. That many of the component measures are highly correlated is an intentional
artifact of their design. Columns (1) and (2) include the two respective components of the Fog
Index and Flesch Score as the explanatory variables. In both the first two columns, the average
words per sentence has a negative and significant coefficient. So as the number of words per
sentence increase, the abnormal return on the filing date is lower.
Yet, in both of the first two columns, the second component of the readability measures is
not significant. In column (1), the average number of complex words has an insignificant
coefficient. The same is true for the average number of syllables per word in column (2). Hence,
although the Fog Index and Flesch have two components, the relationship between it and filing
date returns appears to be driven largely by the average words per sentence. The last column of
Table 5 breaks up the Plain English measure into its components. Individually, none of the plain
English components is significantly linked to filing date returns. Thus, it does not appear that the
measure is dominated by any single component. Notice that the R-squared values are almost
identical across the three regressions.
21

Why does the complexity of words used in a 10-K have no significant affect on filing
date returns? Table 6 reports the first quartile of the most frequent complex words (three or more
syllables) for the 10-K sample. The words company, agreement, and financial account for almost
7% of all words with three of more syllables. None of the most frequent complex words would
cause readers any difficulty in determining their meaning. The frequent 10-K usage of words like
business, corporation, management, or employee is not going to confuse the reader. These are
commonly known words used to describe business operations.
In untabulated results, we also examined the most frequent multi-syllable words
contained in 10-Ks. Telecommunication and telecommunications account for 75% of all seven
syllable word usage. The words consolidated, approximately, subsidiaries, subsidiary, and
liabilities make up 25% of all 5 syllable words. Table 6 highlights the reason why the complexity
of 10-K words has no significant effect on the document’s filing date. The most frequent multi-
syllable words contained in a 10-K are easily understood by the reader.
The list in Table 6 also highlights the challenge of measuring readability in business
documents. Although syllabication is an important discriminator in separating a first grade from
six grade text book, it does not measure clarity in business writing. These results suggest that the
Fog and Flesch measures may not be appropriate when applied to business writing. Although
our Plain English measure contains word length which is highly correlated with number of
syllables, this is only one of six components used to gauge readability.
Plain English and the Average Investor
Because of decimalization and the increasing role of ECNs, we expect the proportion of
100-share trades to increase for all firms over the sample period. Note we use “100-share” to
refer to trades of 100 shares or less. We focus on the change in Plain English relative to the
22

change in the proportion of 100-share trades, pre- and post-regulation. We do not use the other
readability measures because the table partitions the data relative to the plain English
implementation date.
We first partition firms into deciles according to the difference between their average pre-
and average post-plain English value. The corresponding average change in 100-share trades for
each plain English decile is plotted in Figure 3. Although all firms reflect the proportional
increase in 100-share trades primarily attributable to decimalization, the magnitude of increase is
clearly related to the plain English measure.
We test this relation at the level of individual firms in the regressions reported in Table 7.
For each firm we regress the difference in the average value of plain English between the pre-and
post-regulatory period on the same difference for the 100-share trades. Firms must have one
observation in each period to be included in the sample.
Since we have collapsed the sample on firms, there are now only 3,572 observations. For
control variables, we use the average post-regulatory period for the non-dummy variables. That
is, the size variable is the average value of market value during the post-October 1, 1998 time
period. The dummy variables take the value of the most recent observation. So if the firm is
listed on Nasdaq in 2007, the Nasdaq dummy takes a value of one in the regressions.
The coefficient on “Pre and Post 1998 Change in Plain English” in row (1) reflects the
impact of the change in the average level of plain English on the change in the average
proportion of 100-share trades across the pre- and post-regulatory period, after accounting for the
control variables. We first consider the change variable by itself in column (1). We then also
include our control variables in column (2), and finally in column (3) we add the industry
23

dummies. The signs and significance of the variables remain stable across the three regressions,
so we focus on the results of the full specification in column (3).
A number of the control variables are significant. For example, older firms experienced
less of an increase in 100-share trades. The higher is the pre-filing volatility (pre-rmse), the
lower is the change in the proportion of small trades. Because ECNs historically have played a
much larger role on Nasdaq than on the NYSE, 100-share trades are more predominant for
Nasdaq-listed firms.
In all cases, the results show a positive and significant relation between the change in
plain English and the change in 100-share trades. Thus, although firms on average experienced a
substantial increase in 100-share trades, those with greater improvement in writing style
experienced even greater growth in small trades. The coefficient on the change in plain English
variable is 0.013 with a t-statistic of 10.46. As there is little reason to expect large institutional
traders to be breaking up trades for any reason related to a firm’s writing style, the results
indicate that small investor trading increases with positive changes in writing style. Increased
trading by “average” investors was a central objective of the plain English regulation.
Our trading results are in sharp contrast to Miller (2008). He finds little support that
readability had an effect on the trading behavior of investors. The two papers differ in sample
sizes, time window used to measure small investor trading (our 21 days versus Miller’s 5),
definitions of small investors (Miller uses dollar amounts less than or equal to $5,000), and most
importantly, readability measures. Miller uses the Fog Index as the measure of readability while
we focus on plain English. We have already highlighted potential limitations when Fog is
applied to business text.
24

Readability Measures and Seasoned Equity Offerings
If managers view the 10-K as a vehicle to enhance firm transparency, one should see
improvements in writing style prior to equity issuance. That is, managers might be expected to
use clearer writing in an attempt to reduce information asymmetries between managers and
outsider investors. If managers did not care about clearly communicating with their shareholders,
one would not expect to see any improvement in the three readability measures.
Healy and Palepu (2001) link voluntary disclosure with the motive of equity issuance.
Clearly, managers have the incentive to reduce their cost of capital by providing voluntary
disclosure. We view the writing style of the 10-K as one way for managers to strategically
disclose information in anticipation of subsequently issuing equity to the public.
About 5% of our sample had a seasoned equity offering (SEO) in the year after the 10-K
filing date. We use the Thomson Financial Securities Data (also known as Securities Data Co.) to
identify all firms issuing seasoned equity during our sample period. Table 8 reports logit
regressions examining the relation between the three readability measures and equity issuance.
The dependent variable, equity issuance dummy, takes the value of one if the firm issued
seasoned equity in the year following the 10-K filing; otherwise it takes a value of zero.
The key control variable when examining SEOs is prior stock performance. Korajczyk,
Lucas, and McDonald (1990) show that stock performance in the prior year is a highly
significant determinant of the likelihood of equity issuance. Loughran and Ritter (1995) report
that their SEO sample had average raw returns of over 72% in the year prior to offering. In CFO
25

survey results, Graham and Harvey (2001) find that recent stock price performance is the third-
most important factor in determining firms’ equity issuance decisions.9
The independent variables are the normalized changes in each of the three readability
measures (Fog, Flesch, and Plain English), our control variables, and dummies for Fama-French
industry and calendar year. The first three columns include all firms, while columns (4), (5), and
(6) report results when the sample is restricted to only firms that issued equity at least once in the
sample period.
Columns (1) and (2) report that changes in either the Fog Index or the Flesch Score are
not related to the probability of issuing new equity. Li (2008) examines the relationship between
the Fog index and seasoned equity activity. He finds only a weak positive linkage (t-statistic of
1.69) between having an SEO and improved readability as measured by the Fog Index.
Unlike the other readability measures, the coefficient on the year-to-year change in plain
English is positive and statistically significant at conventional levels. In column (3), the
coefficient is 0.236 with a z-statistic of 8.66. The odds ratio for this coefficient is 1.266. This
odds ratio implies that when the change in plain English variable increases by one standard
deviation, the odds that equity is issued in the next year increase by 26.6%. The evidence using
plain English as a readability measure is consistent with the Healy and Palepu (1993, 1995)
hypothesis that managers who expect to issue equity can use voluntary disclosure to influence
investors’ perceptions of the firm.
As expected, the coefficient on the pre-alpha variable is positive and highly significant
across all of the regressions. The higher the prior abnormal performance, the more likely the firm
9 An argument could also be made for including the absolute value of the file date returns in the SEO logit regression. We tried this in subsequent robustness tests and the variable was not significant in any of the specifications.
26

will issue equity. As one would expect, younger firms and companies with lower book-to-market
ratios (i.e., growth firms) also are substantially more likely to have an SEO.
The last three columns of Table 8 restrict the sample to firms issuing seasoned equity at
least once during the sample period. This introduces a look-ahead bias. That is, in 1996, one
could not know which firms would subsequently issue equity over the next decade. Yet, even in
this restricted sample, the year-to-year change in plain English is positively and significantly
related to equity issuance. The untabulated odds ratio implies a one standard deviation increase
in the change in plain English raises the odds of a subsequent SEO by 10.1%.
Both the Fog and Flesch measures of readability are not related to the probability of
having a seasoned offering. The plain English evidence in Table 8 is consistent with the idea that
managers are attempting to reduce information asymmetries with outside investors. As the
overall writing quality of the 10-K improves as measured by plain English, so do the odds of
issuing equity even after controlling for other factors. The table also highlights that the plain
English measure may be better than Fog or Flesch at capturing the strategic disclosure behavior
of managers.
Readability Measures and Corporate Governance
The Gompers, Ishii, and Metrick (2003) Corporate Governance Index is a widely-used
proxy for shareholder rights. If our plain English measure does capture 10-K readability, one
might expect firms with strong shareholder rights to produce more readable 10-Ks. In Table 9,
we report regression results using our plain English measure (column 1), Fog Index (column 2),
and Flesch Score (column 3) as the dependent variables. Because our focus is on the level and
not change in writing style, in Table 9 we use levels of the readability measures. The
27
independent variables are the Gompers, Ishii, and Metrick (2003) Corporate Governance Index,
our control variables, and dummies for the calendar year and Fama-French industry.
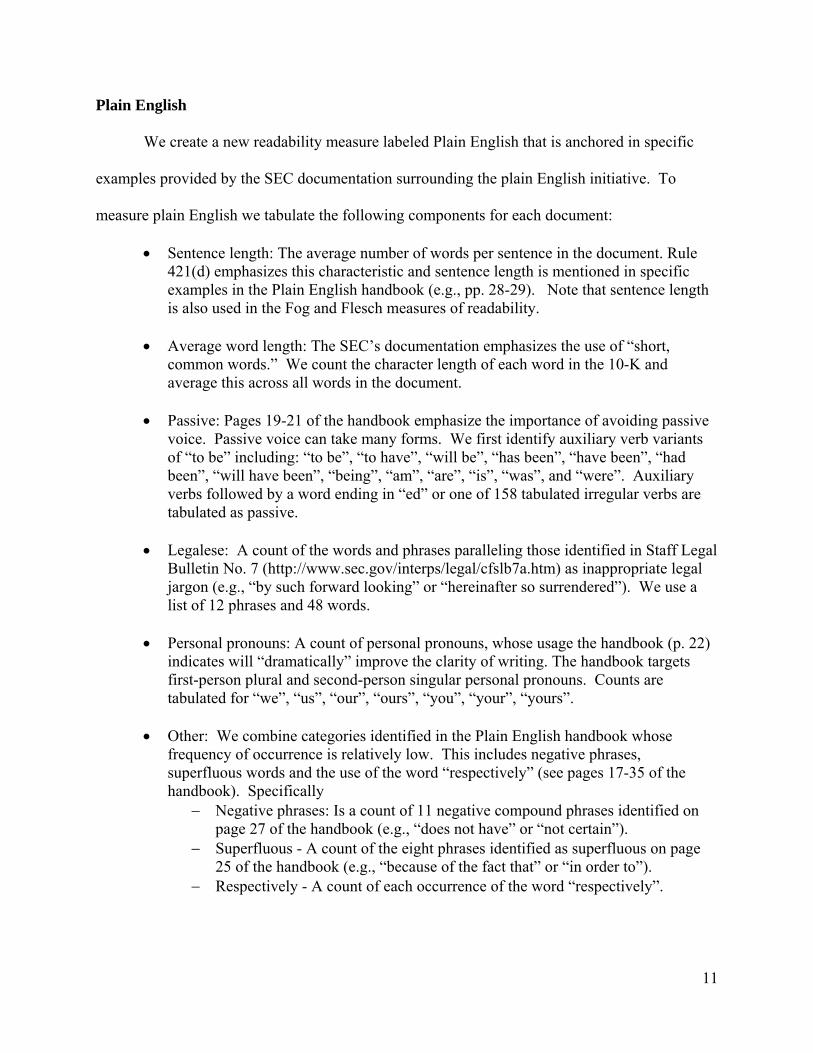
We obtain the Gompers, Ishii, and Metrick (2003) Corporate Governance Index from
http://finance.wharton.upenn.edu/~metrick/data. The authors use 24 different governance rules to
assign scores ranging from 1 to 24. Data are available only for the years 1995, 1998, 2000, 2002,
2004, and 2006. The higher the governance index, the more dictatorial are the firm’s polices (and
the weaker shareholder rights). The lower the index, the more democratic the company’s policies
are. In the Table 9 regressions, the sample is reduced to 8,747 observations due to data
availability of the Governance Index.
The coefficient on the Governance Index variable is negative and statistically significant
in the first regression, which implies that the higher the index (the more dictatorial the firm), the
lower the plain English measure. Firms with more shareholder rights have significantly better
measures of 10-K readability. The first column also reports that firms listed on Nasdaq, younger
firms, and 10-Ks with fewer words have better plain English values after controlling for size,
industry, and calendar year.
In the last two columns, the signs on the Governance Index are as expected for the Fog
and Flesch readability scores. The coefficient on the Governance Index is positive (but not
significant) when the Fog Index is the dependent variable. Firms with more democratic policies
have better 10-K readability according to the Flesch Score. The signs on the three coefficients on
the Governance Index imply that firms with better governance policies make the effort to
produce documents with better readability.
28

The Plain English measure appears to better capture this relation in the regressions. This
suggests that the plain English measure is better at capturing the governance intentions of public
companies than either Fog or Flesch.
VI. Conclusion
Our textual analysis of a sample of 42,357 10-Ks over 1994-2007 provides evidence that
words matter. We examine the effect of the SEC’s plain English rule of October 1998 by
considering three questions. The first relates to whether the rule improved 10-K readability. If
the measure is the SEC inspired statistic, then the answer is yes. Using a plain English measure,
firms have measurably improved the writing in their 10-Ks. If the measure is the Fog Index or
the Flesh Score, however, no improvement is documented. We highlight the potential limitation
in using readability measures created outside of the business field.
The second question addresses whether the enhanced readability in 10-Ks led to different
behavior by investors and managers. In this setting, we find strong evidence that behavior
changed. Improved readability affected the trading patterns of “average” investors and the
probability of managers issuing seasoned equity. We find a one standard deviation increase in
the change of plain English increases the odds of issuing equity in the next year by 26.6%. Of the
three readability measures, only plain English captures the intentions of managers who
subsequently issue equity.
Managers appear to be reducing the information differences between themselves and
outside investors through the writing of their 10-K documents as measured by plain English.
Further, companies with more democratic corporate governance policies have much higher plain
English measures than companies with weaker governance policies. Firms whose management is
29

shareholder-friendly also create 10-Ks that are more readable. In sum, our results indicate that
the plain English rule has produced a measurable impact on the behavior of investors and
managers.
A final question is whether investors and firms who improved their writing style are
better off. In untabulated results we consider regressions similar to those in Table 4 using the
post-period market model alpha as the dependent variable, to test if better writing style produces
higher abnormal returns. None of the readability measures are significant in these regressions.
This is not surprising. Although aspects of readability appear to have pervasive effects on some
of the firm and individual characteristics we consider in this paper, we do not expect them to be
the next factor to predict the cross-section of stock returns.
From our tests we cannot discern whether “average” investors are better off because they
trade more in stocks with more transparent disclosures. Improved writing style does not cause
firms to have better corporate governance, but is an interesting artifact of shareholder-centric
companies. However, our results on 10-K file-date returns imply that well written disclosures
appear to be more informative. To the extent that share prices now better reflect information
contained in financial disclosures, both investors and firms are better off.
Finally, traditional readability measures overestimate the impact of common multi-
syllable words on a reader’s ability to comprehend financial disclosures. Although all three of
the readability measures we test are significantly linked to investor responses around the filing
date, evidence is presented that the multidimensional SEC inspired metric more precisely
captures the relevant components of managements’ writing styles.
30

Appendix Downloading the 10-K Documents
We use the master.idx file from the SEC web site to identify filings from 1994-2007. We then programmatically download each 10-K or 10-K405 filing for subsequent parsing. Note that until 2003, a box on the front page of the 10-K form was to be check-marked if a “disclosure of delinquent filers pursuant to Item 405” was not included in the current filing, nor anticipated to be disclosed in statements incorporated by reference or amendments. If this box were checked, the form was filed as a 10-K405. In 2001, almost one-third of 10-K filings were 10-K405 forms. According to the SEC, because there was confusion and inconsistency in making this choice, the 405 provision was eliminated after 2002. As this choice has no impact on the focus of our study, we included both 10-K and 10-K405 forms in our sample and make no distinction between the two throughout the analysis. We use the WRDS CIK file to link the SEC’s CIK identifier to a CRSP permanent ID (Permno). We then use CRSP ticker symbols to link to the TAQ database. Parsing the 10-K Documents
Parsing is done using a series of VB.Net programs written by the authors. We use the following sequence to parse each 10-K:
1. Download text version of the 10-K filing and store as string variable. 2. Remove graphics – Increasingly through time the filings have ASCII encoded graphics
embedded in the file. ASCII encoding of a graphic increases the size of a file by orders of magnitude. For example, the median file size for the year 2000 was approximately 270KB and the largest filing without graphics was 5.7MB. Texas Utilities’ year 2000 filing included graphics and was 20.4MB.
3. Extract SIC code from SEC header. 4. Remove SEC header. 5. Reencode – Convert HTML “&XXX” codes back to text, e.g.,  =space. 6. Remove tables – Remove all characters between <TABLE> and </TABLE>. 7. Remove HTML – The quantity of HTML contained in the documents increased
substantially beginning in 2000. Many documents contain much more HTML than text. 8. Remove abbreviations – Counting words per sentence is important for the readability
measures. This is typically done by removing abbreviations and then counting the number of sentence terminators and the number of words. For traditional text this is quite effective after eliminating a few common abbreviations. Parsing 10-Ks, however, is much more difficult because they contain a variety of abbreviations and use periods to delineate section identifiers or as spacers. Liberman and Church (1992) find that 47% of the periods occurring in the Wall Street Journal are associated with abbreviations. We created a program that is more exhaustive in identifying abbreviations than the routine used in the PERL Fathom package. Because the PERL Fathom package does not deeply parse for abbreviations, it will tend to report more sentences than actually contained in a 10-K, thus making the average number of words per sentence downward biased.
9. Convert lists to sentences – As in the Fathom package, our sentence count is based on the number of sentence terminators. One challenge in parsing 10-Ks into sentences is that
31

the documents often contain lists separated by semicolons or commas that should not be treated as a single sentence. Redish (2000) notes the problem of measuring readability in texts with extensive lists. Our program attempts to identify such lists based on punctuation and line spacing. Where the program determines a sequence of text is a list, commas or semicolons delineating the list items are replaced with periods. In addition, to avoid counting the periods in section headers (e.g., Section 1.2.), ellipses, or other cases where a period is likely not terminating a sentence, there must be at least 20 characters between two periods for both to be counted.
10. Creating word and phrase counts - The cleaned document is next divided into tokens based on word boundaries using a regular expression. Each token is compared with a master dictionary file to determine if the token is a word. Only tokens of two or more letters are counted as words, thus the words “I” and “a” are not counted. Excluding one letter words avoids identifying section headers as words, although it will also make the Fog and Flesch measures reflect slightly lower levels of readability. The words for each document are then loaded into a dictionary for that specific filing containing the words and their counts. Word counts are derived from this dictionary. Phrases (for the plain English measure) are identified by applying regular expressions to the cleaned document.
Syllabification
Both the Fog and Flesch readability measures require a count of word syllables. As noted in Jurafsky and Martin (2009, p. 223), “There is no completely agreed-upon definition of a syllable.” We created a wordlist of 15,000 words and manually identified the number of syllables based on pronunciation to test our syllabification algorithms. The method used in the PERL Fathom package is only about 75% accurate. We use a similar method documented in Talburt (1986) as the basis of our algorithm and include a series of rules that improve the accuracy to over 90%.
32

REFERENCES
Bloomfield, R. 2002. The incomplete revelation hypothesis: Implications for financial reporting. Accounting Horizons 16: 233-244.
Bloomfield, R. 2008. Discussion of annual report readability, current earnings, and earnings
persistence. Journal of Accounting and Economics 45: 248-252. Chevalier, J., and G. Ellison. 1999. Are some mutual fund managers better than others? Cross-
sectional patterns in behavior and performance. Journal of Finance 54: 875-899. Christensen, T.E., W.G. Heninger, E.K. Stice, and D.R. Campbell. 2007. Assessing the impact
of EDGAR: Factors associated with analysts’ forecast revisions and price reactions around SEC filings. Working paper, Brigham Young University.
Chung, K., C. Chuwonganant, and T. McCormick. 2004. Order preferencing and market quality
on Nasdaq before and after decimalization. Journal of Financial Economics 71: 581-612. Dale, E. and J. Chall. 1948. A formula for predicting readability. Educational Research Bulletin
27: 11-20. Davison, A. and R. N. Kantor. 1982. On the failure of readability formulas to define readable
texts: A case study from adaptations. Reading Research Quarterly 17: 187-209. Dubay, W. 2007. Unlocking language. Charleston, South Carolina, BookSurge Publishing. Easton, P. and M. Zmijewski. 1993. SEC Form 10K/10Q reports and annual reports to
shareholders; Reporting lags and squared market model prediction errors, Journal of Accounting Research 31, 113-129.
Fama, E., and K. French. 1997. Industry costs of equity. Journal of Financial Economics 43:
153-193. Fama, E., and K. French. 2001. Disappearing dividends: Changing firm characteristics or lower
propensity to pay? Journal of Financial Economics 60: 3-43. Federal Reserve Bulletin. 2009. Survey of consumer finances,
http://www.federalreserve.gov/pubs/bulletin/2009/pdf/scf09.pdf . Flesch, R. 1949. The art of readable writing. New York, Harper. Gompers, P., J. Ishii, and A. Metrick. 2003. Corporate governance and equity prices. Quarterly
Journal of Economics 118: 107-155. Graham, J., and C. Harvey. 2001. The theory and practice of corporate finance: Evidence from
the field. Journal of Financial Economics 60: 187-243.
33

Griffin, P. 2003. Got information? Investor response to Form 10-K and Form 10-Q EDGAR
filings. Review of Accounting Studies 8: 433-460. Grossman S., and J. Stiglitz. 1980. On the impossibility of informationally efficient markets.
The American Economic Review 70: 393-408. Gunning, R. 1952. The technique of clear writing. New York, McGraw-Hill. Hargis, G., A. K. Hernandez, P. Hughes, J. Ramaker, S. Rouiller, and E. Wilde. 1998.
Developing quality technical information: A handbook for writers and editors. Prentice Hall. Healy, P., and K. Palepu. 1993. The effect of firms’ financial disclosure strategies on stock price.
Accounting Horizons 7: 1-11. Healy, P., and K. Palepu. 1995. The challenges of investor communications: The case of CUC
International Inc. Journal of Financial Economics 38: 111-141. Healy, P., and K. Palepu. 2001. Information asymmetry, corporate disclosure, and the capital
markets: A review of the empirical disclosure literature. Journal of Accounting and Economics 31: 405-440.
Jones, M.J. and P. A. Shoemaker. 1994. Accounting narratives: A review of empirical studies
of content and readability. Journal of Accounting Literature 13: 142-184. Jurafsky, D. and J. H. Martin. 2009. Speech and language processing. Prentice Hall. Korajczyk, R., D. Lucas, and R. McDonald. 1990. Understanding stock price behavior around
the time of equity issues, in R. Glenn Hubbard, Ed.: Asymmetric Information, Corporate Finance, and Investment, University of Chicago Press, Chicago.
Lebar, M. A. 1982. A general semantics analysis of selected sections of the 10-K, the annual report to shareholders, and the financial press release. The Accounting Review 57: 176-189.
Li, F. 2008. Annual report readability, current earnings, and earnings persistence. Journal of Accounting and Economics 45: 221-247.
Liberman, M.Y. and Church, K.W. 1992. Speech and Language Processing. In Furui, S. and
Sondhi, M. (Eds.), Advances in Speech Signal Processing, 791-832. Marcel Dekker. Loughran, T., and J. Ritter. 1995. The new issues puzzle. Journal of Finance 50: 23-51. McLaughlin, G. H. 1969. SMOG grading: A new readability formula. Journal of Reading
12: 639-646.
34

Miller, B. 2008. The effects of 10-K length and readability on small and large investor trading. Working paper, Indiana University.
Palmer, David D. 2000. Tokenisation and sentence segmentation. In Dale, Robert, Moisl,
Hermann and Somers, H. L., Handbook of Natural Language Processing, Taylor & Francis, 11-36.
A Plain English Handbook: How to create clear SEC disclosure documents. 1998. Office of
Investor Education and Assistance, U.S. Securities and Exchange Commission, http://www.sec.gov/pdf/handbook.pdf.
Redish, J. 2000. Readability formulas have even more limitations than Klare discusses. ACM
Journal of Computer Documentation 24: 132-137. Redish, J. and J. Selzer. 1985. The place of readability formulas in technical communication.
Technical Communication 32: 46-52. SEC Release #34-38164, http://www.sec.gov/rules/proposed/34-38164.txt. Smith, J. E., and N. P. Smith. 1971. Readability: A measure of the performance of the
communication function of financial reporting. The Accounting Review 46: 552-561. Soper, F., and R. Dolphin, Jr. 1964. Readability and corporate annual reports.
The Accounting Review 39: 358-362. Talburt, J. 1986. The Flesch index: An easily programmable readability analysis algorithm. In:
Proceedings of the 4th annual international conference on systems documentation. ACM. Tetlock, P. C. 2007. Giving content to investor sentiment: The role of media in the stock market.
Journal of Finance 62: 1139-1168. Tetlock, P. C., M. Saar-Tsechansky, and S. Macskassy. 2008. More than words: Quantifying
language to measure firms’ fundamentals. Journal of Finance 63: 1437-1467. Werner, I. 2003. Execution quality for institutional orders routed to Nasdaq dealers before and
after decimals. Working paper, Ohio State University. White, H. 1980. A heteroskedasticity-consistent covariance matrix estimator and a direct test for
heteroskedasticity. Econometrica 48: 817-838.
35
36
TABLE 1 Sample Creation
Sample Source / Screen Sample
EDGAR 10-K 1994-2007 complete sample 113,196
Minus Firms without CRSP Permanent ID match 42,198 Firms' filings that are not the first in a given year 414 Firms' filings with another 10-K filing within 180 days 80 Firms with missing CRSP return information 883 Firms that are not ordinary common equity 4,727 Firms with stock price < $5 13,518 Firms missing shares outstanding data 3,759 Firms missing COMPUSTAT data 4,887 Firms missing TAQ data 290 Firms with 10-K number of words < 2,000 83
Final 10-K firm-year sample 42,357 Minus
Loss of observations due to differencing 9,418 Final 10-K firm-year sample with differenced variables 32,939

TABLE 2 Variable Means
(1) (2) (3)
Variable 1994-
Sept. 1998 Oct. 1998-
2007 1994-2007
Event period abnormal return -0.028% -0.227% -0.167% Absolute value of event period abnormal return 0.036 0.042 0.040 Plain English Measure -0.924 0.404 0.002 Fog Index 19.299 19.219 19.243 Flesch Reading Ease Score 32.998 32.403 32.583 Average Words per Sentence 27.957 27.119 27.373 Average Percent of Complex Words 20.291 20.928 20.735 Average Syllables per Word 1.719 1.736 1.731 Average Word Length 5.367 5.414 5.400 Plain English - Passive 1.118% 1.085% 1.095% Plain English - Legalese 0.494% 0.349% 0.392% Plain English - Personal Pronouns 0.193% 1.163% 0.869% Plain English - Other 0.204% 0.199% 0.201% Number of Words 30,579.72 36,675.00 34,829.88 Size (in billions) $2.20 $3.78 $3.30 Price $26.50 $25.89 $26.08 Age (years) 28.995 22.044 24.149 Intensity 0.004 0.004 0.004 Pre-event market model alpha 0.050% 0.070% 0.064% Pre-event market model root-mean-square-error 0.026 0.029 0.028 Book-to-Market 0.609 0.597 0.600 Nasdaq dummy 0.505 0.562 0.545 SEO dummy 0.041 0.057 0.052 Governance Index* 9.085 9.091 9.089 Percent of 100-Share Trades 17.036% 46.487% 37.572% Sample size 12,822 29,535 42,357 *The number of observations for the Governance Index variable for columns 1-3 is 2,461, 6,286, and 8,747 respectively.

TABLE 3 A Comparison of Readability Measures
Source Fog Flesch
Average Words
per Sentence
Average Percent
Complex Words
Average Syllables
per Word
Average Word
Length Green Eggs and Ham 2.9 113.9 6.0 1.3 1.0 3.5Alice in Wonderland 7.3 86.9 15.2 3.1 1.2 4.1The Tale of Peter Rabbit 8.6 81.2 17.8 3.8 1.3 4.2David Copperfield 10.3 76.7 19.7 6.0 1.3 4.3Grimms Fairy Tales 11.5 79.5 26.6 2.1 1.2 4.0Time* 14.1 55.7 22.0 13.3 1.5 4.9Nature* 15.2 40.3 15.6 22.4 1.8 5.6Cell* 17.1 36.4 21.3 21.4 1.8 5.6Harvard Law Review* 18.2 38.3 26.8 18.7 1.7 5.2The Wealth of Nations 18.3 47.9 34.0 11.7 1.5 4.7The Accounting Review* 18.9 32.0 23.1 24.0 1.8 5.610-K Sample 19.2 32.6 27.4 20.7 1.7 5.4On the Origin of Species 20.6 40.8 38.4 13.2 1.5 4.8*Average of three articles.

TABLE 4 File Date Event Period Absolute Return Regressions for Readability Measures
Variable (1) (2) (3) (4)
∆Fog Index -0.013 (-1.79) ∆Flesch Score 0.016 (2.17) ∆Plain English 0.015 (2.32) Control Variables
Log(Words) 0.008 0.021 0.020 0.008 (0.72) (1.63) (1.68) (0.79) Log(Size) -0.029 -0.030 -0.029 -0.029 (-4.82) (-4.96) (-4.85) (-4.86) Log(Price) -0.048 -0.048 -0.048 -0.047 (-3.26) (-3.22) (-3.24) (-3.19) Age (in years) -0.002 -0.002 -0.002 -0.001 (-2.99) (-2.97) (-3.01) (-2.81) Intensity 2.608 2.615 2.618 2.618 (1.90) (1.91) (1.91) (1.91) Pre-alpha -4.508 -4.388 -4.674 -4.909 (-0.93) (-0.90) (-0.96) (-1.01) Pre-rmse 18.777 18.708 18.724 18.624 (21.73) (21.63) (21.67) (21.56) Book-to-market -0.058 -0.059 -0.058 -0.056 (-2.77) (-2.83) (-2.79) (-2.67) Nasdaq Dummy 0.010 0.010 0.010 0.008 (0.60) (0.58) (0.59) (0.49)
Adjusted R2 11.94% 11.94% 11.95% 11.95%
Included in each regression but not tabulated are an intercept, year dummies, and industry dummies. The sample size for each regression is 32,939. The t-statistics (in parentheses) are based on standard errors calculated using White's (1980) heteroskedasticity-consistent methodology.

TABLE 5 Event Period Absolute Return Regressions for Readability Measure Components
Variable (1) (2) (3) ∆Average words per sentence -0.006 -0.007 -0.002 (-3.38) (-3.35) (-0.33) ∆Average complex words -0.006 (-0.77) ∆Average number of syllables per word -0.008 (-1.15) ∆Average word length -0.016 (-1.76) ∆Plain English-Passive 0.001 (0.08) ∆Plain English-Legal -0.012 (-1.14) ∆Plain English-Personal pronouns 0.008 (1.69) ∆Plain English-Other 0.004 (0.61) Adjusted R2 11.94% 11.94% 11.95%
Included in each regression but not tabulated are an intercept, year dummies, industry dummies and the control variables from Table 4. The sample size for the regressions is 32,929. The t-statistics (in parentheses) are based on standard errors calculated using White's (1980) heteroskedasticity-consistent methodology.

TABLE 6 First Quartile of Most Frequently Occurring Complex Words
Word
% of Total
Complex Words
Cumulative % Word
% of Total
Complex Words
Cumulative %
COMPANY 4.22% 4.22% FOLLOWING 0.45% 18.02% AGREEMENT 1.33% 5.55% CAPITAL 0.44% 18.46% FINANCIAL 1.32% 6.87% OPERATING 0.43% 18.89% INTEREST 1.05% 7.92% MATERIAL 0.41% 19.30% BUSINESS 0.81% 8.73% BORROWER 0.39% 19.68% CORPORATION 0.69% 9.43% EXPENSES 0.37% 20.06% SECURITIES 0.68% 10.11% COMPENSATION 0.37% 20.43% INCLUDING 0.65% 10.76% OUTSTANDING 0.36% 20.80% PERIOD 0.63% 11.39% EFFECTIVE 0.36% 21.16% OPERATIONS 0.62% 12.00% ADDITIONAL 0.35% 21.50% EXECUTIVE 0.57% 12.57% OBLIGATIONS 0.35% 21.85% RELATED 0.55% 13.12% SUBSIDIARIES 0.35% 22.20% MANAGEMENT 0.54% 13.66% APPLICABLE 0.34% 22.54% PROVIDED 0.53% 14.20% PROPERTY 0.33% 22.87% SERVICES 0.50% 14.70% INSURANCE 0.33% 23.20% INFORMATION 0.49% 15.19% ACCORDANCE 0.32% 23.51% DIRECTORS 0.49% 15.69% BENEFIT 0.31% 23.83% CONSOLIDATED 0.49% 16.18% PROVISIONS 0.31% 24.14% APPROXIMATELY 0.48% 16.66% PRIMARILY 0.31% 24.45% ACCOUNTING 0.47% 17.13% PARTICIPANT 0.31% 24.76% EMPLOYEE 0.45% 17.57% RESPECTIVELY 0.31% 25.07%
41

Table 7 Regressions with Change in Proportion of 100-Share Trades as the Dependent
Variable
(1) (2) (3) Pre/Post-1998 Change in Plain English 0.019 0.015 0.013 (12.23) (11.60) (10.46) Control Variables
Log(Words) 0.007 0.018 (1.65) (4.06) Log(Size) -0.005 -0.008 (-2.01) (-3.30) Log(Price) 0.011 0.017 (2.02) (2.98) Age (in years) -0.001 -0.001 (-9.92) (-8.94) Intensity -2.999 -2.307 (-7.07) (-5.19) Pre-alpha 29.705 32.136 (18.94) (19.50) Pre-rmse -4.599 -5.354 (-21.53) (-20.61) Book-to-market -0.015 -0.014 (-2.20) (-2.04) Nasdaq Dummy 0.150 0.163
(28.84) (29.64) Intercept Yes Yes Yes Fama-French Industry Dummies No No Yes Sample Size 3,572 3,572 3,572 Adjusted R2 4.11% 37.79% 40.72%
The t-statistics (in parentheses) are based on standard errors calculated using White's (1980) heteroskedasticity-consistent methodology.
42

Table 8 Logit Regression of the Probability of Issuing Seasoned Equity in the Subsequent Year
Full Sample (N=32,915)
Firms Having at Least One SEO (N=9,654)
(1) (2) (3) (4) (5) (6) ∆Fog 0.000 0.033 (0.02) (0.89) ∆Flesch 0.007 0.002 (0.22) (0.05) ∆Plain English 0.236 0.096 (8.66) (3.36) Control Variables
Log(Words) 0.350 0.357 0.405 0.161 0.200 0.224 (6.60) (6.82) (8.96) (2.54) (3.50) (4.62) Log(Size) 0.073 0.072 0.065 -0.096 -0.100 -0.100 (3.07) (3.07) (2.70) (-3.00) (-3.15) (-3.11) Log(Price) -0.063 -0.062 -0.045 -0.026 -0.023 -0.024 (-1.06) (-1.06) (-0.76) (-0.37) (-0.31) (-0.33) Age (in years) -0.020 -0.020 -0.018 -0.006 -0.006 -0.006 (-7.99) (-7.99) (-7.43) (-2.36) (-2.36) (-2.28) Intensity -5.382 -5.377 -5.122 -10.498 -10.554 -10.481 (-0.97) (-0.97) (-0.92) (-1.73) (-1.74) (-1.73) Pre-alpha 237.115 237.037 229.101 252.652 252.704 249.578 (12.54) (12.54) (12.08) (12.15) (12.15) (11.98) Pre-rmse 3.557 3.524 1.709 -2.589 -2.834 -3.761 (1.32) (1.31) (0.64) (-0.73) (-0.80) (-1.07) Book-to-market -0.323 -0.323 -0.289 -0.378 -0.381 -0.365 (-3.72) (-3.73) (-3.35) (-3.72) (-3.75) (-3.59) Nasdaq Dummy 0.021 0.020 -0.019 -0.012 -0.013 -0.032
(0.31) (0.30) (-0.28) (-0.15) (-0.17) (-0.42)
The z-statistics (in parentheses) are based on standard errors calculated using White's (1980) heteroskedasticity-consistent methodology.
43

Table 9 Regressions of Readability Measures on the Gompers, Ishii, and
Metrick (2003) Corporate Governance Index and Other Variables
Dependent Variable Plain English Fog Flesch
Governance Index -0.039 0.009 -0.035 (-4.78) (1.31) (-2.15) Control Variables
Log(Words) -0.156 2.313 -4.083 (-4.59) (56.60) (-44.03) Log(Size) 0.037 -0.234 0.278 (1.83) (-12.96) (6.54) Log(Price) -0.072 0.134 -0.286 (-1.58) (3.55) (-3.17) Age (in years) -0.006 0.000 0.003 (-4.15) (0.22) (0.97) Intensity 0.849 -4.703 5.325 (0.21) (-1.35) (0.63) Pre-alpha 16.638 21.086 12.723 (1.05) (1.56) (0.39) Pre-rmse 24.012 -12.770 16.688 (7.96) (-5.18) (2.80) Book-to-market -0.155 -0.282 0.260 (-2.37) (-5.02) (1.96) Nasdaq Dummy 0.358 -0.113 0.094 (6.36) (-2.47) (0.85)
Adjusted R2 20.93% 47.85% 36.17%
Included in each regression but not tabulated are an intercept, year dummies, and industry dummies. The sample size is 8,747 for each regression. The t-statistics (in parentheses) are based on standard errors calculated using White's (1980) heteroskedasticity-consistent methodology.
44

‐1.5
‐1
‐0.5
0
0.5
1
1.5
0
5
10
15
20
25
30
35
1994 1995 1996 1997 1998 1999 2000 2001 2002 2003 2004 2005 2006 2007
Plain
English
Fog
&
Flesch
Year
Figure 1Means of Readability Measures by Year
Fog
Flesch
Plain English
45

‐1.5
‐1
‐0.5
0
0.5
1
1.5
Aero
Gold
Txtls
Smok
eRu
bbr
Insur
Mines
FabP
rCh
ems
Autos
Ships
ElcEq
BldM
tBa
nks
Mach
Gun
sPa
per
Hshld
Util
Whlsl
Book
sFood
Steel
Toys
Boxes
Cnstr
Fin
LabE
qHlth
Tran
sAgric
PerSv
RlEst
Telcm
Comps
Meals
Rtail
Soda
Coal
BusSv
Clothe
sCh
ips
Other Oil
Fun
Beer
Med
EqDrugs
Plai
n E
nglis
hFigure 2
Plain English Measure by Fama-French Industry

0.00
0.05
0.10
0.15
0.20
0.25
0.30
0.35
Low 2 3 4 5 6 7 8 9 High
Chan
ge in
Propo
rtion of 100
Sha
re Trade
s
Change in Plain English ‐ Decile
Figure 3Change in Proportion of 100-Share Trades Relative to Change in Plain English Decile