Placescount: The Hands-Free Approach to Indoor Audience Metrics
29
Placescount: The Hands-Free Approach to Indoor Audience Metrics January 2016
-
Upload
kelly-mcgillivray -
Category
Data & Analytics
-
view
233 -
download
0
Transcript of Placescount: The Hands-Free Approach to Indoor Audience Metrics

Placescount:
The Hands-Free Approach to
Indoor Audience Metrics
January 2016

What’s the Hype?
Location Analytics
Real Time
Cost-Effective
Accurate

WHAT we want to measure
Number of people • By location in real time
• Time-sensitive Dwell time • By location and time period
• Time in venue Frequency • Visits per week and month
• Places visi Footpath Analysis • Relationship within and among locations

WHERE we want to measure
• Airports
• Malls
• Stations
• Stores
• Campuses
• Stadiums
• Casinos/hotels
• Public squares

I’m going to talk about…
Technology choice
Pilot test
Results
Q & A

Technology Choice

Technology Considered
Manual Counts
Paper, clicker or tablet recording
Static Devices
Infrared beam, video recognition, heat sensing, etc.
Mobile Technology
Cellular data, Wi-Fi, Beacons
We liked these

Considerations: Detection Rate
Cellular Wi-Fi Beacon
Smartphone on Wi-Fi enabled Bluetooth enabled App installed/open % Consumers 64% - 70% 39% - 67% <1% - 22%

Considerations: Cost
Cellular $$$ (data)
Wi-Fi $$ (routers, Wi-Fi, data)
Beacon $ (beacons,
data)

Considerations: Granularity Cellular
100,000 ft2
200’ radius
Wi-Fi
30,000 ft2
100’ radius
Beacon 8,000 ft2
50’ radius

Considerations: Intrusiveness
Beacons:
Require opt-in
Cellular/Wi-Fi: Passive and anonymous

Wi-Fi: Selected for Pilot Test
Cons Pros
BUT… We needed to
know this

Shopping Mall Pilot Test
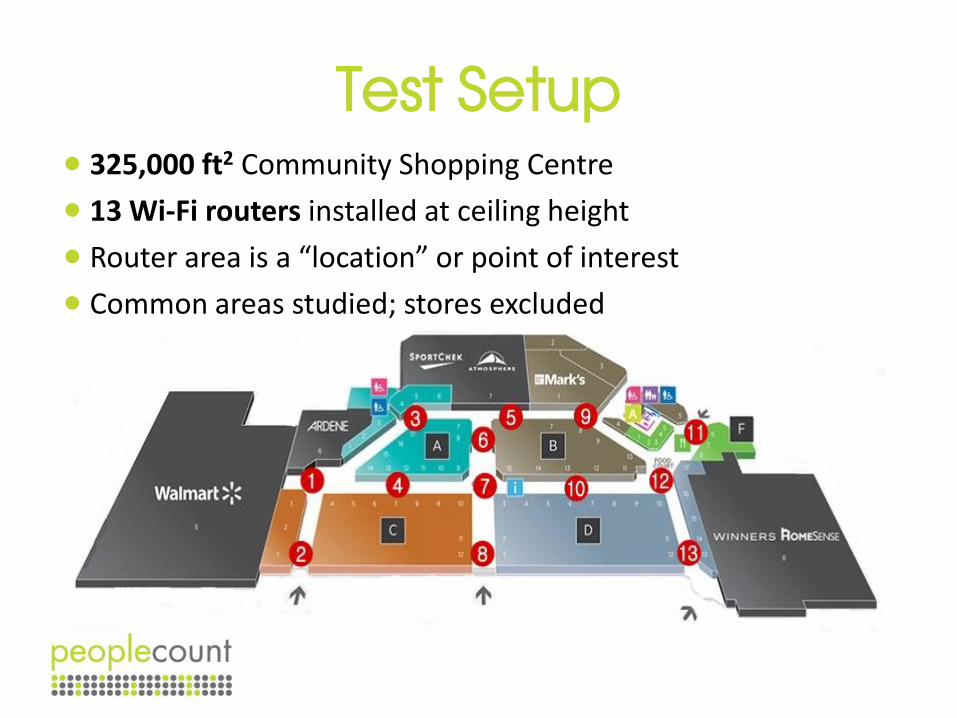
Test Setup 325,000 ft2 Community Shopping Centre
13 Wi-Fi routers installed at ceiling height
Router area is a “location” or point of interest
Common areas studied; stores excluded
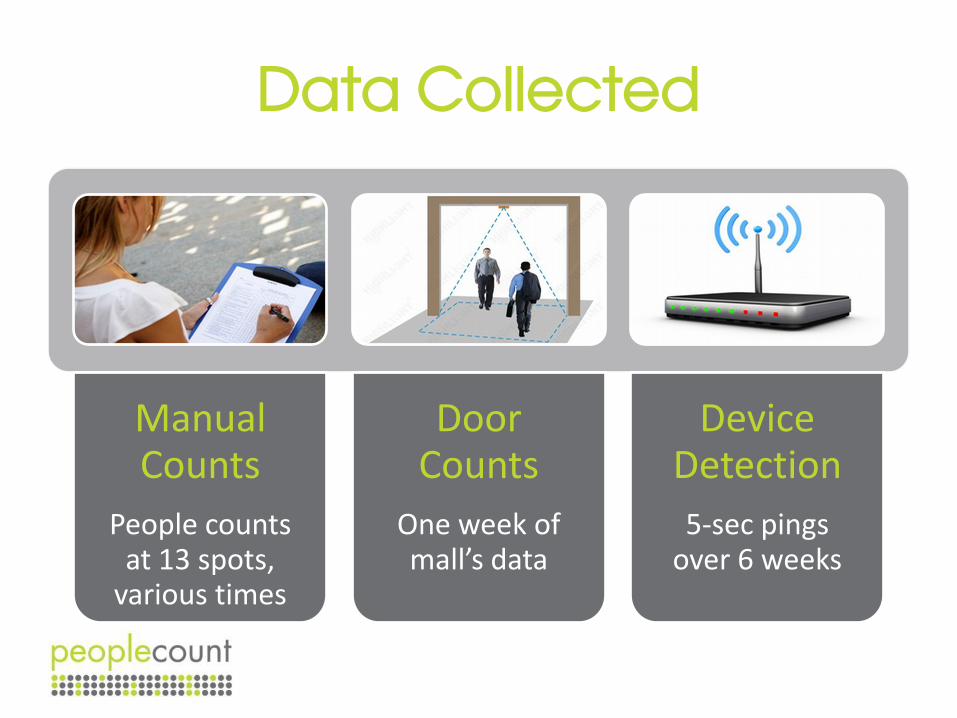
Data Collected
Manual Counts
People counts at 13 spots,
various times
Door Counts
One week of mall’s data
Device Detection
5-sec pings over 6 weeks
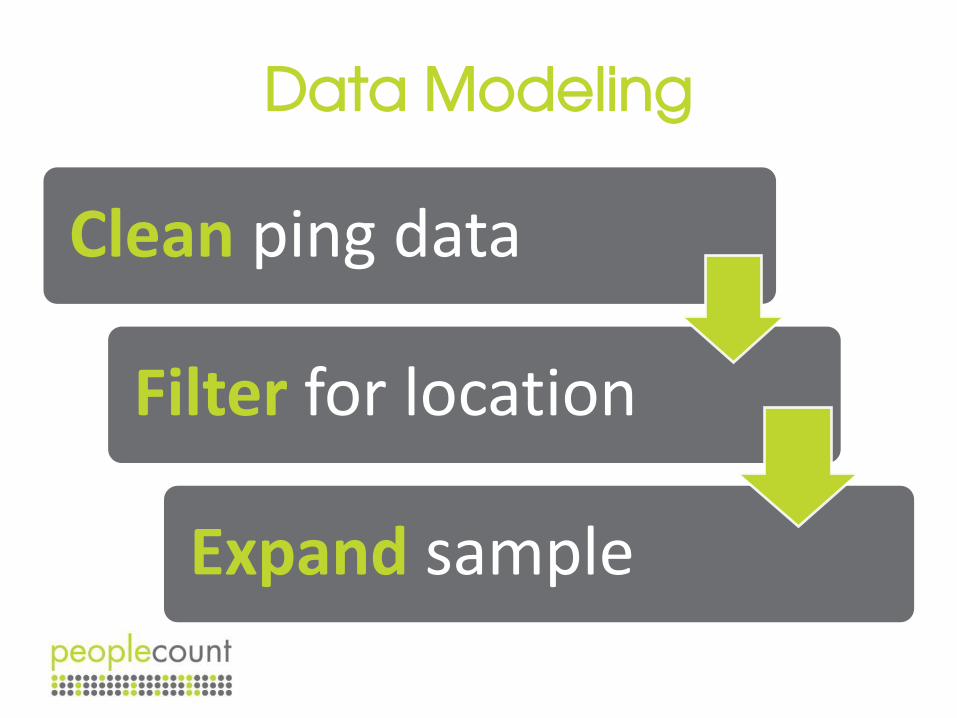
Data Modeling
Clean ping data
Filter for location
Expand sample

Clean Ping Data Raw data are noisy; require filtering and cleaning
Remove static devices, staff, after-hours pings, single pings, weak signals
Consolidate multiple pings from same device and location

Clean Ping Data Raw data are noisy; require filtering and cleaning
Remove static devices, staff, after-hours pings, single pings, weak signals
Consolidate multiple pings from same device and location

Filter for Location
Geofenced polygon areas defined

Filter for Location
Geofenced polygon areas defined

Expand Sample
No device
No smartphone
Wi-Fi disabled
Ping rate
Every 5 seconds
Some devices missed
Dwell time
Walking speed thru
area
Short dwells may be missed

Results
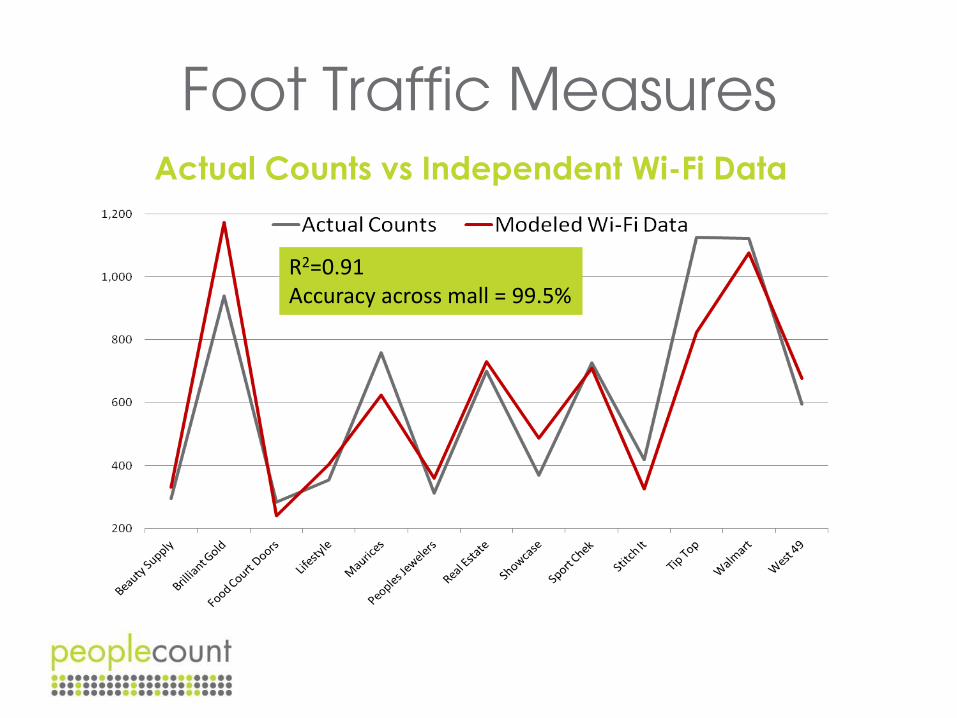
Foot Traffic Measures Actual Counts vs Independent Wi-Fi Data
R2=0.91 Accuracy across mall = 99.5%

Other Measures
Average Dwell time • 50 minutes
Average Frequency • 1.3 visits per month
Footpath Analysis • 2.4 locations in mall per visit
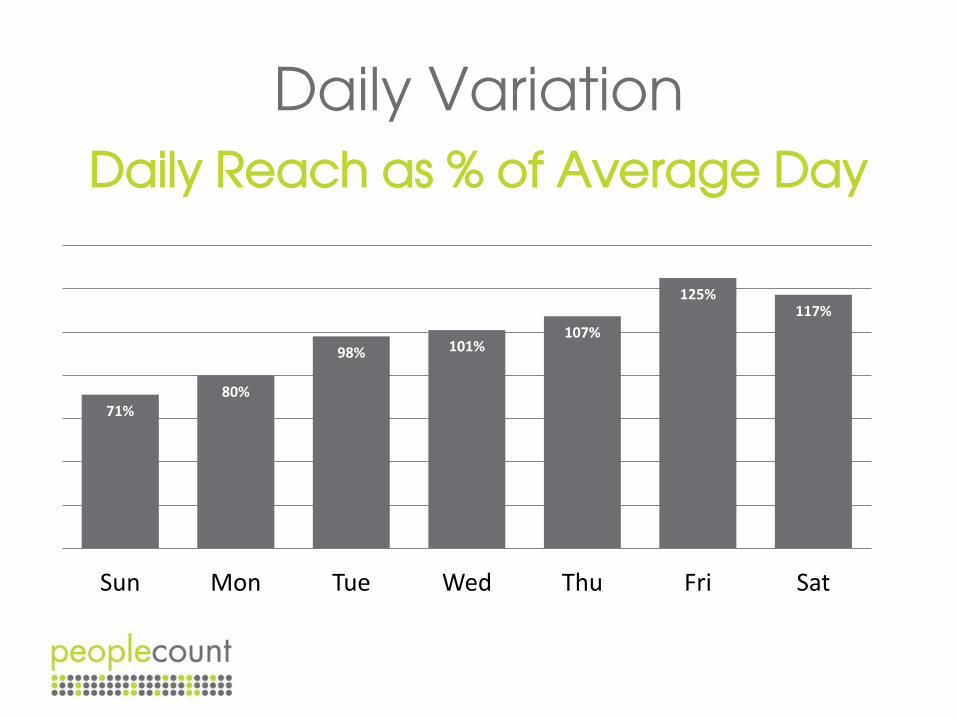
Daily Variation
Daily Reach as % of Average Day
71% 80%
98% 101% 107%
125% 117%
Sun Mon Tue Wed Thu Fri Sat

Hourly Variation
0%
50%
100%
150%
200%
9 10 11 12 13 14 15 16 17 18 19 20 21
Hourly Foot Traffic as % of Average
Weekday Saturday Sunday

Conclusions
Wi-Fi as a location analytics tool is: Viable, accurate and affordable
Potential metrics include: foot traffic – historical and real time
seasonality and day-parting
dwell time
reach-frequency
footpath analytics
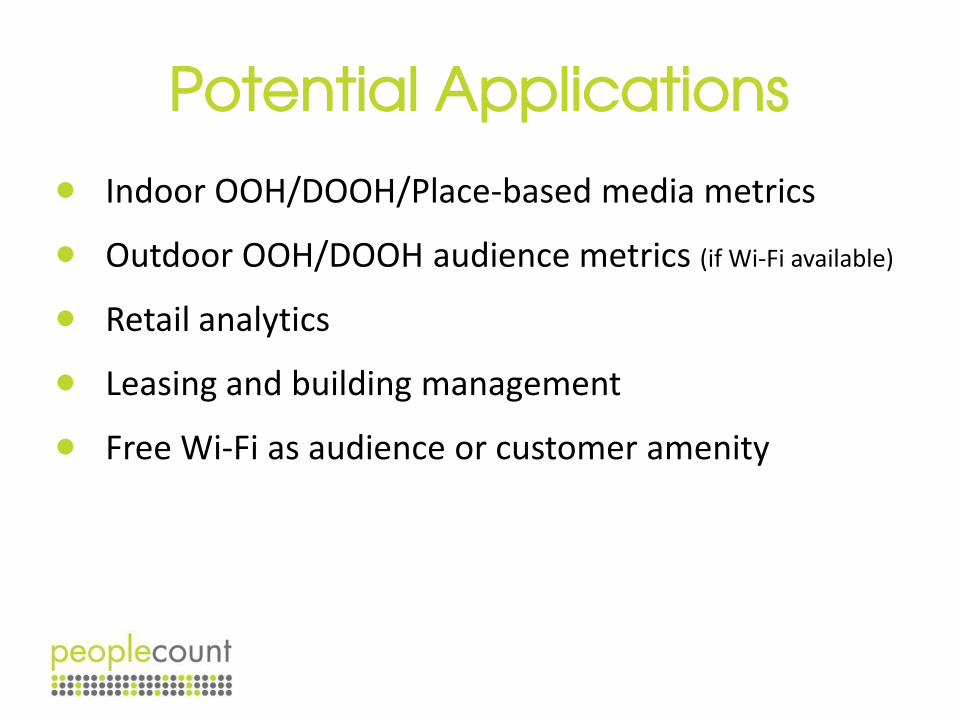
Potential Applications
Indoor OOH/DOOH/Place-based media metrics
Outdoor OOH/DOOH audience metrics (if Wi-Fi available)
Retail analytics
Leasing and building management
Free Wi-Fi as audience or customer amenity

For more information or to inquire about
Peoplecount’s services, please contact: Kelly McGillivray, P.Eng.
President and Chief Methodologist, Peoplecount [email protected] 866-491-0616 x222
Twitter: @KMcGPeoplecount www.peoplecount.biz