Growth opportunities, capital structure and dividend policies in Japan
GOV/TDPC/RUR/RD(2004)3
1
Organisation de Coopération et de Développement Economiques Organisation for Economic Co-operation and Development
_______________________________________________________________________________________ English only
GOV/TRG
PLACED-BASED POLICIES FOR RURAL DEVELOPMENT EXTREMADURA, SPAIN (CASE STUDY) This document was submitted for discussion to the Working Party on Territorial Policy in Rural Areas at its 6th Session held at the OECD Headquarters in Paris on 7 December 2004. The report will serve as an input to the OECD’s Horizontal Review of Place-Based Policies for Rural Development.
GOV/TDPC/RUR/RD(2004)3
2
ACKNOWLEDGEMENTS
This case study was directed by Mr. Mario Pezzini, Head of the Territorial Reviews and Governance Division, and co-ordinated and drafted by Mr. Nicola Crosta, Administrator of the OECD, based on the policy analysis provided by Professor Jesús G. Regidor (Universidad Autónoma de Madrid). Further contributions were provided by Mr. Albino Caporale (Region Tuscany, Italy) and Mr. Brian McCauley of the OECD Secretariat.
The OECD Secretariat would also like to thank Mr. Javier López Iniesta, Minister of Rural Development of the Regional Government of Extremadura, for his co-operation and support.
GOV/TDPC/RUR/RD(2004)3
3
TABLE OF CONTENTS
INTRODUCTION .......................................................................................................................................... 5
PART I: WHAT IS THE LEADER INITIATIVE?........................................................................................ 6
1.1 The LEADER programme and the LEADER method .......................................................................... 6 Main elements and objectives.................................................................................................................. 6
1.2 The governance of LEADER ................................................................................................................ 8 1.3 Application of the LEADER method across Europe........................................................................... 10
PART II: THE CONTEXT OF EXTREMADURA ..................................................................................... 12
2.1 Extremadura, a predominantly rural region ........................................................................................ 12 Population and human capital................................................................................................................ 12 Economic activity .................................................................................................................................. 14 Income level and well-being.................................................................................................................. 16 Natural and cultural resources ............................................................................................................... 18
2.2 Regional challenges............................................................................................................................. 19
PART III: THE LEADER IMPLEMENTATION IN EXTREMADURA ................................................... 21
3.1 LEADER’s role in Extremadura’s rural development ........................................................................ 21 3.2 Has LEADER been effective?............................................................................................................. 23
The weight of the programme compared with other rural development initiatives............................... 23 Dispersion of resources and coverage coherence .................................................................................. 23 LEADER impact based on combined quantitative and qualitative indicators....................................... 25
3.3 Critical issues and policy challenges................................................................................................... 31 Complex governance, limited budget and lack of strategic focus ......................................................... 31 Target areas and development objectives .............................................................................................. 33 Human capital and types of projects...................................................................................................... 33
3.4 Mainstreaming of the LEADER method: the way forward................................................................. 34
ANNEX 1. EXTREMADURA MAPS......................................................................................................... 36
ANNEX 2. MEASURES AND OBJECTIVES OF THE LEADER-PRODER PROGRAMME................. 39
ANNEX 3. LEADER-PRODER GRAPHS ON PUBLIC SPENDING ....................................................... 40
BIBLIOGRAPHY......................................................................................................................................... 43
Tables
Table 1.1. Allocation of funds by types of actions in LEADER II's rural innovation programme ........... 11 Table 3.1. Development of LEADER-PRODER programmes in Extremadura........................................ 22 Table 3.2. Rural development programmes in Extremadura (1994-1999) and LEADER-PRODER ....... 23 Table 3.3. Basic data on LEADER II in the EU and Extremadura ........................................................... 26 Table 3.4. Projects by beneficiaries of the LEADER-PRODER programme in Extremadura.................. 27 Table 3.5. LEADER-PRODER programmes in Extremadura .................................................................. 29
GOV/TDPC/RUR/RD(2004)3
4
Table 3.6. Public funds for the LEADER-PRODER programme (1994-1999, millions of Euros) .......... 32 Table 3.7. LEADER-PRODER programme financing (1994-1999, millions of Euros)........................... 32 Table 3.8. LEADER II: investment and public aid by type of project ...................................................... 34 Table 3.9. PRODER: investment and public aid by type of project.......................................................... 34 Table 2a. LEADER II: specific measures and objectives ......................................................................... 39 Table 2b. PRODER: specific measures and objectives............................................................................. 39
Figures
Figure 1.1. Territorial capital in the LEADER method............................................................................... 7 Figure 1.2. Human capital in the LEADER method ................................................................................... 8 Figure 1.3. Administrative structure of the LEADER programme ............................................................. 9 Figure 1.4. Financial system for payment of LEADER-PRODER funds ................................................. 10 Figure 2.1. Rural population and activity level by municipalities in Extremadura................................... 13 Figure 2.2. Structure of the population, 1999............................................................................................ 14 Figure 2.3. Structure of activity by sectors ............................................................................................... 15 Figure 2.4. Income level by size of municipality ...................................................................................... 17 Figure 2.5. Education level of the regional and rural active population ................................................... 18 Figure 2.6. Characteristics of Extremadura's agriculture, 1999 ................................................................ 20 Figure 3.1. LEADER II measures: investment and public and private expneses in the period................. 24 Figure 3.2. PRODER measures: investment and public and private expenses in the period .................... 25 Figure 3.3. Projects and beneficiaries of the LEADER-PRODER programme ........................................ 28 Figure 3.4. LEADER-PRODER programme's impact on rural employment............................................ 29 Figure 3.5. LEADER-PRODER programme's impact on rural companies............................................... 30 Figure 1a. Delimitation of the countryside in Extremadura...................................................................... 36 Figure 1b. Levels of regional attraction in Extremadura........................................................................... 37 Figure 1c. Rural zonification proposal for Extremadura........................................................................... 38 Figure 3a. LEADER II public spending by zones..................................................................................... 40 Figure 3b. PRODER public spending by zones ........................................................................................ 41
Boxes
Box 2.1. PER in Extremadura ................................................................................................................... 16 Box 3.1. Sample of LEADER-PRODER projects .................................................................................... 27
GOV/TDPC/RUR/RD(2004)3
5
INTRODUCTION
1. The work that the OECD Rural Working Party has carried out in the previous years has led to the conclusion that traditional top-down approaches and sectoral subsidies to rural areas have not given the expected results and that there is a need for place-based policies which can capture the diversity of rural areas and respond quickly to their new challenges. Developments in a fast changing international environment continue to demonstrate the necessity to re-think rural development policies. Globalisation, changes in the public financing of the agriculture sector and the emergence of important non-farm niche markets put rural regions in direct competition confronting them with threats and opportunities that require new policy instruments and skills at the national and sub-national level. Changes do not affect only markets and economic actors but question the role of institutions, private actors and the civil society in rural development. Moreover, processes of administrative, political and fiscal decentralisation put more emphasis on the capacity of local actors and renewed horizontal and vertical relations.
2. Against this background, policy makers increasingly recognise that traditional rural development policies need to be upgraded and, in many cases, phased out and substituted with more appropriate instruments capable of dealing with externalities, valorising local amenities and, in a context of asymmetric information, making good use of the knowledge shared by different actors. To adapt to such a scenario several countries have begun to design new policies and to introduce innovative forms of vertical and/or horizontal co-ordination.
3. Inspired by an integrated, bottom-up approach to rural development, the LEADER programme represents one of the better known programmes implemented in the European Union to date. Introduced in 1991 and after having been reconducted for three terms (LEADER I, II and LEADER +) the initiative should disappear in 2007 to be mainstreamed into a new overall policy framework of EU rural development.
4. One country that has implemented the LEADER programme is Spain. This case study analyses the programme’s effectiveness in the Extremadura region. The paper is divided into three parts. Part I outlines the most defining characteristics of the LEADER programme, from its functioning to its financing, and discusses the main elements of the LEADER "method". Part II provides an overview of the characteristics and policy challenges of the Extremadura region. This part highlights the variety of interconnected challenges calling for a shift from a purely sectoral approach towards a more place-based approach to rural development. Part III sets out the most critical issues related to the implementation of LEADER in Extremadura. It discusses possible directions for its improvement and issues to be considered in the discussion on the future "mainstreaming" of LEADER.
GOV/TDPC/RUR/RD(2004)3
6
PART I: WHAT IS THE LEADER INITIATIVE?
1.1 The LEADER programme and the LEADER method
5. The LEADER1 Community Initiative is one of the better known European rural development programmes and was conceived as an integrated and endogenous economic development approach. The programme aims at motivating local actors to carry out innovative multi-sectoral projects capable of valorising and exploiting local resources and improving the competitiveness of rural areas.
6. The programme has been widely recognised as a success due to its great territorial reach and because of the remarkable results obtained in many rural areas despite the relatively limited budget of EUR 4 billion over the course of the programme. One specific success was the LEADER programme’s introduction of a LEADER method. This method implies co-operation across and within public administrations and the private sector and its application has had a notable impact on the governance of predominantly rural regions like Extremadura.
Main elements and objectives
7. The LEADER Initiative for rural development began in 1991 with LEADER I, continued from 1994-1999 with LEADER II and nowadays (2000-2006) remains with LEADER +. The initiative has been implemented across the EU in both lagging and leading rural regions. This programme has always had a complementary character within the Policy of Cohesion or regional development of the EU, but has stood out because of its territorial approach focusing on small areas and its limited endowment of public financial resources.
8. The programme has had fast territorial expansion: while LEADER I covered 220 areas, LEADER II reached 1 000 in the entire EU-15. Despite reforms in other economic, social and territorial cohesion policy programmes in the EU and in the Common Agriculture Policy, the programme has remained and continued to grow.
9. There are three main elements characterising the implementation of the LEADER method: 1) a “territory” or LEADER area, 2) an integrated “strategy” relying on an endogenous approach and innovative actions, and 3) a “local action group” (LAG) characterised by decentralised financing, co-operation and partnerships between public and private stakeholders.
10. These elements operate within two alternative approaches (Soto, 2004, pp. 7-8). The first approach is “redistributive” and perceives the programmes as a partial compensation to different rural territories for their structural disadvantages. The second approach is more “proactive” and insists on the most innovative aspects of the LEADER method, aiming at facilitating the mobilisation of certain actors that elaborate and apply a development strategy in each territory.
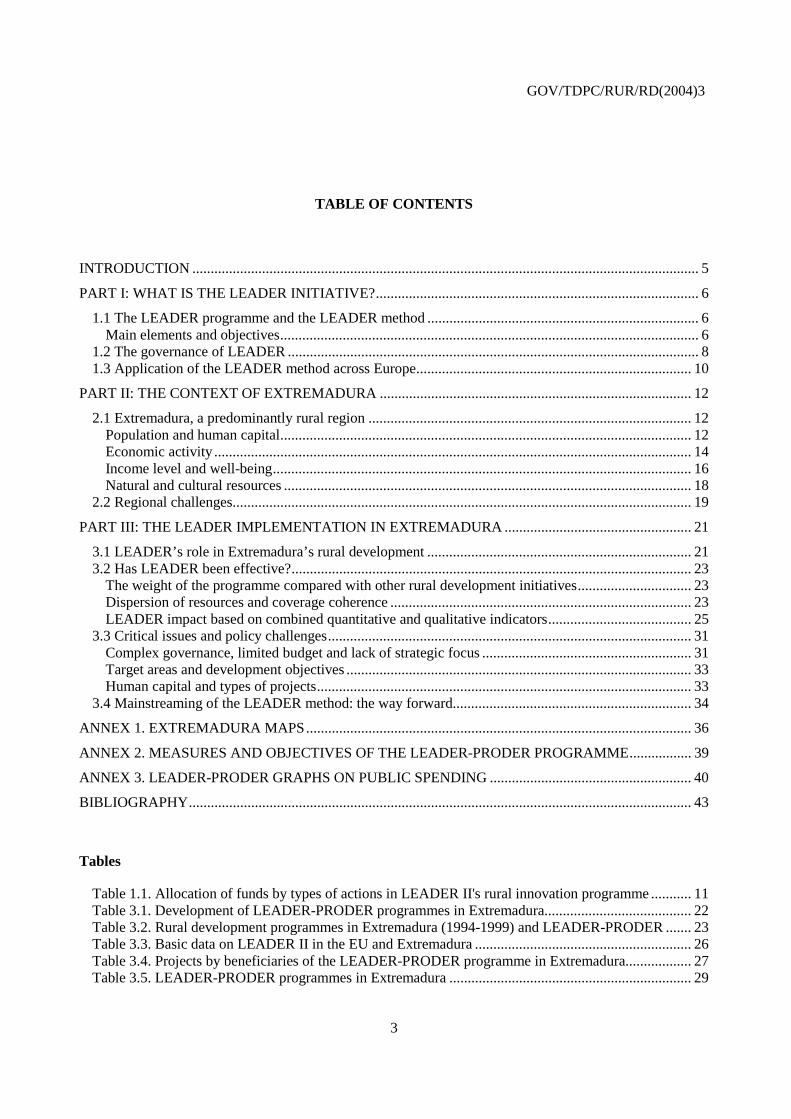
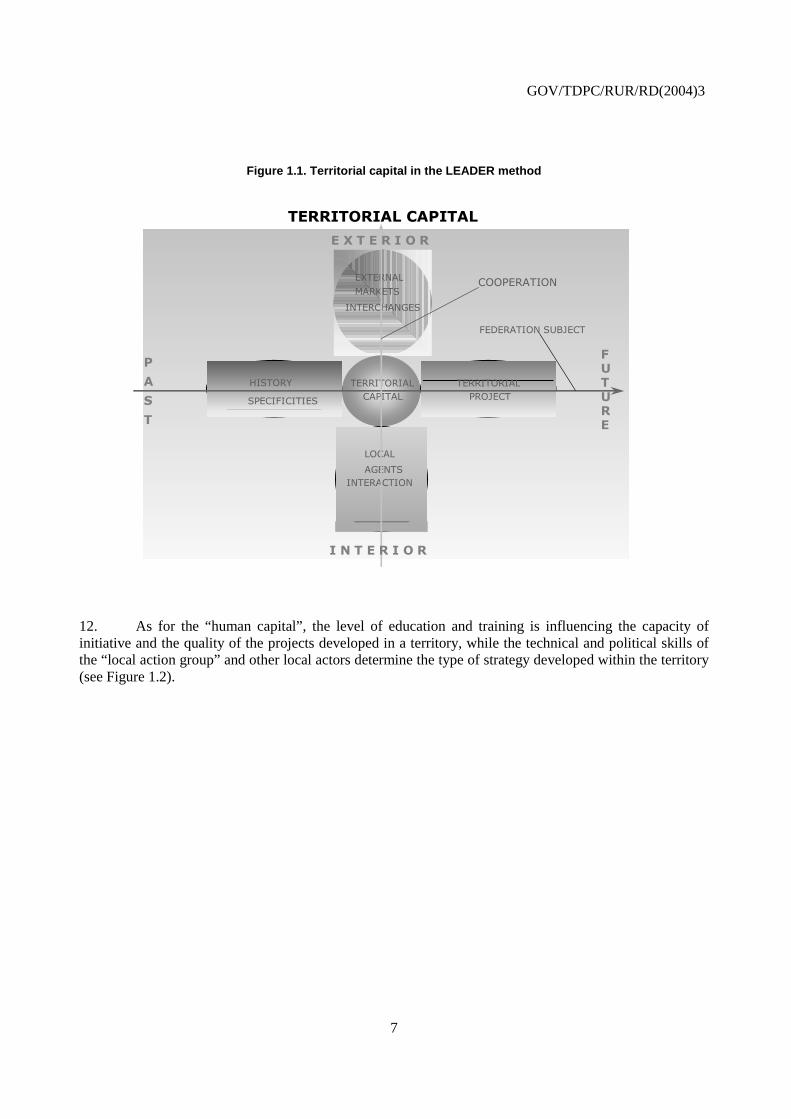
11. Two factors have played a key role in the LEADER method: the “territorial capital” and the “human capital”. The “territorial capital” is not only formed by all the advantages, resources and internal relationships of a territory (endogenous) but it also faces the exterior with its “strategic alliances with the markets, with the sources of knowledge and of financing, with the services and with the State”, all in order to better promote a territorial project (see Figure 1.1) (Soto, 2004, p. 10).
GOV/TDPC/RUR/RD(2004)3
7
Figure 1.1. Territorial capital in the LEADER method
CAPITAL TERRITORIAL
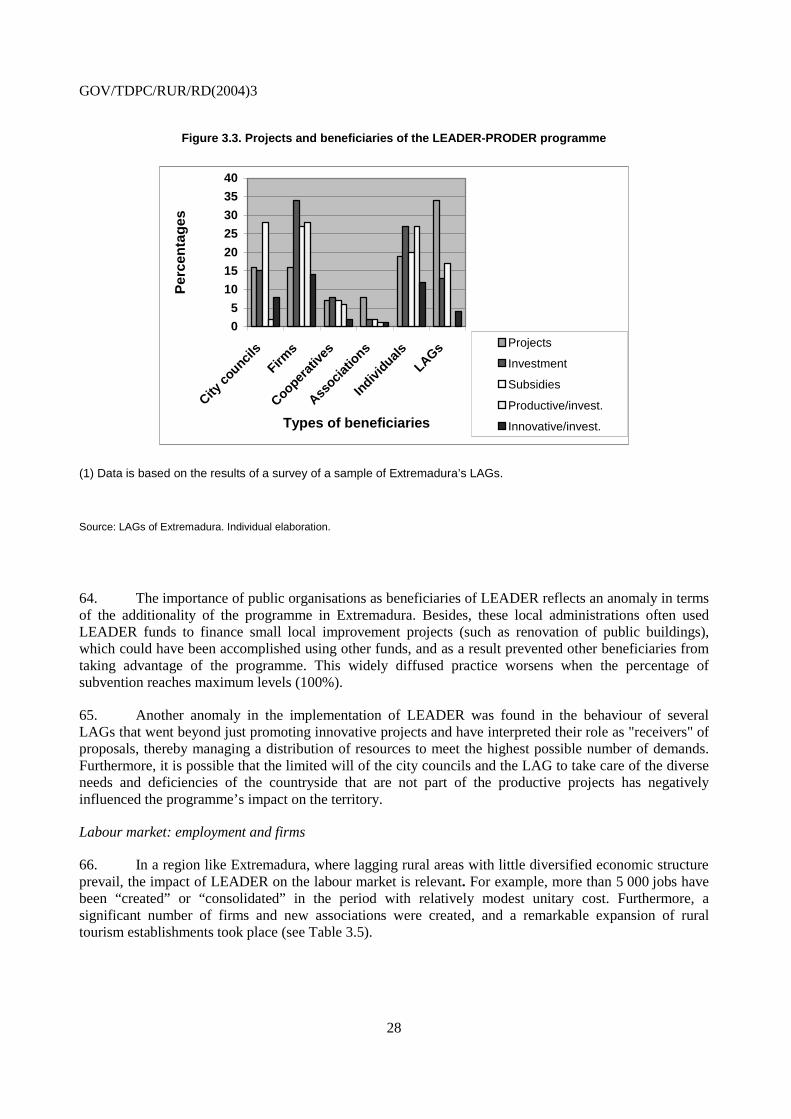
PROJECT TERRITORIAL HISTORY
SPECIFICITIES
INTERACTION AGENTS LOCAL
EXTERNAL MARKETS
INTERCHANGES
P
A
S
T
F U T U R E
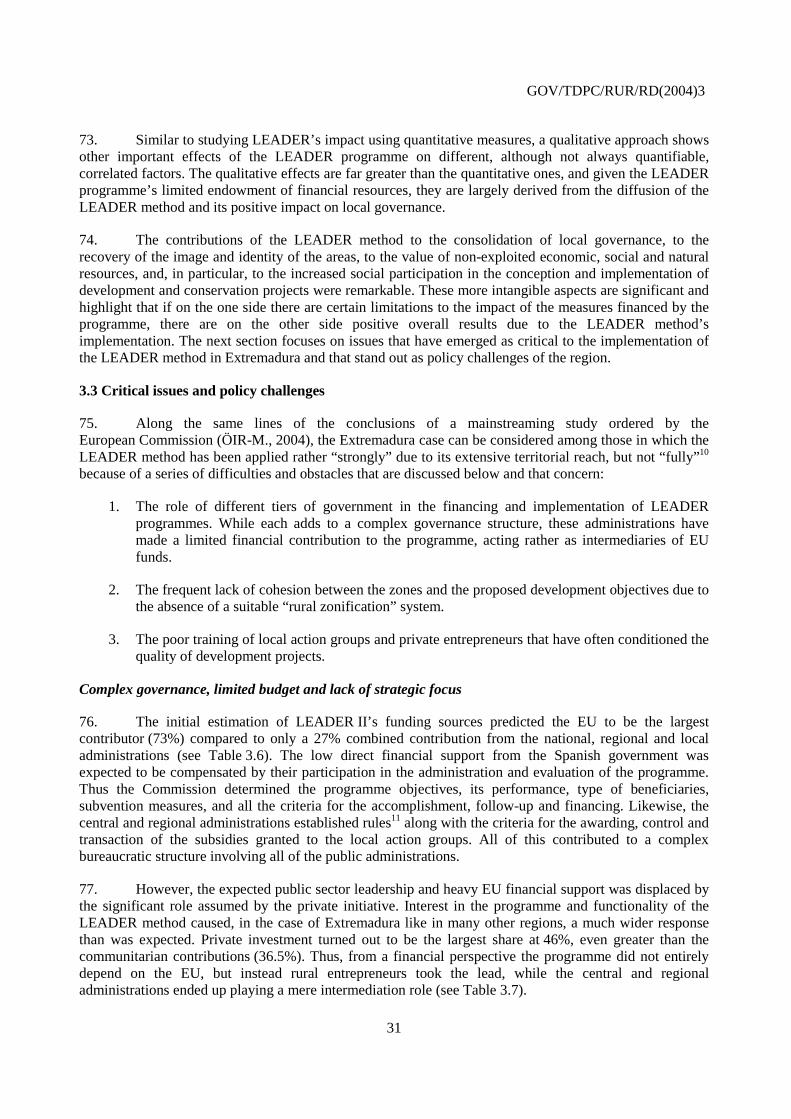
E X T E R I O R
I N T E R I O R
FEDERATION SUBJECT
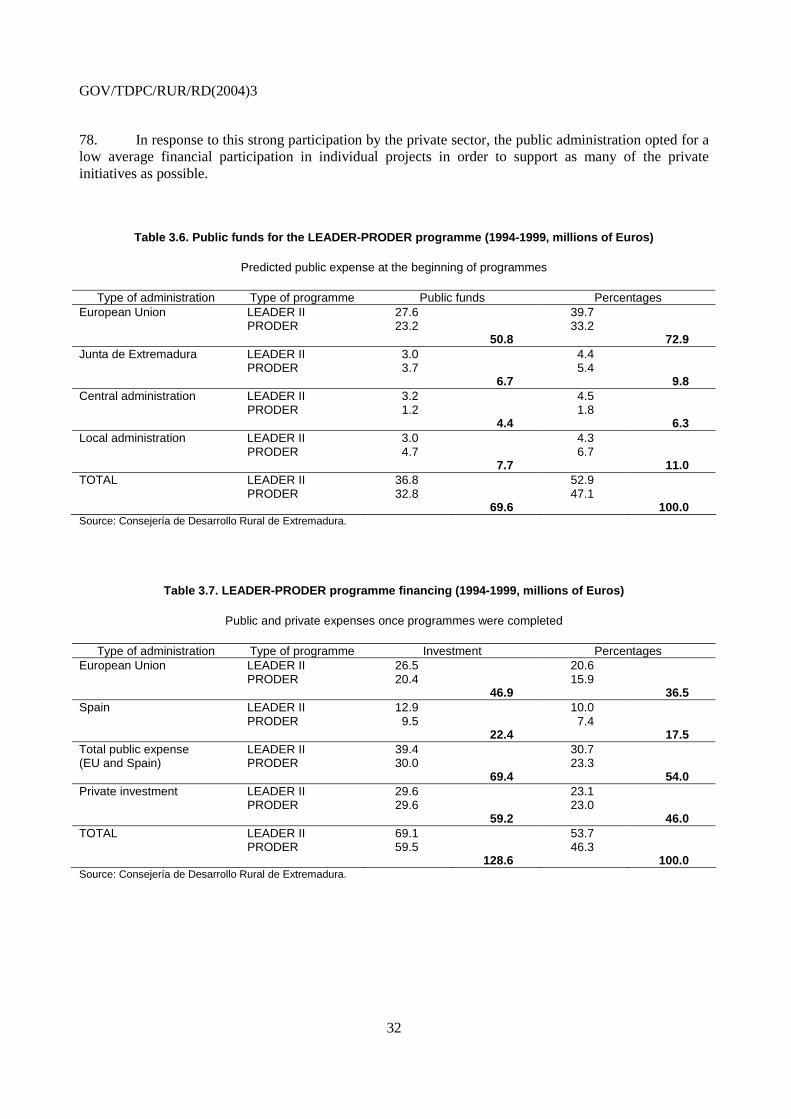
TERRITORIAL CAPITAL
COOPERATION
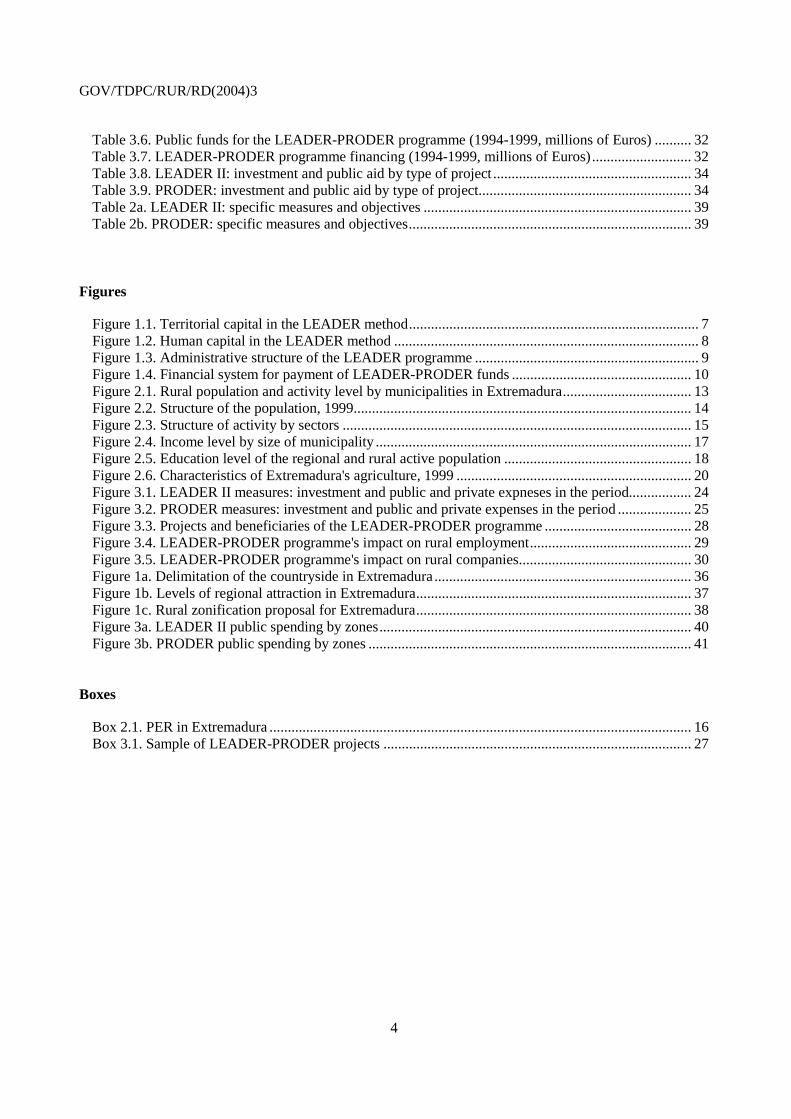
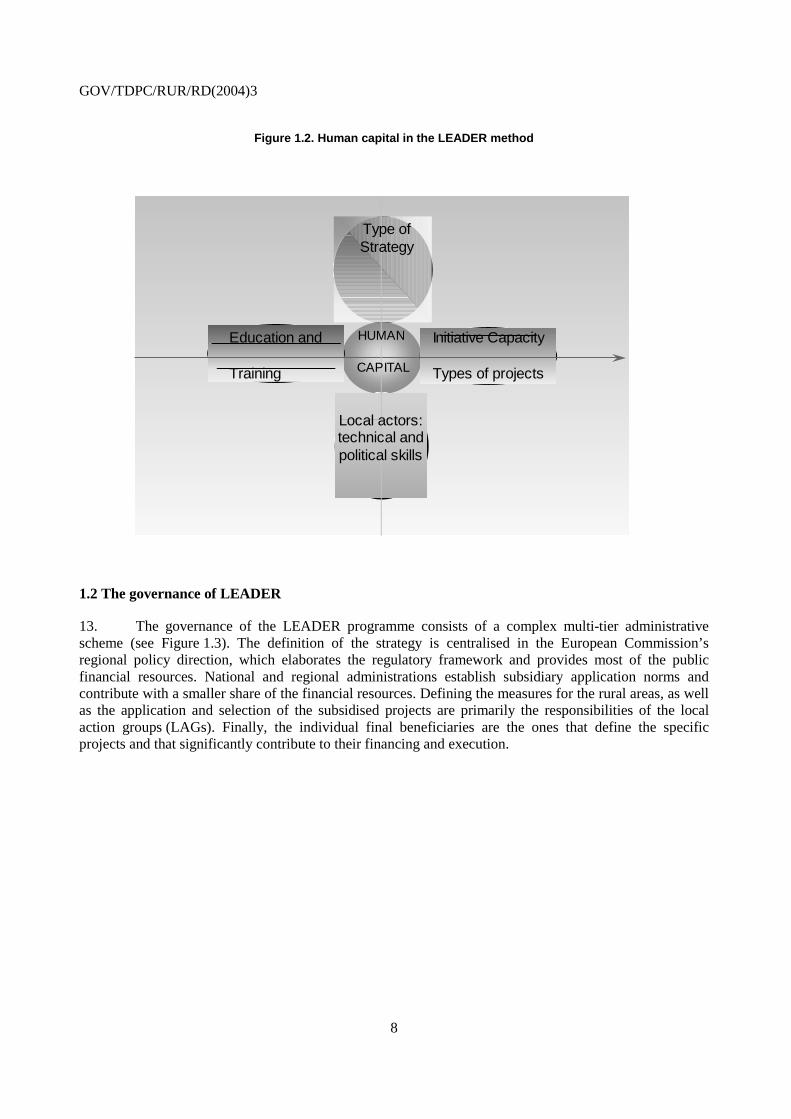
12. As for the “human capital”, the level of education and training is influencing the capacity of initiative and the quality of the projects developed in a territory, while the technical and political skills of the “local action group” and other local actors determine the type of strategy developed within the territory (see Figure 1.2).
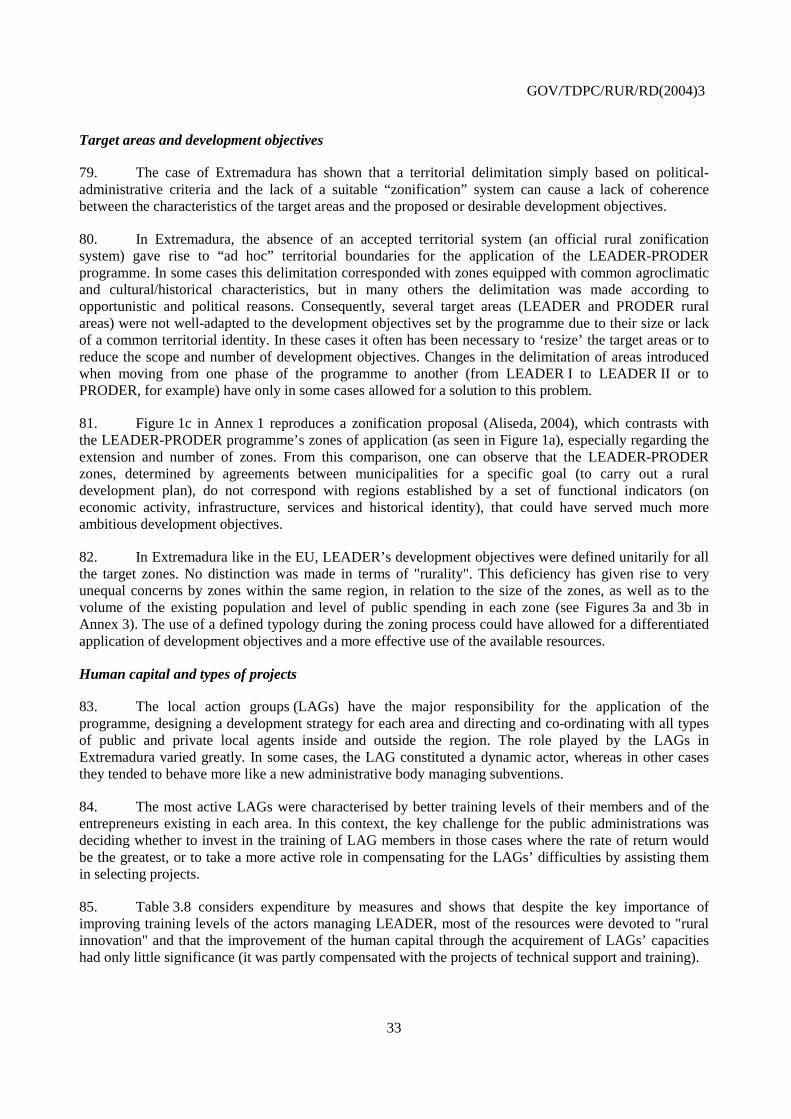
GOV/TDPC/RUR/RD(2004)3
8
Figure 1.2. Human capital in the LEADER method
Education and
Training
Type of Strategy
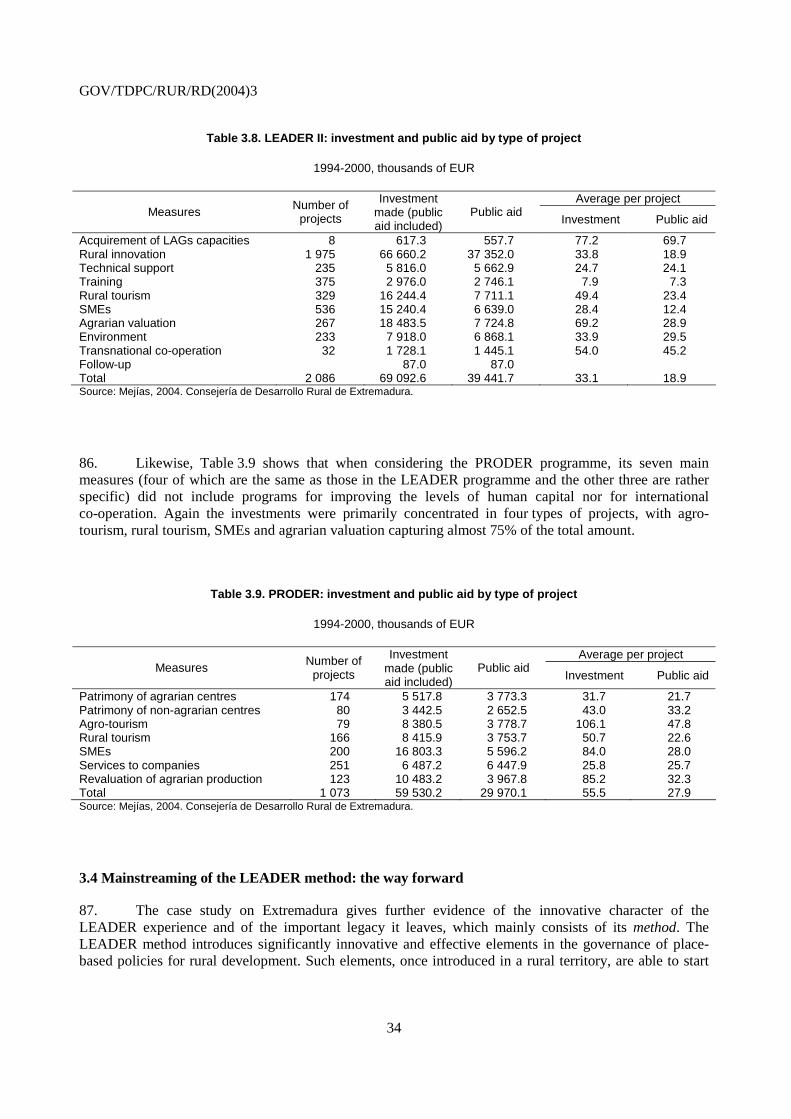
Initiative Capacity
Types of projects
HUMAN
CAPITAL
Local actors: technical and political skills
1.2 The governance of LEADER
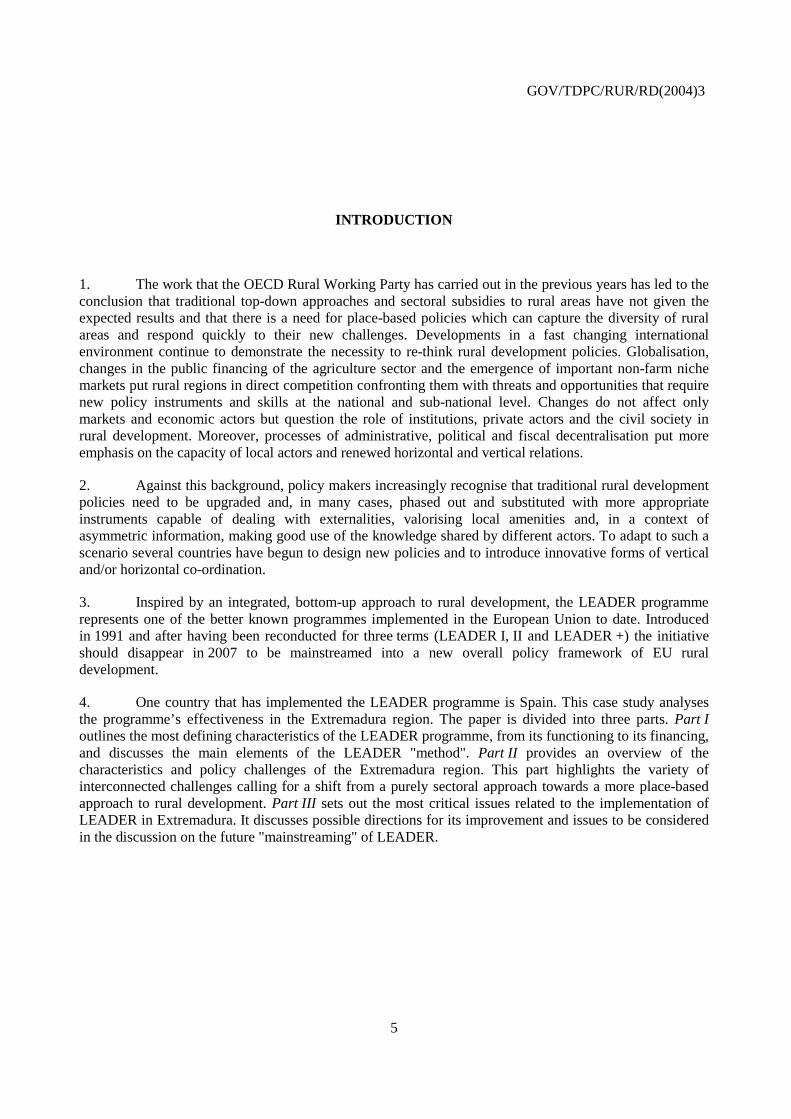
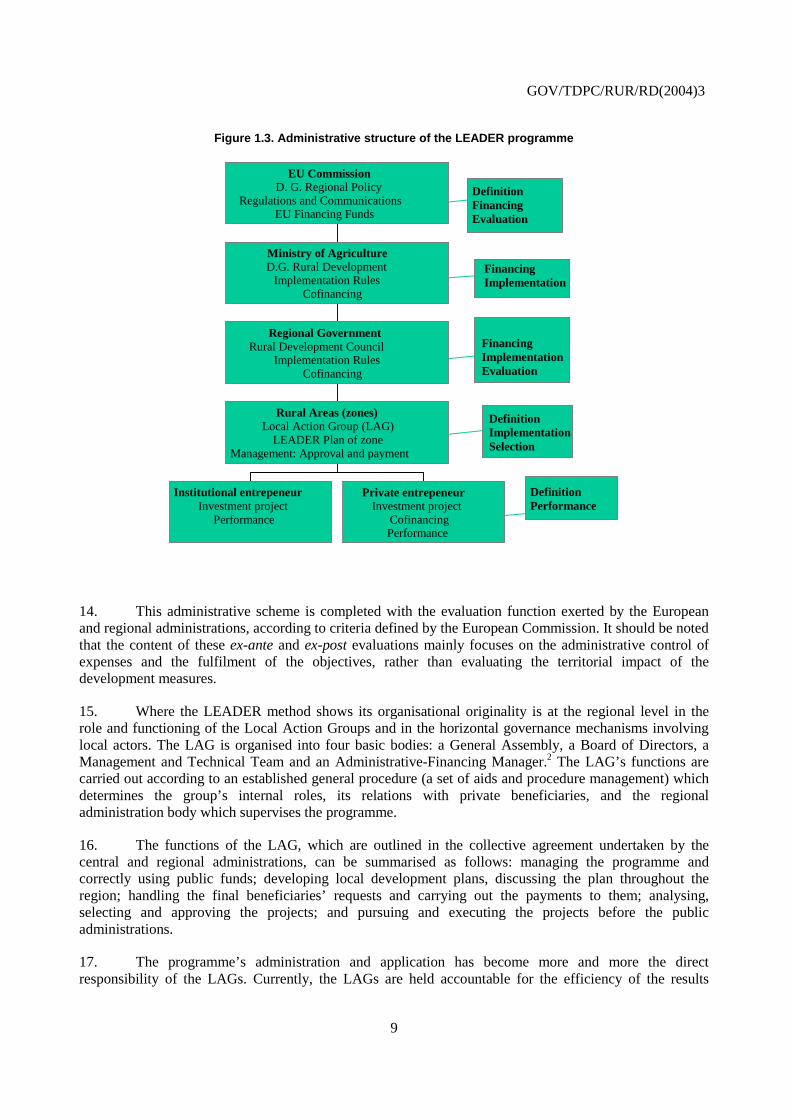
13. The governance of the LEADER programme consists of a complex multi-tier administrative scheme (see Figure 1.3). The definition of the strategy is centralised in the European Commission’s regional policy direction, which elaborates the regulatory framework and provides most of the public financial resources. National and regional administrations establish subsidiary application norms and contribute with a smaller share of the financial resources. Defining the measures for the rural areas, as well as the application and selection of the subsidised projects are primarily the responsibilities of the local action groups (LAGs). Finally, the individual final beneficiaries are the ones that define the specific projects and that significantly contribute to their financing and execution.
GOV/TDPC/RUR/RD(2004)3
9
Figure 1.3. Administrative structure of the LEADER programme
Definition Financing Evaluation
Financing Implementation
Financing Implementation Evaluation
Definition Implementation Selection
Definition Performance
Institutional entrepeneur Investment project
Performance
Private entrepeneur Investment project
Cofinancing Performance
Rural Areas (zones) Local Action Group (LAG)
LEADER Plan of zone Management: Approval and payment
Regional Government Rural Development Council
Implementation Rules Cofinancing
Ministry of Agriculture D.G. Rural Development
Implementation Rules Cofinancing
EU Commission D. G. Regional Policy
Regulations and Communications EU Financing Funds
14. This administrative scheme is completed with the evaluation function exerted by the European and regional administrations, according to criteria defined by the European Commission. It should be noted that the content of these ex-ante and ex-post evaluations mainly focuses on the administrative control of expenses and the fulfilment of the objectives, rather than evaluating the territorial impact of the development measures.
15. Where the LEADER method shows its organisational originality is at the regional level in the role and functioning of the Local Action Groups and in the horizontal governance mechanisms involving local actors. The LAG is organised into four basic bodies: a General Assembly, a Board of Directors, a Management and Technical Team and an Administrative-Financing Manager.2 The LAG’s functions are carried out according to an established general procedure (a set of aids and procedure management) which determines the group’s internal roles, its relations with private beneficiaries, and the regional administration body which supervises the programme.
16. The functions of the LAG, which are outlined in the collective agreement undertaken by the central and regional administrations, can be summarised as follows: managing the programme and correctly using public funds; developing local development plans, discussing the plan throughout the region; handling the final beneficiaries’ requests and carrying out the payments to them; analysing, selecting and approving the projects; and pursuing and executing the projects before the public administrations.
17. The programme’s administration and application has become more and more the direct responsibility of the LAGs. Currently, the LAGs are held accountable for the efficiency of the results
GOV/TDPC/RUR/RD(2004)3
10
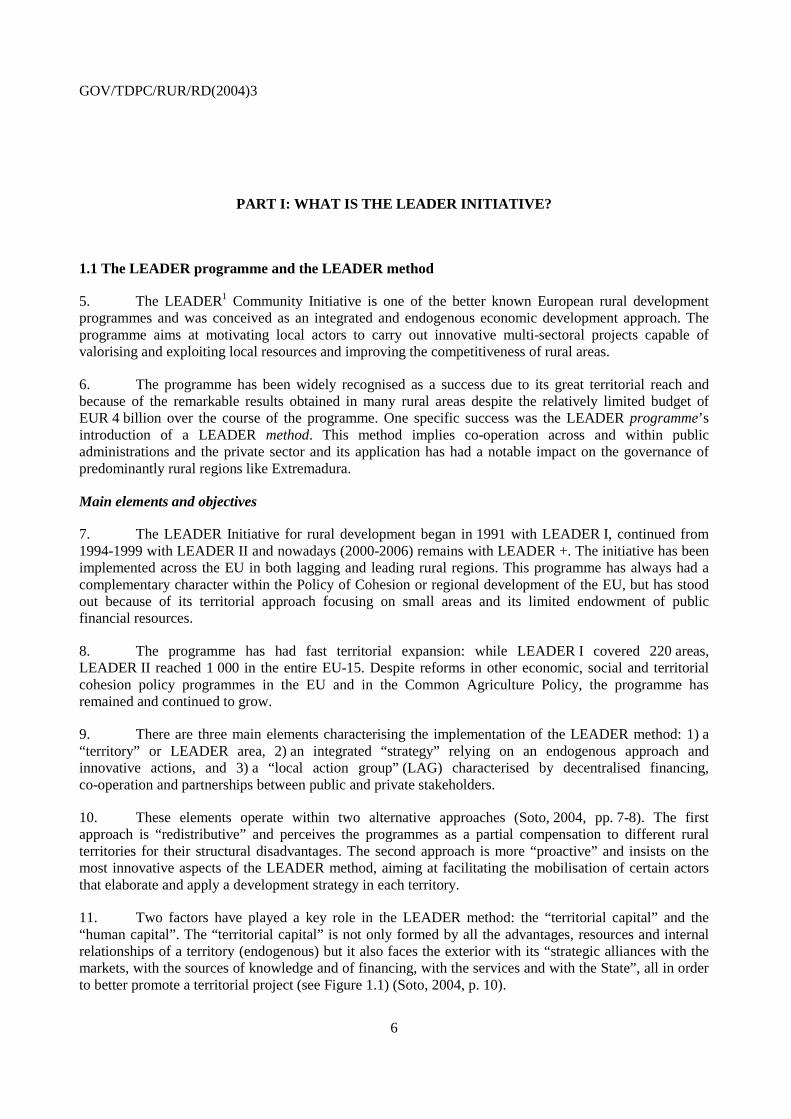
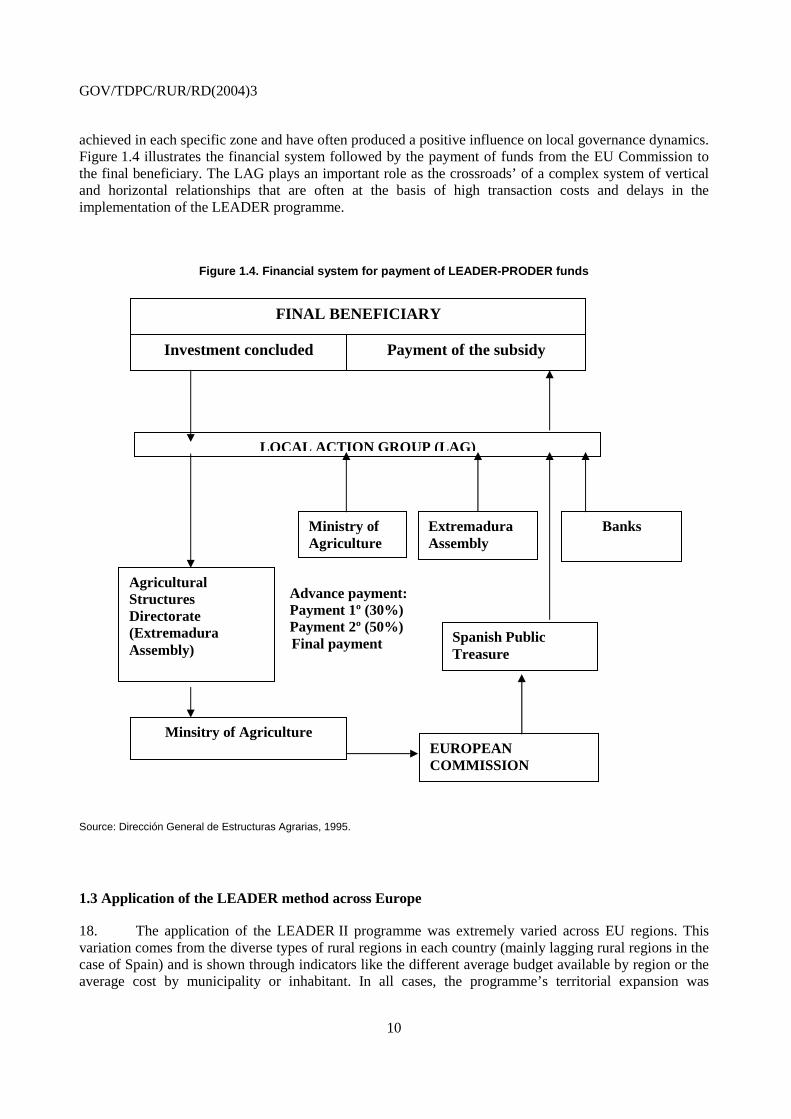
achieved in each specific zone and have often produced a positive influence on local governance dynamics. Figure 1.4 illustrates the financial system followed by the payment of funds from the EU Commission to the final beneficiary. The LAG plays an important role as the crossroads’ of a complex system of vertical and horizontal relationships that are often at the basis of high transaction costs and delays in the implementation of the LEADER programme.
Figure 1.4. Financial system for payment of LEADER-PRODER funds
Advance payment: Payment 1º (30%) Payment 2º (50%) Final payment
FINAL BENEFICIARY
Investment concluded Payment of the subsidy
LOCAL ACTION GROUP (LAG)
Agricultural Structures Directorate (Extremadura Assembly)
Minsitry of Agriculture EUROPEAN
COMMISSION
Spanish Public Treasure
Ministry of Agriculture
Banks
Extremadura Assembly
Source: Dirección General de Estructuras Agrarias, 1995.
1.3 Application of the LEADER method across Europe
18. The application of the LEADER II programme was extremely varied across EU regions. This variation comes from the diverse types of rural regions in each country (mainly lagging rural regions in the case of Spain) and is shown through indicators like the different average budget available by region or the average cost by municipality or inhabitant. In all cases, the programme’s territorial expansion was
GOV/TDPC/RUR/RD(2004)3
11
significant, as the number of targeted zones increased by 400% from the initial LEADER I term. Today the typical LEADER zone has about 55 000 inhabitants, 1 500 km2 and an average density of 35 inhabitants/km2 (EC, 2003).
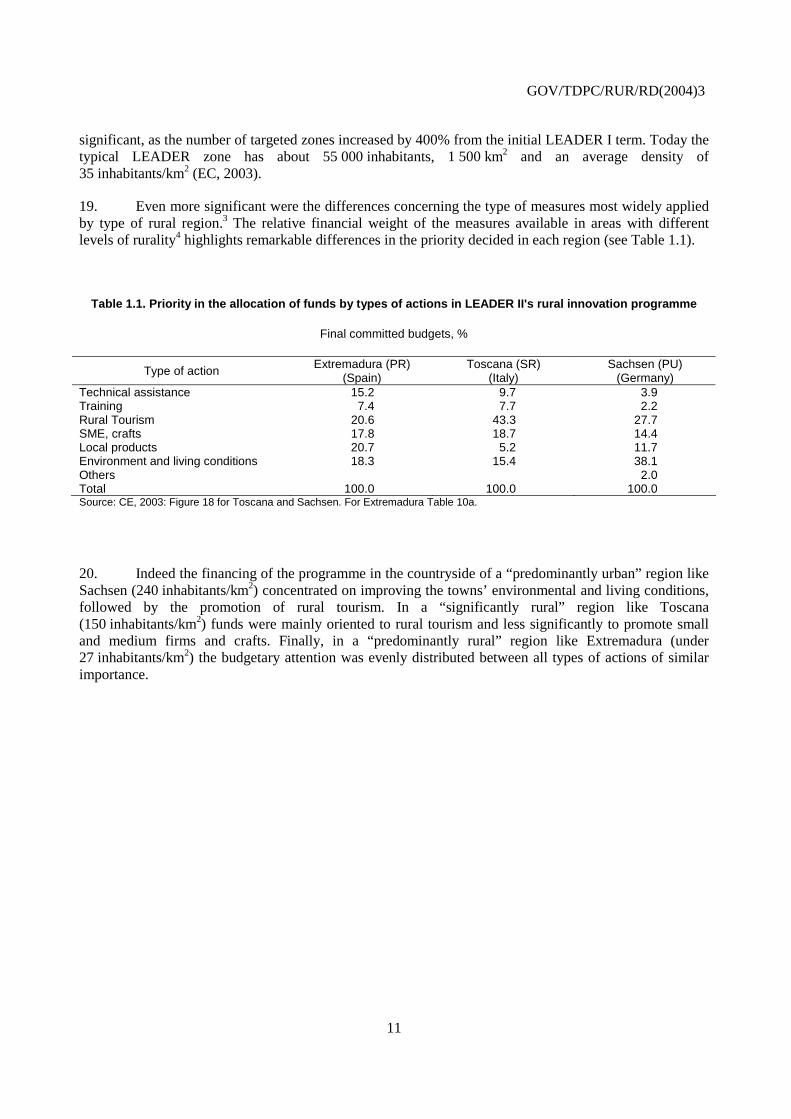
19. Even more significant were the differences concerning the type of measures most widely applied by type of rural region.3 The relative financial weight of the measures available in areas with different levels of rurality4 highlights remarkable differences in the priority decided in each region (see Table 1.1).
Table 1.1. Priority in the allocation of funds by types of actions in LEADER II's rural innovation programme
Final committed budgets, %
Type of action Extremadura (PR) (Spain)
Toscana (SR) (Italy)
Sachsen (PU) (Germany)
Technical assistance 15.2 9.7 3.9 Training 7.4 7.7 2.2 Rural Tourism 20.6 43.3 27.7 SME, crafts 17.8 18.7 14.4 Local products 20.7 5.2 11.7 Environment and living conditions 18.3 15.4 38.1 Others 2.0 Total 100.0 100.0 100.0 Source: CE, 2003: Figure 18 for Toscana and Sachsen. For Extremadura Table 10a.
20. Indeed the financing of the programme in the countryside of a “predominantly urban” region like Sachsen (240 inhabitants/km2) concentrated on improving the towns’ environmental and living conditions, followed by the promotion of rural tourism. In a “significantly rural” region like Toscana (150 inhabitants/km2) funds were mainly oriented to rural tourism and less significantly to promote small and medium firms and crafts. Finally, in a “predominantly rural” region like Extremadura (under 27 inhabitants/km2) the budgetary attention was evenly distributed between all types of actions of similar importance.
GOV/TDPC/RUR/RD(2004)3
12
PART II: THE CONTEXT OF EXTREMADURA
2.1 Extremadura, a predominantly rural region
21. The Extremadura region, located in mid-western Spain and bordering Portugal, is not well known at the international level despite possessing an important historical legacy as well as a wealth of natural and cultural resources. Extremadura’s population hardly reaches 1 100 000 inhabitants after decades of intense emigration, but the region lies over two of the largest Spanish provinces, covering nearly 42 000 km2, with an average density of only 27 inhabitants/km2. The region’s economy is still dominated by the agrarian sector and the agro-food industry, which together account for approximately 16% of the regional GDP and 25% of the regional employment. Thus, given its low population, extensive land area and heavily agrarian based economy, Extremadura provides an interesting case for analysing economic development policies in “predominantly rural” regions.
22. In the last two decades Extremadura has attained improved rates of growth but it is still among the group of least advanced regions in the European Union. Its regional GDP per capita has improved by 10 percentage points since its incorporation to the Union in 1986, reaching 54% of the average EU-15 in 2001. Among the reasons for this significant advance in macroeconomic terms and the convergence of Extremadura within Spain and the EU are the application of the European common policies, the Common Agriculture Policy and the Cohesion Policy.
23. Figure 1a (see Annex 1) shows that Extremadura is a region with an overall very significant rural5 character but that also presents diverse types of "rurality" in different areas that need to be identified and taken into consideration to understand the heterogeneity of its characteristics and development challenges.
Population and human capital
24. After decades of constant population decline, especially serious in the 1960s and 1970s when Extremadura lost more than 25% of its population, the region has experienced a slight recovery (close to a 2% increase between 1991-2001). However, this trend did not affect its rural areas where the population continued to decline (-7%) at the same time that the urban population increased. In short, the observed phenomenon is the decrease of population in the smallest rural municipalities (less than 5 000 inhabitants). This is very significant in a region where these municipalities represent almost 90% of the total number of municipalities, but only account for 40% of the total population.
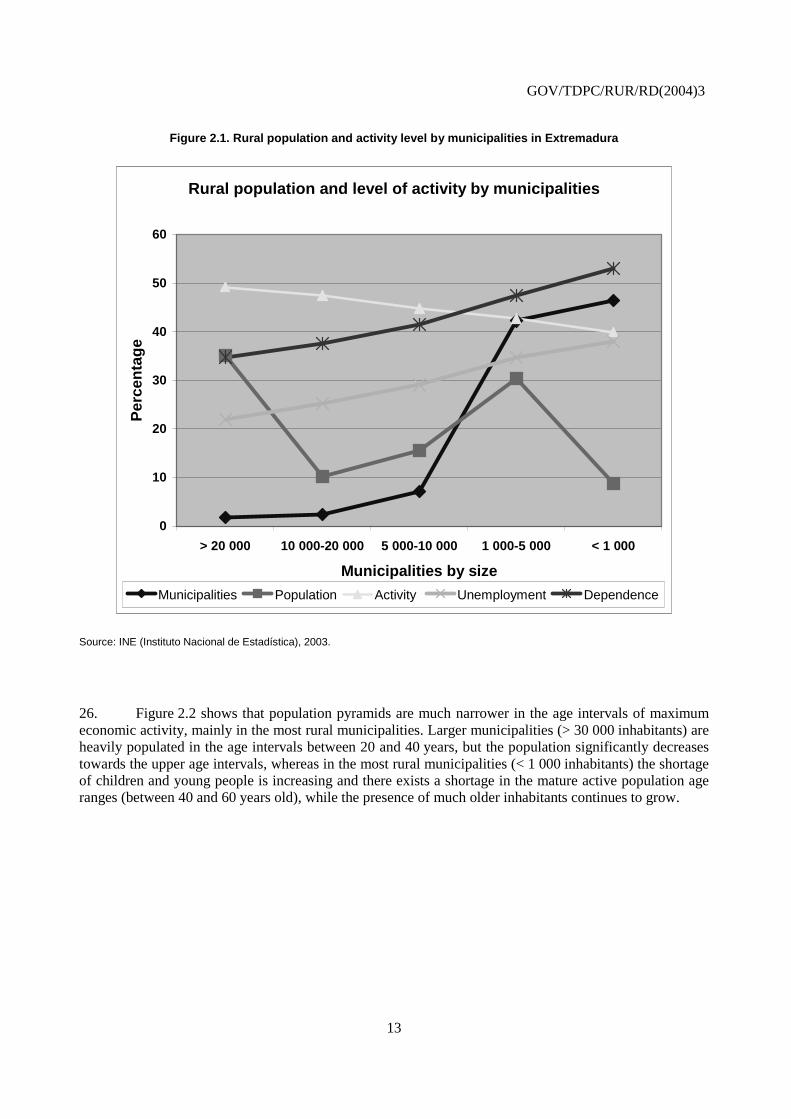
25. These demographic trends have had a strong negative impact on the endowment of human capital of many rural areas. The ageing population, which causes a high rate of dependency between inactive and active labour force (dependency rate is 56% in many rural areas) coincides with a decreasing distribution of the rural population by activity level and an increasing unemployment rate in small municipalities (see Figure 2.1).
GOV/TDPC/RUR/RD(2004)3
13
Figure 2.1. Rural population and activity level by municipalities in Extremadura
Rural population and level of activity by municipalities
0
10
20
30
40
50
60
> 20 000 10 000-20 000 5 000-10 000 1 000-5 000 < 1 000
Municipalities by size
Per
cen
tag
e
Municipalities Population Activity Unemployment Dependence
Source: INE (Instituto Nacional de Estadística), 2003.
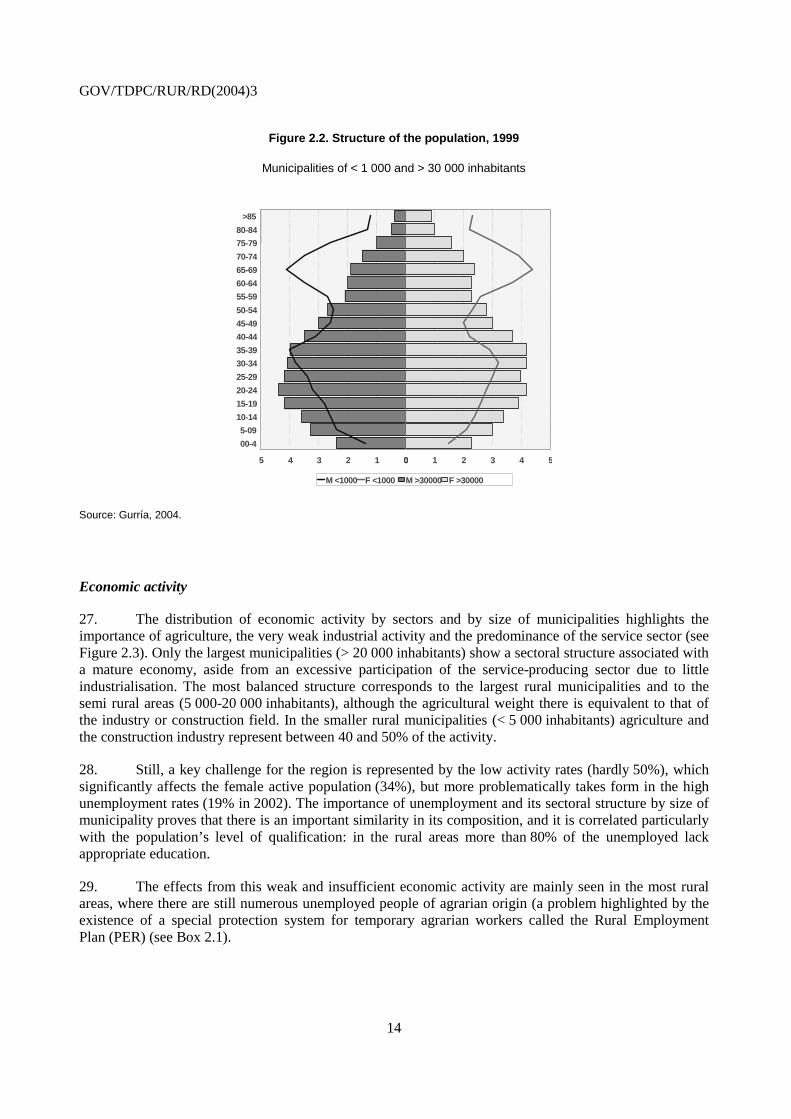
26. Figure 2.2 shows that population pyramids are much narrower in the age intervals of maximum economic activity, mainly in the most rural municipalities. Larger municipalities (> 30 000 inhabitants) are heavily populated in the age intervals between 20 and 40 years, but the population significantly decreases towards the upper age intervals, whereas in the most rural municipalities (< 1 000 inhabitants) the shortage of children and young people is increasing and there exists a shortage in the mature active population age ranges (between 40 and 60 years old), while the presence of much older inhabitants continues to grow.
GOV/TDPC/RUR/RD(2004)3
14
Figure 2.2. Structure of the population, 1999
Municipalities of < 1 000 and > 30 000 inhabitants
>85 80-84 75-79 70-74 65-69 60-64 55-59 50-54 45-49 40-44 35-39 30-34 25-29 20-24 15-19 10-14 5-09 00-4
0 1 2 3 4 5 0 1 2 3 4 5
M <1000 F <1000 M >30000 F >30000
Source: Gurría, 2004.
Economic activity
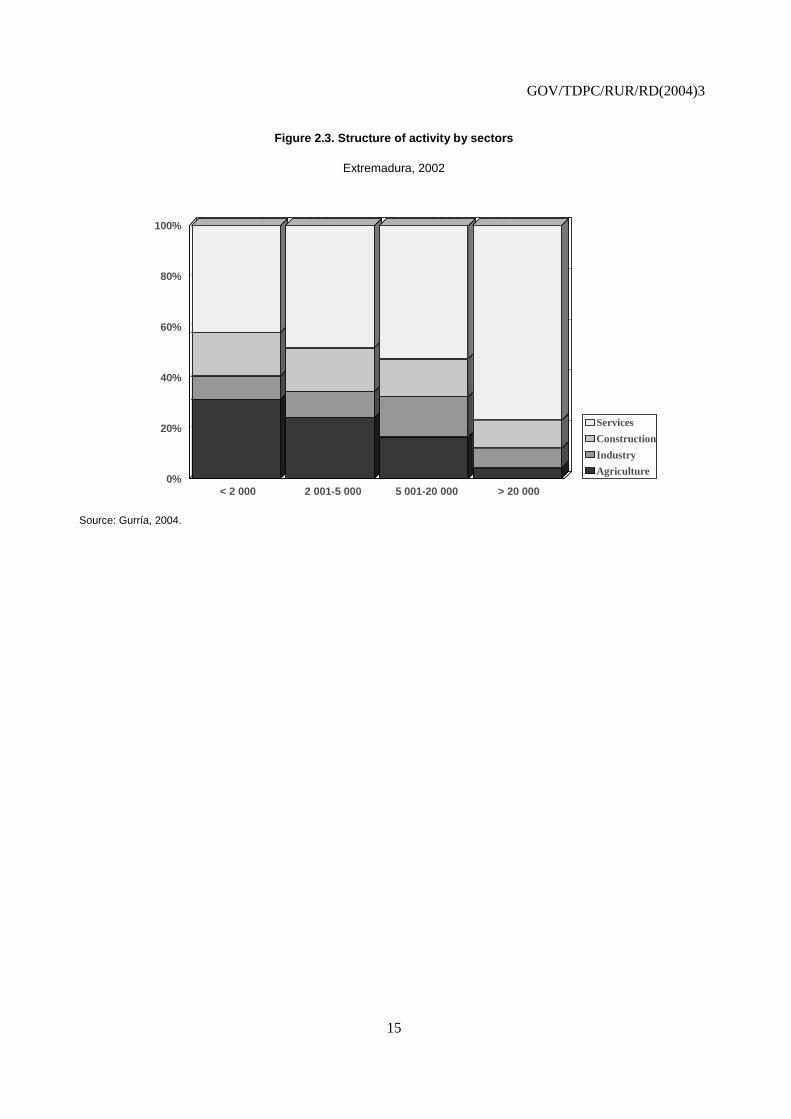
27. The distribution of economic activity by sectors and by size of municipalities highlights the importance of agriculture, the very weak industrial activity and the predominance of the service sector (see Figure 2.3). Only the largest municipalities (> 20 000 inhabitants) show a sectoral structure associated with a mature economy, aside from an excessive participation of the service-producing sector due to little industrialisation. The most balanced structure corresponds to the largest rural municipalities and to the semi rural areas (5 000-20 000 inhabitants), although the agricultural weight there is equivalent to that of the industry or construction field. In the smaller rural municipalities (< 5 000 inhabitants) agriculture and the construction industry represent between 40 and 50% of the activity.
28. Still, a key challenge for the region is represented by the low activity rates (hardly 50%), which significantly affects the female active population (34%), but more problematically takes form in the high unemployment rates (19% in 2002). The importance of unemployment and its sectoral structure by size of municipality proves that there is an important similarity in its composition, and it is correlated particularly with the population’s level of qualification: in the rural areas more than 80% of the unemployed lack appropriate education.
29. The effects from this weak and insufficient economic activity are mainly seen in the most rural areas, where there are still numerous unemployed people of agrarian origin (a problem highlighted by the existence of a special protection system for temporary agrarian workers called the Rural Employment Plan (PER) (see Box 2.1).
GOV/TDPC/RUR/RD(2004)3
15
Figure 2.3. Structure of activity by sectors
Extremadura, 2002
< 2 000 2 001-5 000 5 001-20 000 > 20 000 0%
20%
40%
60%
80%
100%
Agriculture Industry Construction Services
Source: Gurría, 2004.
GOV/TDPC/RUR/RD(2004)3
16
Box 2.1. PER in Extremadura
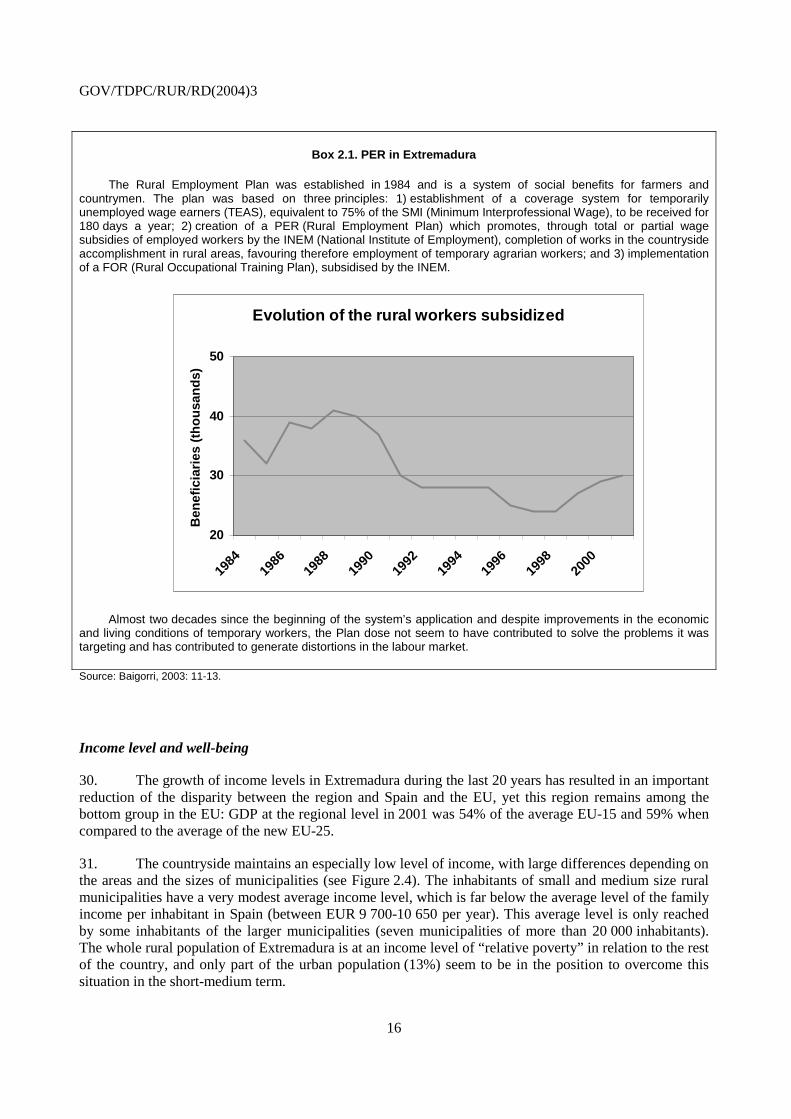
The Rural Employment Plan was established in 1984 and is a system of social benefits for farmers and countrymen. The plan was based on three principles: 1) establishment of a coverage system for temporarily unemployed wage earners (TEAS), equivalent to 75% of the SMI (Minimum Interprofessional Wage), to be received for 180 days a year; 2) creation of a PER (Rural Employment Plan) which promotes, through total or partial wage subsidies of employed workers by the INEM (National Institute of Employment), completion of works in the countryside accomplishment in rural areas, favouring therefore employment of temporary agrarian workers; and 3) implementation of a FOR (Rural Occupational Training Plan), subsidised by the INEM.
Evolution of the rural workers subsidized
20
30
40
50
1984
1986
1988
1990
1992
1994
1996
1998
2000
Ben
efic
iari
es (
tho
usa
nd
s)
Almost two decades since the beginning of the system’s application and despite improvements in the economic and living conditions of temporary workers, the Plan dose not seem to have contributed to solve the problems it was targeting and has contributed to generate distortions in the labour market.
Source: Baigorri, 2003: 11-13.
Income level and well-being
30. The growth of income levels in Extremadura during the last 20 years has resulted in an important reduction of the disparity between the region and Spain and the EU, yet this region remains among the bottom group in the EU: GDP at the regional level in 2001 was 54% of the average EU-15 and 59% when compared to the average of the new EU-25.
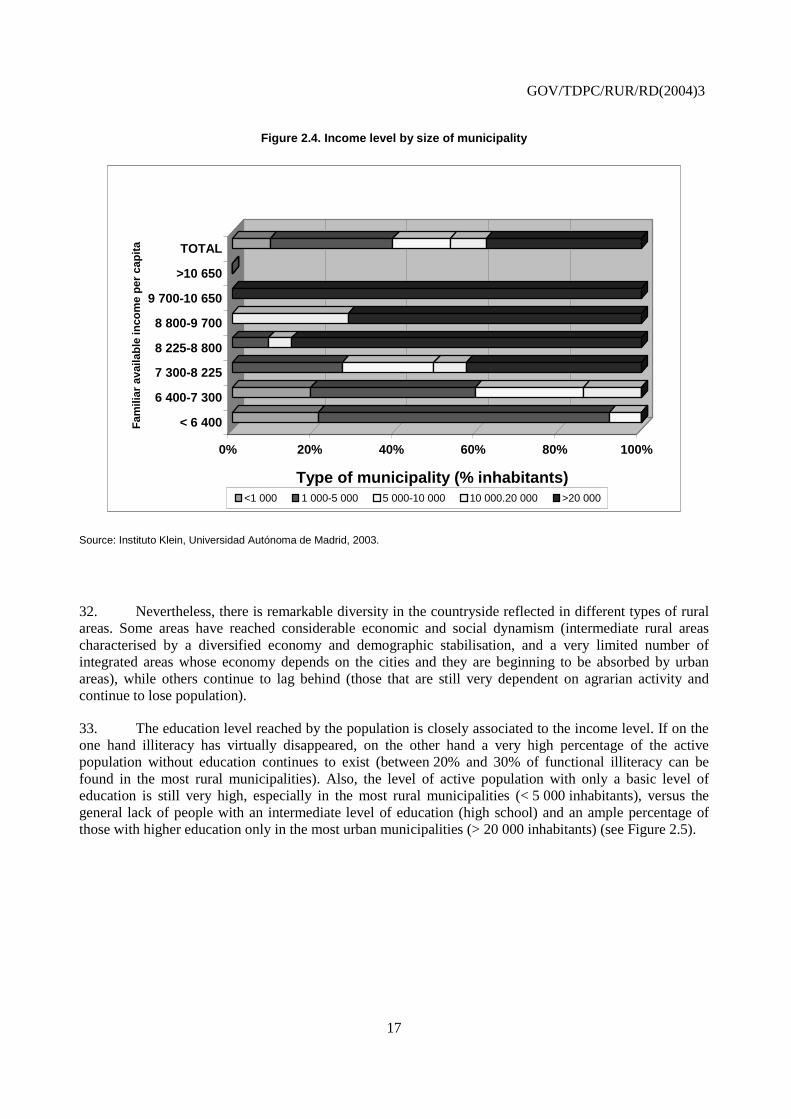
31. The countryside maintains an especially low level of income, with large differences depending on the areas and the sizes of municipalities (see Figure 2.4). The inhabitants of small and medium size rural municipalities have a very modest average income level, which is far below the average level of the family income per inhabitant in Spain (between EUR 9 700-10 650 per year). This average level is only reached by some inhabitants of the larger municipalities (seven municipalities of more than 20 000 inhabitants). The whole rural population of Extremadura is at an income level of “relative poverty” in relation to the rest of the country, and only part of the urban population (13%) seem to be in the position to overcome this situation in the short-medium term.
GOV/TDPC/RUR/RD(2004)3
17
Figure 2.4. Income level by size of municipality
0% 20% 40% 60% 80% 100%
Type of municipality (% inhabitants)
< 6 400
6 400-7 300
7 300-8 225
8 225-8 800
8 800-9 700
9 700-10 650
>10 650
TOTAL
Fam
iliar
ava
ilab
le in
com
e p
er c
apit
a
<1 000 1 000-5 000 5 000-10 000 10 000.20 000 >20 000
Source: Instituto Klein, Universidad Autónoma de Madrid, 2003.
32. Nevertheless, there is remarkable diversity in the countryside reflected in different types of rural areas. Some areas have reached considerable economic and social dynamism (intermediate rural areas characterised by a diversified economy and demographic stabilisation, and a very limited number of integrated areas whose economy depends on the cities and they are beginning to be absorbed by urban areas), while others continue to lag behind (those that are still very dependent on agrarian activity and continue to lose population).
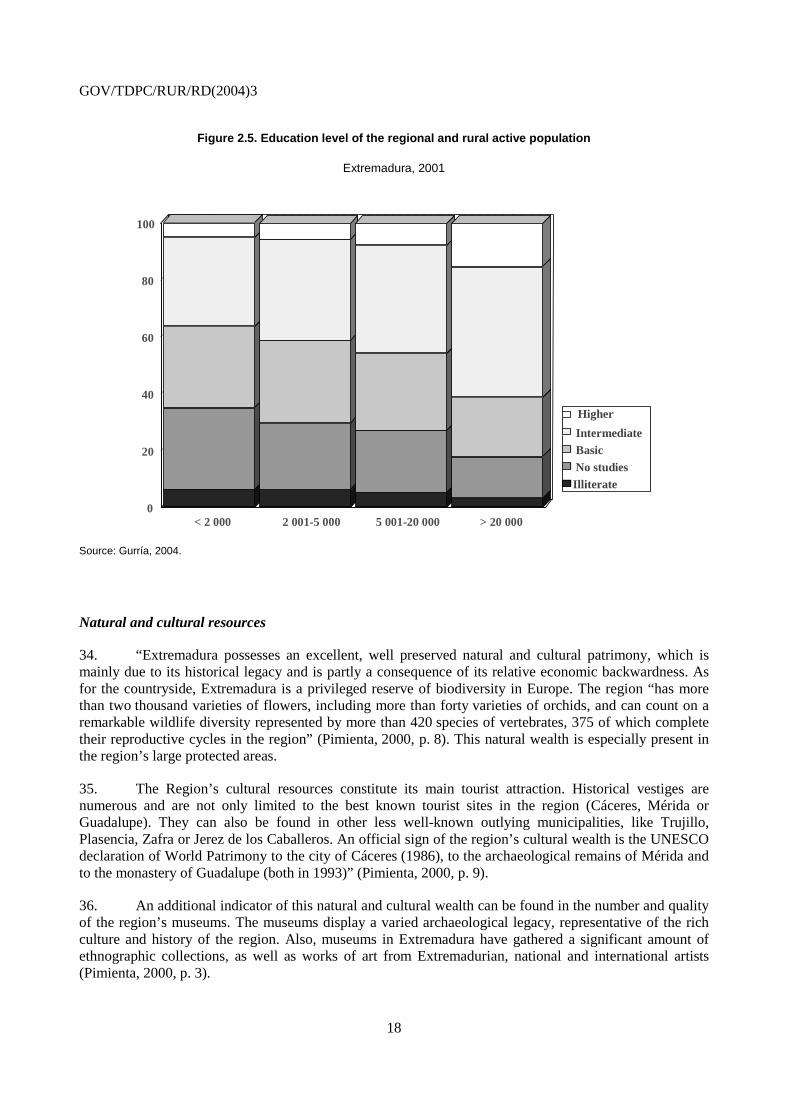
33. The education level reached by the population is closely associated to the income level. If on the one hand illiteracy has virtually disappeared, on the other hand a very high percentage of the active population without education continues to exist (between 20% and 30% of functional illiteracy can be found in the most rural municipalities). Also, the level of active population with only a basic level of education is still very high, especially in the most rural municipalities (< 5 000 inhabitants), versus the general lack of people with an intermediate level of education (high school) and an ample percentage of those with higher education only in the most urban municipalities (> 20 000 inhabitants) (see Figure 2.5).
GOV/TDPC/RUR/RD(2004)3
18
Figure 2.5. Education level of the regional and rural active population
Extremadura, 2001
< 2 000 2 001-5 000 5 001-20 000 > 20 000 0
20
40
60
80
100
Illiterate No studies Basic Intermediate Higher
Source: Gurría, 2004.
Natural and cultural resources
34. “Extremadura possesses an excellent, well preserved natural and cultural patrimony, which is mainly due to its historical legacy and is partly a consequence of its relative economic backwardness. As for the countryside, Extremadura is a privileged reserve of biodiversity in Europe. The region “has more than two thousand varieties of flowers, including more than forty varieties of orchids, and can count on a remarkable wildlife diversity represented by more than 420 species of vertebrates, 375 of which complete their reproductive cycles in the region” (Pimienta, 2000, p. 8). This natural wealth is especially present in the region’s large protected areas.
35. The Region’s cultural resources constitute its main tourist attraction. Historical vestiges are numerous and are not only limited to the best known tourist sites in the region (Cáceres, Mérida or Guadalupe). They can also be found in other less well-known outlying municipalities, like Trujillo, Plasencia, Zafra or Jerez de los Caballeros. An official sign of the region’s cultural wealth is the UNESCO declaration of World Patrimony to the city of Cáceres (1986), to the archaeological remains of Mérida and to the monastery of Guadalupe (both in 1993)” (Pimienta, 2000, p. 9).
36. An additional indicator of this natural and cultural wealth can be found in the number and quality of the region’s museums. The museums display a varied archaeological legacy, representative of the rich culture and history of the region. Also, museums in Extremadura have gathered a significant amount of ethnographic collections, as well as works of art from Extremadurian, national and international artists (Pimienta, 2000, p. 3).
GOV/TDPC/RUR/RD(2004)3
19
37. This rich natural and cultural patrimony serves as the foundation of an expanding tourism industry, exemplified by the development of the local tourist offer (especially in the field of rural tourism). Tourist demand has grown considerably, although it still seems well below its possibilities and almost exclusively dependent on national tourists (from 85 to 90%) rather than international visits.
2.2 Regional challenges
38. Extremadura’s rural areas face numerous challenges; on the one hand, those that stem from some territorial and population characteristics, and, on the other hand, those related to the production structure.
39. A small population spread in a great number of small rural municipalities in a large territory outlines the need for an appropriate territorial planning scheme to try and promote the endowment of integrated infrastructures within the region, with Portugal and the rest of Spain and to keep some services and appropriate public equipment in as many areas as possible. The magnitude of this challenge becomes clearer when observing the high level of population, activity and services concentration around the seven larger urban municipalities, (see Figure 1b in Annex 1). Five cities in the south central region (Badajoz, Mérida, Don Benito, Villanueva de la Serena and Almendralejo) create an area of socioeconomic influence that does not include any southern or mid-western areas, whereas the two remaining more significant cities (Cáceres and Plasencia) resemble two isolated enclaves in the middle north of the region.
40. Regarding the productive structure, the great challenge is to face declining employment in agriculture and exploit opportunities for economic development at the regional level and especially in the rural areas. In terms of added value, agriculture contributes 11% and the agro-food industry 2%, and then the region receives only 9% from the rest of the industrial sector and 12% from construction, while the service sector contributes the most with 66%. In occupational terms by sector, agriculture accounts for 23% of the region’s employment, industry 12%, construction 17% and the service sector again leads with 48%. These data underline the structural deficiencies in the agrarian sector and the weakness of the industrial sector.
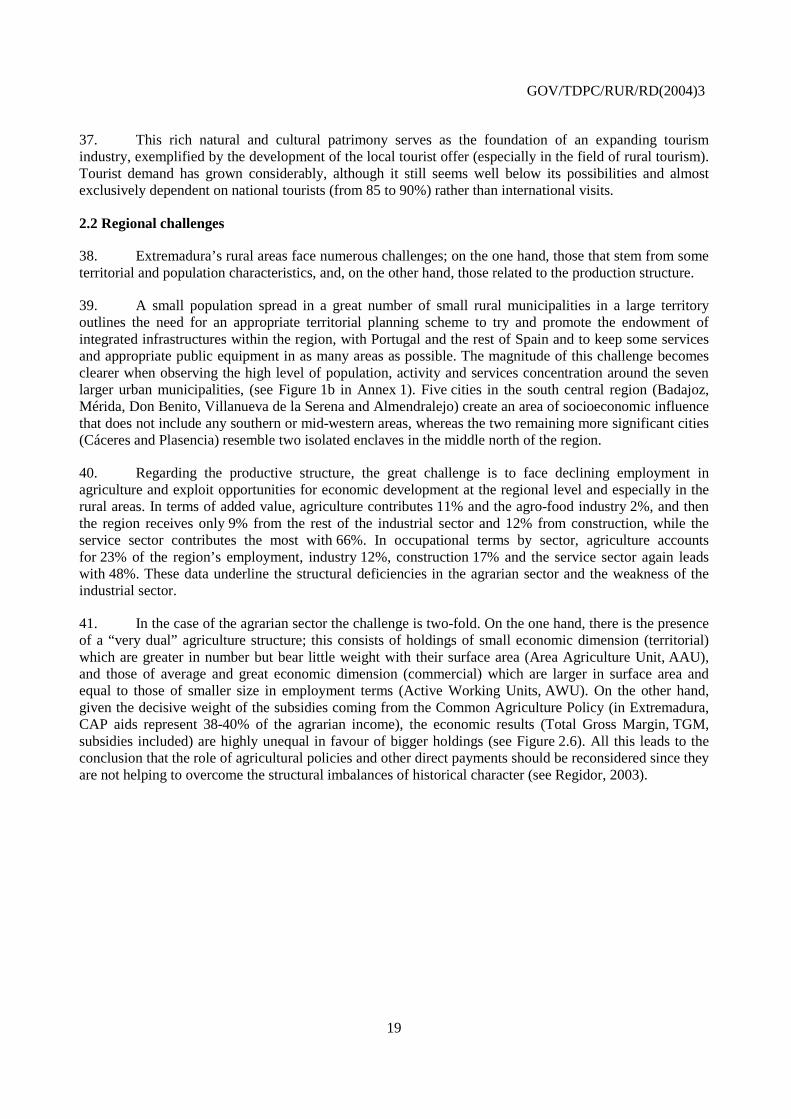
41. In the case of the agrarian sector the challenge is two-fold. On the one hand, there is the presence of a “very dual” agriculture structure; this consists of holdings of small economic dimension (territorial) which are greater in number but bear little weight with their surface area (Area Agriculture Unit, AAU), and those of average and great economic dimension (commercial) which are larger in surface area and equal to those of smaller size in employment terms (Active Working Units, AWU). On the other hand, given the decisive weight of the subsidies coming from the Common Agriculture Policy (in Extremadura, CAP aids represent 38-40% of the agrarian income), the economic results (Total Gross Margin, TGM, subsidies included) are highly unequal in favour of bigger holdings (see Figure 2.6). All this leads to the conclusion that the role of agricultural policies and other direct payments should be reconsidered since they are not helping to overcome the structural imbalances of historical character (see Regidor, 2003).
GOV/TDPC/RUR/RD(2004)3
20
Figure 2.6. Characteristics of Extremadura's agriculture, 1999
85.8
14.2
24.2
75.8
49.2 50.8
24.5
75.5
10
20
30
40
50
60
70
80
90
Ind
icat
ors
(%
)
Nº Holdings AAU AWU TGM
Types of agriculture Territorial Comercial
Source: INE, 2002.
42. As for the industrial sector, the large incidence of some sectors, such as energy and water (nuclear and hydroelectric energy represent 60% of Extremadura’s industrial production), is related to the narrow economic base and in particular to an extremely weak manufacturing industry whose productive specialisation is not efficient, and where the agro-food industry holds a decisive weight (20% of the industrial production).
43. The important weight of the service sector (with 62-63% of the GDP and regional employment) should also be considered, taking into account its deficiencies like the prevalence of services not oriented to selling (these represent a third of the product and 40% of employment), services oriented to traditional activities of very low productivity and very limited presence of services oriented to businesses. Moreover, in several rural areas the presence of this service sector depends almost entirely on the public administrations (Minister of Economy, 2000, pp. 306-313).
GOV/TDPC/RUR/RD(2004)3
21
PART III: THE LEADER IMPLEMENTATION IN EXTREMADURA
3.1 LEADER’s role in Extremadura’s rural development
44. As it is the case for several predominantly rural regions in the EU, the numerous challenges that can be derived from the socioeconomic characterisation of the Extremadura region (see Part II) call for an explicit effort by all tiers of government to design and implement an integrated strategy for rural development. However, as far as rural policy is concerned, this region depends almost entirely on EU rural policy, which in the absence of a regional or state-owned rural policy constitutes the major source of action currently targeting rural development.
45. EU rural development programmes have traditionally depended on the European Cohesion Policy and, to a smaller degree, on the Common Agriculture Policy (CAP). There are mainly three rural development programmes. The first is related to the attention that rural areas receive, starting from the Regional Development Plans (PDR) of an European region covered by Objective 1 (less economically developed regions whose per capita GDP is less than 75% of the EU average), the second one is represented by the so called "accompanying measures" of the CAP, and the third one is constituted by the LEADER Community Initiative supplemented in the Extremadura region by the PRODER6 parallel programme.
46. These programmes contain various rural development measures that have an important impact on the region. However, these do not constitute an articulated rural policy but rather “a basket of measures” applied in a non-systematic fashion in different rural areas, (Regidor, 2000: 133-155).
47. As for the attention of the PDR of Extremadura, the specific measures for rural areas aim at: 1) developing the economic fabric by implementing projects to improve the structure of the agricultural sector and the agro-food industry; and 2) supporting agricultural and rural development by implementing projects to improve the agricultural support infrastructure, the protection and conservation of the natural resources and the diversification of the agrarian activity. These measures translate into a sum of private (subsidised) and public (co-financed by the EU) investment projects that are not part of a development plan differentiated by types of rural areas. The agrarian and agro-food sectoral character of these policies is clear, although a number of other economic development actions, which are separate from the PDR measures, have been applied to rural areas, including the improvement of infrastructures and public equipment, support to firms of other productive sectors and training.
48. The second programme, the CAP “accompanying measures”, consists of subsidies to promote the “early retirement of the agrarian activity”, the adoption of “environmental measures in connection with agriculture”, and the “forestation of agricultural lands”. In spite of its limited significance and its horizontal character (for the whole rural territory), the programme has successfully established a significant presence in some specific rural areas. The programme’s level of application has depended on the region’s social and environmental characteristics and on the regional administration’s political interest. This has caused a significant but concentrated performance in some actions and in a limited number of rural areas.
49. The third programme, the LEADER-PRODER community initiative, is applied in all rural areas through a group of actions that try to exploit the local resources and look for innovative solutions. The LEADER measures have been oriented to motivate the private initiative in the following areas: 1) technical
GOV/TDPC/RUR/RD(2004)3
22
support for rural development; 2) professional training and aids for recruiting; 3) rural tourism; 4) promoting small firms, craftworks and the social services; 5) improving the value and marketing of the local agrarian and fishing production; and 6) other support measures for the local action groups and their integration in international exchange networks. PRODER measures are mainly oriented towards: 1) valuation of the rural patrimony; 2) promoting tourism investment in the countryside; 3) promoting the creation of small and middle size firms, craftworks and service providers; 4) supporting service provision to businesses in the countryside; and 5) reassessing the agricultural and forestral production potential.
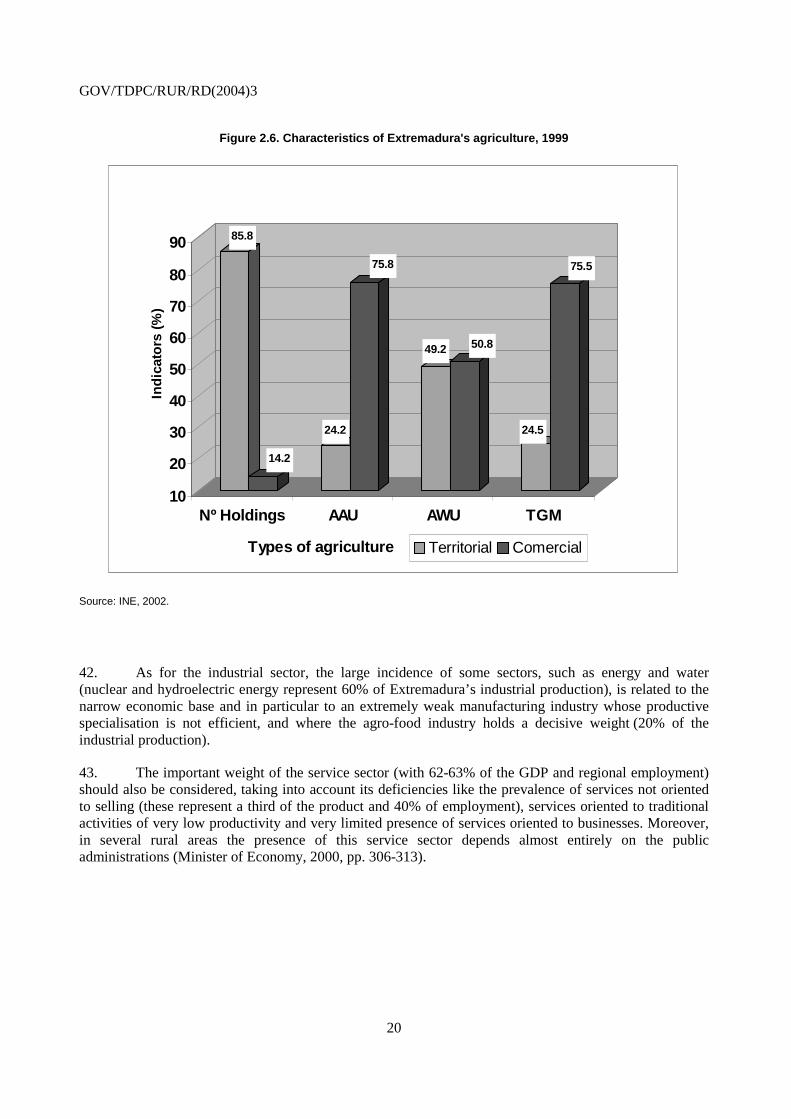
50. In this region, the LEADER programme and its method were diffused at a surprisingly quick rate from 1990-2000. All the observed indicators show a programme better received than any other rural development programme, in spite of its reduced financial importance. Over the considered period, the number of rural areas that participated increased from four in the LEADER I programme to 22 in the LEADER II and PRODER programmes, the number of municipalities multiplied by six, covering close to 80% of the territorial surface area and over 50% of the regional population, while the total initial investment of EUR 18 million grew significantly to nearly EUR 130 million (see Table 3.1). The programme’s coverage finally extended to almost all rural areas of Extremadura.
Table 3.1. Development of LEADER-PRODER programmes in Extremadura
Rural area
partici- pants
Munci- palities
involved
Regional pop-
ulation (%)
Terr- itorial
area (%)
Average density of pop- ulation
affected (inhabit-
ants/ km2)
Total invest- ment (EUR
millions)
1990-1993 period LEADER I 4 47 9.2 4.5 17.0 17.9 LEADER II 10 165 27.5 45.5 17.3 69.1 PRODER 12 136 25 33.3 21.4 59.5 1994-1999 period LEADER II and PRODER 22 301 52.5 78.8 18.9 128.6
Source: Consejería de Desarrollo Rural de Extremadura.
51. While the financial weight of the programme (about EUR 420 000 invested over six years), whose impact per inhabitant or per municipality was not very significant, the success of LEADER has been due mainly to the method used in the application of the rural development measures. The content of these measures, which is summarised in Table 2a in Annex 2, suggests that the direct results could not lead to a transformation of the economic and social reality of the region’s rural areas, however the conjunction of a “local action group” that applies a “strategy” in a defined “territory” has had substantial positive effects. As discussed in the next section, the financial weaknesses of the LEADER-PRODER programme have been overcome in numerous areas thanks to an exceptional participation from the private sector and to the capacity and dynamism of several local action groups.
52. This LEADER programme is in question for the next period, 2007-2013, starting from which the programme itself should disappear and its method is supposed to be mainstreamed into a new overall framework for rural development policy in the EU.7 In this context, key questions are whether LEADER has been a successful initiative overall and how can the LEADER method move forward and be mainstreamed. Section 3.2 discusses these questions.
GOV/TDPC/RUR/RD(2004)3
23
3.2 Has LEADER been effective?
53. The analysis of the LEADER programme’s results in the EU and the Extremadura region suggest that the disappearance of the programme would have fewer consequences for the development of many rural areas than that of the method it introduced. The conservation of this method is a governance question, concerning the very existence of a number of innovative experiences of co-operation and mobilisation of resources that have marked a breakthrough in policy making and local governance in Extremadura and that represent an important legacy of the LEADER programme so far.
54. The assessment of LEADER’s effectiveness and impact in Extremadura has focused on three main aspects: 1) the financial estimation of the relative importance of LEADER as opposed to other rural development programmes; 2) the level of dispersion of resources and the coherence of their coverage; and 3) the evaluation of the programme’s impact combining different quantitative indicators with more qualitative considerations.
The weight of the programme compared with other rural development initiatives
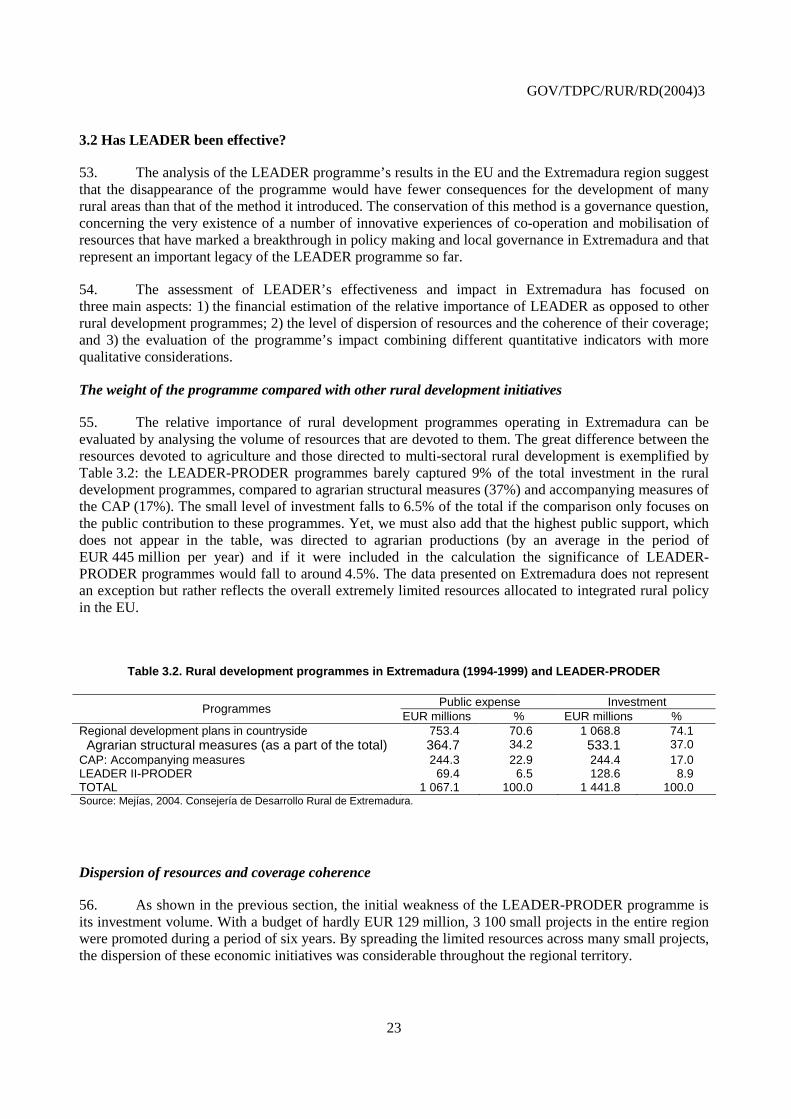
55. The relative importance of rural development programmes operating in Extremadura can be evaluated by analysing the volume of resources that are devoted to them. The great difference between the resources devoted to agriculture and those directed to multi-sectoral rural development is exemplified by Table 3.2: the LEADER-PRODER programmes barely captured 9% of the total investment in the rural development programmes, compared to agrarian structural measures (37%) and accompanying measures of the CAP (17%). The small level of investment falls to 6.5% of the total if the comparison only focuses on the public contribution to these programmes. Yet, we must also add that the highest public support, which does not appear in the table, was directed to agrarian productions (by an average in the period of EUR 445 million per year) and if it were included in the calculation the significance of LEADER-PRODER programmes would fall to around 4.5%. The data presented on Extremadura does not represent an exception but rather reflects the overall extremely limited resources allocated to integrated rural policy in the EU.
Table 3.2. Rural development programmes in Extremadura (1994-1999) and LEADER-PRODER
Public expense Investment Programmes EUR millions % EUR millions %
Regional development plans in countryside 753.4 70.6 1 068.8 74.1 Agrarian structural measures (as a part of the total) 364.7 34.2 533.1 37.0
CAP: Accompanying measures 244.3 22.9 244.4 17.0 LEADER II-PRODER 69.4 6.5 128.6 8.9 TOTAL 1 067.1 100.0 1 441.8 100.0 Source: Mejías, 2004. Consejería de Desarrollo Rural de Extremadura.
Dispersion of resources and coverage coherence
56. As shown in the previous section, the initial weakness of the LEADER-PRODER programme is its investment volume. With a budget of hardly EUR 129 million, 3 100 small projects in the entire region were promoted during a period of six years. By spreading the limited resources across many small projects, the dispersion of these economic initiatives was considerable throughout the regional territory.
GOV/TDPC/RUR/RD(2004)3
24
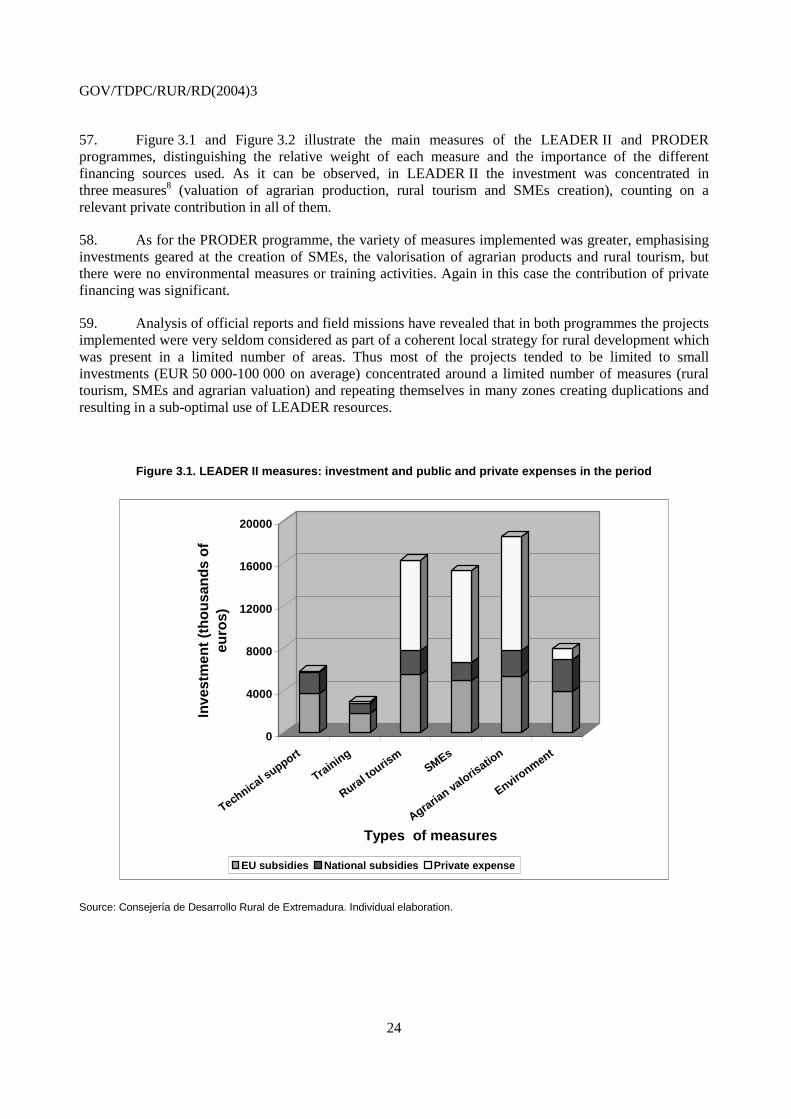
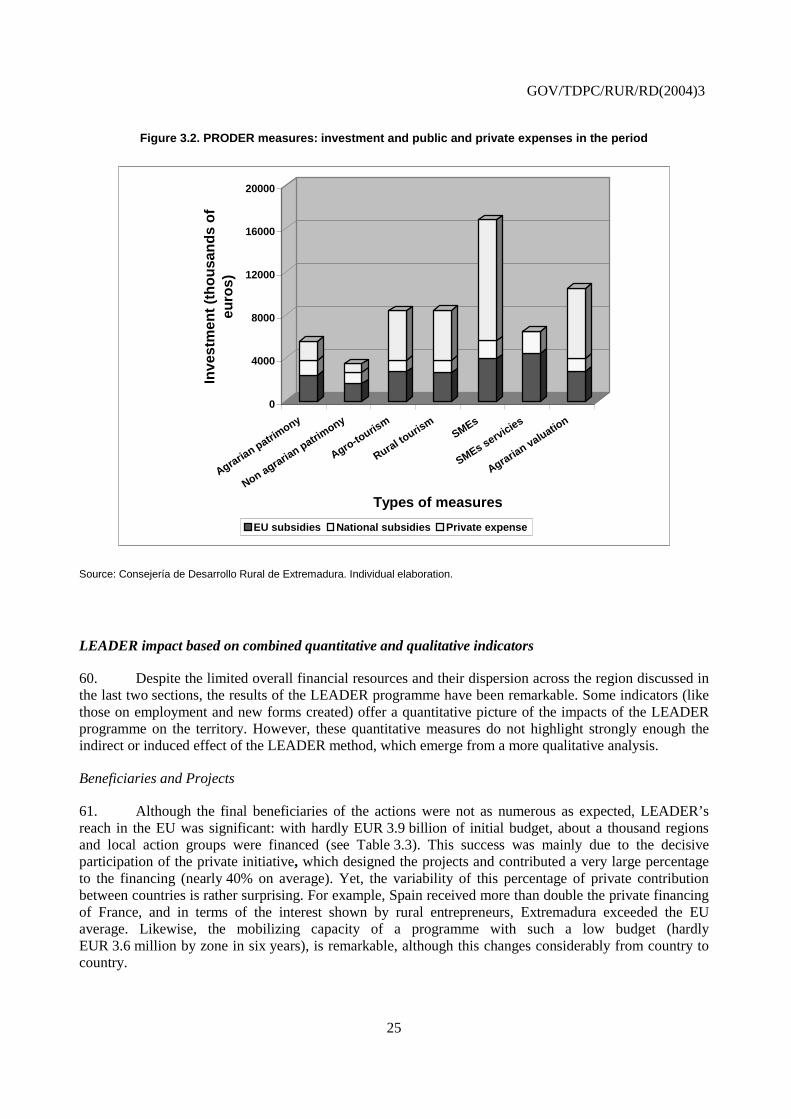
57. Figure 3.1 and Figure 3.2 illustrate the main measures of the LEADER II and PRODER programmes, distinguishing the relative weight of each measure and the importance of the different financing sources used. As it can be observed, in LEADER II the investment was concentrated in three measures8 (valuation of agrarian production, rural tourism and SMEs creation), counting on a relevant private contribution in all of them.
58. As for the PRODER programme, the variety of measures implemented was greater, emphasising investments geared at the creation of SMEs, the valorisation of agrarian products and rural tourism, but there were no environmental measures or training activities. Again in this case the contribution of private financing was significant.
59. Analysis of official reports and field missions have revealed that in both programmes the projects implemented were very seldom considered as part of a coherent local strategy for rural development which was present in a limited number of areas. Thus most of the projects tended to be limited to small investments (EUR 50 000-100 000 on average) concentrated around a limited number of measures (rural tourism, SMEs and agrarian valuation) and repeating themselves in many zones creating duplications and resulting in a sub-optimal use of LEADER resources.
Figure 3.1. LEADER II measures: investment and public and private expenses in the period
0
4000
8000
12000
16000
20000
Inve
stm
ent
(th
ou
san
ds
of
euro
s)
Technical support
Training
Rural touris
mSMEs
Agrarian valoris
ation
Environment
Types of measures
EU subsidies National subsidies Private expense
Source: Consejería de Desarrollo Rural de Extremadura. Individual elaboration.
GOV/TDPC/RUR/RD(2004)3
25
Figure 3.2. PRODER measures: investment and public and private expenses in the period
0
4000
8000
12000
16000
20000
Inve
stm
ent
(th
ou
san
ds
of
euro
s)
Agrarian patrim
ony
Non agrarian patrim
ony
Agro-touris
m
Rural touris
m
SMEs
SMEs servicies
Agrarian valuatio
n
Types of measures
EU subsidies National subsidies Private expense
Source: Consejería de Desarrollo Rural de Extremadura. Individual elaboration.
LEADER impact based on combined quantitative and qualitative indicators
60. Despite the limited overall financial resources and their dispersion across the region discussed in the last two sections, the results of the LEADER programme have been remarkable. Some indicators (like those on employment and new forms created) offer a quantitative picture of the impacts of the LEADER programme on the territory. However, these quantitative measures do not highlight strongly enough the indirect or induced effect of the LEADER method, which emerge from a more qualitative analysis.
Beneficiaries and Projects
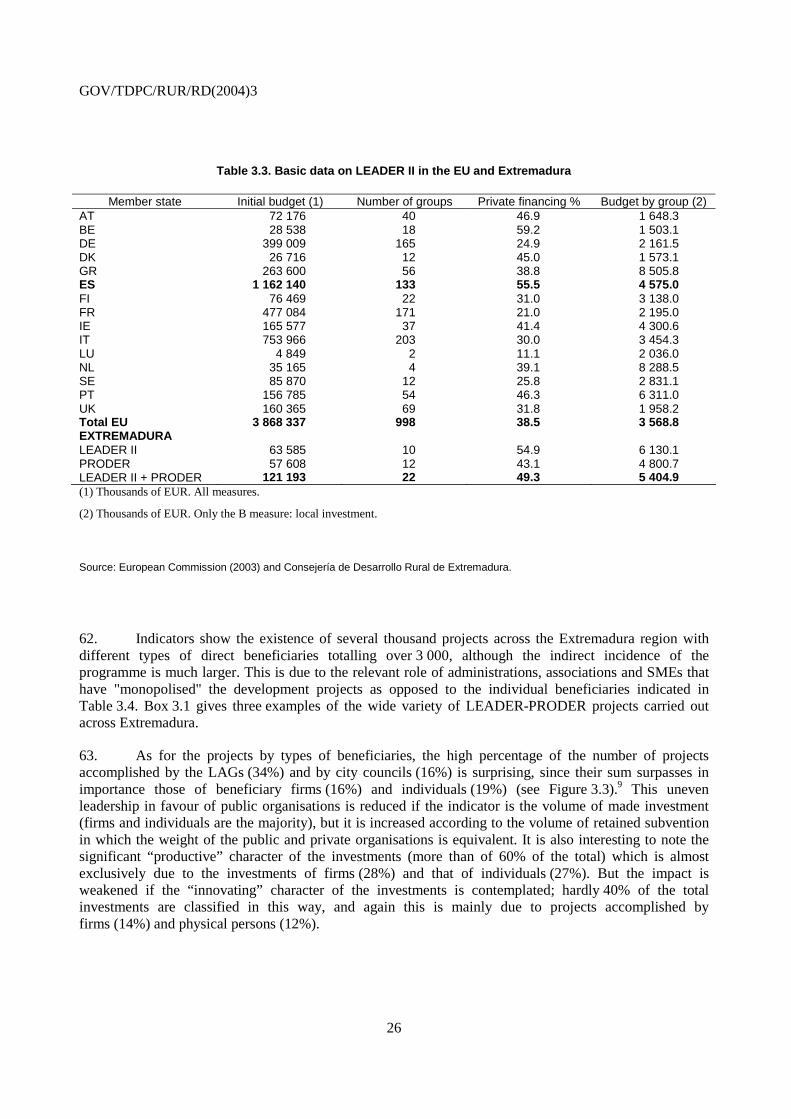
61. Although the final beneficiaries of the actions were not as numerous as expected, LEADER’s reach in the EU was significant: with hardly EUR 3.9 billion of initial budget, about a thousand regions and local action groups were financed (see Table 3.3). This success was mainly due to the decisive participation of the private initiative, which designed the projects and contributed a very large percentage to the financing (nearly 40% on average). Yet, the variability of this percentage of private contribution between countries is rather surprising. For example, Spain received more than double the private financing of France, and in terms of the interest shown by rural entrepreneurs, Extremadura exceeded the EU average. Likewise, the mobilizing capacity of a programme with such a low budget (hardly EUR 3.6 million by zone in six years), is remarkable, although this changes considerably from country to country.
GOV/TDPC/RUR/RD(2004)3
26
Table 3.3. Basic data on LEADER II in the EU and Extremadura
Member state Initial budget (1) Number of groups Private financing % Budget by group (2) AT 72 176 40 46.9 1 648.3 BE 28 538 18 59.2 1 503.1 DE 399 009 165 24.9 2 161.5 DK 26 716 12 45.0 1 573.1 GR 263 600 56 38.8 8 505.8 ES 1 162 140 133 55.5 4 575.0 FI 76 469 22 31.0 3 138.0 FR 477 084 171 21.0 2 195.0 IE 165 577 37 41.4 4 300.6 IT 753 966 203 30.0 3 454.3 LU 4 849 2 11.1 2 036.0 NL 35 165 4 39.1 8 288.5 SE 85 870 12 25.8 2 831.1 PT 156 785 54 46.3 6 311.0 UK 160 365 69 31.8 1 958.2 Total EU 3 868 337 998 38.5 3 568.8 EXTREMADURA LEADER II 63 585 10 54.9 6 130.1 PRODER 57 608 12 43.1 4 800.7 LEADER II + PRODER 121 193 22 49.3 5 404.9 (1) Thousands of EUR. All measures.
(2) Thousands of EUR. Only the B measure: local investment.
Source: European Commission (2003) and Consejería de Desarrollo Rural de Extremadura.
62. Indicators show the existence of several thousand projects across the Extremadura region with different types of direct beneficiaries totalling over 3 000, although the indirect incidence of the programme is much larger. This is due to the relevant role of administrations, associations and SMEs that have "monopolised" the development projects as opposed to the individual beneficiaries indicated in Table 3.4. Box 3.1 gives three examples of the wide variety of LEADER-PRODER projects carried out across Extremadura.
63. As for the projects by types of beneficiaries, the high percentage of the number of projects accomplished by the LAGs (34%) and by city councils (16%) is surprising, since their sum surpasses in importance those of beneficiary firms (16%) and individuals (19%) (see Figure 3.3).9 This uneven leadership in favour of public organisations is reduced if the indicator is the volume of made investment (firms and individuals are the majority), but it is increased according to the volume of retained subvention in which the weight of the public and private organisations is equivalent. It is also interesting to note the significant “productive” character of the investments (more than of 60% of the total) which is almost exclusively due to the investments of firms (28%) and that of individuals (27%). But the impact is weakened if the “innovating” character of the investments is contemplated; hardly 40% of the total investments are classified in this way, and again this is mainly due to projects accomplished by firms (14%) and physical persons (12%).
GOV/TDPC/RUR/RD(2004)3
27
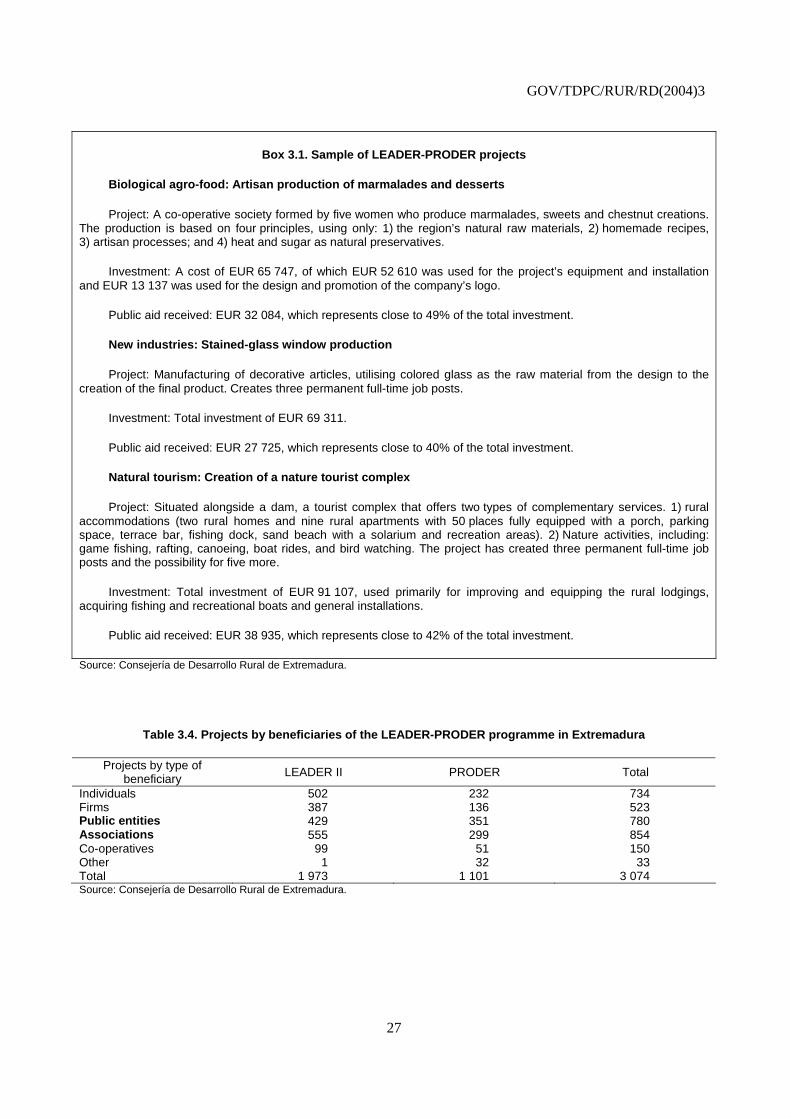
Box 3.1. Sample of LEADER-PRODER projects
Biological agro-food: Artisan production of marmalades and desserts
Project: A co-operative society formed by five women who produce marmalades, sweets and chestnut creations. The production is based on four principles, using only: 1) the region’s natural raw materials, 2) homemade recipes, 3) artisan processes; and 4) heat and sugar as natural preservatives.
Investment: A cost of EUR 65 747, of which EUR 52 610 was used for the project’s equipment and installation and EUR 13 137 was used for the design and promotion of the company’s logo.
Public aid received: EUR 32 084, which represents close to 49% of the total investment.
New industries: Stained-glass window production
Project: Manufacturing of decorative articles, utilising colored glass as the raw material from the design to the creation of the final product. Creates three permanent full-time job posts.
Investment: Total investment of EUR 69 311.
Public aid received: EUR 27 725, which represents close to 40% of the total investment.
Natural tourism: Creation of a nature tourist complex
Project: Situated alongside a dam, a tourist complex that offers two types of complementary services. 1) rural accommodations (two rural homes and nine rural apartments with 50 places fully equipped with a porch, parking space, terrace bar, fishing dock, sand beach with a solarium and recreation areas). 2) Nature activities, including: game fishing, rafting, canoeing, boat rides, and bird watching. The project has created three permanent full-time job posts and the possibility for five more.
Investment: Total investment of EUR 91 107, used primarily for improving and equipping the rural lodgings, acquiring fishing and recreational boats and general installations.
Public aid received: EUR 38 935, which represents close to 42% of the total investment.
Source: Consejería de Desarrollo Rural de Extremadura.
Table 3.4. Projects by beneficiaries of the LEADER-PRODER programme in Extremadura
Projects by type of beneficiary LEADER II PRODER Total
Individuals 502 232 734 Firms 387 136 523 Public entities 429 351 780 Associations 555 299 854 Co-operatives 99 51 150 Other 1 32 33 Total 1 973 1 101 3 074 Source: Consejería de Desarrollo Rural de Extremadura.
GOV/TDPC/RUR/RD(2004)3
28
Figure 3.3. Projects and beneficiaries of the LEADER-PRODER programme
0
5
10
15
20
25
30
35
40
City co
uncils
Firms
Cooperat
ives
Associa
tions
Indivi
dualsLAGs
Types of beneficiaries
Per
cen
tag
es
Projects
Investment
Subsidies
Productive/invest.
Innovative/invest.
(1) Data is based on the results of a survey of a sample of Extremadura’s LAGs.
Source: LAGs of Extremadura. Individual elaboration.
64. The importance of public organisations as beneficiaries of LEADER reflects an anomaly in terms of the additionality of the programme in Extremadura. Besides, these local administrations often used LEADER funds to finance small local improvement projects (such as renovation of public buildings), which could have been accomplished using other funds, and as a result prevented other beneficiaries from taking advantage of the programme. This widely diffused practice worsens when the percentage of subvention reaches maximum levels (100%).
65. Another anomaly in the implementation of LEADER was found in the behaviour of several LAGs that went beyond just promoting innovative projects and have interpreted their role as "receivers" of proposals, thereby managing a distribution of resources to meet the highest possible number of demands. Furthermore, it is possible that the limited will of the city councils and the LAG to take care of the diverse needs and deficiencies of the countryside that are not part of the productive projects has negatively influenced the programme’s impact on the territory.
Labour market: employment and firms
66. In a region like Extremadura, where lagging rural areas with little diversified economic structure prevail, the impact of LEADER on the labour market is relevant. For example, more than 5 000 jobs have been “created” or “consolidated” in the period with relatively modest unitary cost. Furthermore, a significant number of firms and new associations were created, and a remarkable expansion of rural tourism establishments took place (see Table 3.5).
GOV/TDPC/RUR/RD(2004)3
29
Table 3.5. LEADER-PRODER programmes in Extremadura
Quantitative indicators of results
Indicators LEADER II PRODER Total Fixed employment 873 743 1 616 Temporary employment 710 319 1 029 Employment created 1 583 1 062 2 645 Consolidated employment 1 331 1 136 2 467 New firms 241 233 474 New associations 41 25 66 Tourism (nº of beds) 1 415 2 181 3 596 Source: Consejería de Desarrollo Rural de Extremadura.
67. In terms of employment, the hardest task is to value the significance of these more than 5 000 created or maintained jobs in Extremadura. As a reference, the LEADER programme generated about 20 000 jobs of this type in all of Spain, and about 100 000 in the EU-15, according to official evaluations. We would be, therefore, facing very remarkable relative results for this region in absolute terms.
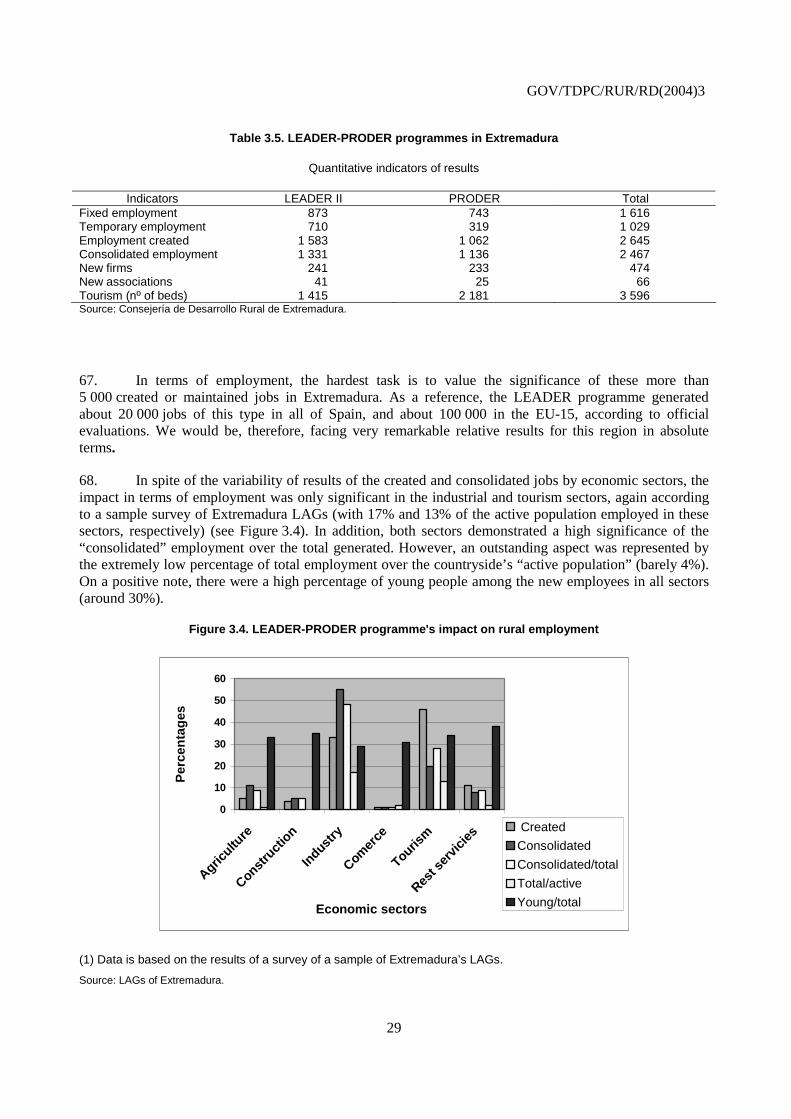
68. In spite of the variability of results of the created and consolidated jobs by economic sectors, the impact in terms of employment was only significant in the industrial and tourism sectors, again according to a sample survey of Extremadura LAGs (with 17% and 13% of the active population employed in these sectors, respectively) (see Figure 3.4). In addition, both sectors demonstrated a high significance of the “consolidated” employment over the total generated. However, an outstanding aspect was represented by the extremely low percentage of total employment over the countryside’s “active population” (barely 4%). On a positive note, there were a high percentage of young people among the new employees in all sectors (around 30%).
Figure 3.4. LEADER-PRODER programme's impact on rural employment
0
10
20
30
40
50
60
Agricultu
re
Constru
ctio
n
Indust
ry
Comer
ce
Tourism
Rest s
ervic
ies
Economic sectors
Per
cen
tag
es
Created
Consolidated
Consolidated/total
Total/active
Young/total
(1) Data is based on the results of a survey of a sample of Extremadura’s LAGs.
Source: LAGs of Extremadura.
GOV/TDPC/RUR/RD(2004)3
30
69. Finally, the quality and durability of the employment level generated should be noted. The importance of “self-employment” gives rise to a greater stability, whereas the lack of mobility in employment abounds in some sectors, such as agro-industry and tourism. In general, one considers that the percentage of unsuccessful jobs would not have been especially elevated versus the high index of failure attributed to the small investment projects in the countryside.
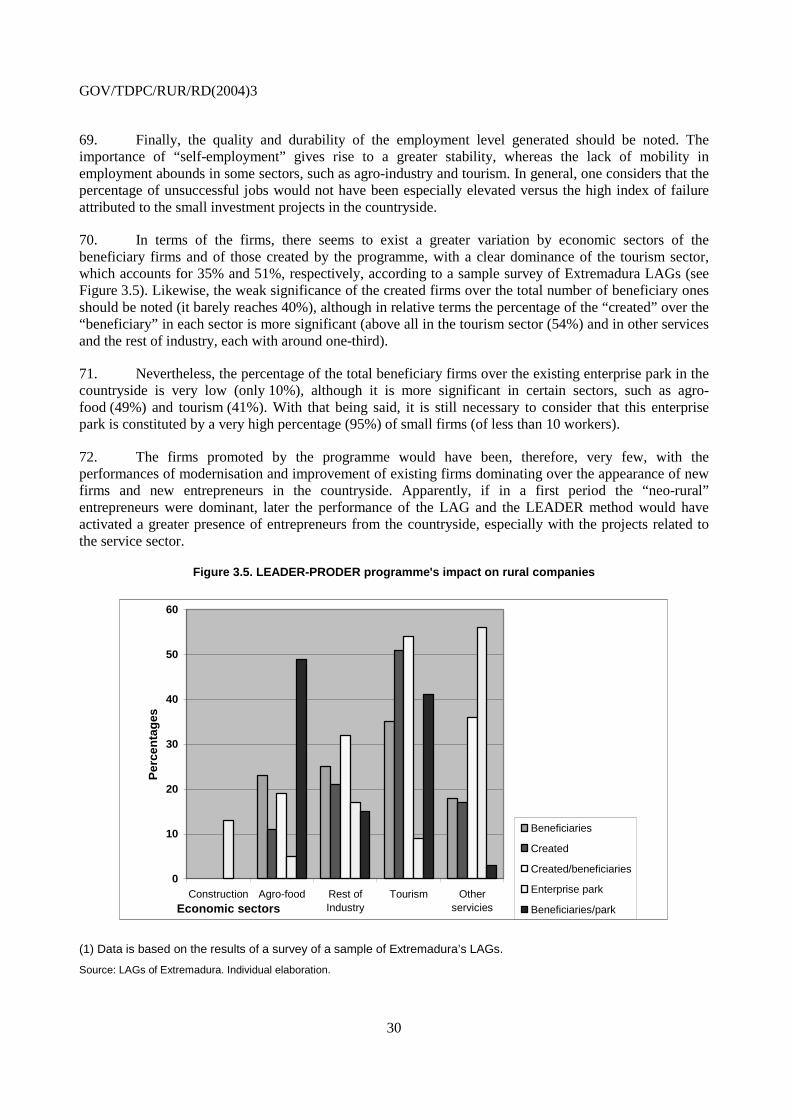
70. In terms of the firms, there seems to exist a greater variation by economic sectors of the beneficiary firms and of those created by the programme, with a clear dominance of the tourism sector, which accounts for 35% and 51%, respectively, according to a sample survey of Extremadura LAGs (see Figure 3.5). Likewise, the weak significance of the created firms over the total number of beneficiary ones should be noted (it barely reaches 40%), although in relative terms the percentage of the “created” over the “beneficiary” in each sector is more significant (above all in the tourism sector (54%) and in other services and the rest of industry, each with around one-third).
71. Nevertheless, the percentage of the total beneficiary firms over the existing enterprise park in the countryside is very low (only 10%), although it is more significant in certain sectors, such as agro-food (49%) and tourism (41%). With that being said, it is still necessary to consider that this enterprise park is constituted by a very high percentage (95%) of small firms (of less than 10 workers).
72. The firms promoted by the programme would have been, therefore, very few, with the performances of modernisation and improvement of existing firms dominating over the appearance of new firms and new entrepreneurs in the countryside. Apparently, if in a first period the “neo-rural” entrepreneurs were dominant, later the performance of the LAG and the LEADER method would have activated a greater presence of entrepreneurs from the countryside, especially with the projects related to the service sector.
Figure 3.5. LEADER-PRODER programme's impact on rural companies
0
10
20
30
40
50
60
Construction Agro-food Rest ofIndustry
Tourism OtherserviciesEconomic sectors
Per
cen
tag
es
Beneficiaries
Created
Created/beneficiaries
Enterprise park
Beneficiaries/park
(1) Data is based on the results of a survey of a sample of Extremadura’s LAGs.
Source: LAGs of Extremadura. Individual elaboration.
GOV/TDPC/RUR/RD(2004)3
31
73. Similar to studying LEADER’s impact using quantitative measures, a qualitative approach shows other important effects of the LEADER programme on different, although not always quantifiable, correlated factors. The qualitative effects are far greater than the quantitative ones, and given the LEADER programme’s limited endowment of financial resources, they are largely derived from the diffusion of the LEADER method and its positive impact on local governance.
74. The contributions of the LEADER method to the consolidation of local governance, to the recovery of the image and identity of the areas, to the value of non-exploited economic, social and natural resources, and, in particular, to the increased social participation in the conception and implementation of development and conservation projects were remarkable. These more intangible aspects are significant and highlight that if on the one side there are certain limitations to the impact of the measures financed by the programme, there are on the other side positive overall results due to the LEADER method’s implementation. The next section focuses on issues that have emerged as critical to the implementation of the LEADER method in Extremadura and that stand out as policy challenges of the region.
3.3 Critical issues and policy challenges
75. Along the same lines of the conclusions of a mainstreaming study ordered by the European Commission (ÖIR-M., 2004), the Extremadura case can be considered among those in which the LEADER method has been applied rather “strongly” due to its extensive territorial reach, but not “fully”10 because of a series of difficulties and obstacles that are discussed below and that concern:
1. The role of different tiers of government in the financing and implementation of LEADER programmes. While each adds to a complex governance structure, these administrations have made a limited financial contribution to the programme, acting rather as intermediaries of EU funds.
2. The frequent lack of cohesion between the zones and the proposed development objectives due to the absence of a suitable “rural zonification” system.
3. The poor training of local action groups and private entrepreneurs that have often conditioned the quality of development projects.
Complex governance, limited budget and lack of strategic focus
76. The initial estimation of LEADER II’s funding sources predicted the EU to be the largest contributor (73%) compared to only a 27% combined contribution from the national, regional and local administrations (see Table 3.6). The low direct financial support from the Spanish government was expected to be compensated by their participation in the administration and evaluation of the programme. Thus the Commission determined the programme objectives, its performance, type of beneficiaries, subvention measures, and all the criteria for the accomplishment, follow-up and financing. Likewise, the central and regional administrations established rules11 along with the criteria for the awarding, control and transaction of the subsidies granted to the local action groups. All of this contributed to a complex bureaucratic structure involving all of the public administrations.
77. However, the expected public sector leadership and heavy EU financial support was displaced by the significant role assumed by the private initiative. Interest in the programme and functionality of the LEADER method caused, in the case of Extremadura like in many other regions, a much wider response than was expected. Private investment turned out to be the largest share at 46%, even greater than the communitarian contributions (36.5%). Thus, from a financial perspective the programme did not entirely depend on the EU, but instead rural entrepreneurs took the lead, while the central and regional administrations ended up playing a mere intermediation role (see Table 3.7).
GOV/TDPC/RUR/RD(2004)3
32
78. In response to this strong participation by the private sector, the public administration opted for a low average financial participation in individual projects in order to support as many of the private initiatives as possible.
Table 3.6. Public funds for the LEADER-PRODER programme (1994-1999, millions of Euros)
Predicted public expense at the beginning of programmes
Type of administration Type of programme Public funds Percentages European Union LEADER II 27.6 39.7 PRODER 23.2 33.2 50.8 72.9 Junta de Extremadura LEADER II 3.0 4.4 PRODER 3.7 5.4 6.7 9.8 Central administration LEADER II 3.2 4.5 PRODER 1.2 1.8 4.4 6.3 Local administration LEADER II 3.0 4.3 PRODER 4.7 6.7 7.7 11.0 TOTAL LEADER II 36.8 52.9 PRODER 32.8 47.1 69.6 100.0 Source: Consejería de Desarrollo Rural de Extremadura.
Table 3.7. LEADER-PRODER programme financing (1994-1999, millions of Euros)
Public and private expenses once programmes were completed
Type of administration Type of programme Investment Percentages European Union LEADER II 26.5 20.6 PRODER 20.4 15.9 46.9 36.5 Spain LEADER II 12.9 10.0 PRODER 9.5 7.4 22.4 17.5
LEADER II 39.4 30.7 PRODER 30.0 23.3
Total public expense (EU and Spain)
69.4 54.0 Private investment LEADER II 29.6 23.1 PRODER 29.6 23.0 59.2 46.0 TOTAL LEADER II 69.1 53.7 PRODER 59.5 46.3 128.6 100.0 Source: Consejería de Desarrollo Rural de Extremadura.
GOV/TDPC/RUR/RD(2004)3
33
Target areas and development objectives
79. The case of Extremadura has shown that a territorial delimitation simply based on political-administrative criteria and the lack of a suitable “zonification” system can cause a lack of coherence between the characteristics of the target areas and the proposed or desirable development objectives.
80. In Extremadura, the absence of an accepted territorial system (an official rural zonification system) gave rise to “ad hoc” territorial boundaries for the application of the LEADER-PRODER programme. In some cases this delimitation corresponded with zones equipped with common agroclimatic and cultural/historical characteristics, but in many others the delimitation was made according to opportunistic and political reasons. Consequently, several target areas (LEADER and PRODER rural areas) were not well-adapted to the development objectives set by the programme due to their size or lack of a common territorial identity. In these cases it often has been necessary to ‘resize’ the target areas or to reduce the scope and number of development objectives. Changes in the delimitation of areas introduced when moving from one phase of the programme to another (from LEADER I to LEADER II or to PRODER, for example) have only in some cases allowed for a solution to this problem.
81. Figure 1c in Annex 1 reproduces a zonification proposal (Aliseda, 2004), which contrasts with the LEADER-PRODER programme’s zones of application (as seen in Figure 1a), especially regarding the extension and number of zones. From this comparison, one can observe that the LEADER-PRODER zones, determined by agreements between municipalities for a specific goal (to carry out a rural development plan), do not correspond with regions established by a set of functional indicators (on economic activity, infrastructure, services and historical identity), that could have served much more ambitious development objectives.
82. In Extremadura like in the EU, LEADER’s development objectives were defined unitarily for all the target zones. No distinction was made in terms of "rurality". This deficiency has given rise to very unequal concerns by zones within the same region, in relation to the size of the zones, as well as to the volume of the existing population and level of public spending in each zone (see Figures 3a and 3b in Annex 3). The use of a defined typology during the zoning process could have allowed for a differentiated application of development objectives and a more effective use of the available resources.
Human capital and types of projects
83. The local action groups (LAGs) have the major responsibility for the application of the programme, designing a development strategy for each area and directing and co-ordinating with all types of public and private local agents inside and outside the region. The role played by the LAGs in Extremadura varied greatly. In some cases, the LAG constituted a dynamic actor, whereas in other cases they tended to behave more like a new administrative body managing subventions.
84. The most active LAGs were characterised by better training levels of their members and of the entrepreneurs existing in each area. In this context, the key challenge for the public administrations was deciding whether to invest in the training of LAG members in those cases where the rate of return would be the greatest, or to take a more active role in compensating for the LAGs’ difficulties by assisting them in selecting projects.
85. Table 3.8 considers expenditure by measures and shows that despite the key importance of improving training levels of the actors managing LEADER, most of the resources were devoted to "rural innovation" and that the improvement of the human capital through the acquirement of LAGs’ capacities had only little significance (it was partly compensated with the projects of technical support and training).
GOV/TDPC/RUR/RD(2004)3
34
Table 3.8. LEADER II: investment and public aid by type of project
1994-2000, thousands of EUR
Average per project Measures Number of
projects
Investment made (public aid included)
Public aid Investment Public aid
Acquirement of LAGs capacities 8 617.3 557.7 77.2 69.7 Rural innovation 1 975 66 660.2 37 352.0 33.8 18.9 Technical support 235 5 816.0 5 662.9 24.7 24.1 Training 375 2 976.0 2 746.1 7.9 7.3 Rural tourism 329 16 244.4 7 711.1 49.4 23.4 SMEs 536 15 240.4 6 639.0 28.4 12.4 Agrarian valuation 267 18 483.5 7 724.8 69.2 28.9 Environment 233 7 918.0 6 868.1 33.9 29.5 Transnational co-operation 32 1 728.1 1 445.1 54.0 45.2 Follow-up 87.0 87.0 Total 2 086 69 092.6 39 441.7 33.1 18.9 Source: Mejías, 2004. Consejería de Desarrollo Rural de Extremadura.
86. Likewise, Table 3.9 shows that when considering the PRODER programme, its seven main measures (four of which are the same as those in the LEADER programme and the other three are rather specific) did not include programs for improving the levels of human capital nor for international co-operation. Again the investments were primarily concentrated in four types of projects, with agro-tourism, rural tourism, SMEs and agrarian valuation capturing almost 75% of the total amount.
Table 3.9. PRODER: investment and public aid by type of project
1994-2000, thousands of EUR
Average per project Measures Number of
projects
Investment made (public aid included)
Public aid Investment Public aid
Patrimony of agrarian centres 174 5 517.8 3 773.3 31.7 21.7 Patrimony of non-agrarian centres 80 3 442.5 2 652.5 43.0 33.2 Agro-tourism 79 8 380.5 3 778.7 106.1 47.8 Rural tourism 166 8 415.9 3 753.7 50.7 22.6 SMEs 200 16 803.3 5 596.2 84.0 28.0 Services to companies 251 6 487.2 6 447.9 25.8 25.7 Revaluation of agrarian production 123 10 483.2 3 967.8 85.2 32.3 Total 1 073 59 530.2 29 970.1 55.5 27.9 Source: Mejías, 2004. Consejería de Desarrollo Rural de Extremadura.
3.4 Mainstreaming of the LEADER method: the way forward
87. The case study on Extremadura gives further evidence of the innovative character of the LEADER experience and of the important legacy it leaves, which mainly consists of its method. The LEADER method introduces significantly innovative and effective elements in the governance of place-based policies for rural development. Such elements, once introduced in a rural territory, are able to start
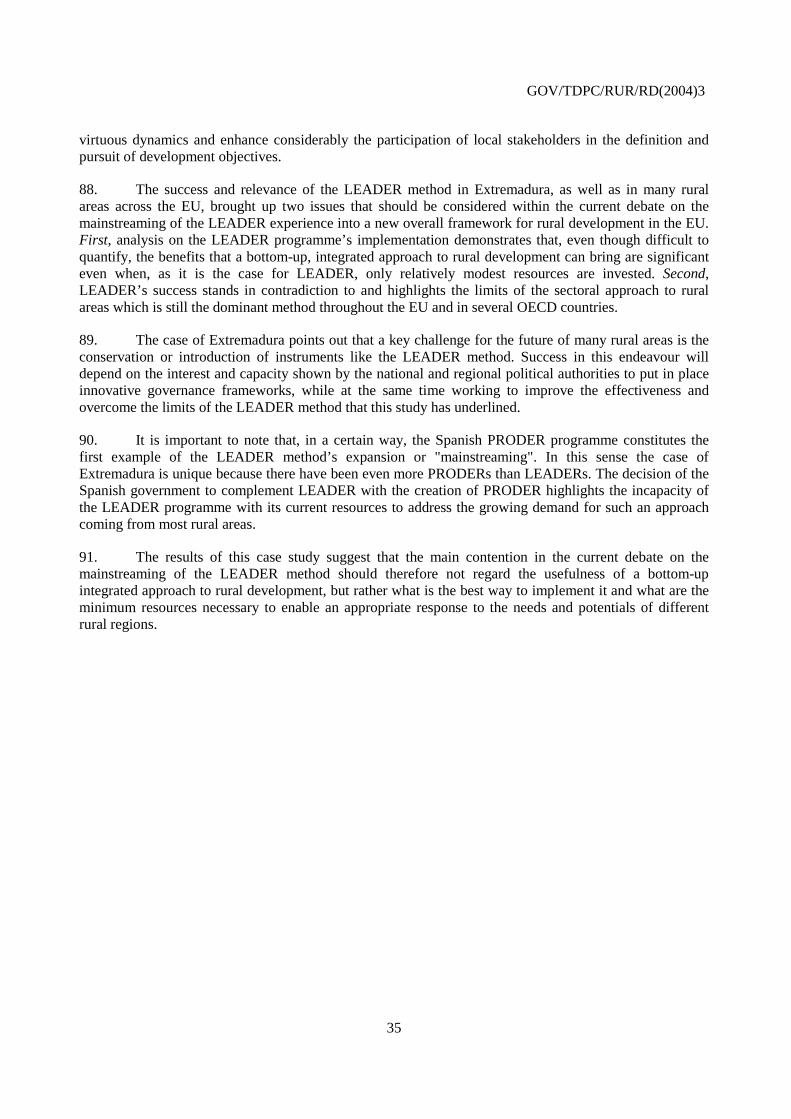
GOV/TDPC/RUR/RD(2004)3
35
virtuous dynamics and enhance considerably the participation of local stakeholders in the definition and pursuit of development objectives.
88. The success and relevance of the LEADER method in Extremadura, as well as in many rural areas across the EU, brought up two issues that should be considered within the current debate on the mainstreaming of the LEADER experience into a new overall framework for rural development in the EU. First, analysis on the LEADER programme’s implementation demonstrates that, even though difficult to quantify, the benefits that a bottom-up, integrated approach to rural development can bring are significant even when, as it is the case for LEADER, only relatively modest resources are invested. Second, LEADER’s success stands in contradiction to and highlights the limits of the sectoral approach to rural areas which is still the dominant method throughout the EU and in several OECD countries.
89. The case of Extremadura points out that a key challenge for the future of many rural areas is the conservation or introduction of instruments like the LEADER method. Success in this endeavour will depend on the interest and capacity shown by the national and regional political authorities to put in place innovative governance frameworks, while at the same time working to improve the effectiveness and overcome the limits of the LEADER method that this study has underlined.
90. It is important to note that, in a certain way, the Spanish PRODER programme constitutes the first example of the LEADER method’s expansion or "mainstreaming". In this sense the case of Extremadura is unique because there have been even more PRODERs than LEADERs. The decision of the Spanish government to complement LEADER with the creation of PRODER highlights the incapacity of the LEADER programme with its current resources to address the growing demand for such an approach coming from most rural areas.
91. The results of this case study suggest that the main contention in the current debate on the mainstreaming of the LEADER method should therefore not regard the usefulness of a bottom-up integrated approach to rural development, but rather what is the best way to implement it and what are the minimum resources necessary to enable an appropriate response to the needs and potentials of different rural regions.
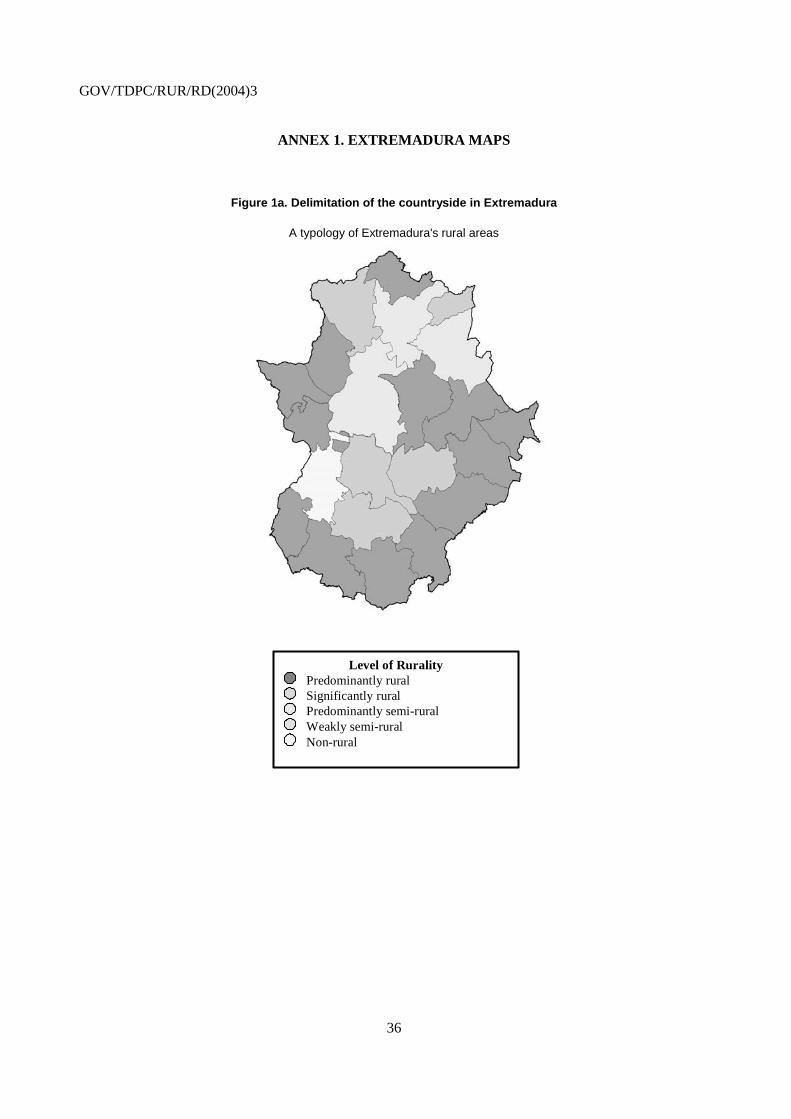
GOV/TDPC/RUR/RD(2004)3
36
ANNEX 1. EXTREMADURA MAPS
Figure 1a. Delimitation of the countryside in Extremadura
A typology of Extremadura's rural areas
Level of Rurality Predominantly rural Significantly rural Predominantly semi-rural Weakly semi-rural Non-rural
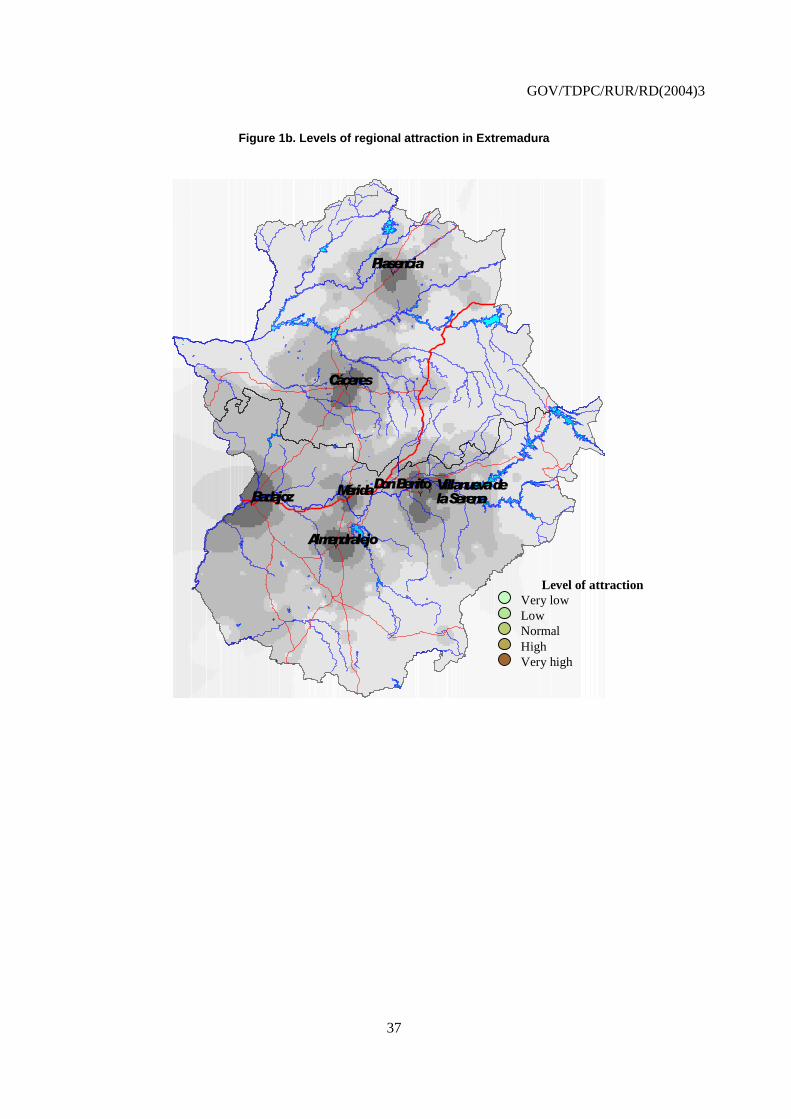
GOV/TDPC/RUR/RD(2004)3
37
Figure 1b. Levels of regional attraction in Extremadura
# Y
# Y # Y
# Y # Y
# Y
# Y
M é r i d a B a d a j o z
C á c e r e s
P l a s e n c i a
D o n B e n i t o
A l m e n d r a l e j o
V i l l a n u e v a d e l a S e r e n a
Level of attraction Very low Low Normal High Very high
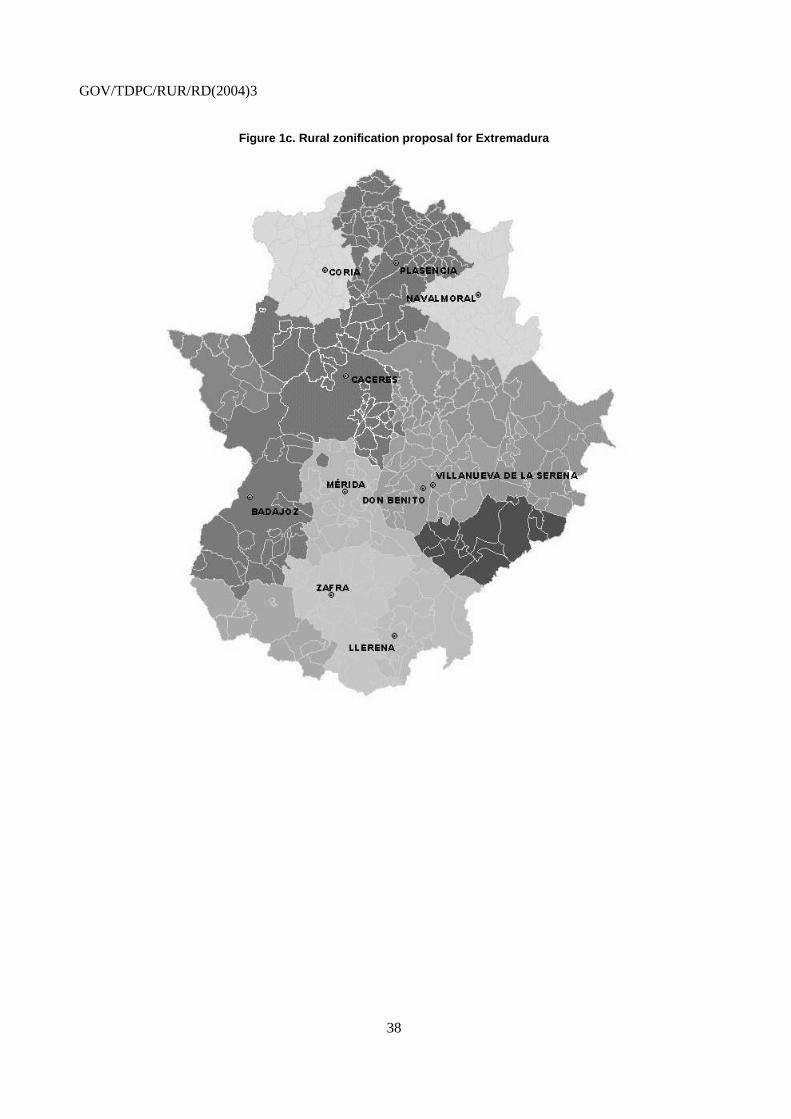
GOV/TDPC/RUR/RD(2004)3
38
Figure 1c. Rural zonification proposal for Extremadura
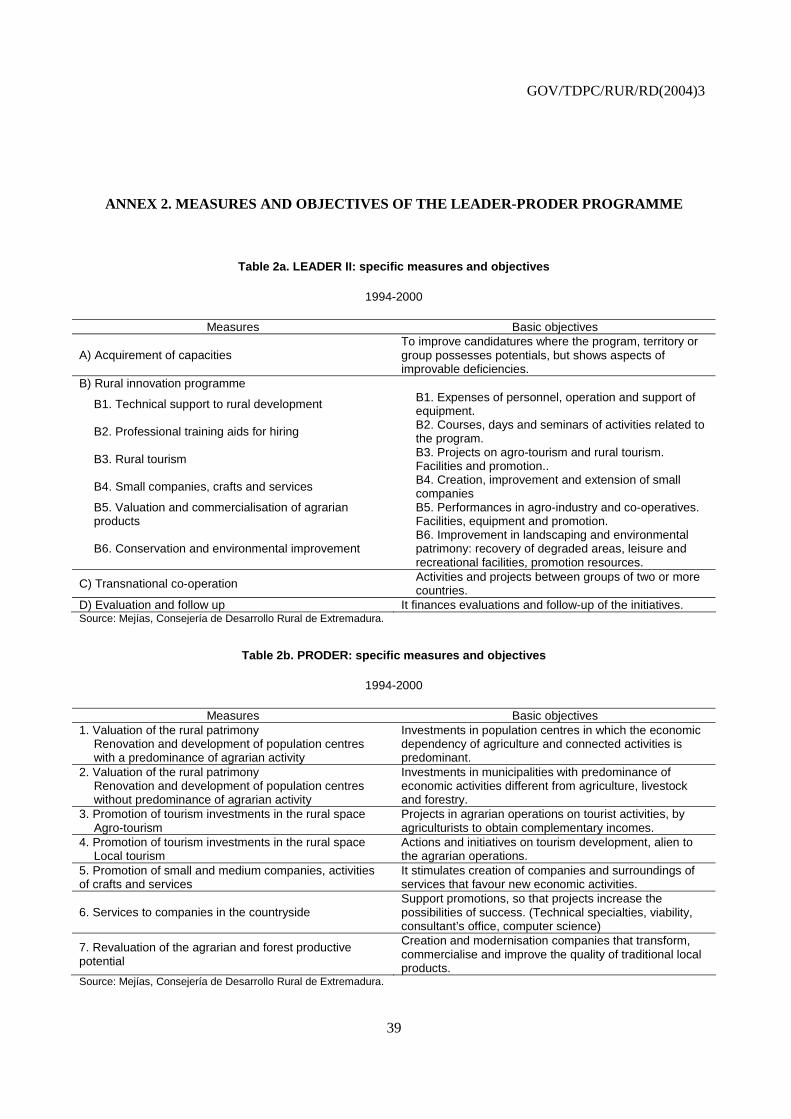
GOV/TDPC/RUR/RD(2004)3
39
ANNEX 2. MEASURES AND OBJECTIVES OF THE LEADER-PRODER PROGRAMME
Table 2a. LEADER II: specific measures and objectives
1994-2000
Measures Basic objectives
A) Acquirement of capacities To improve candidatures where the program, territory or group possesses potentials, but shows aspects of improvable deficiencies.
B) Rural innovation programme
B1. Technical support to rural development B1. Expenses of personnel, operation and support of equipment.
B2. Professional training aids for hiring B2. Courses, days and seminars of activities related to the program.
B3. Rural tourism B3. Projects on agro-tourism and rural tourism. Facilities and promotion..
B4. Small companies, crafts and services B4. Creation, improvement and extension of small companies
B5. Valuation and commercialisation of agrarian products
B5. Performances in agro-industry and co-operatives. Facilities, equipment and promotion.
B6. Conservation and environmental improvement B6. Improvement in landscaping and environmental patrimony: recovery of degraded areas, leisure and recreational facilities, promotion resources.
C) Transnational co-operation Activities and projects between groups of two or more countries.
D) Evaluation and follow up It finances evaluations and follow-up of the initiatives. Source: Mejías, Consejería de Desarrollo Rural de Extremadura.
Table 2b. PRODER: specific measures and objectives
1994-2000
Measures Basic objectives 1. Valuation of the rural patrimony
Renovation and development of population centres with a predominance of agrarian activity
Investments in population centres in which the economic dependency of agriculture and connected activities is predominant.
2. Valuation of the rural patrimony Renovation and development of population centres without predominance of agrarian activity
Investments in municipalities with predominance of economic activities different from agriculture, livestock and forestry.
3. Promotion of tourism investments in the rural space Agro-tourism
Projects in agrarian operations on tourist activities, by agriculturists to obtain complementary incomes.
4. Promotion of tourism investments in the rural space Local tourism
Actions and initiatives on tourism development, alien to the agrarian operations.
5. Promotion of small and medium companies, activities of crafts and services
It stimulates creation of companies and surroundings of services that favour new economic activities.
6. Services to companies in the countryside Support promotions, so that projects increase the possibilities of success. (Technical specialties, viability, consultant’s office, computer science)
7. Revaluation of the agrarian and forest productive potential
Creation and modernisation companies that transform, commercialise and improve the quality of traditional local products.
Source: Mejías, Consejería de Desarrollo Rural de Extremadura.
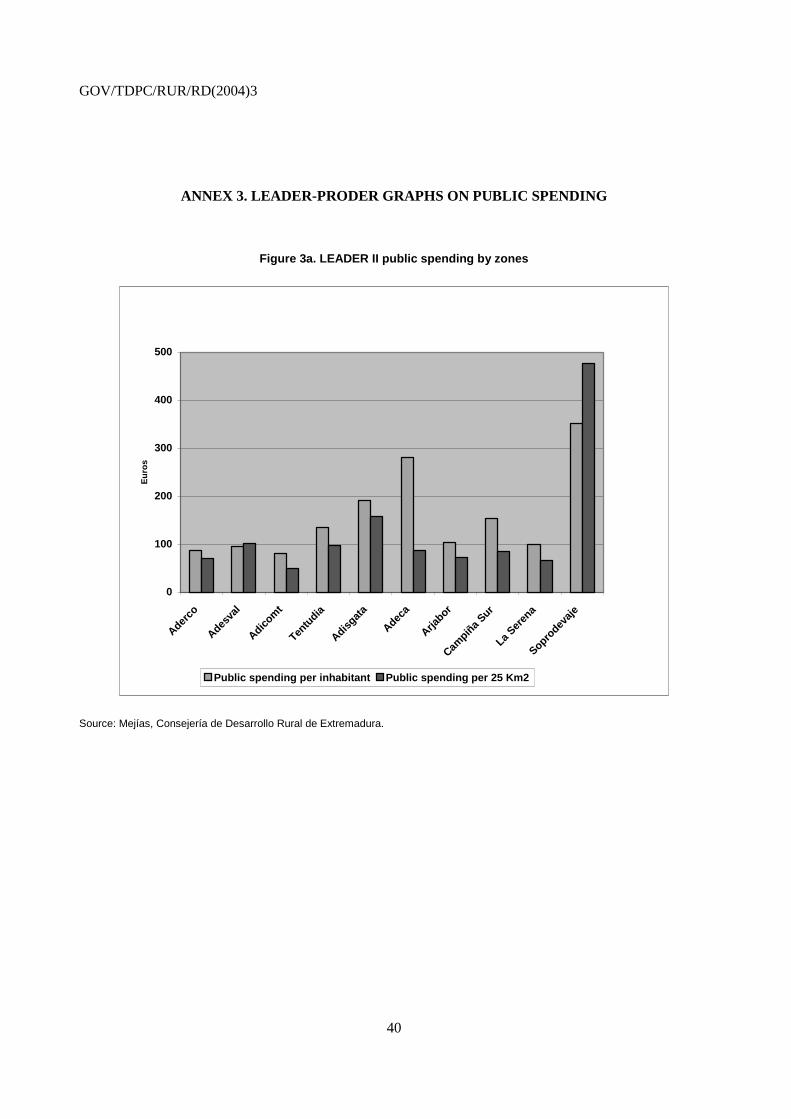
GOV/TDPC/RUR/RD(2004)3
40
ANNEX 3. LEADER-PRODER GRAPHS ON PUBLIC SPENDING
Figure 3a. LEADER II public spending by zones
0
100
200
300
400
500
Aderco
Adesva
l
Adicom
t
Tentu
dia
Adisgat
a
Adeca
Arjabor
Campiñ
a Sur
La Ser
ena
Soprodev
aje
Eu
ros
Public spending per inhabitant Public spending per 25 Km2
Source: Mejías, Consejería de Desarrollo Rural de Extremadura.
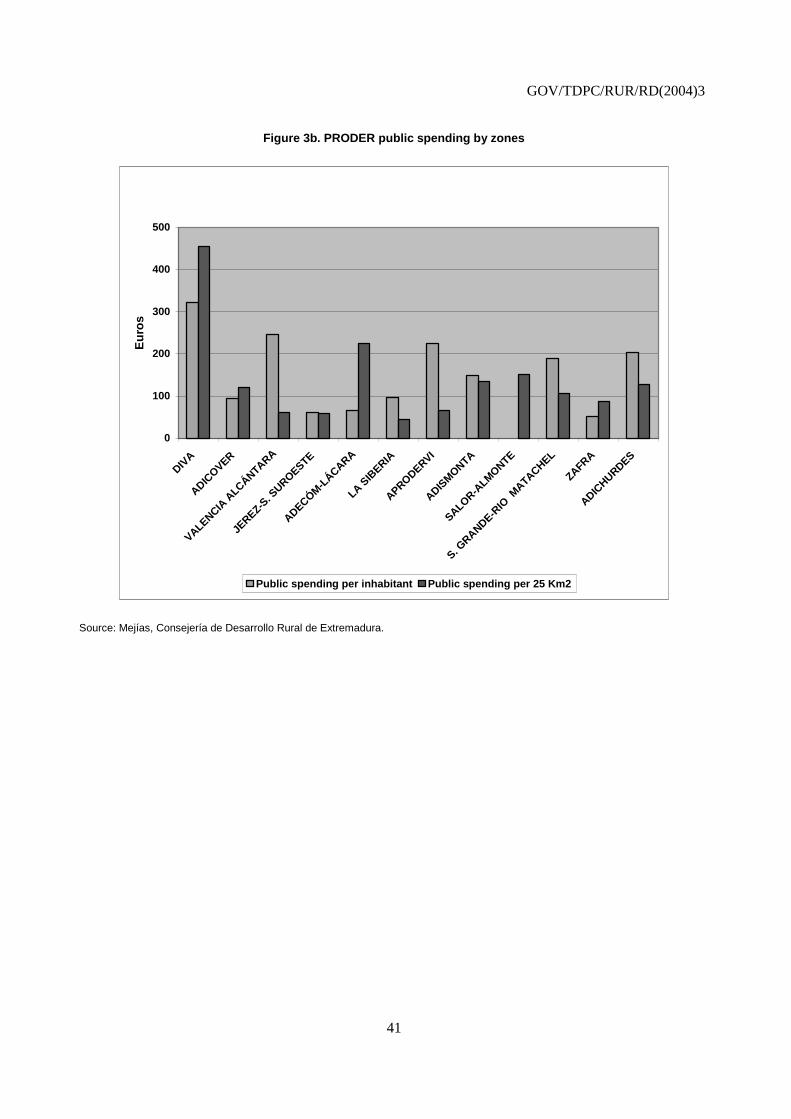
GOV/TDPC/RUR/RD(2004)3
41
Figure 3b. PRODER public spending by zones
0
100
200
300
400
500
DIVA
ADICOVER
VALENCIA A
LCÁNTARA
JEREZ-S
. SUROESTE
ADECÓM-L
ÁCARA
LA SIB
ERIA
APRODERVI
ADISM
ONTA
SALOR-ALMONTE
S. GRANDE-R
IO M
ATACHEL
ZAFRA
ADICHURDES
Eu
ros
Public spending per inhabitant Public spending per 25 Km2
Source: Mejías, Consejería de Desarrollo Rural de Extremadura.
GOV/TDPC/RUR/RD(2004)3
42
NOTES
1. The name is an acronym of the French expression “Liaison Entre Activités du Développement de
l’Economie Rural” (LEADER).
2. The Board of Directors has an important voice since its constituents are representatives of different economic, social and institutional groups, including city councils. The Management and Technical Team plays an important role through promoting, advising and applying the programmes.
3. The four specific measures targeted by the LEADER II programme were: 1) acquisition of capacities; 2) rural innovation; 3) transnational co-operation; and 4) evaluation and monitoring, (see Table 2a in Annex 2). The second one received the lion’s share of resources, concentrating over 90% of the average budget allocations.
4. Predominantly Rural (PR), Significantly Rural (SR) and Predominantly Urban (PU). OECD methodology..
5. The statement that Extremadura is a “predominantly rural” region is supported by the results of the methodology used to measure and analyse rurality in OECD countries and the European Union (OECD, 1994 and European Commission, 1997). The criterion used to differentiate rural communities from urban ones (for the basic unit) is population density, with a threshold value of 150 per km2. However, this methodology only takes large regions into consideration (provinces in the case of Spain), it does not consider delimitation of the rural areas inside specific regions and it does not allow us to distinguish between the diversification of rural areas in a specific region. Therefore, a complementary methodological approach is required. A new approach would allow us not only to define the territory but also to measure the different grades of rurality in the rural areas of a region (Extremadura here) and consequently facilitate the categorisation of each different rural area according to a “typology of rural areas” based on their level of economic development. The grades would be: Predominantly rural, Significantly rural, Predominantly semi-rural, Weakly semi-rural and Non-rural.
6. PRODER, is the Spanish acronym for the Operating Programme for the Development and Economic Diversification of Rural Zones. The programme was created for the Objective 1 regions of Spain and its objective is to support the application of the LEADER programme in these regions, applying its own method but utilizing similar measures and working to increase the number of included zones.
7. See the proposal of the new regulation for support of rural development by the European Agrarian Fund for Rural Development (EC, 2004).
8. Only the investors measures have been contemplated properly (B: Programme of rural innovation), the other ones hardly represented 3.5% of the total investment expense.
9. The data in this paragraph and Figure 3.4 are based on the results of a survey of a sample of Extremadura’s LAGs, whose zones represent 23% of the generated total employment, 19% of the created firms and 18% of the total number of projects accomplished by these programs.
10. In the Spanish case, the study mentions three particularly weak elements in the application of the LEADER method: the “innovation”, the “inter-territorial co-operation” and the “creation of networks” for rural development (ÖIR-M., 2004, pp. 37-38).
11. Agreements between the Ministry of Agriculture, the Council of Agriculture of Extremadura and each local action group (LAG) within the LEADER programme areas, as well as diverse dispositions of both administrations.
GOV/TDPC/RUR/RD(2004)3
43
BIBLIOGRAPHY
Aliseda, J. M. (2004),“Ordenación del territorio y comarcalización en Extremadura”, en Regidor J.G. (coord.), Análisis del Desarrollo Rural en Extremadura: Bases para una Estrategia, Junta de Extremadura, (en prensa).
Baigorri, A. (2003), “El subsidio agrario en el marco regional de Extremadura”, en Cansino J.M. (coord.), El Campo Andaluz y Extremeño: La Protección Social Agraria”, Consejo Económico y Social, Madrid.
Champetier, Yves (2003), LEADER, un example de management public local: l’initiative communautaire LEADER en faveur du développement des zones rurales de l’Union Européen. Paper prepared for the Inter-Americain Institute for Social Development.
European Commission (1994), Comunicación a los Estados Miembros (94/C 180/12) sobre LEADER II.
European Commission (1997), Rural Development, CAP 2000, Working document, D.G. VI, Brussels, July.
European Commission (2003), Ex-Post Evaluation of the Community Initiative LEADER II, by ÖIR-Managementdienste GmbH, Vienna, December.
European Commission (2004), Proposal for a Council Regulation on support for rural development by the European Agricultural Fund for Rural Development (EAFRD), Brussels, COM(2004) 490.
Gurría, J.L. (2004), "Extremadura, una región predominantemente rural", en Regidor J.G. (coord.), Análisis del Desarrollo Rural en Extremadura: Bases para una Estrategia, Junta de Extremadura, (en prensa).
Instituto Nacional de Estadística (2002), Censo agrario de España 1999, Madrid.
Instituto Klein, Universidad Autónoma de Madrid (2003), Anuario Económico de España, Servicio de Estudios de la CAIXA, Barcelona.
Mejías, F. (2004), “Aplicación e impacto de los programas comunitarios de desarrollo rural en Extremadura”, en Regidor J.G. (coord.), Análisis del Desarrollo Rural en Extremadura: Bases para una Estrategia, Junta de Extremadura, (en prensa).
Ministerio de Economía (2000), Plan de Desarrollo Regional 2000-2006, Regiones incluidas en el Objetivo nº1 de los Fondos Estructurales Europeos, Tomo II, Madrid.
OECD (1994), Creating rural indicators for shaping territorial policy, París.
OECD (2001), Territorial Reviews, Italy, Paris.
OECD (2003), The Future of Rural Policy: From Sectoral to Place-Based Policies, Paris.
GOV/TDPC/RUR/RD(2004)3
44
ÖIR-M. (2004), Methods for and Success of Mainstreaming LEADER Innovations and Approach into Rural Development Programmes, ÖIR-Managementdienste GmbH, Vienna, February.
Pezzini, Mario (2001),"Rural Policy Lessons from OECD Countries”, International Regional Science Review, 24(January), pp. 134-145.
Pimienta M. (2000), “Espacios Naturales Protegidos y otras cuestiones medioambientales”, in Enciclopedia Regional de Extremadura, Junta de Extremadura, Mérida.
Regidor, J.G. (2000), El Futuro del Medio Rural en España, Agricultura y desarrollo económico, Consejo Económico y Social, Madrid.
Regidor, J.G. (2003), “Territorial Agriculture and Rural Development: from Agricultural Support to Territorial Policies”, in The Future of Rural Policy, OECD, Paris.
Sancho, R. (2004), "El medio rural en Extremadura: una tipología de zonas", en Regidor J.G. (coord.), Análisis del Desarrollo Rural en Extremadura: Bases para una Estrategia, Junta de Extremadura, (en prensa).
Soto, P.A. (2004), "El programa LEADER: una revisión analítica”, en Regidor J.G. (coord.), Análisis del Desarrollo Rural en Extremadura: Bases para una Estrategia, Junta de Extremadura, (en prensa).