PLACE LABEL HERE - Department of Education Exam Paper... · Environmental Science – Part 1 Page 8...
99
Pages: 12 Questions: 4 © Copyright for part(s) of this examination may be held by individuals and/or organisations other than the Tasmanian Qualifications Authority. Tasmanian Certificate of Education ENVIRONMENTAL SCIENCE Senior Secondary Subject Code: EVS315109 External Assessment 2013 Part 1 Time: approximately 35 minutes On the basis of your performance in this examination, the examiners will provide a result on the following criterion taken from the course statement: Criterion 2 Develop, interpret and evaluate experiments. Section Total /35 PLACE LABEL HERE TASMANIAN QUALIFICATIONS AUTHORITY
Transcript of PLACE LABEL HERE - Department of Education Exam Paper... · Environmental Science – Part 1 Page 8...
Pages: 12 Questions: 4 ©Copyright for part(s) of this examination may be held by individuals and/or organisations other than the Tasmanian Qualifications Authority.
Tasmanian Certificate of Education
ENVIRONMENTAL SCIENCE
Senior Secondary
Subject Code: EVS315109
External Assessment
2013
Part 1
Time: approximately 35 minutes
On the basis of your performance in this examination, the examiners will provide a result on the following criterion taken from the course statement: Criterion 2 Develop, interpret and evaluate experiments.
Section Total /35
PLACE LABEL HERE
TA
SM
AN
IAN
QU
AL
IFIC
AT
ION
S A
UT
HO
RIT
Y

Environmental Science – Part 1
Page 2
BLANK PAGE

Environmental Science – Part 1
Page 3
CANDIDATE INSTRUCTIONS You MUST ensure that you have addressed the externally assessed criterion on this examination paper. Answer ALL questions. Answers must be written in the spaces provided on the examination paper. You should make sure you answer all parts within each question so that the criterion can be assessed. This examination is 3 hours in length. There are five booklets. It is recommended that you spend approximately 35 minutes in total answering the questions in this booklet. The 2013 External Examination Information Sheet for Environmental Science can be used throughout the examination. All written responses must be in English.

Environmental Science – Part 1
Page 4
Question 1 A student carried out an investigation of a marine rocky shore ecosystem over the summer holidays. After making some measurements, and by careful observation, the student devised a food web for the ecosystem. When the student returned the next summer, the student discovered that ecosystem had changed as shown in the diagrams below.
Food web for the rocky shore
Food web for the same rocky shore one year later
Question 1 continues opposite.
For Marker
Use Only
sea star
cyanobacteria
limpet chiton
green algae
periwinkle barnacle
crab
mussel anemone
plankton
seagull
predatory snail
cyanobacteria
limpet chiton
green algae
periwinkle barnacle
crab
mussel anemone
plankton
seagull

Environmental Science – Part 1
Page 5
Question 1 (continued) The student was certain that the change in the ecosystem was due to biotic factors rather than abiotic factors because the abiotic factors were very similar from one year to the next. (a) Write a hypothesis that explains the observed change in the food web. (3 marks) ............................................................................................................................................. ............................................................................................................................................. ............................................................................................................................................. ............................................................................................................................................. ............................................................................................................................................. ............................................................................................................................................. (b) Give two abiotic factors that the student would have to measure on the rocky shore and
an instrument with which each could be measured. (2 marks) ............................................................................................................................................. ............................................................................................................................................. ............................................................................................................................................. ............................................................................................................................................. (c) Describe the sampling method(s) by which the student was able to collect the data to
produce the food webs for this ecosystem. (3 marks) ............................................................................................................................................. ............................................................................................................................................. ............................................................................................................................................. ............................................................................................................................................. ............................................................................................................................................. ............................................................................................................................................. .............................................................................................................................................
Question 1 continues over the page.
For Marker
Use Only

Environmental Science – Part 1
Page 6
Question 1 (continued) (d) Describe an advantage of monitoring this ecosystem monthly throughout the whole
year rather than just once a year, during summer. (2 marks) ............................................................................................................................................. ............................................................................................................................................. ............................................................................................................................................. .............................................................................................................................................
/10
For Marker
Use Only

Environmental Science – Part 1
Page 7
Question 2 Anti-fouling agents are used on the hulls of ships to stop the growth and build-up of various organisms that, left unchecked, significantly slow down the ship and waste fuel. Most often these anti-fouling agents are paints that are applied to the ship when it is first built. A student wished to investigate the effectiveness of various brands of anti-fouling paints. The investigation would involve coating a number of metal plates with anti-fouling paint and hanging these in sea-water for a period of time. Identify three factors that must be taken into consideration when planning any experiment in order to ensure the overall reliability. Suggest how each of these factors can be incorporated into the design of such an experiment. (6 marks)
/6
Factor Suggestion
For Marker
Use Only

Environmental Science – Part 1
Page 8
Question 3 Many Australian plants need bushfires to propogate. Scientists believe that there are two factors that may be important in the germination of seeds after a bushfire; the intense temperatures of the fire and the smoke given off by the fire. A student wished to determine which of these two factors was involved in propagating a species of needlebush (Hakea sp.). The student collected 150 seeds from the same plant and assigned 50 seeds to a temperature experiment and 50 to a smoke experiment. The remaining 50 seeds were grown without any treatment. For the temperature experiment, the student heated batches of 10 seeds in an oven for 15 minutes. The batches were heated separately to temperatures of 100˚C, 200˚C, 300˚C, 400˚C or 500˚C. For the smoke experiment, the 50 seeds were placed in a hooded BBQ for 30 minutes with some eucalypt bark that was then ignited to make the smoke. (a) Explain why 50 of the seeds were given no treatment at all. (2 marks) ............................................................................................................................................. ............................................................................................................................................. ............................................................................................................................................. ............................................................................................................................................. (b) Why were all the seeds taken from the same plant? (1 mark) ............................................................................................................................................. .............................................................................................................................................
(c) Suggest one good aspect of experimental design in this student’s investigation that has
not been mentioned in part (a) or part (b). (1 mark) ............................................................................................................................................. .............................................................................................................................................
Question 3 continues over the page.
For Marker
Use Only
Hakea epiglottis showing flowers and seedpods

Environmental Science – Part 1
Page 9
Question 3 (continued) (d) Suggest one weakness of this investigation and outline a method by which this could be
improved. (3 marks) ............................................................................................................................................. ............................................................................................................................................. ............................................................................................................................................. ............................................................................................................................................. ............................................................................................................................................. ............................................................................................................................................. (e) Explain why the student would have drawn a different type of graph to represent the
results of the temperature experiment and the smoke experiment. (2 marks) ............................................................................................................................................. ............................................................................................................................................. ............................................................................................................................................. .............................................................................................................................................
/9
For Marker
Use Only

Environmental Science – Part 1
Page 10
Question 4 A student observed that the leguminous plant clover (Trifolium sp.) grew most prolifically in areas where the nutrients in the soil are depleted from continuous cropping. The student formulated the following hypothesis:
‘Decreased soil nitrogen levels result in a greater abundance of leguminous plants.’ (a) State: (i) the independent variable (1 mark) .................................................................................................................................... .................................................................................................................................... (ii) the dependent variable. (1 mark) .................................................................................................................................... .................................................................................................................................... (b) Outline how the student might manipulate the independent variable in a laboratory
experiment using clover. (2 marks) ............................................................................................................................................. ............................................................................................................................................. ............................................................................................................................................. ............................................................................................................................................. (c) How might the student measure the dependent variable in the clover experiment? (2 marks) ............................................................................................................................................. ............................................................................................................................................. ............................................................................................................................................. .............................................................................................................................................
Question 4 continues over the page.
For Marker
Use Only

Environmental Science – Part 1
Page 11
Question 4 (continued) (d) Describe a method of undertaking this investigation in the field. (3 marks) ............................................................................................................................................. ............................................................................................................................................. ............................................................................................................................................. ............................................................................................................................................. ............................................................................................................................................. ............................................................................................................................................. (e) State one limitation of any conclusion made from the student’s experiment with regard
to the stated hypothesis. (1 mark) ............................................................................................................................................. .............................................................................................................................................
/10
For Marker
Use Only

Environmental Science – Part 1
Page 12
This question paper and any materials associated with this examination (including answer booklets, cover sheets, rough note paper, or information sheets) remain the property of the Tasmanian Qualifications Authority.

Pages: 16 Questions: 5 ©Copyright for part(s) of this examination may be held by individuals and/or organisations other than the Tasmanian Qualifications Authority.
Tasmanian Certificate of Education
ENVIRONMENTAL SCIENCE
Senior Secondary
Subject Code: EVS315109
External Assessment
2013
Part 2
Time: approximately 35 minutes
On the basis of your performance in this examination, the examiners will provide a result on the following criterion taken from the course statement: Criterion 5 Demonstrate knowledge and understanding of ecological
processes.
Section Total /37
TA
SM
AN
IAN
QU
AL
IFIC
AT
ION
S A
UT
HO
RIT
Y
PLACE LABEL HERE

Environmental Science – Part 2
Page 2
BLANK PAGE
Environmental Science – Part 2
Page 3
CANDIDATE INSTRUCTIONS You MUST ensure that you have addressed the externally assessed criterion on this examination paper. Answer ALL questions. Answers must be written in the spaces provided on the examination paper. You should make sure you answer all parts within each question so that the criterion can be assessed. This examination is 3 hours in length. There are five booklets. It is recommended that you spend approximately 35 minutes in total answering the questions in this booklet. The 2013 External Examination Information Sheet for Environmental Science can be used throughout the examination. All written responses must be in English.

Environmental Science – Part 2
Page 4
Question 5 Compost is made from the decomposition of household vegetable scraps and garden green waste. This plant material breaks down, mostly due to the action of fungi and bacteria. All this then provides food for invertebrate animals in the compost heap. Earthworms ingest dirt particles and consume the fungi and bacteria as well as any small particles of plant material. Beetles also eat the dead plant material. Other organisms that eat fungi and bacteria are springtails and mites. Spiders and rove beetles eat the springtails and mites. Centipedes eat the spiders, rove beetles and springtails. (a) Draw a food web for this compost heap. (3 marks) (b) Explain the difference between a decomposer and a detritivore, using examples from
the above food web. (2 marks) ............................................................................................................................................. ............................................................................................................................................. ............................................................................................................................................. .............................................................................................................................................
Question 5 continues opposite.
For Marker
Use Only
Environmental Science – Part 2
Page 5
Question 5 (continued) (c) Name an important group of organisms that is not found living in the compost heap. (1 mark) ............................................................................................................................................. ............................................................................................................................................. (d) Give of an example of an organism that would be at the 4th trophic level in this food
web. (1 mark) ............................................................................................................................................. ............................................................................................................................................. (e) As part of an investigation, a student counted each type of invertebrate and estimated
the total mass of each type. The student noticed that an organism at the top of the food web was heavier than, but not as numerous as, the smaller organisms at lower trophic levels.
Explain why the total mass of organisms decreases from one trophic level to the next. (4 marks) ............................................................................................................................................. ............................................................................................................................................. ............................................................................................................................................. ............................................................................................................................................. ............................................................................................................................................. ............................................................................................................................................. ............................................................................................................................................. .............................................................................................................................................
For Marker
Use Only
/11

Environmental Science – Part 2
Page 6
Question 6 Wildlife biologists are concerned about the possible extinction of the Tasmanian Devil (Sarcophilus harrisii) because of the role the Tasmanian Devil plays in the Tasmanian forest ecosystem. (a) Sarcophilus means ‘death lover’. With reference to the role that the Tasmanian Devil
plays in the ecosystem, give a reason why this name was chosen. (1 mark) ............................................................................................................................................. ............................................................................................................................................. (b) The Tasmanian Devil is thought to be partly responsible for controlling the number of
introduced European Red Foxes (Vulpes vulpes) by killing and eating cubs in their dens as well as by eating food sources that could sustain adult foxes.
Complete the table below by giving the name of the ecological relationship of the
Tasmanian Devil to the Red Fox. (2 marks)
Behaviour of the Tasmanian Devil Relationship to the Fox
Eating cubs in their dens
Eating food sources of adult foxes
Question 6 continues opposite.
For Marker
Use Only

Environmental Science – Part 2
Page 7
Question 6 (continued) (c) European Red Foxes live throughout south-eastern Australia but not in tropical areas or
desert areas. It appears that the foxes’ range is determined by both abiotic and biotic factors.
Suggest one abiotic and one biotic factor that might limit the range of the Red Fox. (2 marks) abiotic factor: ...................................................................................................................... ............................................................................................................................................. biotic factor: ........................................................................................................................ ............................................................................................................................................. (d) Explain the difference between the terms habitat and ecosystem, with reference to
Tasmanian wet sclerophyll forest. (3 marks) ............................................................................................................................................. ............................................................................................................................................. ............................................................................................................................................. ............................................................................................................................................. ............................................................................................................................................. .............................................................................................................................................
For Marker
Use Only
/8

Environmental Science – Part 2
Page 8
For Marker
Use Only
Question 7 The following is a diagram of part of the Carbon Cycle. This diagram shows the formation of fossil fuels. Oil is formed from fossilized plankton in the oceans and coal from fossilized plants in swamps. (a) Name the processes represented by the letters A, B, C and D. (2 marks) A ......................................................................................................................................... B ......................................................................................................................................... C ......................................................................................................................................... D ......................................................................................................................................... (b) Coal and oil have been referred to as ‘fossilized sunshine’. Use your knowledge of the
Carbon Cycle to explain why this is an appropriate phrase. (3 marks) ............................................................................................................................................. ............................................................................................................................................. ............................................................................................................................................. ............................................................................................................................................. ............................................................................................................................................. .............................................................................................................................................
Question 7 continues opposite.
CO2
Swamp plants Phytoplankton
Zooplankton Consumers
Decomposers
Coal
Oil
D
B
C
A

Environmental Science – Part 2
Page 9
Question 7 (continued) (c) To what extent is the system shown a closed system? Explain. (3 marks) ............................................................................................................................................. ............................................................................................................................................. ............................................................................................................................................. ............................................................................................................................................. ............................................................................................................................................. .............................................................................................................................................
/8
For Marker
Use Only

Environmental Science – Part 2
Page 10
Question 8 The ‘Wheat Belt’ is an inland agricultural area of south-eastern Australia, where much of our food is grown. Here the native vegetation has been removed and replaced with crops. The rainfall in this region is often neither regular nor reliable, and seasons may vary between the extremes of drought and flood. In good years farmers may have to contend with mouse plagues. Mice can reproduce quickly and, with abundant food, can increase their numbers dramatically. (a) (i) On the axes below sketch a graph of the expected mouse population before,
during and after a plague. (2 marks) (ii) Give a term that describes the shape of your graph. (1 mark) .................................................................................................................................... ....................................................................................................................................
Question 8 continues opposite.
For Marker
Use Only

Environmental Science – Part 2
Page 11
Question 8 (continued) (b) Describe how the shape of your graph would vary if a biological control were to be
introduced into this ecosystem to control the mice. (2 marks) (You may illustrate your answer by drawing a second graph on the axes below.) ............................................................................................................................................. ............................................................................................................................................. ............................................................................................................................................. ............................................................................................................................................. (c) What type of feedback would be operating if a biological control were to be used in this
ecosystem? (1 mark) ............................................................................................................................................. .............................................................................................................................................
For Marker
Use Only
/6

Environmental Science – Part 2
Page 12
BLANK PAGE

Environmental Science – Part 2
Page 13
Question 9 The diagram below shows the energy flows for a simple food chain. (a) Use the diagram to explain the difference between Gross Primary Production (GPP)
and Net Primary Production (NPP). (2 marks) ............................................................................................................................................. ............................................................................................................................................. ............................................................................................................................................. ............................................................................................................................................. (b) Calculate the loss of energy in kJ indicated on the diagram by X. (1 mark) ............................................................................................................................................. ............................................................................................................................................. (c) Name the process that accounts for this energy loss. (1 mark) ............................................................................................................................................. .............................................................................................................................................
For Marker
Use Only
/4
Grass Cattle
Humans
15 245 kJ
1 247 kJ 169 kJ
X

Environmental Science – Part 2
Page 14
BLANK PAGE

Environmental Science – Part 2
Page 15
BLANK PAGE

Environmental Science – Part 2
Page 16
This question paper and any materials associated with this examination (including answer booklets, cover sheets, rough note paper, or information sheets) remain the property of the Tasmanian Qualifications Authority.
Pages: 12 Questions: 7 ©Copyright for part(s) of this examination may be held by individuals and/or organisations other than the Tasmanian Qualifications Authority.
Tasmanian Certificate of Education
ENVIRONMENTAL SCIENCE
Senior Secondary
Subject Code: EVS315109
External Assessment
2013
Part 3
Time: approximately 35 minutes
On the basis of your performance in this examination, the examiners will provide a result on the following criterion taken from the course statement: Criterion 6 Demonstrate knowledge and understanding of how humans depend
on, and impact on, the natural environment.
Section Total /36
PLACE LABEL HERE
TA
SM
AN
IAN
QU
AL
IFIC
AT
ION
S A
UT
HO
RIT
Y

Environmental Science – Part 3
Page 2
BLANK PAGE

Environmental Science – Part 3
Page 3
CANDIDATE INSTRUCTIONS You MUST ensure that you have addressed the externally assessed criterion on this examination paper. Answer ALL questions. Answers must be written in the spaces provided on the examination paper. You should make sure you answer all parts within each question so that the criterion can be assessed. This examination is 3 hours in length. There are five booklets. It is recommended that you spend approximately 35 minutes in total answering the questions in this booklet. The 2013 External Examination Information Sheet for Environmental Science can be used throughout the examination. All written responses must be in English.

Environmental Science – Part 3
Page 4
Question 10 (a) Giving examples, explain what is meant by the term ‘ecosystem services’. (2 marks) ............................................................................................................................................. ............................................................................................................................................. ............................................................................................................................................. ............................................................................................................................................. (b) Discuss the following quote in terms of ecological footprint. (3 marks)
‘One planet may not be enough!’
............................................................................................................................................. ............................................................................................................................................. ............................................................................................................................................. ............................................................................................................................................. ............................................................................................................................................. .............................................................................................................................................
For Marker
Use Only
/5
Environmental Science – Part 3
Page 5
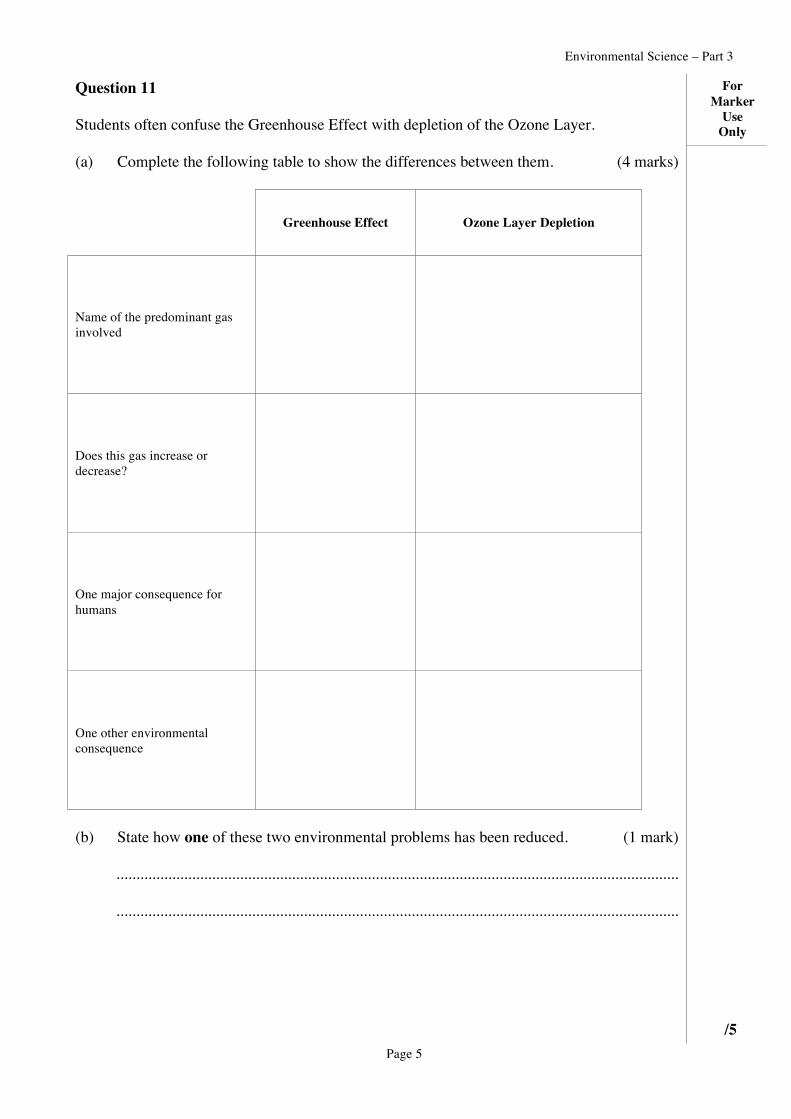
Question 11 Students often confuse the Greenhouse Effect with depletion of the Ozone Layer. (a) Complete the following table to show the differences between them. (4 marks)
Greenhouse Effect Ozone Layer Depletion
Name of the predominant gas involved
Does this gas increase or decrease?
One major consequence for humans
One other environmental consequence
(b) State how one of these two environmental problems has been reduced. (1 mark) ............................................................................................................................................. .............................................................................................................................................
/5
For Marker
Use Only

Environmental Science – Part 3
Page 6
Question 12 (a) Washing up liquid contains phosphate detergents. These detergents can be thought of as
‘algae food’. Outline a sequence of problems that might result when too much phosphorus as found
in detergents enters a riverine ecosystem. (4 marks) ............................................................................................................................................. ............................................................................................................................................. ............................................................................................................................................. ............................................................................................................................................. ............................................................................................................................................. ............................................................................................................................................. ............................................................................................................................................. .............................................................................................................................................
Question 12 continues opposite.
For Marker
Use Only

Environmental Science – Part 3
Page 7
Question 12 (continued) (b) The health of a stream can be measured using the Stream Pollution Index (SPI).
This index allocates a score to various organisms depending upon their sensitivity. The most sensitive organisms are given a higher score. These higher scoring organisms are larger and have external gills to gain sufficient oxygen. One example of this is the mayfly nymph, which is given an SPI of 8.
A mayfly nymph, showing the external gills on the abdomen In terms of Biological Oxygen Demand (BOD), explain why organisms such as the
mayfly nymph can be used to measure stream health. (3 marks) ............................................................................................................................................. ............................................................................................................................................. ............................................................................................................................................. ............................................................................................................................................. ............................................................................................................................................. .............................................................................................................................................
For Marker
Use Only
/7
gills
Environmental Science – Part 3
Page 8
Question 13 Tasmania has traditionally relied on hydro-electric generation for its energy needs. Recently this has been supplemented by electricity generated on wind farms. These forms of energy are considered ‘clean and green’. By using hydro-electricity Tasmania creates less pollution than other states, which rely on electricity generated from coal. (a) Are hydro-electricity and wind energy completely ‘clean and green’? Give reasons for
your answer. (2 marks) ............................................................................................................................................. ............................................................................................................................................. ............................................................................................................................................. ............................................................................................................................................. Tasmania is now part of a national energy grid. This means that some of the electricity that Tasmanians use comes from Victoria, where electricity is generated by burning brown coal. (b) Explain how burning coal, especially brown coal, is anything but ‘clean and green’. (3 marks) ............................................................................................................................................. ............................................................................................................................................. ............................................................................................................................................. ............................................................................................................................................. ............................................................................................................................................. .............................................................................................................................................
For Marker
Use Only
/5

Environmental Science – Part 3
Page 9
Question 14 (a) Explain why it is rare to encounter smog in Tasmania. Give two reasons. (2 marks) ............................................................................................................................................. ............................................................................................................................................. ............................................................................................................................................. ............................................................................................................................................. (b) Under what conditions can smog form in Tasmania? (1 mark) ............................................................................................................................................. .............................................................................................................................................
For Marker
Use Only
/3

Environmental Science – Part 3
Page 10
Question 15 Heavy industries that refine metals can be found in many major cities around the world. Often a by-product of such industries is run-off that contains traces of unwanted heavy metals such as lead, mercury and cadmium. When this polluted run-off enters rivers it poses health risks. Despite this risk many recreational fishermen still try to catch fish in these rivers. (a) Explain why it is considered unwise to eat fish that are caught in waters polluted with
heavy metals. (4 marks) ............................................................................................................................................. ............................................................................................................................................. ............................................................................................................................................. ............................................................................................................................................. ............................................................................................................................................. ............................................................................................................................................. ............................................................................................................................................. ............................................................................................................................................. In the past, rivers were considered a ‘common’ and, therefore, were subject to abuse. (b) Explain why the situation in a polluted river would be considered a ‘Tragedy of the
Commons’. (3 marks) ............................................................................................................................................. ............................................................................................................................................. ............................................................................................................................................. ............................................................................................................................................. ............................................................................................................................................. .............................................................................................................................................
For Marker
Use Only
/7

Environmental Science – Part 3
Page 11
Question 16 The Tasmanian forest industry has been in operation for well over 100 years. During this time the manner in which forests have been managed has changed. This has been due not just to increased mechanization but also to changing conditions in the market place. Over time, the practice of selective-logging, where only the biggest and best trees are harvested, has been replaced by clear-felling and the establishment of timber plantations. Explain the difference in the biodiversity that would result from the practices of selective logging versus the establishment of timber plantations. (4 marks) ....................................................................................................................................................... ....................................................................................................................................................... ....................................................................................................................................................... ....................................................................................................................................................... ....................................................................................................................................................... ....................................................................................................................................................... ....................................................................................................................................................... .......................................................................................................................................................
For Marker
Use Only
/4

Environmental Science – Part 3
Page 12
This question paper and any materials associated with this examination (including answer booklets, cover sheets, rough note paper, or information sheets) remain the property of the Tasmanian Qualifications Authority.
Pages: 12 Questions: 5 ©Copyright for part(s) of this examination may be held by individuals and/or organisations other than the Tasmanian Qualifications Authority.
Tasmanian Certificate of Education
ENVIRONMENTAL SCIENCE
Senior Secondary
Subject Code: EVS315109
External Assessment
2013
Part 4
Time: approximately 35 minutes
On the basis of your performance in this examination, the examiners will provide a result on the following criterion taken from the course statement: Criterion 7 Demonstrate knowledge and understanding of principles for the
ecologically sustainable management of the environment.
Section Total /33
PLACE LABEL HERE
TA
SM
AN
IAN
QU
AL
IFIC
AT
ION
S A
UT
HO
RIT
Y

Environmental Science – Part 4
Page 2
BLANK PAGE

Environmental Science – Part 4
Page 3
CANDIDATE INSTRUCTIONS You MUST ensure that you have addressed the externally assessed criterion on this examination paper. Answer ALL questions. Answers must be written in the spaces provided on the examination paper. You should make sure you answer all parts within each question so that the criterion can be assessed. This examination is 3 hours in length. There are five booklets. It is recommended that you spend approximately 35 minutes in total answering the questions in this booklet. The 2013 External Examination Information Sheet for Environmental Science can be used throughout the examination. All written responses must be in English.

Environmental Science – Part 4
Page 4
Question 17 The Tasmanian Government is keen to promote ‘nature-based tourism’ to help the state’s economy. Part of this strategy is to allow accommodation developments inside national parks. Traditionally national parks have been managed for conservation and natural recreation. Many people see accommodation development to be contrary to the reasons for establishing national parks. (a) In terms of sustainability, explain why the Tasmanian Government is promoting
nature-based tourism. (2 marks) ............................................................................................................................................. ............................................................................................................................................. ............................................................................................................................................. ............................................................................................................................................. The proposed hotel developments often cater for wealthy tourists who stay for a short time and pay a high price for services. This often means that such developments are not ecologically sustainable. (b) (i) Outline two reasons why these developments may not be ecologically sustainable. (2 marks) .................................................................................................................................... .................................................................................................................................... .................................................................................................................................... ....................................................................................................................................
Question 17 continues opposite.
For Marker
Use Only

Environmental Science – Part 4
Page 5
Question 17 (continued) (ii) Outline two reasons why these developments could be ecologically sustainable. (2 marks) .................................................................................................................................... .................................................................................................................................... .................................................................................................................................... ....................................................................................................................................
(c) (i) What is one important legislative requirement of the developer before such a
development can take place? (1 mark) .................................................................................................................................... .................................................................................................................................... (ii) What other studies would it be appropriate for developers to undertake before they
commence their projects? (2 marks) .................................................................................................................................... .................................................................................................................................... .................................................................................................................................... ....................................................................................................................................
/9
For Marker
Use Only

Environmental Science – Part 4
Page 6
Question 18 The Tarkine is a large area of land in Tasmania’s north-west. Conservationists claim that this area is the world’s largest area of intact temperate rainforest. Conservationists would like to see the area included on the Register of the National Estate and eventually given World Heritage status. The federal government has been unwilling to list this area because listing the Tarkine would prohibit mining activities. If the Tarkine were managed as a World Heritage Area (WHA), any development would require the preparation of a management plan. (a) What are some of the considerations that need to be included in any management plan
for the Tarkine? (3 marks) ............................................................................................................................................. ............................................................................................................................................. ............................................................................................................................................. ............................................................................................................................................. ............................................................................................................................................. ............................................................................................................................................. (b) Who would prepare an Environmental Impact Statement (EIS) if the Tarkine were to be
managed for mining? (1 mark) ............................................................................................................................................. ............................................................................................................................................. (c) What considerations must be included in the EIS for mining in the Tarkine? (3 marks) ............................................................................................................................................. ............................................................................................................................................. ............................................................................................................................................. ............................................................................................................................................. ............................................................................................................................................. .............................................................................................................................................
Question 18 continues opposite.
For Marker
Use Only

Environmental Science – Part 4
Page 7
Question 18 (continued) (d) A mining developer sees the Tarkine as economic capital whereas, if the Tarkine were
to be declared a World Heritage Area (WHA), it would remain as natural capital. Explain, with reference to the Tarkine, what is meant by the terms ‘economic capital’
and ‘natural capital’. (3 marks) ............................................................................................................................................. ............................................................................................................................................. ............................................................................................................................................. ............................................................................................................................................. ............................................................................................................................................. .............................................................................................................................................
For Marker
Use Only
/10

Environmental Science – Part 4
Page 8
Question 19 Environmental advocates often use slogans to get their particular point across to the general public. These slogans may appear on billboards, national park signs, notices, pamphlets, t-shirts or even bumper stickers. Often these slogans refer back to the various Principles of Sustainability. Complete the following table to assign a different relevant Principle of Sustainability to each slogan. The first one is given to you as an example. (4 marks)
Slogan Principle of Sustainability
‘Reduce, re-use, recycle’ Efficient use of resources
‘All there is now is all there will ever be’
‘You never know with GMO*’
‘Live simply so that others may simply live’
‘When you come back as a whale you’ll be … glad you put Greenpeace in your will’
*Genetically Modified Organisms
/4
For Marker
Use Only

Environmental Science – Part 4
Page 9
Question 20 When householders buy electrical appliances, the appliances come with an Energy Use Star Rating. A domestic dishwasher also comes with a Water Usage Rating. These ratings alert the purchaser to the reality of what might be called a ‘second price tag’. The first price tag is the purchase price, whereas the second is the cost of running the appliance. Explain how the pricing of utilities can increase sustainable use of these commodities. (4 marks) ....................................................................................................................................................... ....................................................................................................................................................... ....................................................................................................................................................... ....................................................................................................................................................... ....................................................................................................................................................... .......................................................................................................................................................
/4
For Marker
Use Only

Environmental Science – Part 4
Page 10
Question 21 It has become quite fashionable to buy take-away coffee which is usually served in disposable paper or polystyrene (styrofoam) cups. (a) In terms of sustainability, which type of cup would you choose — paper or
polystyrene? Give two reasons for your choice. (2 marks) ............................................................................................................................................. ............................................................................................................................................. ............................................................................................................................................. ............................................................................................................................................. Some companies use promotional, multiple-use, plastic or ceramic cups with the company logo on them. (b) In terms of sustainability, explain why this may be a better option than paper or
polystyrene cups. (2 marks) ............................................................................................................................................. ............................................................................................................................................. ............................................................................................................................................. ............................................................................................................................................. Disposal of the single-use paper or polystyrene cup is an ‘externality’. (c) Explain what is meant by an externality in this situation. (2 marks) ............................................................................................................................................. ............................................................................................................................................. ............................................................................................................................................. .............................................................................................................................................
For Marker
Use Only
/6

Environmental Science – Part 4
Page 11
BLANK PAGE

Environmental Science – Part 4
Page 12
This question paper and any materials associated with this examination (including answer booklets, cover sheets, rough note paper, or information sheets) remain the property of the Tasmanian Qualifications Authority.

Pages: 16 Questions: 6 ©Copyright for part(s) of this examination may be held by individuals and/or organisations other than the Tasmanian Qualifications Authority.
Tasmanian Certificate of Education
ENVIRONMENTAL SCIENCE
Senior Secondary
Subject Code: EVS315109
External Assessment
2013
Part 5
Time: approximately 35 minutes
On the basis of your performance in this examination, the examiners will provide a result on the following criterion taken from the course statement: Criterion 8 Analyse, interpret and draw conclusions.
Section Total /35
PLACE LABEL HERE
TA
SM
AN
IAN
QU
AL
IFIC
AT
ION
S A
UT
HO
RIT
Y

Environmental Science – Part 5
Page 2
BLANK PAGE

Environmental Science – Part 5
Page 3
CANDIDATE INSTRUCTIONS You MUST ensure that you have addressed the externally assessed criterion on this examination paper. Answer ALL questions. Answers must be written in the spaces provided on the examination paper. You should make sure you answer all parts within each question so that the criterion can be assessed. This examination is 3 hours in length. There are five booklets. It is recommended that you spend approximately 35 minutes in total answering the questions in this booklet. The 2013 External Examination Information Sheet for Environmental Science can be used throughout the examination. All written responses must be in English.
Environmental Science – Part 5
Page 4
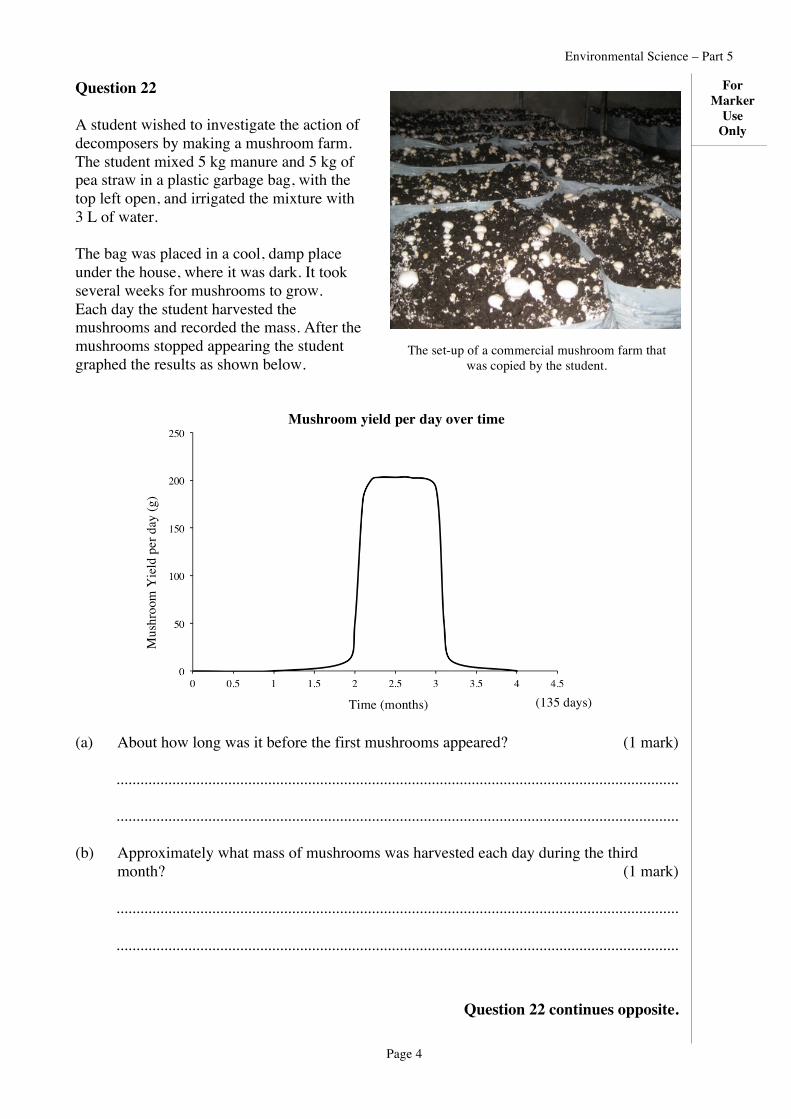
Question 22 A student wished to investigate the action of decomposers by making a mushroom farm. The student mixed 5 kg manure and 5 kg of pea straw in a plastic garbage bag, with the top left open, and irrigated the mixture with 3 L of water. The bag was placed in a cool, damp place under the house, where it was dark. It took several weeks for mushrooms to grow. Each day the student harvested the mushrooms and recorded the mass. After the mushrooms stopped appearing the student graphed the results as shown below.
(a) About how long was it before the first mushrooms appeared? (1 mark) ............................................................................................................................................. ............................................................................................................................................. (b) Approximately what mass of mushrooms was harvested each day during the third
month? (1 mark) ............................................................................................................................................. .............................................................................................................................................
Question 22 continues opposite.
For Marker
Use Only
The set-up of a commercial mushroom farm that was copied by the student.
Mushroom yield per day over time
Time (months) (135 days)
Mus
hroo
m Y
ield
per
day
(g)

Environmental Science – Part 5
Page 5
Question 22 (continued) (c) Approximately what was the total mass of mushrooms harvested in the third month? (1 mark)
............................................................................................................................................. ............................................................................................................................................. The student then set up similar mushroom farms with different ratios of manure and straw, with different amounts of water added as set out in the following table: (d) What were the optimal conditions for growing mushrooms? (1 mark) ............................................................................................................................................. ............................................................................................................................................. (e) Describe the effect of varying the volume of water. (2 marks) ............................................................................................................................................. ............................................................................................................................................. ............................................................................................................................................. .............................................................................................................................................
For Marker
Use Only
/6
Total Mass of Mushrooms Harvested (kg)
Water added
(L)
Percentage Manure /Percentage Straw, by mass
30/70 40/60 50/50 60/40 70/30 80/20
0.0 0.3 0.2 0.1 0.1 0.0 0.0
1.0 2.9 3.7 3.5 3.3 2.8 2.2
2.0 3.4 4.6 4.2 3.9 3.6 2.9
3.0 5.2 8.2 5.8 4.8 3.7
4.0 1.8 2.0 2.1 2.4 2.5 2.6

Environmental Science – Part 5
Page 6
Question 23 The Native Pepper (Tasmannia lanceolata) is a plant that grows at a wide range of altitudes in Tasmania. On exposed mountain tops it is a small compact shrub with short leaves but at lower altitudes it is a larger spindly plant with long broad leaves. A student collected data on an excursion up Mt Wellington and produced the following graph.
Heights of Tasmannia lanceolata on Mt Wellington (1270 m) (a) Draw a trendline on the graph above. (1 mark) (b) Explain why the student’s data should be drawn as a line graph. (1 mark) ............................................................................................................................................. ............................................................................................................................................. (c) Predict the typical height of a Native Pepper plant at 900 m altitude. (1 mark) ............................................................................................................................................. ............................................................................................................................................. (d) Predict the typical plant height for a Native Pepper plant at an altitude of 1400 m on
Mt Jerusalem. (1 mark) ............................................................................................................................................. .............................................................................................................................................
Question 23 continues opposite.
For Marker
Use Only
0
0.5
1
1.5
2
2.5
3
3.5
4
0 200 400 600 800 1000 1200 1400
Altitude (m above sea level)
Plan
t hei
ght (
m)
Point A

Environmental Science – Part 5
Page 7
Question 23 (continued) (e) Suggest one improvement that could be made in the way in which this data was
presented. (1 mark) ............................................................................................................................................. ............................................................................................................................................. (f) Point A does not seem to fit into the data set. (i) What do we call such a point? (1 mark) .................................................................................................................................... .................................................................................................................................... (ii) In analyzing the data, how should Point A be treated? Give a reason. (1 mark) .................................................................................................................................... ....................................................................................................................................
For Marker
Use Only
/7

Environmental Science – Part 5
Page 8
Question 24 A scientist wished to examine which of two abiotic factors had greater affect on a population of small flying insects. The scientist used a series of insect traps over a one-hectare block and calculated the insect population for each month over two years. During this time the scientist also recorded the rainfall and the mean monthly temperature to produce the following graph. (a) Using the graph, state which abiotic factor has the greater influence on the insect
population. (1 mark) ............................................................................................................................................. ............................................................................................................................................. (b) Give a reason for your answer to part (a) based on the information in the graph. (1 mark) ............................................................................................................................................. ............................................................................................................................................. (c) Give a scientific explanation for why this factor might be more significant. (2 marks) ............................................................................................................................................. ............................................................................................................................................. ............................................................................................................................................. .............................................................................................................................................
Question 24 continues opposite.
For Marker
Use Only
0
10
20
30
40
50
60
70
80
Insect Population, Rainfall and Temperature, by month
Insect Numbers (x100)
Mean Temperature (°C)
Rainfall (mm)

Environmental Science – Part 5
Page 9
Question 24 (continued) (d) Give one factor other than rainfall and temperature that might also influence insect
numbers in this habitat. (1 mark) ............................................................................................................................................. .............................................................................................................................................
For Marker
Use Only
/5

Environmental Science – Part 5
Page 10
BLANK PAGE

Environmental Science – Part 5
Page 11
Question 25 The following graph shows current and predicted energy use for a number of different types of energy. Current and Projected Energy Use (a) Currently, which is the second biggest source of energy? (1 mark) ............................................................................................................................................. ............................................................................................................................................. (b) Which source of energy is predicted to have the greatest percentage growth in the next
30 years? (1 mark) ............................................................................................................................................. ............................................................................................................................................. (c) Account for the predicted decline in the use of coal in the future. (1 mark) ............................................................................................................................................. ............................................................................................................................................. (d) Account for the relatively slight predicted increase in the use of oil in the future. (2 marks) ............................................................................................................................................. ............................................................................................................................................. ............................................................................................................................................. .............................................................................................................................................
For Marker
Use Only
/5
0
50
100
150
200
250
2010
2040
Type of Energy
Ener
gy U
se (Q
uadr
illio
n BT
U)

Environmental Science – Part 5
Page 12
Question 26 The following data were collected for a study on urban transport.
Mass of Greenhouse gases emitted per person, for different forms of transport
(a) (i) Which form of transport yields the lowest mass of Greenhouse gases per person? (1 mark) .................................................................................................................................... .................................................................................................................................... (ii) State the mass produced per person for the type of transport suggested in your
answer to (a) (i) above. (1 mark) .................................................................................................................................... .................................................................................................................................... (b) Explain why the Greenhouse gas emission values are less when there are more people
in the car. (1 mark) ............................................................................................................................................. .............................................................................................................................................
Question 26 continues opposite.
For Marker
Use Only
0 0.1 0.2 0.3 0.4
46 seater bus when full
3 L car, driver only
3 L car, 4 occupants
1.6 L car, driver only
1.6 L car, 4 occupants
mass of greenhouse gas (kg) per kilometre travelled
Form
of t
rans
port
Environmental Science – Part 5
Page 13
Question 26 (continued) (c) Consider the ratio of Greenhouse emissions for a car with 4 people compared to a car
with a driver only. Is this ratio the same for a 3 Litre car as for a 1.6 Litre car? Show your calculations. (2 marks)
............................................................................................................................................. ............................................................................................................................................. ............................................................................................................................................. ............................................................................................................................................. (d) Use this data to support the case that people should either car pool or use public
transport. (2 marks) ............................................................................................................................................. ............................................................................................................................................. ............................................................................................................................................. .............................................................................................................................................
For Marker
Use Only
/7

Environmental Science – Part 5
Page 14
Question 27 The following diagrams show three Tasmanian ecosystems; one that has never been known to experience fire, another that was last burnt 90 years ago and a third that was last burnt 180 years ago. These diagrams were constructed from height data collected in the field recently by following a 50 m straight line through part of each ecosystem and recording the tree species within 5 m of that line. Diagram A – Never been burnt Diagram B – Regeneration after fire in the 1920s Diagram C – Regenerated after fire in the 1840s
Question 27 continues opposite.
For Marker
Use Only
Myrtle Trees
Man Ferns
Sassafras Trees
Eucalypt Trees
Celery Top Pines
Tree
Hei
ght (
m)
Tree
Hei
ght (
m)
Tree
Hei
ght (
m)
40
80
40
Man Ferns
Celery Top Pines Sassafras Trees
Myrtle Trees
Eucalypt Trees
Myrtle Trees

Environmental Science – Part 5
Page 15
Question 27 (continued) (a) What do we call these type of diagrams or the method of sampling used to produce
them? (1 mark) ............................................................................................................................................. ............................................................................................................................................. (b) State an approximate average height of the myrtle trees in each ecosystem. (1 mark) Diagram A .......................................................................................................................... Diagram B .......................................................................................................................... Diagram C .......................................................................................................................... (c) State an important difference, besides the height of the trees, between an ecosystem
that has been burnt and an ecosystem that has never been burnt. Give a reason for your answer. (2 marks)
............................................................................................................................................. ............................................................................................................................................. ............................................................................................................................................. ............................................................................................................................................. (d) Predict a height for the Celery Top Pines if the ecosystem shown in Diagram B were to
be left undisturbed for another 90 years. (1 mark) ............................................................................................................................................. .............................................................................................................................................
For Marker
Use Only
/5

Environmental Science – Part 5
Page 16
This question paper and any materials associated with this examination (including answer booklets, cover sheets, rough note paper, or information sheets) remain the property of the Tasmanian Qualifications Authority.

Environmental Science
Subject Code: EVS315109
2013 External Examination Information Sheet
Page 1 of 31
SOME COMMON TERMS EXPLAINED: Account explain Analyse examine data mathematically to gain understanding of the data Calculate to find the answer using mathematics Compare give an account of similarities and difference between two factors Construct represent information in a graphical form Deduce reach a conclusion from the information given Describe give a detailed account including all relevant information Design produce a plan Discuss give an account including a range of arguments, assessment of the importance of
various factors or a comparison of alternatives Distinguish give the difference between two or more different items Draw represent by means of pencil lines – include labels (unless told not to) - not to be
confused with Draw a Conclusion Estimate find an approximate value Evaluate assess the limitations and implications Explain give a clear account including causes and reasons List give a sequence of names or brief answers Identify find an answer for a quantity Measure Use a measuring instrument to find a value for a quantity. Always include the units of
the number (value) Outline give a brief account or summary Predict give an expected result

Page 2 of 31
“Cause”
CRITERION 2 – Develop, interpret and evaluate experiments
Formulating a Hypothesis Your hypothesis should 1. be feasible (i.e. be sensible and based on scientific
concepts) 2. be a statement (not a question) 3. be based on observations 4. involve one independent and one dependent
variable in a cause-‐and-‐effect relationship 5. be testable and measurable in a way that
demonstrates cause and effect Experimental Design State the hypothesis to be tested (unless already stated) 1. State the independent variable and how it is
manipulated 2. State the dependent variable and how it is
measured 3. Describe the procedure clearly in a step-‐by-‐step
fashion which could be easily followed in a laboratory or the field. Indicate sample sizes, quantities of materials
and time involved Indicate how many replicas there are (if needed).
Describe which variables are controlled and how. Say why fixed variables are needed. Include factors relevant for the organism – biotic, and those abiotic relevant in the environment
What is the control group in the experiment and why is it needed.
4. How are the results analysed 5. Indicate any repetitions of the experiment
If required: 6. State what results would support the hypothesis
and what results would not support the hypothesis 7. Discuss any foreseeable problems in conducting the
experiment. variables difficult to control, sample size issues,
ethical issues, animal vs human experimentation/environmental impacts etc.
INDEPENDENT VARIABLE (IV)
the thing that the experimenter deliberately varies
DEPENDENT VARIABLE (DV)
the thing that the experimenter measures
Unfixed / uncontrolled variables The impact of unfixed/uncontrolled variables can be reduced by
• using a large sample size, but this will depend on whether the organism is a plant or animal etc
• randomly assigning organisms to treatment groups or
• matching groups for similar factors Also ethical aspects need to be considered: Trial experiments conducted a in a confined situation (laboratory/greenhouse) need to precede field investigations. If the results of these are positive, small scale field investigations are then carried out. Unlike laboratories and greenhouses, experiments carried out in the field/environment contain many unfixed/uncontrolled variables. In such cases the experimenter may record relevant information that may explain observed differences in treatment results. While this provides greater certainty/reliability, greater caution is needed in interpreting results. Distinction between a replica and a repeat
• A replica is multiple identical groups within the one experiment.
• A repeat is doing the experiment again in a future time.
Sampling techniques
• Transects • Quadrats • Surveys
“Effect”

Page 3 of 31
Testing abiotic factors Temperature: how hot or cold a substance is. The temperature of a water body directly affects many physical, biological and chemical characteristics. Temperature directly affects the metabolic rate of plants and animals. Aquatic species have evolved to live in water of specific temperatures. What factors affect temperature? Water temperature varies in response to:
• air temperature • exposure to sunlight and amount of shade • turbidity of the water, which is often a result of
erosion in the catchment • groundwater inflows to the waterbody • discharge of warmed water from industry and
power plants, or cold water from dams • vegetation • type, depth and flow of waterbody
Turbidity: opacity or muddiness caused by particles of extraneous matter; not clear or transparent. Suspended material can be particles of clay, silt, sand, algae, plankton, micro-‐organisms and other substances. Turbidity affects how far light can penetrate into the water. It is not related to water colour: tannin-‐rich waters that flow through peaty areas are highly coloured but are usually clear, with very low turbidity. What factors affect turbidity? Turbidity is affected by:
• rainfall and catchment runoff • catchment soil erosion • bed and bank erosion • bed disturbance, e.g. by introduced fish species
such as carp • waste discharge • storm water • excessive algal growth • riparian vegetation • floodplain and wetland retention and
deposition • flow • waterway type • soil types • salinity.
Electrical conductivity: the property of a substance which enables it to conduct (carry) electricity. Salty water conducts electricity more readily than purer water. Therefore, electrical conductivity is routinely used to measure salinity. The types of salts (ions) causing the salinity usually are chlorides, sulphates, carbonates, sodium, magnesium, calcium and potassium. What factors affect electrical conductivity? Electrical conductivity in waterways is affected by:
• geology and soils • land use, such as agriculture (irrigation), urban
development (removal of vegetation, sewage and effluent discharges), industrial development (industrial discharges)
• flow (electrical conductivity is generally lowest during high flows and increases as flows decrease, with extreme levels occurring during droughts)
• run-‐off • groundwater inflows • temperature • evaporation and dilution.
pH: a measure of acidity (or alkalinity). What factors affect pH? A wide variety of factors may have an effect on the pH of water. These include:
• source of the water • rainfall • time of day • water temperature • amount of algal or plant growth in the water • geology and soils, e.g. acid sulfate soils • discharges of industrial wastes • disturbance of acid sulfate soils due to
agriculture, urban development or mining • atmospheric deposition (acid rain, dry particle
deposition) • burning of fossil fuels by cars, factories and
smelters • photosynthesis and respiration • salinity
Dissolved oxygen: a measure of the quantity of oxygen present in water. Oxygen is essential for almost all forms of life. What factors affect dissolved oxygen?
• water temperature • photosynthesis by aquatic plants • respiration by aquatic plants and animals • breakdown of organic materials in the water • water movement and mixing • flow (discharge) • salinity • altitude • depth • daily and seasonal cycles • presence of nutrients • chemicals in the water • thermal contamination • removal of vegetation
Phosphorus a mineral nutrient that is essential for all forms of life. The phosphorus found in a form called phosphate (chemical formula, PO4
3-‐). It is naturally derived from the weathering of rocks and the decomposition of organic material, but it can also enter waterbodies in runoff or discharges -‐ soil and fertiliser particles can carry phosphorus, and sewage is also rich in phosphorus.

Page 4 of 31
Phosphates available to plants and animals are called orthophosphates, and exist in waterbodies as dissolved and particulate (suspended) and colloidal forms. What factors affect phosphate? Phosphate concentrations in water are affected by:
• rock type and geology • soil type • seasonal conditions • animal and human wastes • phosphate-‐containing fertilisers • disturbed land • urban run-‐off, which usually contains it
Nitrogen an element that is essential for all forms of life The most common nitrogen compounds are ammonia (NH3), nitrate (NO3
-‐) and nitrite (NO2-‐). They occur in
dissolved, particulate and gaseous forms. Present in freshwaters at higher concentrations than phosphate. Although both nutrients are required for plant growth, phosphate is considered to be the limiting factor in freshwater. In saltwater ecosystems, however, nitrogen is much less abundant, and it becomes the nutrient that limits algal growth. What factors affect nitrogen? Nitrogen is actually measured by the concentration of nitrate (NO3
-‐). The main factors affecting nitrates are: • rock type and geology • soil types • vegetation • seasonal conditions • animal and human wastes (sewage) • decomposing plants and animals • nitrogen-‐containing fertilisers • industrial discharges • run-‐off
Abiotic factors affecting the environment Consists of non-‐living component of the environment as shown below. All these need to be considered in the adaptation of organisms

Page 5 of 31
CRITERION 5 – Ecological processes
Ecology The study of living organisms in the
natural environment. How they interact with one another and how the interact with their nonliving environment.
Ecosystem Community + Abiotic environment, interacting
Community All the populations of the different species living and interacting in the same ecosystem.
Species A group of organisms that can breed to produce fully fertile offspring.
Populations A group of organism of the same species which live in the same habitat at the same time where they can freely interbreed.
Biodiversity The total number of different species in an ecosystem and their relative abundance.
Habitat The characteristics of the type environment where an organism normally lives. (e.g. a stony stream, a temperate woodland)
Niche Habitat + role + tolerance limits to all limiting factors
Generalist and specialist species
Limiting factor Too much or too little of any abiotic factor can limit or prevent growth of a population, even if all other factors are at or near the optimal range of tolerance. Biotic factors Consists of living and once living biological components – plants, animals and microbes. Also include dead organisms, dead parts of organisms, and the waste products of organisms ZONE OF TOLERANCE Each population in an ecosystem has a range of tolerance to variations in its physical and chemical environment. Individuals within a population may also have slightly different tolerance ranges for a factor due to genetic variation, health and age.
Low Gradient of required factor High

Page 6 of 31
Systems A system is defined as “an assemblage of parts and their forming a functioning whole” A system can be living or nonliving. Components of systems Storages – or stores of matter and energy Flows – into, through and out of the system Inputs – matter or energy entering system Outputs – matter or energy entering s system Processes – which transfer or transform energy or
matter from storage to storage A comparison between natural, agricultural and urban systems
Ecosystem input output Level of recycling
Natural Light** Organic matter* Water* Mineral salts*
Heat* Organic matter* Water*
Much*
Agricultural Light** Organic matter* Water** Mineral salts** Fertilisers* Pesticides*
Heat* Organic matter** Water** Soil particles** Nutrients**
some
Urban Light* Organic matter** Water** Mineral salts* Fuel*** Industrial raw materials***
Heat*** Water*** Industrial and household wastes*** CO2**
little
The asterisks represent proportions of matter: *least, **intermediate, *** most Types of systems Open system – exchanges matter and energy with its
surroundings. Eg all ecosystems are open Closed system – exchanges energy but no matter with
its environment. Very rare in nature. Earth can be thought of as “almost closed”
Example of a system -‐ soil
FEEDBACK SYSTEMS Any process that increases or decreases a change to a system Positive feedback Feedback loop that causes a system to change further in the same direction Negative feedback Feedback loop that causes a system to change in the opposite direction from which it is moving. Eg population regulation around the carrying capacity

Page 7 of 31
10,000
100
10
Energy and organisms Autotrophs / Producers
Organisms which can synthesise their own complex, energy rich, organic molecules from simple inorganic molecules (e.g. green plants synthesis sugars from CO2 and H2O)
Heterotrophs / Consumers
Organisms who must obtain complex, energy rich, organic compounds form the bodies of other organisms (dead or alive).
Detritivores Heterotrophic organisms who ingest dead organic matter. (e.g. earthworms, woodlice, millipedes) but do not decompose it into inorganic matter
Decomposers Heterotrophic organisms who secrete digestive enzymes onto dead organism matter and absorb the digested material. (e.g. fungi, bacteria) completely breakdown the organic molecules into inorganic molecules → make matter available to producers -‐ i.e. responsible for the recycling of matter in the ecosystem
Food webs (i) First Order (Primary) Consumers – feed off
producers (herbivores) (ii) Second Order (Secondary) Consumers – eat first
order consumers (carnivores) (iii) Third Order (Tertiary) Consumers – eat second
order consumers (iv) Top Consumer/Carnivore – not usually eaten by
other organisms (e.g. man, shark, bald eagle, crocodile, lion)
Trophic level 4 – carnivore (tertiary consumer) Trophic level 3 – carnivore (secondary consumers) Trophic level 2 – herbivore (primary consumers) Trophic level 1 – producer ECOLOGICAL PYRAMIDS As you go up a food chain, the number of individuals at each level (usually) decreases. Due to energy losses at each level, each individual needs to consume a large number of the individuals below. Pyramid of numbers shows the number of organisms in a food chain. Such pyramids can be almost any shape depending on the biomass of the organisms at any trophic level
Pyramid of Biomass use total weight (dry mass) of organisms at each level -‐ takes into account both numbers and mass)
Both pyramids of numbers and biomass can be inverted Pyramid of Energy -‐ total energy at each level Each level must be no more than 10% of previous Interactions among organisms in ecosystems
Type of interaction Species A Species B
Predator Prey + -‐ Herbivory + -‐ Mutualism + + Commensalism + 0 Competition -‐ -‐ Parasitism + -‐ Key
+ benefits , -‐ harmed (may not mean death) 0 not affected
P
1C
algae zooplankton
P
1C

Page 8 of 31
ENERGY FLOW First law of thermodynamics Energy is neither created nor destroyed. Energy is transformed from one form to another through the food chain.
Second law of thermodynamics Energy conversions are never 100% efficient ie energy is lost as energy is passed from one trophic level to the next. is a one-‐way flow
Source of energy sun → light energy Photosynthesis Complex process that takes place in cells of green plants. Carbon dioxide + water Glucose +oxygen Respiration Aerobic respiration – produces a lot of energy in cells by using oxygen Glucose +oxygen Carbon dioxide + water Anaerobic respiration –produces very little energy due to lack of oxygen. Used by some decomposers BIOGEOCHEMICAL CYCLES
• cannot create/destroy atoms → there is a finite (fixed) amount of matter in our biosphere. (assume that earth is a closed system – with no losses/gains of matter)
• recycling of matter by decomposers • nutrient matter cycles
Carbon cycle
Nitrogen cycle
Phosphorous cycle
SUN
PRODUCERS
1ST ORDER CONSUMERS
2ND ORDER CONSUMERS
DETRITIVORES AND DECOMPSERS
97% reflected
Energy lost as heat and respiration
Energy lost as heat and respiration
10%
10%

Page 9 of 31
POPULATION measured as a rate – e.g. no. per 100,000 r = ( b -‐ d ) + ( i -‐ e ) ↓ ↓ ↓ ↓ ↓ growth birth death immigration emigration rate rate rate rate rate In Ideal conditions – J curve
• a “doubling” of numbers in a set time period
e.g. bacteria, human world population. • not sustainable in the long term -‐ population either
“crashes” OR external factors regulate the growth rate
In reality – S curve
Carrying capacity -‐ maximum no. of individuals which can be supported by the environment Environmental resistance Abiotic & biotic factors acting to limit population growth. If a population overshoots its carrying capacity, negative feedback occurs (in the form of more deaths and fewer births due to lack of food) to reduce the population.
FACTORS WHICH AFFECT CARRYING CAPACITY / POPULATION SIZE ABIOTIC FACTORS – DENSITY INDEPENDENT e.g. temperature, humidity, rainfall, light intensity, sunlight hours, size of area, presence of trace elements, soil type may have a direct effect on the population – e.g. sunlight hours effects amount of P/S and ∴plant growth OR an indirect effect – e.g. sunlight hours → P/S → plant growth → kangaroo population BIOTIC FACTORS –DENSITY DEPENDENT The impact of other organisms can be identified in two types of competition: • INTRASPECIFIC COMPETITION – competition
between members of the same species
• INTERSPECIFIC INTERACTIONS – competition between members of different species
NATURAL SELECTION AND SPECIATION A species is a population of organisms that can potentially interbreed under natural conditions to provide fertile offspring. Hybrids are offspring produced from parents of different species. They are sterile (can’t reproduce). Examples include zebroids (zebra and horse), mules (donkey and horse) When a habitat selects certain organisms to live and reproduce and others to die that population is said to be undergoing natural selection. Natural Selection-‐ beneficial characteristics that can be inherited are passed down to the next generation, and unfavourable characteristics that can be inherited become less common in the population.
- Acts upon a whole population – the gene pool -‐ not on an individual during its lifetime.

Page 10 of 31
The relationship in community structures in Tasmania vegetation as a result of the interaction of soil fertility and fire
TASMANIAN FORESTS Interactions determining vegetation type
Three major types of forest groups in Tasmania Dry Sclerophyll
- open canopy - little understorey - many grasses - short sharp prickles
Wet Sclerophyll
- open canopy - dense understorey - fewer mosses and ferns
Forest structures in the southwest since last fire
Rainforest
- closed canopy - thin understorey - many mosses, lichens, ferns

Page 11 of 31
CLIMATE
El Niño and La Niña The seasonal changes in the heating and cooling of sea surface temperatures tend to follow a fairly predictable pattern • El Niño refers to the extensive warming of the central
and eastern Pacific that leads to a major shift in weather patterns across the Pacific. In Australia (particularly eastern Australia), El Niño events are associated with an increased probability of drier conditions.
• La Niña refers to the extensive cooling of the central
and eastern Pacific Ocean. In Australia (particularly eastern Australia), La Niña events are associated with increased probability of wetter conditions.
The effects of El Niño and La Niña are at their greatest between December and April. A La Niña event often, but not always, follows a period of El Niño, and vice versa
The climate of any region is largely determined by four geographic aspects: Latitude, distance from the sea, direction of the prevailing winds and elevation.

Page 12 of 31
TRAGEDY OF THE COMMONS Depletion or degradation of a potentially renewable resource to which people have free and unmanaged access. Eg oceans, atmosphere, fisheries in international oceans. ECOSYSTEM SERVICES The role of ecosystems in providing humans with services from the ecosystems:
ECOLOGICAL FOOTPRINTS Ecological footprint -‐ the amount of productive land appropriated on average by each person (in the world, a country, etc) for food, water, transport, housing, waste management, and other purposes Global hectare -‐ (acre) is one hectare (2.47 acres) of biologically productive space with an annual productivity equal to the world average. BIODIVERSITY Types of biodiversity 1. genetic: the variety of genetic information
contained in all of the individual plants, animals and microorganisms that inhabit the earth -‐ genetic diversity occurs within and between the populations of organisms that comprise individual species as well as among species
2. species: the variety of species on earth 3. ecosystem: the variety of habitats, biotic
communities and ecological processes.
These three levels of diversity are interrelated and interdependent (e.g. a population of a species is thoroughly dependent on its habitat for survival, and a functioning ecosystem is dependent on the complex of species that comprises it). Processes that threaten biodiversity
- loss of habitat, fragmentation, degradation - introduced species - overexploitation of plant and animal species - pollution of soil, water and atmosphere - global climate change
Conservation categories
• Extinct – no individuals alive • Extinct in the wild – no individuals alive in the wild, but may occur in captivity of some description
• Critically endangered – extremely high risk of extinction in the immediate future
• Endangered -‐ extremely high risk of extinction in the near future
• Vulnerable – not endangered but facing very high risk of Extinction in the medium term future.
• Conservation dependent – not vulnerable but needs a conservation program to survive or will move into one of the other categories
• Data deficient – insufficient information to make a direct or indirect assessment of its extinction risk based on its distribution or population status
• Low risk – not in any danger
Criterion 6 -‐ how humans depend on, and impact on, the natural environment

Page 13 of 31
POLLUTION The presence of a substance in the environment that prevents the functioning of natural processes and produces undesirable environmental and health effects ie any undesirable change in the chemical, physical or biological characteristics of an ecosystem. Primary pollutant -‐ is one that is unchanged since production. Secondary pollutant is created when a primary pollutant reacts with other forms of pollution or with an environmental component. Synergy -‐ the effect of pollutants is increased when it acts in combination with others Antagonistic-Two pollutants that cancel each other Sources of Pollution
• Point sources – Source of pollution with specific points of discharge
– Examples; Factories, Sewage systems, Power plants, Coal mines, Oil wells
• Nonpoint sources – Sources of pollution that are harder to identify – Examples; Agricultural runoff, Stormwater drainage, Acid rain
Toxic chemicals Toxic chemicals are among the most serious types of pollutants. They may be man-‐made or naturally occurring. They can enter the air as gases or form suspended or dissolved solids in water. They cannot be buried safely in landfills as they may leach into ground waters or they may enter food chains when they are absorbed by producer organism. Degradable pollutant – can be broken down by natural processes Biodegradable pollutant -‐ can be broken down living organisms Persistent pollutant takes a long time to break down. Non-‐degradable pollutant does not break down at all. Hazardous waste – waste that poses a danger to human health eg: batteries, chemicals, paints solvents and pesticides.
Pathway through plants
Pathway through animals
BIOLOGICAL MAGNIFICATION Some poisons (those that are not biodegradable) are not completely broken down and excreted by organisms → instead; they accumulate in tissues and are passed along a food chain

Page 14 of 31
Atmospheric Pollution Three factors determine level of air pollution 1. Amount of pollutants entering the air 2. Amount of space into which the pollutants can
spread out 3. Mechanisms that remove pollutants from the air
Particles -‐ (or suspended particles) are small solid particles of dust (e.g. dust from a dirt road) or organic material (e.g. pollen), they also include liquid droplets such as tiny droplets of oils and tars (e.g. wood-‐smoke). Larger particles quickly fall out of the air due to gravity (this is referred to as 'dust fallout') but smaller particles (those less than about 0.1mm diameter, referred to as 'total suspended particles' may remain in the air for many hours. PM10 -‐ is particulate matter (particles) less than 10 micrometres (µm) in diameter; these are tiny particles are too small to see individually but if there are millions of them they become visible as smoke or mist. PM2.5 -‐ is particulate matter (particles) less than 2.5 micrometres (µm) in diameter; they are of greatest concern to air pollution professionals because they penetrate deep into our lungs when we breathe and can carry toxic compounds that cause illness
Primary pollutants – Pollutants released directly into atmosphere mainly as a result of burning fuels and wastes
– Examples; Carbon monoxide (CO), Nitrogen oxides (NOx), Sulphur oxides (SOx), Lead (Pb)
Secondary pollutants – Pollutants resulting from reactions of primary air pollutants in the atmosphere
– Examples; Ozone (O3); Sulphuric acid; Nitric acid
Smog • Industrial smog – Greyish mixture of moisture, soot, and sulfurous compounds. Occurs in industrial areas and where coal is a primary energy source
• Photochemical smog – Brownish haze that typically forms over large cities with lots of automobile traffic

Page 15 of 31
Water Pollution Biodegradable: a product in wastewater is biodegradable if it can easily be broken down or digested by, for example, sewage treatment. Biomarker: any parameter that can be used to measure an interaction between a biological system and an environment agent, which may be chemical, physical or biological. Biomonitoring: the use of living organisms to test the suitability of an effluent to be discharged into receiving waters and to test the quality of such waters downstream from a discharge. Discharge: the volume of water that passes a given location within a given period of time. Dissolved oxygen (DO): the oxygen dissolved in sewage, water, or other liquid, usually expressed in milligrams per litre or percent of saturation. It is the test used in BOD determination. Dissolved solids: the total amount of dissolved material, organic and inorganic, contained in water or wastewater. Excessive dissolved solids make water unpalatable for drinking and unsuitable for industrial use. Measurements are expressed as ppm or mg/L. Effluent: a liquid that has passed through a processing operation.
LC50: the concentration of a material in air that will kill 50 per cent of a group of test animals with a single exposure (usually 1 to 4 hours). The LC50 is expressed as parts of material per million parts of air, by volume (ppm) for gases and vapours, or as micrograms of material per litre of air (g/l) or miligrams of material per cubic meter of air (mg/m3) for dusts and mists, as well as for gases and vapors. LD50: a single dose of a material expected to kill 50 per cent of a group of test animals. The LD50 dose is usually expressed as milligrams or grams of material per kilogram of animal body weight (mg/kg or g/kg). The material may be administered by the mouth or applied to the skin. Water pollution: any physical or chemical change in surface water or groundwater that can harm living organisms or make water unfit for certain uses

Page 16 of 31
Major water pollutants Major air pollutants
Pollutant Major Sources Effects
Sewage
Various industries, household waste, dumping at sea
Kills aquatic life. Dangerous to human health causing a range of gastro-‐intestinal diseases
Heavy metals, (eg arsenic, cadmium, mercury)
Industry (e.g. chemical, metal), urban run-‐off, mining
Diseased and contaminated fish. Passed through food chain to humans causing lung , heart and nervous disorders
Polychlorinated biphenyls (PCBS)
Industry (e.g. chemical, pulp paper, plastics)
Diseased and contaminated fish and shellfish. Damage vital human organs
Radioactive waste
Nuclear power stations, dumping at sea
Contamination of water. Increased risk of cancer
Oil
Oil refineries, flushing of tankers, accidental spills
Kills birds and marine life. Poisonous to humans
Biocides (e.g. DDT, dieldrin)
Run-‐off from farmland
Persistent, pass through food chain to humans. May cause birth defects, cancer and other illnesses
Nutrients
Fertilisers in run-‐off from farmland, sewage, animal waste
Increased algae in water, causing lack of oxygen. Aquatic life destroyed
Sediment
Soil erosion from cleared land
Blocks light needed by aquatic life, Pipes and drains become blocked, waterways become too shallow for boats and ships
Plastics
Household waste, litter, dumping
Destroys natural habitats, strangles and mutilates wildlife
Hot water Power stations, various industries
Harms aquatic life, destroys natural habitats
Acid rain
Power stations, various industries, motor vehicles
Aquatic life killed, pipes corroded, illness in humans
Pollutant Sources Effect
Carbon monoxide
Motor vehicles, burning of fossil fuels
Blood absorbs carbon monoxide more readily than oxygen, reducing the amount of oxygen being carried through the body. Carbon monoxide can produce tiredness and headaches. People with heart problems are particularly at risk
Sulfur dioxide
Coal and oil burning power stations, mineral ore processing and chemical manufacture
Attacks the throat and lungs. People with breathing problems can suffer severe illness.
Nitrogen dioxide
Fuel combustion
Affects the throat and lungs
Volatile organic compounds
Motor vehicles, fuel combustion, solvent use
Some VOCs cause eye and skin irritation, headaches or nausea, while some are classed as carcinogens
Ozone
These chemicals are released by motor vehicles and industry.
Ozone attacks the tissue of the throat and lungs and irritates the eyes
Lead
Exhaust gases from motor vehicles that use leaded petrol, smelters.
Particles containing lead in the air can enter the lungs. The lead can then be absorbed into the blood stream. Over a period lead can affect the nervous system and the body's ability to produce blood.
Particles
Motor vehicles, burning of plant materials, bushfires.
May cause breathing difficulties and worsen respiratory diseases. Some may contain cancer-‐producing materials

Page 17 of 31
Enhanced greenhouse effect
The table below lists the characteristics of species predicted to be most and least risk form climate change Species least at risk
Species most at risk
Broad range of physiological tolerance to factors such as temperature, water availability and fire
Narrow range of physiological tolerance
High degree of variability in the physical appearance of individuals and genetic variability
Low genetic variability
Short life cycles and high fertility
Long life cycles and low fertility
Good dispersal capacity Poor dispersers Broad geographic range Narrow geographic range
Gas: Source: Notes:
Water vapour
Oceans, lakes, rivers, reservoirs. Humans have little impact upon levels.
Water vapour is the most abundant GHG. Increased temperature caused by other GHGs is amplified by the resulting increase in water vapour (positive feedback).
Carbon dioxide
Burning of fossil fuels, and forests,
The greatest opportunity humans have of reducing the enhanced greenhouse effect is to reduce their emissions of CO2.
Methane (CH4)
Fossil fuel industry, agricultural livestock, landfill refuse sites, anaerobic wetlands (including rice fields)
Emissions can be reduced by capturing and using CH4 from fossil fuel industries and landfill sites and reducing numbers of livestock.
Nitrous oxide
Nitrate fertilisers, transport and power stations (combustion).
Approximately 6%.

Page 18 of 31

Page 19 of 31

Page 20 of 31

Page 21 of 31
ECOLOGICALLY SUSTAINABLE DEVELOPMENT A sustainable society is one in which all human activity takes place and is maintained over time within the limits of the earth to provide the necessary resources for survival (particularly food) and assimilate waste. A sustainable society allows the human members to meet their own needs without compromising the needs of other species and future generations of humans. PRINCIPLES OF SUSTAINABLE DEVELOPMENT Ethical considerations Intergenerational Equity-‐ It is important that future generations of humans have supplies of important resources and that they are not required to clean up the environmental disasters of the past. Intra-‐generational Equity – The resources of the planet should meet the needs of all humans and all human should have access to clean water, clean air, basic food materials, fibres for clothing, building materials and other basic human requirements. Ecological Integrity -‐ It is important that all the ecosystems be able to continue to function. The biodiversity of ecosystems must be maintained as well as the habitat necessary for them to survive. Strategies Precautionary & Anticipatory Principles – These should apply to all new developments. The development should only be allowed if it can be proved beyond doubt that it will not harm the environment. Full Cost Pricing -‐ In the use of natural resources all values should be considered in the price not just the financial values The user pays principle should always apply. The cost of cleaning up pollution should also be included in the price – the polluter pays principle. Efficient Use of Resources -‐ The use of non-‐renewable resources should be decreased and the use of renewable resources increased. Reusing and recycling should be encouraged. APROACHES TO SUSTAINABLE DEVELOPMENT Education Establishing community based programs that involve the public in environmental management. Damage already done can be repaired and future problems can be avoided. This approach is less expensive and helps create an environmental ethic in the community. Waterwatch,
Coastcare and Landcare are good examples of this approach. Economic This approach uses economics to encourage good environmental practice. Green Economics consists of a group of strategies that would promote this concept. Green Economic Strategies include:
• The Polluter Pays Principle • Full-‐cost Pricing / user pays principle • Economic incentives • Economic Disincentives • Tradable/Marketable Permits • Market Forces • accounting for environmental assets • mandatory renewable energy targets (MRETs)
Two approaches to improved environmental control
Market based approach Government control Advantages
Flexible – allows least cost method of production. Encourages development of new anti-‐pollution strategies
Equitable – all producers have to reduce environmental impact
Popular with industry – remain in control
Easier to implement higher standards as technology and awareness improve.
Prices good regulators –profits hurt when wrong decisions made
Public acceptance and understanding
Dynamic – can be adjusted to meet improved standards
Mechanisms in place
Saves costs Disadvantages
Ignores synergistic effects Expensive to monitor Still needs enforcing, monitoring and identification
Inflexible – no incentive to develop new technologies
Problem as to how to allocate permits
Licences set too unrealistically – very difficult to prosecute
Needs good knowledge to set standards. Tends not to reduce pollution.
Unpopular with businesses –big stick approach.
Examples Taxes –fuel / carbon taxes
Environmental standards – usually set by EPA
Improved property rights –transferable water rights in Murray Darling Basin, which increases the value of water and reduces wasteful irrigation practices.
Licences – pollution control permits,
Tradeable emission permits – used to reduce emissions in some places
Regulations – refundable deposits in SA, lead free petrol, emission control on cars
Realistic pricing -‐ user pays
Criterion 7 -‐ principles for the ecologically sustainable management of the environment

Page 22 of 31
Legal
Laws are passed to protect the environment, a branch of the public service is created and public servants are employed to ‘catch people who do the wrong thing’ and they are fined or gaoled. This approach has many problems. Not everyone gets caught, it is very costly -‐court cases are expensive, big companies can afford to carry on lengthy court cases, local councils may breach the act, and industries may close or move. The public may react against the government with the environment the loser. To solve some of these problems governments may grant exemptions to industries and councils who are in breach of environmental protection legislation. Overseas they sometimes sell licenses to pollute. They may also use the ’polluter pays principle’ and simply make activities that pollute more expensive • problems of relying on legal processes • international agreements MANAGEMENT TOOLS E.I.A./E.I.S. An Environmental Impact Assessment is required for all major projects. It allows us to predict the impact of a development on the environment, manage our resources more effectively and improve our decision making. An EIA examines the likely impact on the environment of a project and examines the social and economic impacts as well as the impact on the biophysical environment. The biophysical impact must consider the effects on soil, the air and the water as well as the living organisms. An EIA links together three groups-‐ the developer, the community and the decision makers. The developer initiates the project and must try to minimise the impact of the project on the environment. The community should have their concerns addressed in the design of the project and in the final decision about the project. The decision makers can use the EIA to determine if the project should go ahead. STEPS IN THE EIA PROCESS 1 Initiate -‐ the developer initiates the projects and identifies the type of assessment that should be made. 2 Identify the Issues -‐ advice is sought from industry, the community and from governments as to what issues should be addressed in the EIA. 3 Develop Alternatives -‐ including different locations, different designs and always the alternative to ‘do nothing’. 4 Predict the likely impact and identify the type of study that should be made. 5 Evaluate the alternatives to make the best decision. 6 EIS -‐ a formal document is completed and presented. 7 Make a decision based on the document. If the answer is “Yes” to the proposal, conditions may be applied.
8 Monitor the projects to see if any conditions have been met, if the predicted impacts occur and to help future decision making. Cost / Benefit analysis A cost/benefit analysis is an economic decision making tool that is frequently used to decide if a project should go ahead. It most usually measures the financial cost of the project against the financial profit it would generate. As well as economics costs and benefits a project may also have social and environmental costs and benefits. (environmental benefits are rare but in many cases one activity may have fewer environmental cost than another). Costs and benefits may be direct or indirect. They may also be tangible (have a monetary value) or intangible (hard to put a value on). An externality is a cost that can be passed on to someone else and is therefore not considered in the cost/benefit analysis i.e. milk processors are not required to pay for the disposal of the milk cartons, the local council meets this cost. In full cost pricing this cost would be included in the price of a carton of milk. An opportunity cost is the cost of a lost opportunity e.g. if you log a forest you can’t make money from it from ecotourism and as such is an opportunity cost. Risk assessment Considers the consequences of a serious threat to humans and compares this to the probability of this occurring. Procedures are then built into the project to reduce either the consequences or the probability to the point where the risk becomes acceptable. If one or both of these can be reduced to zero then the risk is acceptable MANAGEMENT PLANS What they are Management plans are one of several management tool that can be used to promote sustainable development and reduce the impact of human activities on the environment. They are more commonly used for projects and activities that are already in use rather than new projects How they are developed:
• identification of stakeholders • vision statement • description and mapping of resources • valuing of resources • determine legal restrictions • selecting appropriate technology • ongoing monitoring • evaluating the management plan • suggest various options

Page 23 of 31
A management plan should include: • A description of the area and its significance in the region. A map of the area should be included and it should include access points and services available.
• Information about the legal status of the area and any relevant legislation (both state and federal) should be noted
• The values of the area should be identified and the stakeholders identified. A consultation process with the stakeholders should be established.
• A list of management objectives should be created. • A baseline study should be designed to document the biotic and abiotic factors relevant to the area. Special note should be made of threatened or endangered species.
• A vision statement should be prepared. Major threats should be identified and a recovery plan should be included if necessary. What human amenities are required should be identified. The vision statement should show how the area should look after a period of time.
• An ongoing plan for monitoring should be created and as consultation committee established.
Managing Biodiversity • Conservation reserves eg National Parks, Marine
protected areas -‐ Protection of natural and scenic areas of national or international significance for scientific, educational and recreational use.
• The National Reserve System is underpinned by a scientific framework to ensure that Australia progressively extends protection to examples of all our ecosystems. The scientific framework has a clear objective: to develop a 'comprehensive, adequate and representative' system of protected areas -‐ commonly referred to as the 'CAR' reserve system. Specifically CAR means:
- Comprehensive: the inclusion in the National Reserve System of examples of regional-‐scale ecosystems in each bioregion
- Adequate: the inclusion of sufficient levels of each ecosystem within the protected area network to provide ecological viability and to maintain the integrity of populations, species and communities
- Representative: the inclusion of areas at a finer scale, to encompass the variability of habitat within ecosystems
• Corridors – connect fragmented habitats • Translocation – transfer of plants or animals from
one part of their range to another • Reintroduction – of plants and animals that have
been raised in captivity to replace those that have become locally extinct
• Biodiversity hotspots –concentrating efforts on protecting significant hotspots where significant biodiversity is under immediate threat.
• Rehabilitating and restoring – • Quarantine BARRIERS TO SUSTAINABLE DEVELOPMENT Global economic system The economies of the MEDC’s (more economically developed countries) are often quite different to the economies of the LEDC’s (less economically developed counties). The economies of the MECD’s are usually based on one of two models, regulated economies or market economies. Some economies are a mixture of the two. Australia has a market economy where the prices of goods and services is determined by their value in the market. In the past there was some degree of regulation in the Australian economy but much of this has been removed since the 1980s. The prices of goods and services are determined by a principle called the Law of Supply and Demand. If the supply is less than the demand the price goes up and if demand is less than the supply the price goes down. All economies are based on some type of capital. This can be natural capital (natural resources). Agricultural capital, manufactured capital or human capital. Most of the MEDC’s have considerable manufactured capital and/or human capital and the LEDC’s have only natural or agricultural capital. The poorest nations may have little capital of any kind. Economists use terms such as GDP (gross domestic product) and GNP (gross national product) to describe the health of an economy. GDP refers to the amount of good and services produced and consumed by an economy. GNP refers to the goods and services produced and consumed plus the amount imported and exported. Nations with a high GDP and GNP usually have a high standard of living. Almost all nations trade goods and services with other nations. Goods purchased from other countries are called imports and those sold to other countries are called exports. If the value of the goods imported is greater than the goods exported then the country is said to have a trade deficit. The value of natural resources and agricultural products is often much less than the value of manufactured goods. GDP and GNP say little about the health of the environment. There is a general trend that the higher a countries GDP and GNP the larger is its ecological footprint-‐ the more resources it consumes and the more pollution it creates.

Page 24 of 31
Summary of types of graphs
Nature of Independent variable Nature of Dependent variable Type of Graph
Data continuous Individual readings
Data continuous Individual readings
Line graph
Data continuous No independent variable identified
Data continuous No dependent variable identified
Scatter graph
Data discontinuous Data grouped into non-‐numerical categories
Dependent variable measured or counted
Bar / Column graph
Data continuous Data grouped into numerical size / sample intervals
Dependent variable counted Histogram
Analysing trends in graphs
Analysing – Mathematically modifying data to highlight important data and identify trends in the variables.
Correlating – Describing trends in one variable as another variable changes.
Interpretation – Understanding what conclusions can be drawn from the data.
Criterion 8 -‐ analyse, interpret and draw conclusions
Page 25 of 31
GLOSSARY OF ENVIRONMENTAL SCIENCE TERM Abiotic factor: nonliving components of the ecosystem, including chemical and physical factors. Acid deposition: rain or snow that has a lower pH than precipitation from unpolluted skies. Acid mine drainage: sulfuric acid that drains from mines, especially abandoned underground coal mines. Created by the chemical reaction between oxygen, water, and iron sulphides found in coal and surrounding rocks. Active solar: capturing and storage of the sun’s energy through special collection devices (solar panels) that absorb heat and transfer it to air, water, or some other medium, which is then pumped to a storage site usually a water tank) for later use. Contrast with passive solar. Adaptation: a genetically determined structural or functional characteristic of an organism that enhances its chances of reproducing and passing on its genes. Agricultural society: a group of people living in villages or towns and relying on domestic animals and crops grown in nearby fields. Algal bloom: rapid growth of algae in surface waters due to increase in inorganic nutrients, usually either nitrogen or phosphorus. Alien species: any species introduced into or living in a new habitat. Also known as exotic. Anthropogenic: created by humans. Aquaculture: cultivation of fish and other aquatic organisms in freshwater ponds, lakes, or other bodies of water. Aquifer: underground layer of porous material containing water (ground water). Asbestos: A naturally occurring silicate fibre. Useful in society as an insulator. It is deadly to breathe even in small amounts. Causes diseases such as mesothelioma, asbestosis and lung cancer. Asbestosis: lung disease characterised by build up of scar tissue in the lungs. Caused by inhalation of asbestos. Atmosphere: layer of air surrounding the earth. Atom: a basic unit of matter consisting of a nucleus of positively charged protons and uncharged neutrons, and an outer cloud of electrons orbiting the nucleus. Autotroph: An organism that can produce its own food. Bacteria:, A group of single-‐celled organisms, each surrounded by a cell wall and containing circular DNA. Responsible for some diseases and many beneficial functions, such as decay of organic materials and nutrient recycling. Biochemical oxygen demand (BOD): measure of oxygen depletion of water (largely from bacteria decay) due to presence of biodegradable organic pollutants. Gives scientists an indication of how much organic matter is in water. Bioconcentration: ability of an organism to selectively accumulate certain chemicals, elements, or substances within its body or within certain cells. Biodegradable: Able to be broken down by micro-‐organisms Biogas: a gas containing methane and carbon dioxide. Produced by anaerobic decay of organic matter, especially manure and crop residues.
Biochemical cycle: complex cyclical transfer of nutrients from the environment to organisms and back to the environment. Examples include the carbon, nitrogen, and phosphorus cycles. Biological control: use of naturally occurring predators, parasites, bacteria, and viruses to control pests. Biological extinction: disappearance of a species from part or all of its range. Biological magnification: (biomagnification) build up of chemical elements or substances in organisms in successively higher tropic levels. Biomass: the dried weight of all organic matter in the ecosystem. Any form of organic material (from both plants and animals) from which energy can be derived. Biomass pyramid: see pyramid of biomass Biome: One of several immense terrestrial regions, each characterised throughout its extent by similar plants, animals, climate and soil type. Biosphere All the life supporting regions (ecosystems) of the earth and all the interactions that occur between organisms and between organisms and the environment. Biotic factor: The biological component of the ecosystem, consisting of population of plants, animals, and micro-‐organisms in complex communities Cancer: Uncontrolled proliferation of cells in humans and other living organisms. In humans, includes more than 100 different types afflicting individuals of all races and ages. Carbon Cycle: The cycling of carbon between organisms and the environment. Carcinogen: A chemical or physical agent that causes cancer to develop, often decades after the original exposure. Carrying capacity: Maximum population size that a given ecosystem can support for an indefinite period or on a sustainable basis. Catalyst: Substance that accelerates chemical reactions but it is not used up in the process. Enzymes are biological catalysts. Also see catalytic converter. Catalytic converter: Device attached to the exhaust system of automobiles and trucks to rid the exhaust gases of harmful pollutants. Cellular respiration: Process by which a cell breaks down glucose and other molecules to acquire energy. Chlorofluorocarbons: Organic molecules consisting of chlorine and fluorine covalently bonded to carbon. Previously thought to be inert, but now known to destroy the stratosphere’s ozone layer. Chlorophyll: Pigment of plant cells that absorbs sunlight, thus allowing plants to capture solar energy. Clear -‐ cutting: (also clear-‐felling) Removal of all trees from a forested area. Climate: The average weather conditions: temperature, solar radiation, precipitation, and humidity. Climax community or ecosystem: See mature community. Closed system: A system that can exchange energy, but does not exchange matter, with the surrounding environment.

Page 26 of 31
Coastal wetlands: Wet or flooded regions along coastlines, including mangrove swamps, salt marshes, bays, and lagoons. Coliform bacterium: Common bacterium found in the intestinal tracts of humans and other species. Used in water quality analysis to determine the extent of faecal contamination. Combustion: Burning, Commensalism: Relationship between two organisms that is beneficial to one and neither harmful nor helpful to the other. Commons: Any resource used in common by many people, such as air, water, and grazing land. Community: Also called a biological community. The populations of plants, animals, and micro-‐organisms living and interacting in a given locality. Competition: Vying for resources between members of the same or different species. Composting : Aerobic decay of organic matter to generate a humus-‐like substance used to supplement soil. Conservation: A strategy to reduce the use of resources, especially through increased efficiency, reuse, recycling, and decreased demand. Consumer (or consumer organism or heterotroph): An organism in the ecosystem that feeds on autotrophs and/or heterotrophs. Contour farming: Soil erosion control technique in which row crops (corn) are planted along the contour lines in sloping or hilly fields rather than up and down the hills. Control group: In scientific experimentation, a group that is untreated and compared with a treated, or experimental, group. Cost -‐ benefit analysis: Way of determining the economic, social, and environmental costs of a proposed action. DDT: Dichlorodiphenyltrichloroethane. An insecticide used to control a variety of insect pests, but now banned because of its persistence in the environment and its ability to bioaccumulate. Debt for Nature: Wealthier nations cancel the debts for poorer communities if they will protect their natural ecosystems. Decibel (dB): A unit to measure the loudness of sound. Decomposer: Also micro consumer. An organism that breaks down nonliving organic material. Bacteria and Fungi are decomposers and should not be confused with detritivores. Decomposer food chain: A specific nutrient and energy pathway in an ecosystem in which decomposer organisms (bacteria and fungi) consume dead plants and animals as well as animal wastes. Also called detritus food chain. Deep Ecology: Recognises the right of all organisms to exist. Humans are no more important than other organisms. Deforestation: Destruction of forests by clear cutting. Demographic transition: A phenomenon witness in populations of industrialising nations. As industrialisation
proceeds and wealth accumulates. crude birth rate and crude death rate decline, resulting in zero or low population growth. Demography: The science of population. Denitrification: The breakdown of nitrates by bacteria. Desert: Biome located throughout the world. Often found on the downwind side of mountain ranges. characterised by low humidity, high summertime temperatures, and plants and animals especially adapted to lack of water. Desertification: The formation of desert in arid and semiarid regions from overgrazing, deforestation, poor agriculture practices, and climate change. Found today in Africa, the Middle East, and the South-‐western United States. Detoxification: Rendering a substance harmless by reacting it with another chemical, chemically modifying it, or destroying the molecule through combustion or thermal decomposition. Detritus: Any organic waste from plants and animals. Detritus Feeders: Organisms in the decomposer food chain that feed primarily on organic waste (detritus) such as fallen leaves. Detritus food chain: see decomposer food chain. Developed Country: A convenient term that describes, industrialised nations, generally characterised by high standard of living, low population growth rate, low infant mortality rate, high per capita income, urban population, and low illiteracy. Developing country: Same as less developed country. Dioxin: A large group of highly toxic, carcinogenic compounds containing some herbicides (2,4-‐D and 2,4,5-‐T) and Agent Orange. Diversity: A measure of the number of different species in an ecosystem. DNA (deoxyribonucleic acid): A long-‐chained organic molecule that is found in chromosomes and carries the genetic information that controls cellular function and is the basis of heredity. Doubling time: The length of time it takes some measured entity (population) to double in size at a given growth rate. Ecological niche: see niche Ecological system: See Ecosystem Ecologically Sustainable Development: Development which meets the needs of the present generation without compromising the needs of future generations and other species. Economic externality: A cost generally passed on to the general public and tax payers. Ecosphere: See biosphere Ecosystem: Short for ecological system. A community of organisms occupying a given region within a biome. Also, the physical and chemical environment of that community and all the interactions between organisms and between organisms and their environment. Ecosystem stability: Dynamic equilibrium of the ecosystem. Also a characteristic of ecosystems causing them to return to their previous state (resilience) and their resistance to change (inertia)

Page 27 of 31
Ecotone: Transition zone between adjacent ecosystems Element: A substance, such as oxygen, gold, or carbon, that is distinguished from all other elements by the number of protons in its atomic nucleus. Emigration: Movement of people out of a country to establish residence elsewhere. Endangered Species: A plant, or micro-‐organism that is in immediate danger of biological extinction. See threatened and rare species. Energy: The capacity to do work. Found in many forms, including heat, light, sound, electricity, coal, oil, gasoline. Energy Pyramid: See pyramid of energy Entropy: A measure of disorder. The second law of thermodynamics applied to matter says that all systems proceed to maximum disorder. Environment: All the biological and non-‐biological factors that affect an organisms life. Environmental control (of pests): Methods designed to alter the abiotic and biotic environment making them inhospitable or intolerable. Examples include increasing crop diversity, altering time of planting, and altering soil nutrient levels. Environmental impact statement (EIS or ES): Document prepared primarily to outline potential impacts of projects. Environmental Resistance: Abiotic and Biotic factors that can potentially reduce population size. Environmental science: The interdisciplinary study of the complex and interconnected issues or population, resources and pollution. Estuary: Coastal regions such as inlets or mouths of rivers where fresh and salt water mix. Ethanol: Grain alcohol, or ethyl alcohol, produced by fermentation of organic matter. Eukaryotes: The first aerobic cells complete with nuclei and energy releasing organelles. Eutrohpication: Accumulation of nutrients in a lake or pond due to human or natural activities. Evolution: A long term process of change in organisms caused by random genetic changes that favour the survival and reproduction of the organisms possessing the genetic change. Through evolution, organisms become better adapted to their environment. Experimental group: in scientific experimentation, a group that is treated and compared with an untreated, or control group. Exponential curve: see J curve Extinct species: Has completely disappeared. Feral: a domestic animal or plant that has gone wild. Food Chain: A flow diagram showing the movement of matter and energy from one organism to another. Food web: Shows the feeding relationships in a community. Fossil Fuels: Fuels derived from once living organisms. Frontier mentality: A mind that views humans as “above” all other forms of life rather than as an integral part of nature and sees the world as unlimited supply or resources for human use regardless of the impacts on other species. Implicit in this view are the notions that
bigger is better, continued material wealth will improve life, and nature must be subdued. Gaia Hypothesis: Term coined by James Lovelock to describe the Earth’s capacity to maintain the physical and chemical conditions necessary for life. Galaxy: Grouping of billions of stars, gas, and dust, such as the Milky Way galaxy. GDP: Gross Domestic Product. Indicates the amount of goods and services used by a society. Genetic engineering: The transfer of genes from one organism to another. Geothermal energy: Energy derived from the earth’s heat that comes from decay of naturally occurring radioactive materials in the earth’s crust, magma, and friction caused by movement of tectonic plates. Global Warming: An increase in the average temperature of the Earth. GNP: See Gross National Product. Grasslands: Biome found in both temperate and tropical regions and characterised by periodic drought, flat or slightly rolling terrain, and large grazers that feed off the lush grasses. Grey-‐air cities: Older industrial cities characterised by predominantly sulfur dioxide and particulate pollution. Grazer food chain: A specific nutrient and energy pathway starting with plants that are consumed by grazers (herbivores). Greenhouse Effect: Mechanism that explains atmospheric heat trapped like the glass in a greenhouse, permitting visible light to penetrate but impeding the escape of infrared radiation, or heat. Gross National Product (GNP): Total national output of goods and services valued at market prices, including net exports and private investment. Gross Primary Productivity: The total amount of sunlight converted into chemical-‐bond energy by a plant. Groundwater: Water below the Earth’s surface in the saturated zone. Habitat: The specific region in which an organism lives. Hard path: A term coined by Amory Lovins to describe large, centralised energy systems such as coal, oil, or nuclear power, characterised by extensive power distribution, central control, and lack of renewability. Hazardous waste: Any potentially harmful solid, liquid, or gaseous waste product of manufacturing or other human activities. Herbicide: Chemical agent used to control weeds. Herbivore: Heterotrophic organism that feeds exclusively on plants. Heterotroph: An organism that feeds on other organisms such as plants and animals. It cannot make its own foodstuffs. Hot-‐rock zones: Most widespread geothermal resource. Regions where bedrock is heated by underlying magma. Humus: Mixture of decaying organic matter and inorganic matter that increases soil fertility, aeration, and water retention. Hydrocarbons: Organic molecules containing hydrogen and carbon. Released during the incomplete combustion

Page 28 of 31
of organic fuels. React with nitrogen oxides and sunlight to form photochemical oxidants in photochemical smog. Hydroelectric power: Electricity produced in turbines powered by running water. Hydrological cycle: The movement of water through the environment from atmosphere to Earth and back again. Hydrosphere: The watery portion of the planet. Contrast with atmosphere and lithosphere. Hypothesis: Tentative explanation for a natural phenomenon, testable by experiment. Immigration: Movement of people into a country to set up residence there. Indoor air pollution: Generally refers to air pollutants in homes from internal sources such as smokers, fireplaces, wood stoves, carpets, panelling, furniture, foam insulation, and cooking stoves. Industrial smog: Air pollution from industrial cities (grey-‐air cities), consisting mostly of particulates and sulfur oxides. Industrial society: Group of people living in urban or rural environments that are characterised by mechanisation of industrial production and agriculture. Widespread machine labour causes high energy demands and pollution. Increasing control over natural processes leads to feeling that humans are separate from nature and superior to it. Infrared radiation: Heat, an electromagnetic radiation of wavelength outside the red end of the visible spectrum. Inland wetlands: Wet and flooded regions along inland surfaces waters. Includes marshes, bogs, and river outflow lands. In-‐migration-‐ Movement of people into a state or region within a country to set up residence. Inorganic fertiliser: Synthetic plant nutrient added to the soil to replace lost nutrients. Major components include nitrogen, phosphorus, and potassium. Insecticide: One form of pesticide used specifically to control insect populations. Intergenerational equity: The idea that future generations should inherit a planet that has not been polluted or depleted of its natural resources. Interspecific competition: Competition between members of different species. Intragenerational (social) Equity: The idea that all humans have equal rights to the resources of the Earth. J curve: A graphical representation of exponential growth. Joules: The units in which work and heat are measured. Keystone species: Critical species in an ecosystem whose loss profoundly affects several or many others. KiloWatt: One thousand watts. See Watt. Kinetic energy: The energy of objects in motion. Less developed country: Term describing the non-‐industrialized nations, generally characterised by low standard of living, high population growth rate, high infant mortality, low material consumption, low per capita energy consumption, low per capita income, rural population, and high illiteracy. Light Year: Astronomical unit that measures the distance that light can travel in a year.
Limiting Factor: A chemical or physical factor that determines whether an organism can survive in a given ecosystem. Lithosphere: The outermost shell of the Earth. Macronutrient: A chemical substance needed by living organisms in large quantities (for example, carbon, oxygen, hydrogen and nitrogen). Management Plan: Plan that have been developed to guide the present and future land/water management of an area. Mariculture: Cultivation of fish and other aquatic organisms in salt water (estuaries and bays). Mature Community: A community that remains more or less the same over a long period of time. Climax stage of succession. Also called a climax community. Mature Ecosystem: An ecosystem in the climax age of succession, characterised by high species diversity and high stability. Contrast with immature ecosystem. MegaWatt: Measure of electrical power equal to a million watts. See Watt. Mesothelioma: A tumour of the lining of the lung caused by asbestos. Migration: Moment of people across state and national boundaries to set up new residence. See immigration, emigration, in-‐migration and out migration. Mineral: A chemical element (e.g. gold) or inorganic compound (e.g. iron ore) existing naturally. Minimum tillage: Reduced ploughing and cultivating of cropland between and during growing seasons to help reduce soil erosion and save energy. Monoculture: Cultivation of plant species such as wheat over a large area making it highly susceptible to disease and insects. Mutation: In general, any damage to the DNA and chromosomes. Mutualism: relationship between two organisms that is beneficial to both. Natural Gas: Gaseous fuel containing methane and lesser amounts of other burnable organic gases such as propane and butane. Natural resource: see resource. Natural selection: Process in which slight variations in organisms (adaptations) are preserved if they are useful and help the organism to better respond to its environment. Negative feedback: Control mechanism present in the ecosystem and all organisms. Information in the form of chemical, physical and biological agents influences processes, causing them to shut down or reduce their activity. Net Primary Productivity: Gross Primary Productivity minus the energy plants use during cellular respiration. Niche: Also called an ecological niche. An organism’s role in a community. Nitrogen cycle: The cycling of nitrogen between organisms and the environment. Nitrogen fixation: Conversion of atmospheric nitrogen (a gas) into nitrate and ammonium ions (inorganic form), which can be used by plants.

Page 29 of 31
Nitrogen oxides: Nitric oxide (NO) and nitrogen dioxide (NO2), produced during combustion when atmospheric nitrogen (N2) combines with oxygen. Nonpoint source: (of pollution) Diffuse source of pollution such as an eroding field, urban and suburban lands, and forests. Non-‐renewable resource: Resource that is not replaced or regenerated naturally within a reasonable period (fossil fuel, mineral) Nuclear power (or energy) Energy from the fission or fusion of atomic nuclei. Old growth forest: Ancient forests with trees often 150 to 1000 or more years old. Omnivore: An organism that eats both plants and animals. Open system: A system that freely exchanges energy and matter with the environment. Opportunity Cost: Money lost when an opportunity is lost. E.g. A tree sold for wood chips can’t be used the make furniture. PCBs: see polychlorinated biphenyls. Perennial: A plant that grows from the same root structure year after year (for example, rose bushes). Permaculture: A method off sustainable agriculture which encourages biodiversity. Permafrost: Permanently frozen ground found in the tundra. Pesticide: A general term referring to a chemical, physical, or biological agent that kills organisms we classify pests, such as insects and rodents. Petroleum: A viscous liquid containing numerous burnable hydrocarbons. Distilled into a variety of useful fuels (fuel oil, gasoline, and diesel) and petrochemicals (chemicals that can be used as a chemical feedstock for the production of drugs, plastics, and other substances). pH: Measure of acidity on a scale from 0 to 14, with pH 7 being neutral, numbers greater than 7 being basic, and numbers less than 7 being acidic. Photochemical oxidants: Ozone and a variety of oxygenated organic compounds produced when sunlight, hydrocarbons, and nitrogen oxides react in the atmosphere. Photochemical reaction: A chemical reaction that occurs in the atmosphere involving sunlight or heat, pollutants, and sometimes natural atmospheric chemicals. Photochemical smog: A complex mixture of photochemical oxidants and nitrogen oxides. Usually has a brownish-‐orange colour. Photosynthesis: A two-‐part process involving (1) the capture of sunlight and its conversion into cellular energy and (2) the production of organic molecules such as glucose and amino acids from carbon dioxide, water, and energy from the sun. Photovoltaic cells: Thin wafer of silicon or other material that emits electrons when struck by sunlight, thus generating an electrical current. Also solar cell. Pioneer community: The first community to become established in a once-‐lifeless environment during primary succession.
Plankton: free floating micro-‐organisms. May be phytoplankton -‐plants or zooplankton -‐ animals. Point source (of pollution): Easily discernible source of pollution such as a factory. Pollution: Any physical, chemical, or biological alteration of air, water, or land that is harmful to living organisms. Polychlorinated biphenyls (PCBs): Group of at least 50 organic compounds, used for many years as insulation in electrical equipment. Capable of biological magnification. Disrupts reproduction in gulls and possible other organisms high on the food chain. Population: A group of organisms of the same species living with a specified region. Population control: In human populations, all methods of reducing birth rate, primarily though pregnancy prevention and abortion. Population crash: Sudden decrease in population that results when an organism exceeds the carrying capacity of its environment. Population growth rate: Rate at which a population increases on a yearly basis, expressed as a percentage. Population histogram: Graphical representation of population by age and sex. Positive feedback: Control mechanism in ecosystems and organisms in which information influences some process, causing it to increase. Potential energy: Stored energy. Precipitation: Water falling from the sky as rain, snow or ice. Predator An organism that actively hunts its prey. Prey: Organism (e.g. deer) attacked and killed by predator. Primary air pollutant: A pollutant that has not undergone any chemical transformation; emitted by either a natural or an anthropogenic source. Primary consumer: First consuming organism in a given food chain. A grazer in grazer food chains or a decomposer organism or insect in decomposer food chains. Belongs to the second tropic level. Primary succession: The sequential development of biotic communities where none previously existed. Primary treatment (of sewage): First step in sewage treatment to remove large solid objects by screens (filters) and sediment and organic matter in settling chambers. Producer (autotrophic or producer organism): One of the organisms that produces the organic matter cycling though the ecosystem. Producers include plants and photosynthetic algae. Productivity: The rate of conversion of sunlight by plants into chemical-‐bond energy (covalent bonds in organic molecules). Pyramid of biomass: Graphical representation of the amount of biomass (organic matter) at each tropic level in an ecosystem. Pyramid of numbers: Graphical representation of the number of organisms of different species at each tropic level in an ecosystem. Radioactive waste: Any solid or liquid waste material containing radioactivity. Produced by research labs,

Page 30 of 31
hospitals, nuclear weapons factories, and fusion reactors. Radioactivity: Radiation released from unstable nuclei. Real price (or cost): The price of a commodity or service in fixed dollars, that is, the value of a dollar at an earlier time. Helpful way to determine whether a resource has experienced a real increase in cost or whether higher costs are simply due to inflation. Reclamation: As used here, the process of returning land to its prior use. Commonly to convert deserts, wetlands and other areas into habitable, productive land. Recycling: A strategy to reduce resource use by returning used or waste materials from the consumption phase to the production phase of the economy. Relative humidity: The amount of moisture in a given quantity or air divided by the amount the air could hold at that temperature. Expressed as a percentage. Renewable source: A resource replaced by natural ecological cycles (water, plants, animals) or natural chemical or physical processes (sunlight, wind). Reserve: Deposit of energy or minerals that is economically and geologically feasibly to remove with current and foreseeable technology. Resource (in general): Anything used by organisms to meet their needs, including air, water, minerals, plants, fuels, and animals. Resource (as a measurement of a mineral of fuel): Total amount of a mineral or fuel on Earth. Generally, only a small fraction can be recovered. Compare with reserve Restoration ecology: Study of restoring ecosystems to their natural state after human interference. Also called conservation biology. Risk acceptability: A measure of how acceptable a hazard is to a population. Risk assessment: The science of determining what hazards a society is exposed to from natural and human causes and the probability and severity of those risks. Risk probability: The likelihood of a hazardous event will to occur. Risk severity: A measure of the total damage a hazardous event would cause. Salinisation: Deposition of salts in irrigated soils, making soil unfit for most crops. Cause by rising water table due to inadequate drainage of irrigated soils. Saltwater intrusion: Movement of saltwater from oceans or saltwater aquifers into freshwater aquifers, caused by depletion of freshwater aquifers of low predication or both. Sanitary landfill: Solid waste disposal site where garbage is dumped and covered daily with a layer of dirt to reduce odours, insects and rats. Sclerophyll: Plants with hard leathery leaves that contain oils. Scrubber: Pollution control device that removes particulates and sulfur oxides from smokestacks Secondary consumer: Second consuming organism in food chain. Belongs to the third tropic level. Secondary pollutant: A chemical pollutant from a natural or anthropogenic sources that undergoes chemical changes as a result of reacting with another pollutant,
sunlight, atmospheric moisture, or some other environmental agent. Secondary succession: The sequential development of biotic communities occurring after the complete or partial destruction of an existing community by natural or anthropogenic forces. Secondary treatment (of sewage): After primary treatment, removal of biodegradable organic matter from sewage using bacteria and other microconsumers in activated sludge or tickle filters. Selective cutting: Restricted removal of trees. Especially useful for mixed hardwood stands. Contrast with clear-‐cutting and shelter-‐wood cutting. Sewage treatment plant: Facility where human solid and liquid wastes from homes, hospitals, and industries are treated, primarily to remove organic matter, nitrates, and phosphates. Shelterbelts: Rows of trees and shrubs planted alongside fields to reduce wind erosion and retain snow to increase soil moisture. May also be used to reduce heat loss from wind and thus conserve energy around homes and farms. Shelter-‐wood cutting: Three-‐step process spread out over years: (1) removal of poor-‐quality trees to improve growth of commercially valuable trees and allow new seedlings to become establishes, (2) removal of commercially valuable trees once seedlings are established, and (3) cutting remaining mature trees grown from seedlings. Slash-‐and burn agriculture: Farming practice in which small plots are cleared of vegetation by cutting and burning. Crops are grown until the soil is depleted; then the land is abandoned. This allows the natural vegetation and soil to recover. Sludge: Solid organic material produced during sewage treatment. Smelter: A factory where ores are melted to separate impurities from the valuable minerals. Smog: Refers to a greyish haze (combination of smoke and fog) found in industrial cities. Soft path: A term coined by Amory Lovins to describe such practices as conservation, efficient use of energy, and renewable energy systems such as solar and wind. Characterised by high labour intensity, decentralised energy production, and small-‐scale technology. Soil horizon: Layers found in most soils. Solar collector: Device to absorb sunlight and convert it into heat. Solar energy: Energy derived from the sun (heat) and natural phenomena driven by the sun (wind, biomass, running water). Spaceship earth: Metaphor introduced in the 1960s to foster a greater appreciation of the finite nature of Earth’s resources and the ecological cycles that replenish oxygen and other important nutrients. Speciation: Formation of new species. Species: A group of plants, animals, or micro-‐organisms that have a high degree of similarity and generally can interbreed only among themselves.

Page 31 of 31
Species diversity: Measure of the number of different species in a biological community. Star: Spherical cloud of hot gas, such as the sun, fuelled by nuclear fusion reactions in its core. Synergism: An effect whereby two substances together have a greater impact. Technological fix: A purely technological answer to a problem. Temperate deciduous forest: Biome located in the eastern United States, Europe, and north eastern China below the taiga. Characterised by deciduous and non-‐deciduous trees, warm growing season, abundant rainfall, and a rich species diversity. Temperature inversion: Alteration in the normal atmospheric temperature profile so that air temperature increases with altitude rather than decreases. Terracing: Construction of small earthen embankments on hilly or mountainous terrain to reduce the velocity of the water flowing across the soil and thus reduce soil erosion. Tertiary treatment (of sewerage): Removal of nitrates, phosphates, chlorinated compounds, salts, acids, metals and toxic organic after secondary treatment. Thermal pollution: Heat added to air or water that adversely affects living organisms and may alter climate. Thermodynamics: The study of energy conversions. See the first and second laws of thermodynamics. Toxin: A chemical, physical, or biological agent that causes disease or some alteration of the normal structure and function of an organism. Impairments may be slight or severe. Onset of effects may be immediate or delayed. Transpiration: Escape of water from plants through pores (stomata) in the leaves. Tree farms: Private forests devoted to maximum timber growth and relying heavily on herbicides, insecticides and fertilisers. Trophic level: Describes the position of the organism in the food chain. Tropical rain forest: Lush forest near the equator with high annual rainfall, high average temperature a notoriously nutrient poor soil. Possibly the richest ecosystem on Earth. Tundra (alpine): Life zone found on mountain tops. Closely resembles the arctic tundra in terms of precipitation, temperature, growing season, plants and animals. Extraordinarily fragile. Tundra (arctic): First major life zone or biome in south of North Pole. Ultraviolet (UV) light or radiation: Electromagnetic radiation from sun and special lamps. Causes sunburn and mutations in bacteria and other living cells. Waste-‐to-‐energy plant: Incinerator for rubbish that produces small amounts of electricity from heat given off by combustion. Water cycle: See hydrological cycle. Water-‐logging: High water table causing saturation of soils due to poor soil drainage and irrigation. Decreases soil oxygen and kills plants. Watershed: Land area drained by a given stream or river.
Water table: Top of the zone of saturation. Watt: Unit of power indicating rate at which electrical work is being performed. Wave power: Energy derived from sea waves. Wetlands: Land areas along fresh water (inland wetlands) and salt water (coastal wetlands) that are flooded all or part of the time. Wilderness: An area where the biological community is relatively undisturbed by humans. Seen by developers an untapped supply of resources such as timber and minerals, seen by environmentalists as a haven from hectic urban life, and an area for reflection and solitude. Wind energy: Energy captured from the wind to generate electricity or pump water. An indirect form of solar energy. Wind generators: Windmills that produce electrical energy. Zero population growth: A condition in which population is not increasing; the population growth rate is zero.