PL-TR-97-3027 PL-TR-97-3027 Basic Research in Electric ...
55
PL-TR-97-3027 PL-TR-97-3027 Basic Research in Electric Propulsion Part I: Pulsed Plasma Thruster Propellant Efficiency and Contamination Part II: Arcjet Remote Plume Measurement and Hydrogen Density J.A. Pobst G.G. Spanjers I.J. Wysong J.B. Malak Raytheon ITSS Air Force Research Laboratory AFRL/PRS 10 E. Saturn Blvd. Edwards AFB, CA 93524-7680 February 2002 Interim Report APPROVED FOR PUBLIC RELEASE; DISTRIBUTION UNLIMITED. AIR FORCE RESEARCH LABORATORY AIR FORCE MATERIEL COMMAND EDWARDS AIR FORCE BASE CA 93524-7048
Transcript of PL-TR-97-3027 PL-TR-97-3027 Basic Research in Electric ...

PL-TR-97-3027 PL-TR-97-3027
Basic Research in Electric PropulsionPart I: Pulsed Plasma Thruster Propellant Efficiency andContaminationPart II: Arcjet Remote Plume Measurement and HydrogenDensity
J.A. PobstG.G. SpanjersI.J. WysongJ.B. Malak
Raytheon ITSSAir Force Research LaboratoryAFRL/PRS10 E. Saturn Blvd.Edwards AFB, CA 93524-7680
February 2002
Interim Report
APPROVED FOR PUBLIC RELEASE; DISTRIBUTION UNLIMITED.
AIR FORCE RESEARCH LABORATORYAIR FORCE MATERIEL COMMANDEDWARDS AIR FORCE BASE CA 93524-7048

REPORT DOCUMENTATION PAGE Form ApprovedOMB No. 0704-0188
Public reporting burden for this collection of information is estimated to average 1 hour per response, including the time for reviewing instructions, searching existing data sources, gathering andmaintaining the data needed, and completing and reviewing this collection of information. Send comments regarding this burden estimate or any other aspect of this collection of information, includingsuggestions for reducing this burden to Department of Defense, Washington Headquarters Services, Directorate for Information Operations and Reports (0704-0188), 1215 Jefferson Davis Highway,Suite 1204, Arlington, VA 22202-4302. Respondents should be aware that notwithstanding any other provision of law, no person shall be subject to any penalty for failing to comply with a collection ofinformation if it does not display a currently valid OMB control number. PLEASE DO NOT RETURN YOUR FORM TO THE ABOVE ADDRESS.1. REPORT DATE (DD-MM-YYYY)03-02-1997
2. REPORT TYPEInterim Report
3. DATES COVERED (From - To) 28 Jul 1992 – 28 Feb 1997
4. TITLE AND SUBTITLEBasic Research in Electric Propulsion
5a. CONTRACT NUMBERF04611-93-C-0005
Part I: Pulsed Plasma Thruster Propellant Efficiency andContamination
5b. GRANT NUMBER
Part II: Arcjet Remote Plume Measurement and Hydrogen Density 5c. PROGRAM ELEMENT NUMBER62601F
6. AUTHOR(S)J.A. Pobst; G.G. Spanjers; I.J. Wysong; J.B. Malak
5d. PROJECT NUMBER30585e. TASK NUMBERRF5C5f. WORK UNIT NUMBER346069
7. PERFORMING ORGANIZATION NAME(S) AND ADDRESS(ES) 8. PERFORMING ORGANIZATIONREPORT NUMBER
Raytheon ITSSAir Force Research LaboratoryAFRL/PRS 10 E. Saturn Blvd.Edwards AFB CA 93524-76809. SPONSORING / MONITORING AGENCY NAME(S) AND ADDRESS(ES) 10. SPONSOR/MONITOR’S
ACRONYM(S)
Air Force Research Laboratory (AFMC)AFRL/PRSS 11. SPONSOR/MONITOR’S REPORT1 Ara Blvd. NUMBER(S)Edwards AFB CA 93524-7013 PL-TR-97-3027
12. DISTRIBUTION / AVAILABILITY STATEMENT
Approved for public release; distribution unlimited.
13. SUPPLEMENTARY NOTES
14. ABSTRACTPulsed Plasma Thrusters (PPT) have been the major technology under investigation for the Small Satellite Electric
Propulsion Thruster Research program. Arcjet technology is also under investigation with Electric Propulsion Space ExperimentOptical Signature experiments underway and Multiphoton Laser Induced Fluorescence Measurements of Ground State AtomicHydrogen have been performed in an arcjet plume. At present, PPTs are being tested in the laboratory environment withinvestigations under way to determine exact inefficiency mechanisms that can be corrected. This work has already identifiedpreviously unknown physical behavior in the PPT. The Electric Propulsion Space Experiment is a flight demonstration of a 30 kWammonia arcjet propulsion system. Optical measurements of the arcjet plume were performed using on-board optical equipment,ground observatories, and other space platforms. Low power arcjet technology provided definitive work on atomic species plumeconcentrations in low power hydrogen arcjet plumes. This work applied a flame diagnostic, Multiphoton Laser InducedFluorescence, to the excited-state plasma environment to investigate concentration levels of atomic ground-state hydrogen.
15. SUBJECT TERMSelectric propulsion; Pulse Plasma Thruster; PPT; satellite electric propulsion; Hall thruster; Electric Propulsion Space Experiment;ESEX; arcjet; plume measurement; hydrogen density; ammonia arcjet propulsion
16. SECURITY CLASSIFICATION OF: 17. LIMITATIONOF ABSTRACT
18. NUMBEROF PAGES
19a. NAME OF RESPONSIBLEPERSONDr. Carl Ousley
a. REPORT
Unclassified
b. ABSTRACT
Unclassified
c. THIS PAGE
UnclassifiedA 51
19b. TELEPHONE NUMBER (include areacode)(661) 275-6346
Standard Form 298 (Rev. 8-98)Prescribed by ANSI Std. 239.18


iii
TABLE OF CONTENTS
SUMMARY 1 PART I: PULSED PLASMA THRUSTER PROPELLANT EFFICIENCY AND CONTAMINATION Small Satellite Electric Propulsion Thruster Research 2
Introduction 2 Experimental Apparatus 3 Experimental Results 6 Summary 10
Contamination Measurements of a PPT Plume On-Board the MightySat II.1 Satellite 12
Introduction 12 Sensor Theory and Operation 12 Conclusions 17 Acknowledgments 17
PART II: ARCJET REMOTE PLUME MEASUREMENTS AND HYDROGEN DENSITY CONCENTRATIONS Electric Propulsion Space Experiment Optical Signature Experiments 19
Introduction 19 Video Camera 19 Remote Measurements 20 Conclusions 21
Multiphoton Laser Induced Fluorescence Measurements of Ground State Atomic Hydrogen in an Arcjet Plume 22
Introduction 22 Experiment 23 Results and Discussion 27 Conclusions 40
REFERENCES 42

iv
LIST OF FIGURES FIGURE CAPTION PAGE 1 Schematic Diagram of a Pulsed Plasma Thruster (PPT) 2 2 Vacuum Facility Newly Designed and Fabricated for PPT Research 4 3 XPPT-1 Pulsed Plasma Thruster 5 4 Layout of the Interferometer Diagnostic 6 5 PPT Current and Plasma Electron Density Variation with Varied Capacitance 7 6 Propellant Ablated and Maximum Plasma Density for Varied Discharge Energies and PPT Capacitances 8 7 Broadband Emission During (top) and 200 µs after (bottom) PPT Discharge 9 8 Late-time Emission with a Longer 200 µs Shutter Speed Shows Particulate Motion 9 9 SEM Image of PPT Exhaust Particulate Deposits 10 10 Quartz Crystal Microbalance (QCM) 13 11 Calorimeter 14 12 Sensor Panel Assembly (Dimensions in inches) 15 13 The ESEX On-Board Camera 19 14 ESEX Camera Field of View 20 15 Low Power Ammonia Arcjet Spectrum from 350 nm to 600 nm 21 16 Energy Level Schematic (not to scale) of the Hydrogen Atom, Showing the 2PLIF Diagnostic Technique 23 17 Experimental Apparatus 24

v
LIST OF FIGURES (cont) FIGURE CAPTION PAGE 18 Calibration Cell Schematic for In-situ Density Calibration 26 19 Determination of Atomic Hydrogen Density and Emitted Signal Through Titration of NO2 into Calibration Cell 27 20 Sample 2PLIF Spectrum of the Hydrogen Atom, Showing the Calibration Signal from the Discharge Cell and the Signal from the Arcjet Plume 28 21 Arcjet Study of LIF Signal Dependence on Laser Power Compared to ASE Power Dependence 29 22 Apparent Temperature for the Arcjet at Changing Laser Powers 29 23 Narrower ASE Spectrum Compared with LIF Spectrum 30 24 Profile Across Nozzle Exit Plane (0.4 mm from exit) of the Axial Velocity Component of the Ground State Hydrogen Atoms Containing Data From Several Different Days 32 25 Profile Across Nozzle Exit Plane (0.4 mm from exit) of the Radial Velocity Component of the Ground State Hydrogen Atoms Containing Data from Several Different Days 33 26 Profile Across Nozzle Exit Plane (0.4 mm from exit) of the Translational Temperature of the Ground State Hydrogen Atoms Containing Data from Two Different Days 33 27 Temperature Data Shown in Figure 26, with Corresponding Data (Same Arcjet Conditions, Same Profile Location) for LIF of the Electronically Excited Hydrogen Atoms24 and Raman Molecular Rotational Temperatures,10 Both from Stanford University 34 28 Fluorescence Decay for n=3 Hydrogen Atoms at Two Positions Along the Arcjet Nozzle Exit Plane 35 29 Fluorescence Lifetimes as a Function of Position Along Nozzle Exit from Many Different Days 36 30 Significance of Correcting for Quenching When Determining Density from a Relative Fluorescence Profile 37
vi
LIST OF FIGURES (cont)
FIGURE CAPTION PAGE 31 Profile Across Nozzle Exit Plane (0.4 mm from exit) of the Absolute Number Density of Ground State Hydrogen Atoms Containing Data from Two Different Days 37 32 Two Dimensional Profile Near the Arcjet Exit Plane of the Absolute Number Density of Ground State Hydrogen Atoms 39 33 Representation of Each "Spoke" of Data Taken in Figure 32 vs. Distance from Center 40 34 Centerline Density and Temperature Data Taken Axially from the Nozzle Exit 41
LIST OF TABLES TABLE CAPTION PAGE
1 Listing of Atomic and Molecular Density Data Near the Center of the 1 kW Class Arcjet Nozzle Exit for Three Modeling and Two Experimental Efforts 38

vii
GLOSSARY
AF Air Force ASE amplified spontaneous emission A/D converter analog to digital converter Å Angstrom c speed of light C capacitance, carbon CQ scaling factor D/A converter digital to analog converter E discharge energy EDAX A company name EP electric propulsion ESEX Electric Propulsion Space Experiment F fluorine H henries He helium HSTX Hughes STX Corporation (now Raytheon STX Corporation) Hα hydrogen Balmer alpha Isp specific impulse JPL Jet Propulsion Laboratory LES Lincoln Experimental Satellite LIF laser induced fluorescence Lβ hydrogen Lyman beta l/m liters per minute l/s liters per second M molar mass MHz megahertz MLI multi-layer insulation MPI multi-photon ionization N nitrogen NH
A hydrogen number density in arcjet NH
C hydrogen number density in cell NASA National Aeronautics and Space Administration NASA LeRC NASA Lewis Research Center ND neutral density NO nitrous oxide NO2 nitrogen dioxide Nd:YAG NeodymiumYttrium Aluminum Garnet laser NSTAR NASA Solar Electric Propulsion Technical Application Readiness Satellite nm nanometer ns nanosecond OH hydroxyl radical

viii
PDE plume diagnostic experiment PMT photomultiplier tube PPT pulsed plasma thruster PROM programmable read only memory PRT platinum resistance thermometers QCM quartz crystal microbalance RAM random access memory RTD resistive thermal device S signal size slm standard liters per minute SPA sensor panel A SPB sensor panel B STEP-3 Space Test Experiment Program STRV-2 Space Technology and Research Vehicle T temperature TGA thermogravimetric analysis torr torricelli TUVIR total ultraviolet irradiance radiometer v velocity V voltage VME Versa Module Euro VUV vacuum ultraviolet XPPT-1 Experimental Pulsed Plasma Thruster No. 1 XUV extreme ultraviolet 2PLIF 2-photon laser induced fluorescence λ wavelength µF micro Farad µg microgram µs microsecond ν wavenumber

SUMMARY Hughes STX research efforts in Electric Propulsion (EP) during the past three years can be divided into two major efforts involving different propulsion technologies. Pulsed Plasma Thrusters (PPT) have been the major technology under investigation for the Small Satellite Electric Propulsion Thruster Research program and contamination measurements of PPT plumes are being planned for flight on-board the MightySat II.1 satellite. Arcjet technology is also under investigation with Electric Propulsion Space Experiment Optical Signature experiments under way and Multiphoton Laser Induced Fluorescence Measurements of Ground State Atomic Hydrogen having been performed in an arcjet plume.
The Small Satellite Electric Propulsion Thruster Research program has begun to focus on low power electric propulsion devices that are appropriate for satellites with less than 500 watts of power or less than 300 kg in mass. Two thruster concepts are being pursued under this program due to their complementary nature. The pulsed plasma thruster (PPT) is appropriate for satellites with less than 100 watts of power. The low power Hall thruster appears to be the optimal solution in specific impulse and thrust for many small satellites, but it is expected that this technology will not adequately scale to powers less than 200 watts.
At present, pulsed plasma thrusters are being tested in the laboratory environment with
investigations under way to determine exact inefficiency mechanisms that can be corrected. This work has already identified previously unknown physical behavior in the PPT.
PPT’s are also scheduled to fly on MightySat II.1. The current iteration of PPT
technology has not been flight-proven, and as of yet, no version of a PPT has been flight tested for determination of plume contamination to nearby spacecraft optical surfaces. The Plume Diagnostic Experiment (PDE) will fly on MightySat II.1 and will be operated and designed by Hughes STX and the Phillips Laboratory in conjunction with NASA’s Jet Propulsion Laboratory (JPL).
The Electric Propulsion Space Experiment (ESEX) is a flight demonstration of a 30 kW
ammonia arcjet propulsion system. Hughes STX researchers have been instrumental in preparing for this scientific space experiment. In particular, optical measurements of the arcjet plume will be performed using on-board optical equipment, ground observatories, and possibly other space platforms. A description of the optical signature experimental plan is included in this report.
Low power arcjet technology has been the primary focus of the Air Force Office of
Scientific Research’s electric propulsion research program for the past few years and Hughes STX researchers at Phillips Laboratory’s Electric Propulsion Laboratory and Combustion Laboratory have provided the definitive work on atomic species plume concentrations in low power hydrogen arcjet plumes. This work has applied a flame diagnostic, Multiphoton Laser Induced Fluorescence, to the excited-state plasma environment to investigate concentration levels of atomic ground-state hydrogen. The results of applying this diagnostic tool in the arcjet environment are reported.
1

REPORT DOCUMENTATION PAGE Form Approved OMB No.0704-0188
Public reporting burder for this collection of information is estibated to average 1 hour per response, including the time for reviewing instructions, searching existing data sources, gathering and maintaining the data needed, and completingand reviewing this collection of information. Send comments regarding this burden estimate or any other aspect of this collection of information, including suggestions for reducing this burder to Department of Defense, WashingtonHeadquarters Services, Directorate for Information Operations and Reports (0704-0188), 1215 Jefferson Davis Highway, Suite 1204, Arlington, VA 22202-4302. Respondents should be aware that notwithstanding any other provision oflaw, no person shall be subject to any penalty for failing to comply with a collection of information if it does not display a currently valid OMB control number. PLEASE DO NOT RETURN YOUR FORM TO THE ABOVE ADDRESS.
1. REPORT DATE (DD-MM-YYYY)01-02-2002
2. REPORT TYPEInterim rept.
3. DATES COVERED (FROM - TO)28-07-2000 to 28-02-1997
4. TITLE AND SUBTITLEBasic Research in Electric Propulsion. Part I: Pulsed Plasma Thruster PropellantEfficiency and Contamination. Part II: Arcjet Remote Plume Measurement andHydrogen DensityUnclassified
5a. CONTRACT NUMBERF04611-93-C-00055b. GRANT NUMBER5c. PROGRAM ELEMENT NUMBER
6. AUTHOR(S)Pobst, J. A. ;Spanjers, G. G. ;Wysong, I. J. ;Malak, J. B. ;
5d. PROJECT NUMBER5e. TASK NUMBER5f. WORK UNIT NUMBER
7. PERFORMING ORGANIZATION NAME AND ADDRESSRaytheon ITSSAir Force Research Laboratory (AFRL/PRS)10 E. Saturn Blvd.Edwards AFB, CA93524-7680
8. PERFORMING ORGANIZATION REPORTNUMBER
9. SPONSORING/MONITORING AGENCY NAME AND ADDRESSAir Force Research Laboratory (AFMC)AFRL/PRSS1 Ara Blvd.Edwards AFB, CA93524-7013
10. SPONSOR/MONITOR'S ACRONYM(S)11. SPONSOR/MONITOR'S REPORTNUMBER(S)
12. DISTRIBUTION/AVAILABILITY STATEMENTAPUBLIC RELEASE,13. SUPPLEMENTARY NOTESCATALOGERS: In block 2 of dates covered, should be from 1992.14. ABSTRACTSee report.15. SUBJECT TERMS16. SECURITY CLASSIFICATION OF: 17. LIMITATION
OF ABSTRACTPublic Release
18.NUMBEROF PAGES54
19. NAME OF RESPONSIBLE PERSONEM142, (blank)[email protected]
a. REPORTUnclassified
b. ABSTRACTUnclassified
c. THIS PAGEUnclassified
19b. TELEPHONE NUMBERInternational Area CodeArea Code Telephone Number703767-9007DSN427-9007
Standard Form 298 (Rev. 8-98)Prescribed by ANSI Std Z39.18

PART I: PULSED PLASMA THRUSTER PROPELLANT EFFICIENCY AND CONTAMINATION
Small Satellite Electric Propulsion Thruster Research
Introduction This program was initiated in the fall of 1995 to advance Electric Propulsion (EP) thruster concepts appropriate for small, power-limited satellites ranging in size from 300 kg to possibly less than 20 kg. After evaluating immediate Air Force (AF) needs, it was determined that research would focus on the 200 W Hall thruster and the Pulsed Plasma Thruster (PPT). The Hall thruster is appropriate for satellites over 100 kg while the PPT has the unique ability to scale to arbitrarily small sizes and power levels. Experimental research for this reporting period has focused on the PPT. Hall thruster research was scheduled to commence in January 1997. The Pulsed Plasma Thruster (PPT) has reemerged as an attractive electric propulsion option for small, power-limited satellites. The PPT, shown schematically in Figure 1, uses a solid Teflon™ propellant that is passively fed between the discharge electrodes by a linear spring. An integrated capacitor is discharged across the Teflon™ propellant face in an arc initiated by a lower energy spark plug discharge. The main advantage of the PPT is its engineering simplicity which leads to high reliability. This reliability has been demonstrated by the successful application of PPTs in more than 20 space missions since 1964. The PPT’s main disadvantage is its poor performance. Operating near the optimal specific impulse (Isp) for on-orbit applications (1000 s - 2000 s), the PPT has achieved efficiencies of only 5% to 10%.
Figure 1: Schematic Diagram of a Pulsed Plasma Thruster (PPT)
The goal of HSTX research at the EP Lab is to develop and demonstrate a next-generation PPT that greatly exceeds present designs in terms of performance, mass, and versatility, while retaining all of its excellent engineering characteristics. To accomplish this goal HSTX researchers are pursuing the following tasks:
2

1). Design and fabricate vacuum facilities, plasma diagnostics, and experimental PPTs required for the research,
2). Perform detailed measurements of the plasma formation and dynamics within the PPT, 3). Use these measurements to develop physics models for the mechanisms responsible for
the low PPT efficiency, 4). Based on the models, develop and test next-generation PPT thrusters, and 5). Transfer the next-generation thruster to the EP Lab engineering teams for integration and
eventual on-orbit testing of the PPT on an AF MightySat Spaceflight. Based on previous experimental results, poor PPT efficiency can be attributed equally to poor propellant efficiency and poor energy efficiency. The initial stages of the PPT research discussed here primarily concern the propellant efficiency. Low propellant efficiency is believed to result from a multi-component exhaust. A small portion is efficiently accelerated as a plasma, electromagnetically, to a high 4000 s Isp. A larger portion inefficiently expands from the PPT gas dynamically to a low 300 s Isp. Although neither component has been directly measured or observed, up to 90% of the propellant is thought to be consumed in the low efficiency gasdynamic component. The first experimental observation of the two plasma components has shown the slow component to be a direct result of late-time vaporization. A third exhaust component, particulates, has been identified. They consume approximately 30% of the propellant and provide minimal thrust. Experimental Apparatus Previous EP Lab research focused primarily on arcjet thrusters. The change in focus to the PPT required major facility and diagnostics changes. The PPT thruster itself also posed challenges. They were never produced commercially and, until recently, none had been fabricated since the mid 1970s. To conduct the proposed basic research, an experimental-class PPT had to be designed and fabricated in-house. Vacuum Facilities. A new facility, Chamber 5, was designed and fabricated. The chamber, shown in Figure 2, is 1.2 m in diameter and 1.8 m in length and has excellent diagnostic access for research on both PPT and Hall low-power electric thrusters. Presently, the chamber is evacuated using a 1400 l/s turbomolecular pump backed by a rotary mechanical pump. Base pressures of 3 x 10⁻⁵ torr are typical. Once completed, the system will be evacuated by two 1400 l/s turbomolecular pumps backed by a 2-stage mechanical pump (1420 l/m). The completed facility is expected to achieve base pressure in the 10-7 torr range.
3
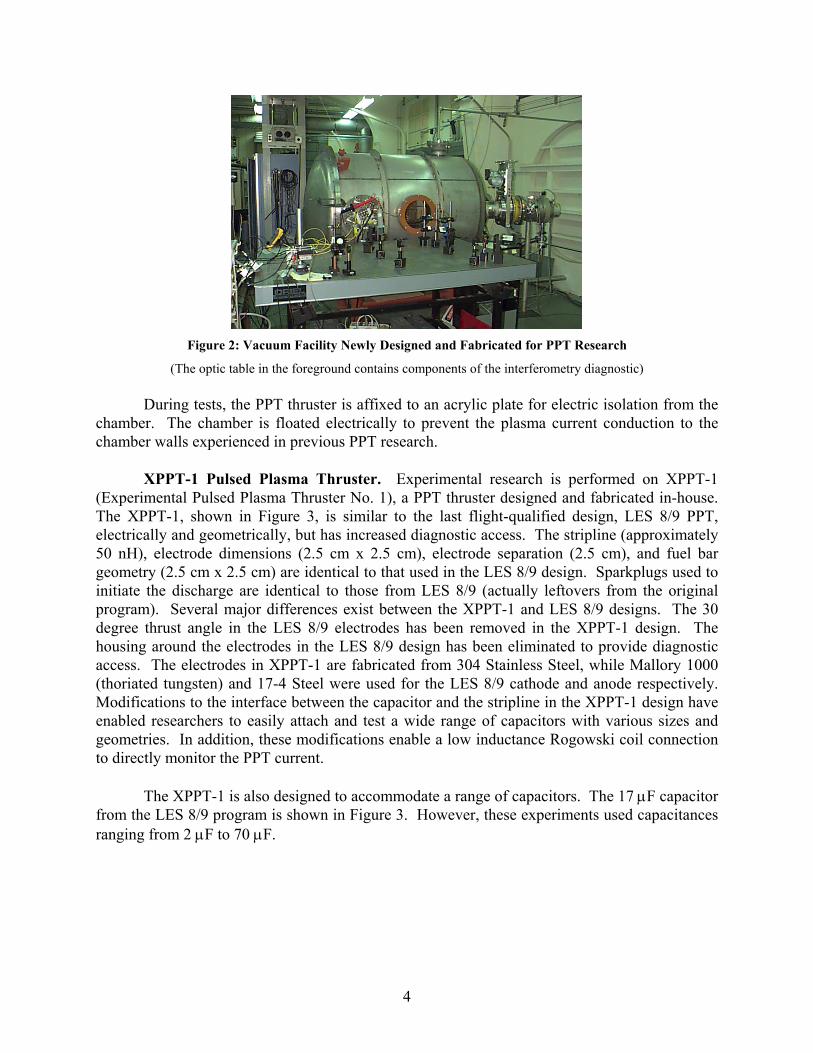
Figure 2: Vacuum Facility Newly Designed and Fabricated for PPT Research
(The optic table in the foreground contains components of the interferometry diagnostic)
During tests, the PPT thruster is affixed to an acrylic plate for electric isolation from the chamber. The chamber is floated electrically to prevent the plasma current conduction to the chamber walls experienced in previous PPT research. XPPT-1 Pulsed Plasma Thruster. Experimental research is performed on XPPT-1 (Experimental Pulsed Plasma Thruster No. 1), a PPT thruster designed and fabricated in-house. The XPPT-1, shown in Figure 3, is similar to the last flight-qualified design, LES 8/9 PPT, electrically and geometrically, but has increased diagnostic access. The stripline (approximately 50 nH), electrode dimensions (2.5 cm x 2.5 cm), electrode separation (2.5 cm), and fuel bar geometry (2.5 cm x 2.5 cm) are identical to that used in the LES 8/9 design. Sparkplugs used to initiate the discharge are identical to those from LES 8/9 (actually leftovers from the original program). Several major differences exist between the XPPT-1 and LES 8/9 designs. The 30 degree thrust angle in the LES 8/9 electrodes has been removed in the XPPT-1 design. The housing around the electrodes in the LES 8/9 design has been eliminated to provide diagnostic access. The electrodes in XPPT-1 are fabricated from 304 Stainless Steel, while Mallory 1000 (thoriated tungsten) and 17-4 Steel were used for the LES 8/9 cathode and anode respectively. Modifications to the interface between the capacitor and the stripline in the XPPT-1 design have enabled researchers to easily attach and test a wide range of capacitors with various sizes and geometries. In addition, these modifications enable a low inductance Rogowski coil connection to directly monitor the PPT current. The XPPT-1 is also designed to accommodate a range of capacitors. The 17 µF capacitor from the LES 8/9 program is shown in Figure 3. However, these experiments used capacitances ranging from 2 µF to 70 µF.
4

Figure 3: XPPT-1 Pulsed Plasma Thruster
Plasma Diagnostics. Several plasma diagnostics were brought on-line in the EP Lab for use in PPT research. These include quadrature heterodyne interferometry, magnetic field probe arrays, high speed photography, and miniature Faraday cup arrays. As a direct result of this diagnostic development, the PL EP Lab presently has the most advanced PPT facility in the country for basic physics research. To remain on the cutting edge of research, efforts are continuing to develop and field advanced diagnostics. The interferometer has been upgraded from single position to two position (and will be upgraded to three position in the near future). A 2-dimensional heterodyne interferometer under development is designed to have capabilities unprecedented in any plasma physics laboratory. Resonant laser diagnostics development is also ongoing. Fiber optic sensors are being explored for temperature, magnetic field, and possibly thrust measurements. The goal is to achieve a diagnostic capability that will enable an immediate and accurate assessment of the viability of advanced PPT designs. Based on previous PPT development, measuring improved performance for a new thruster design is insufficient. It is crucial to know why a new design has improved performance. The most valuable of the new diagnostics has been the quadrature-heterodyne interferometer used to measure the plasma and neutral gas densities. The neutral gas measurement was used in the first observation of the late-time vaporization. The plasma density measurement is assumed to be indicative of efficient acceleration of propellant mass and was used to determine the effects of varied capacitance and energy on propellant efficiency. In the interferometer, an acousto-optic modulator (Bragg cell) splits the 35-mW HeNe laser (633 nm) into reference and scene beams with a 40 MHz shift in the reference beam to facilitate heterodyne phase detection. The scene beam is passed through the plasma parallel to the electrodes and fuel bar face at specified measurement locations. The beams are recombined,
5

attenuated (3 ND) and directed to the active area of a photodiode. Attenuation is variable and adjusted to keep the photodiode/amplifier below saturation. The photodiode current is amplified at 100 kV/A, filtered at 40 MHz with a 10 MHz bandpass and analyzed using an analog phase detection system with 10.7 MHz filtering, as shown in Figure 4. The detection system was assembled in-house from discreet analog components (detector, amplifier, power splitter, double-balanced mixers, and filters).
Figure 4: Layout of the Interferometer Diagnostic
Single point interferometry measurement was used. Recently, the diagnostic was upgraded to multi-point measurements to achieve a plasma velocity measurement from time of flight. Experimental Results Three principle experiments have been pursued since the vacuum system became operational in June 1996. Each of these experiments is discussed and results of major importance to the PPT research community given. Effect of Capacitance and Energy on PPT Performance. This set of experiments was the first to explore available design options when the capacitance and discharge energy were varied. Once the thruster power is fixed by the satellite customer (100 W to use the MightySat satellite as an example), several PPT design options remain. The PPT can be fired with a discharge energy of 100 J @ 1 Hz, 10 J @ 10 Hz, 1 J @ 100 Hz, etc. Once the discharge energy is fixed, the capacitance can be varied by adjusting the charge voltage (E=CV2/2). Present theory predicts increased performance at higher discharge energy and no effect with varied capacitance.
6

The global effect of varying the capacitance is readily apparent in the PPT discharge current waveforms and maximum plasma density as shown in Figure 5 as expected. The smaller capacitance results in higher frequency current oscillations since the inductive load remains relatively fixed. The smaller capacitance also shows a significantly higher plasma electron density.
Cur
rent
(kA
)
-10
Ele
ctro
n D
ensi
ty
20
10
0
-20
Time (µs)
10
0
5
0 10 20
20 J
20 J
2 µF
10 µF20 µF
2 µF10 µF
20 µF
Figure 5: PPT Current and Plasma Electron Density Variation with Varied Capacitance
Figure 6 shows the total propellant mass ablated per discharge and the maximum plasma density for varied discharge energies and capacitances. Both are observed to scale linearly with discharge energy. Under the hypothesis that the fraction of mass accelerated efficiently is proportional to the plasma density, it is apparent that the propellant efficiency (which is essentially the ratio of the plasma mass to total ablated mass) is independent of discharge energy. This implies there is a fundamental maximum efficiency for a fixed PPT design, equal to the propellant efficiency (approximately 20%) that cannot be exceeded without a fundamental design change.
7

0
50
100
0 20 40 60 80 100
2
2 µF
10 µF 20 µF
2 µF 10 µF
20 µF
Energy (J)
Prop
ella
nt A
blat
ed /
Shot
(mg)
M
ax P
lasm
a D
ensi
ty (1
015
cm-3
)
Figure 6: Propellant Ablated and Maximum Plasma Density for Varied Discharge Energies and PPT
Capacitances
(The upper three are the plasma density traces, the lower three are the ablated mass traces)
The effect of capacitance is not as clear. Preliminary analysis indicates that a higher capacitance increases propellant efficiency. However, additional measurements are required before a definitive conclusion can be made. These tests, multi-point interferometry and thrust measurements, are currently being conducted. Interferometry measurements taken during this experiment showed a high density neutral gas in the thruster lasting 200 µs after the discharge current had dissipated. This is a propellant loss mechanism since, in the absence of PPT current, no electromagnetic forces are available to provide efficient acceleration. For confirmation, high-speed imaging of the plasma broadband emission was conducted. Figure 7 shows the emission from the PPT during the discharge and 200 µs after the discharge. The emission during the discharge shows an ablative stationary arc with plasma streaming from the thruster, essentially as expected. The emission after the discharge shows continued vaporization of the propellant. This is the first observation of late-time vaporization in a PPT and shows that steps to draw heat away from the propellant face after the discharge may significantly increase the thruster efficiency.
8

Figure 7: Broadband Emission During (top) and 200 µs after (bottom) PPT Discharge
Characterization of Particulate Emission in the PPT Exhaust. Late broadband emission shows large emission sites suggestive of molten particulates. To further investigate, the late-time emission of Figure 7 was reacquired with a much longer, 100 µs, shutter speed. This image, shown in Figure 8, clearly shows the motion of the particulate material.
Figure 8: Late-time Emission with a Longer 200 µs Shutter Speed Shows Particulate Motion
9

To substantiate the presence of particulates, an array of aluminum samples was placed in front of the thruster to collect exhaust deposits. SEM analysis of the samples showed the presence of a substantial number of particulate deposits, as shown in Figure 9. EDAX analysis of the deposits identified the material as the Teflon™ propellant. Quantitative analysis of the particulate distribution was performed by imaging the samples at several magnifications and simply counting the number of particles in various size groups. This analysis estimated that 30% of the propellant was consumed in the form of particulates. This experiment was completed and an article submitted for publication in the Journal of Propulsion and Power.
Figure 9: SEM Image of PPT Exhaust Particulate Deposits
Power Level Effects on Propellant Temperature and Ablation Rate. In general, the PPT community has presumed that propellant usage is only dependent on discharge energy. Thus, tests are commonly performed at power levels different from those expected to be used in space, with the measured performance scaled to the design power level. This is generally done to accommodate thrust stand requirements, which limit usable pulse frequencies (typically 0.5 to 2 Hz). HSTX research measurements have shown that propellant usage is dependent on both discharge energy and power level. Specifically, for a PPT operated at 20 J, 15.5 µg is ablated per discharge when operated at 1/8 Hz (2.5 W). When the power level is increased to 20 W (20 J @ 1 Hz), propellant usage increases to 23 µg per discharge. Presumably, the increased ablation rate at higher power levels results from an increased fuel bar temperature. This implies that the PPT will suffer a significant decrease in efficiency at higher power levels. Current tests measure the temperature within the propellant bar during PPT discharge and measure mass ablation to support the initial findings. If confirmed, this finding has the potential to impact the direction of future PPT research. Summary In November 1995, HSTX researchers at the EP Lab initiated a program to develop electric propulsion thrusters suitable for small, power-limited satellites. The program quickly focused on the PPT and the Hall thruster. A new experimental facility and experimental PPT
10

thruster became operational in June 1996. Hall thruster research is scheduled to commence in January 1997. Since its inception, the program accomplishments include: 1. A PPT thruster, plasma diagnostics, and vacuum chamber became operational in June 1996.
A PPT thrust stand was delivered and installed. 2. The first experimental observation of late-time propellant vaporization showed it contributes
significantly to low propellant efficiency. This phenomenon has been predicted but is only detectable using the new EP Lab advanced diagnostics.
3. An energy scaling of PPT exhaust components shows that propellant efficiency does not increase with increase discharge energy. Previous researchers thought that increased discharge energy was the avenue to improved performance. However, the EP Lab results show that the ultimate efficiency using this method will remain below 20%. A major PPT redesign is required to significantly improve performance.
4. Scaling of PPT exhaust with capacitance shows a strong dependence in contradiction to present theory. Additional measurements are being performed before a definitive conclusion concerning the optimum design capacitance can be made.
5. Particulates were observed in the PPT exhaust for the first time. This effect had not been previously measured or predicted. Characterization shows that particulates account for approximately 30% of the total propellant usage indicating that particulates are a significant contributor to propellant inefficiency.
6. Propellant usage increases disproportionately with thruster power indicating that thrust efficiency may decline at increased power. The first temperature measurements within the propellant bar may give insight to explain why the effect occurs.
These accomplishments were reported in the following publications: 1. “Propellant Losses Because of Particulate Emission in a Pulsed Plasma Thruster”, Gregory.
G. Spanjers, Jason. S. Lotspeich, Keith. A. McFall, and Ronald. A. Spores. Journal of Propulsion and Power, Volume 14, Number 4, July-August 1998, pg 554-559.
2. “Investigation of Propellant Inefficiencies in a Pulsed Plasma Thruster,” 32nd AIAA/ASME/SAE/ASEE Joint Propulsion Conference AIAA Paper 96-2723, Lake Buena Vista, Florida, July 1-3, 1996.
3. “Effect of Propellant Temperature on Efficiency in the Pulsed Plasma Thruster”, Gregory. G. Spanjers, Jamie. B. Malak, R. J. Leiweke, Ronald. A. Spores. Journal of Propulsion and Power, Volume 14, Number 4, July-August 1998, pg 545-553.
11

Contamination Measurements of a PPT Plume On-Board the MightySat II.1 Satellite Introduction
Pulsed Plasma Thrusters were baselined for use in the Air Force MightySat II.1. Because of their high specific impulse and control authority due to a small impulse-bit, PPTs have also been identified as desirable for many other small satellite missions. An enduring concern shared by potential users of PPT technology is plume contamination of sensitive spacecraft surfaces. The PPT’s solid Teflon™ fuel ablates into a variety of products including high velocity ionic species (C, F, CF, etc.) as well as slower high molecular weight species (CF4, C2F4, C3F6, etc). The objectives for the plume diagnostics experiment (PDE) aboard the MightySat II.1 spacecraft are fourfold; 1) to provide unambiguous assessment of PPT effects on optical systems, 2) to provide correlation with ground-based PPT plume effects measurements, 3) to provide validation of numerical simulations currently under development, and 4) to develop a low-cost, easily integrated contamination monitoring package.
The PDE consists of two sensor packages each containing a quartz crystal microbalance
(QCM), calorimeter pair. These two sensors will collectively provide valuable information regarding contamination and effects of the PPT plume on spacecraft surfaces. The information gathered will be used in conjunction with ground tests to be conducted at NASA LeRC evaluating the effects of plume contamination on materials representative of spacecraft optical surfaces.
Each sensor package is a standalone unit which will contain a QCM and a calorimeter sensor on an aluminum plate mounted on an external surface of the spacecraft bus. Electronics to support signal conditioning, temperature control, analog to digital conversion and serial communication with the spacecraft will be located on a single card mounted in the card cage within the bus. The electronics will include a small micro-controller programmed to convert simple commands into the desired detector functions.
After analysis, the combined output of the QCM and calorimeter data will provide a
quantitative measure of contamination in terms of material deposited per unit time as well as the cumulative effect of the deposited material on surface absorptivity and emissivity. Sensor Theory and Operation
Quartz Crystal Microbalance (QCM). In a QCM, two piezoelectric quartz crystals are excited by an external circuit to their resonant frequency which can range from 10 MHz up to 25 MHz. One of these crystals, referred to as the "sense" crystal is exposed to the potential contamination source while a "reference" crystal is enclosed in the housing and protected from any contamination (see Figure 10). The frequency of the crystal is dependent on its mass, which will change as any coating accumulates on its surface. As material is deposited on the sense crystal, its frequency decreases and the resulting beat frequency between the two crystals is measured by an external counter. This frequency can then be correlated to the deposited mass. It is important that the sense and reference crystals be identical to minimize any error due to natural frequency dependence on temperature.
12

In a purely monitoring mode, the QCM is used to correlate mass accumulation as a
function of time with any specific events of interest in the mission timeline such as thruster firings. In addition, the sense crystal can be heated to bake off material and clean its surface. This is useful in the unlikely event the crystal is saturated, but can also be used to perform thermogravimetric analysis (TGA). In a TGA, the crystal is heated in a carefully controlled manner in such a way that discrete changes in frequency can be identified with specific constituents with known vapor pressures.
For the PDE, the QCMs will be Mark 16 devices made by QCM Research in Irvine,
California. These sensors have a crystal frequency of 10 MHz with a maximum mass sensitivity of 4.42 • 10-9 g/cm2-Hz (at 10 K). The 1.5 W heater is capable of raising the crystal temperature to 398 K with the case flange maintained at 10 K. Each unit has a mass of approximately 29 grams.
���������������
������������������
SENSE CRYSTAL
PRT TEMP SENS
HEATER
REF CRYSTAL
OSC-MIX
Figure 10: Quartz Crystal Microbalance (QCM)
Calorimeter (CAL). In a calorimeter, the temperature of a surface subject to contamination is accurately measured throughout the mission to determine the cumulative effects on surface thermal properties. A simplified schematic is shown in Figure 11. The two detector surfaces identified as the "disk" and "cup" are thermally isolated from the housing by kapton strips. Platinum Resistance Thermometers (PRT) are used to measure the disk and cup temperatures while minimizing any path for heat leakage to the surrounding structure. While the mechanical design of the calorimeter is relatively simple, the analysis and interpretation of the calorimetric data can be complex.
13

HEATER
PRT TEMP SENSKAPTON STANDOFF
DISKCUP
Figure 11: Calorimeter
To determine the changes in absorptivity and emissivity of the original coating, it is necessary to know the insolation history throughout the mission. A knowledge of angle with respect to the sun or other warm bodies (such as the earth) within ±1 degree is desirable. A thermal radiation model for the calorimeter is necessary to relate the measured temperatures to radiant sources as functions of the unknown absorptivity and emissivity and the known physical properties of the disk and cup. Calorimeters will not reach thermal equilibrium during an orbit requiring the analysis models to be transient. To simplify this analysis and reduce uncertainty in the data, it is desirable to have as close to a 2π steradian clear field of view as possible. If this is not feasible, then the thermal radiation model will need to be more complex in order to account for warm spacecraft surfaces with their corresponding view factors before the data can be interpreted.
In constructing a heat balance for the disk, the conduction heat loss to the sensor housing and spacecraft can introduce significant uncertainty. The cup temperature will lie somewhere between the disk temperature and the housing temperature. Knowledge of the disk and cup temperatures facilitates evaluation of a dominant term in the energy balance, namely heat flow to the sensor housing and to the spacecraft body.
The calorimeter is equipped with a single resistance heater which serves multiple
functions. It can be used to bake out the disk and remove deposited material if necessary as well as maintain the sensor above a predetermined survival temperature of roughly –65° C. In operation, the heater can be used to heat the disk to a predetermined temperature and then shut off. This is done while the sensor is in the eclipse portion of the orbit. From the rate of decay of the disk temperature, it is possible to uniquely determine the emissivity. This information can then be used in conjunction with the heat balance to uniquely determine absorptivity.
Sensor Panels. An assembled PDE sensor assembly is shown in Figure 12. The two sensors, mounted on a single plate, are mounted to the spacecraft structure with four cylindrical standoffs. The baseline design consists of an all aluminum panel. Thermal analysis may indicate that a fiberglass material such as G10 may be advantageous to minimize heat leakage to the mounting surface. Not shown in the figure is a blanket of multi-layer insulation (MLI) which encloses the area below the plate surface.
14

1.375
3.655
2.300
Figure 12: Sensor Panel Assembly (Dimensions in inches) Electronics. The supporting electronics for the two sensor packages are located on a
single standard 6U form factor card located in the bus card cage. This is a non-VME card and is not connected to the VME backplane. Regulated electrical power of +/- 15 and 5 V is supplied directly from the bus to the card. The components on the card consist of a microcontroller, RAM, PROM, as well as A/D and D/A converters. The microcontroller, RAM, PROM, and A/D and D/A converters are radiation-hardened parts. The specific design is a more reliable version of the Telemetry Modules used on STEP-3, STRV-2 and NSTAR.
The 8051 microcontroller provides communication to and from the spacecraft computer and accomodates limited data storage and command processing. It also performs the frequency counting and A/D conversion for the temperature sensing elements. The signal conditioning circuitry provides reference currents for the RTD thermal sensors and provides scale and gain factors for the RTD signals to enable detection by the A/D converter. Additional signal conditioning circuitry is used to perform D/A conversion for the sensor heaters and condition pulse waveform output from the QCMs.
Data Aquisition. The microcontroller will be capable of a sampling rate of 1 Hz. Each sample or data "frame" consists of sixteen 16-bit words. The sensors will operate at one of two data collection rates. In the high rate mode, samples are taken once every 15 seconds resulting in a data rate of 7680 bytes/hr per sensor package. In the low rate mode, samples are taken once every 15 minutes for a data rate of 128 bytes/hr per sensor package.
15
16
The nominal duty cycle for a 24-hr. period consists of 4 hours of high rate operation and 20
hours of low rate operation. This will be modified for special operations such as sensor bakeouts or TGAs.
Assuming the nominal duty cycle, a total for both sensor packages of 66.56 kbytes of data are
collected in a 24-hr period. The microcontroller will be able to store 68 kbytes or one day's worth of data as a minimum between downloads to the spacecraft memory. A TGA cycle would be performed over a 4-hr period during which data is collected at the high rate resulting in 30.72 kbytes of collected data.
Flight Operations. The two sensor panels are located on opposite faces of the spacecraft bus. Sensor Panel A (SPA) is located on the same face as the PPT and is normally not sun pointing. Sensor Panel B (SPB) is located on the TUVIR (Total UltraViolet Irradiance Radiometer) payload side (+Z) and is sun pointing a majority of the time. In general, a TGA operation serves to clean the sensors while collecting useful data. Bakeouts (without data collection) and standby mode (survival power only) are used on an as needed basis.
During periods of thruster operation, the spacecraft will be oriented so that SPA has sun
exposure for a minimum of 2 minutes per 24 hour period. During the 6 months of primary science data collection, SPA will be exposed to the sun for a minimum of 2 minutes per week.
Data Analysis. The data collected from the QCM consists of the sensor-reference crystal beat
frequency. The sensor crystal frequency decreases as material is deposited on its face resulting in an increase in the beat frequency. The beat frequency is a known function of sensor crystal mass and can therefore be plotted as a function of time to determine trends in mass accumulation. This data can be correlated with thrusting and nonthrusting periods to assess plume deposition rates.
During TGA operations, the beat frequency is plotted as a function of temperature as the QCM
temperature is slowly increased. The derivative of this curve represents the evaporation rate of deposited material as a function of temperature. Material composition can be determined by comparing observed peaks in the evaporation rate vs. crystal temperature curve with those predicted from known vapor pressure data.
As the sense crystal is exposed to the sun or other thermal sources, a thermal gradient is created which will tend to increase the sense crystal frequency and decrease the beat frequency. Knowing the insolation history, one can either attempt to correct for these transients or simply include the effects in the data uncertainty.
For the calorimeter, the data analysis involves using a transient radiation model along with the
insolation history. The cup and disk temperature is used along with this model to assess cumulative changes in hemispherical absorptivity and emissivity throughout the mission. By heating the disk to a specified temperature and then letting the temperature decay with time, an independent determination of

17
emissivity can be made. This operation is performed during portions of an orbit when the calorimeter is not subject to solar illumination and a minimum of other thermal sources (i.e. the Earth). Knowing absorptivity and emissivity, the changes to the transmissivity of the surface can be estimated. Conclusions A contamination sensor design for the MightySat II.1 flight has been designed by engineers at the Jet Propulsion Laboratory and a researcher on the Hughes STX contract. This sensor will be flown on the Phillips Laboratory satellite to measure PPT plume contamination effects in space onto optical surfaces. This effort has been reported in one publication so far and it is anticipated that future articles will be written as the program progresses. Acknowledgments
This section is based upon an internal proposal developed at the Jet Propulsion Laboratory by John Blandino, Mike Henry, and Dave Brinza. The proposal details plans developed jointly by Hughes STX, the Air Forces Research Laboratory (formerly Phillips Laboratory) Propulsion Directorate, and JPL.

18
This page left intentionally left blank

PART II: ARCJET REMOTE PLUME MEASUREMENTS AND HYDROGEN DENSITY CONCENTRATIONS
Electric Propulsion Space Experiment Optical Signature Experiments
Introduction
Optical measurements for the Electric Propulsion Space Experiment (ESEX) are collected
by both local and remote observation. A video camera with a single shot frame grabber and spectral notch filter is included in the ESEX flight package for on-board examination of the arcjet thruster and near-field plume. Ground observation sites and space-based sensors are currently being evaluated for remotely observing the ESEX unit when the arcjet is firing and taking measurements of the bright arcjet plume. Intended remote measurements include spectroscopy, imaging, and narrow-band photometry.
The objective of this study is to characterize thruster inefficiencies and energy loss mechanisms occurring inside the thruster nozzle by observing the arcjet plume. Video Camera
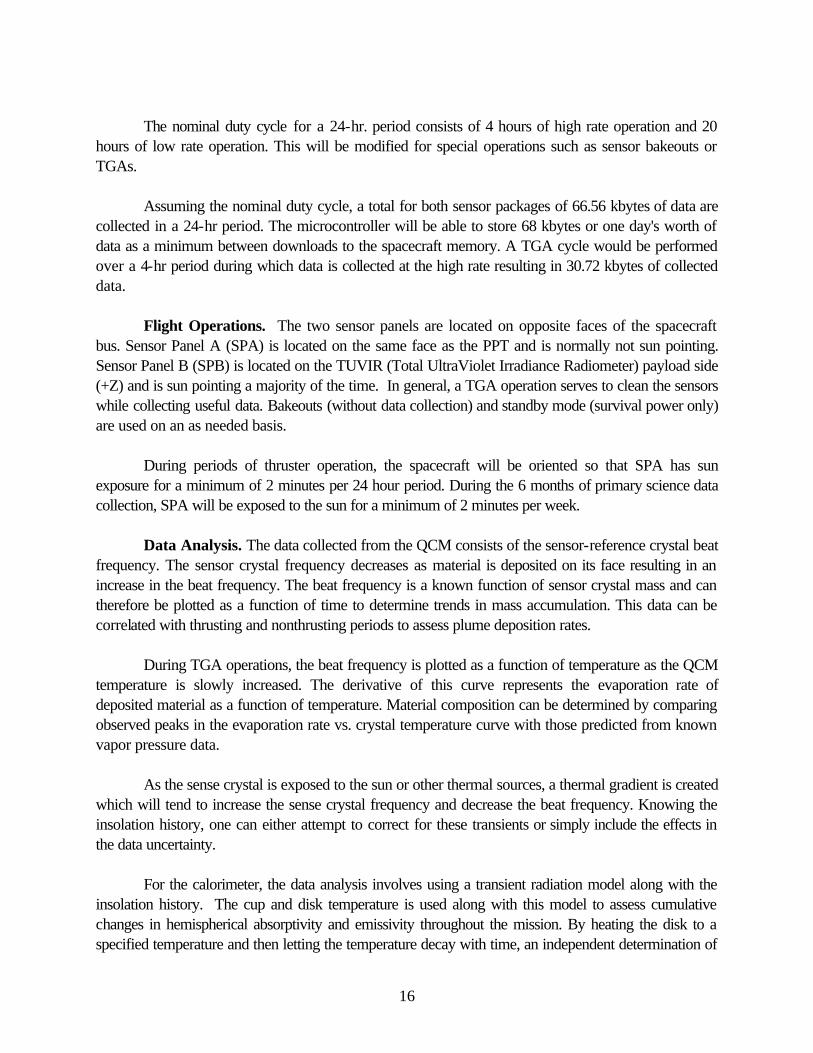
The on-board video camera will be used to study the plume luminescence through a Hydrogen Balmer-alpha (H-α) notch filter at 656 nm (see Figure 13). This filter was chosen to observe the H-α transition of the atomic hydrogen species in the plume, the most intense visible transition observed during ground testing. Observation of up to 30 cm of plume emission will also provide an indication of plume directionality and stability. Additionally, luminescence from the anode will be in the camera’s field of view (see Figure 14) and an anode temperature can be inferred observing the intensity of the gray body emission in the notch filter’s bandpass range
Figure 13: The ESEX On-Board Camera The camera will gather and store up to 22 grayscale (16 levels of gray) frames during each
arcjet firing using frame grabber hardware. These frames will be transmitted to the ground for subsequent analysis and to document the thruster firing. The camera and frame grabber were from the STEP program.
19
Figure 14: ESEX Camera’s Field of View
Camera
Arcjet
Remote Measurements
Air Force observatories generally provide three scientific data products when viewing space objects: orbital metrics of the object, contrast mode photometry to measure reflected light off of an object, and imagery of the space object being tracked. Orbital metric measurements can be useful to ESEX as they may provide additional independent assessment of thruster performance. Photometry and imagery can each contribute to the characterization of the plume emission, especially if spectral filters related to plume excitation transitions and anode emission are appropriately used.
Most desirable for understanding the physical processes in the arcjet plume is spectroscopic resolution of arcjet plume emission. Spectral measurements of plume emission will be made remotely, if possible, to investigate thruster internal efficiency loss processes.
Spectral observations of ESEX-class thrusters have been previously performed in ground-based facilities. Unfortunately, thruster plume emission, which is considerable from 325-900 nm, is compromised in ground tests of these thrusters due to the limited throughput of realistic vacuum facilities at the propellant flow rate required for high-power arcjets (around 240 mg/s for ESEX).
Figure 15 shows an example of spectroscopic measurements made in a vacuum chamber at Aerospace Corporation on a 1 kW ammonia arcjet plume from 350 nm to 600 nm at various distances from the thruster. Note that although the beta line of the hydrogen balmer series at 486 nm is one of the most intense lines in this range, lines due to N2, NH, and even N2
+ are visible.
Since only a relatively poor vacuum can be maintained during ground tests, flow in the plume is dominated by collisions and associated emission. Measurements taken on the ground therefore are dominated by plume collision processes rather than excitation processes interior to the thruster. In the space environment at 720 km altitude (450 nautical miles), the plume is expected to be significantly less collisional and emission is expected to reflect the character of internal thruster processes. For this reason, optical observations of the plume in space are expected to vary from those taken on the ground.
20

Figure 15: Low Power Ammonia Arcjet Spectrum from 350 nm to 600 nm
Note that due to atmospheric absorption, spectroscopy below 450 nm is quite difficult and below 350 nm essentially is impossible. Infrared spectroscopy is also limited to spectral “windows” in the atmosphere, limiting transitions that can be observed. One way to observe the arcjet plume and avoid atmospheric interference is to conduct the observation from a space-based platform in a similar orbit.
Ground observation to provide spectroscopy is also under investigation and national
observatory facilities at various locations are being evaluated for use in this experiment. Conclusions
A plan for examining the arcjet plume during the ESEX arcjet firings has been outlined and is being finalized. Equipment and facilities required to conduct this research have been identified. Launch of the ESEX experiment is currently scheduled for August 1997 and the effort described above is intensifying as the launch date draws near.
21

Multiphoton Laser Induced Fluorescence Measurements of Ground State Atomic Hydrogen in an Arcjet Plume
Introduction
Arcjets are expected to play an ever-increasing role to meet satellite propulsion needs, primarily stationkeeping and on-orbit maneuvering in the near term. While the technology is considered viable enough to be deployed on a Telstar IV communications satellite for stationkeeping,1 arcjet technology is far from maturity. To compete successfully with chemical propulsion systems for on-orbit missions, further improvements in arcjet propulsion systems are required.2 If needed improvements in the performance level and efficiency of arcjets are to be achieved, an increased understanding of the fundamental physical processes that govern arcjet operation is essential. In addition, an ability to predict the plume behavior of a space propulsion device is necessary for prediction and amelioration of spacecraft interactions.
Significant arcjet energy loss results from velocity profile losses due to thick internal boundary layers in the arcjet nozzle and from frozen flow losses such as molecular dissociation. To quantify profile losses, both gas velocity and density distributions must be known. Arcjet models, necessary for timely and cost-effective design improvements, must be tested by comparison of key physical parameters.
At present, only limited inroads have been made into the problems related to obtaining plume density measurements. For hydrogen arcjet thrusters, determination of species density has previously only been accomplished using a few diagnostic techniques.
Our previous work using multiphoton laser induced fluorescence (LIF) provided the first measurement of ground state hydrogen in an arcjet plume.3 Atomic hydrogen density profiles were reported near the nozzle exit and a preliminary calibration was performed to convert the relative density profiles to absolute number densities.
Knowledge of the atomic density profile at the nozzle exit is important for evaluating the physical processes in the arcjet thruster and the computational models that describe these processes.4-8 The density of atoms relative to the density of molecules is an indication of how much energy is lost into dissociation of the hydrogen molecules and not recovered through recombination into translational kinetic modes.
To determine the molecular dissociation fraction, both the molecular species density and atomic number density need to be known. The recent use of Raman spectroscopy9,10 in an arcjet plume has provided the first molecular hydrogen density data at the arcjet nozzle plane.
In addition to LIF on the ground state atoms, other absorption spectroscopy techniques11,12 have been used on arcjet plumes to characterize hydrogen atom densities. These VUV and XUV spectroscopy approaches are quite difficult to implement in practice and are limited to determination of line-of-sight averaged number densities at downstream locations in the plume where the optical depth is not too great.
22

For measuring velocity and temperature, both ground state LIF3 and excited state LIF4,13,14
have proven to be accurate and essentially nonintrusive. Though the excited states of hydrogen are more accessible, most atoms in the plume region are expected to be in the ground state. These two types of LIF temperature and velocity measurements allow examination of the differences between the excited state and ground state species in the non-equilibrium plume environment.
Experiment
This work is performed using two-photon LIF (2PLIF) on ground state hydrogen atoms in the plume of a 1-kW-class hydrogen arcjet. Since any propellant gas is opaque for the VUV radiation required for single-photon excitation of ground state atoms, 2PLIF at correspondingly longer wavelengths is preferred. The diagnostic technique, which has been developed primarily for use in flames,15-19 uses two photons at 205 nm to promote the atoms from the n=1 to the n=3 electronic state (the Lβ transition). Subsequent 3-2 fluorescence is observed (the Hα transition), as indicated in the energy level diagram in Figure 16.
1
2
34
205
205
656
Figure 16: Energy Level Schematic (not to scale) of the Hydrogen Atom, Showing the 2PLIF Diagnostic
Technique
The apparatus is shown schematically in Figure 17. The laser is a pulsed dye laser pumped
by a Nd:YAG with a repetition rate of 10 Hz and a pulse width of 6 ns. The dye laser output at 615 nm is frequency tripled to achieve about 0.5 mJ per pulse at 205 nm. A mirror turns about 80% of the beam toward the arcjet chamber through a variable attenuator placed in the beam, the remaining 20% of beam energy is directed toward a microwave-discharge source of atomic hydrogen.
23

Figure 17: Experimental Apparatus
For axial velocity measurements, the beam is sent directly down the axis of the arcjet flow
(Path 1) and focused with a telescope lens configuration (not shown) outside the chamber with a focal length on the order of 2 m. For radial measurements, the unfocussed beam is sent to a turning prism inside the chamber located underneath the arcjet (Path 2), directed to pass vertically through the plume, and focused by a 200 mm lens. The laser beam and optics remain fixed, while the arcjet is mounted on a motion control x, y, z stage to translate it for probing different regions of the plume.
A filtered photomultiplier tube (PMT) is placed behind the final turning mirror before the chamber to detect amplified spontaneous emission (ASE) that may propagate back along the laser beam path (see further discussion below). A 200 mm focal length, 2 in. diameter lens is placed inside the chamber to collimate the LIF that is emitted toward the side window. The light is collected outside the chamber, focused through a 1-mm aperture, and detected with a filtered, gated PMT. Since the LIF occurs at 656 nm, the filters used are a 656 nm bandpass interference filter and an RG 645 color glass filter (thus all scattered laser light (205 nm) is filtered out). The gated PMT is an ordinary Hamamatsu 928 tube with a special socket that is triggered to detect light for 2 µs during each laser pulse and is off between pulses. This is an important feature that allows us to operate the PMT at full voltage without exceeding the anode current limit due to the bright arcjet emission background. Saturation is avoided by setting the voltage level so that both average current and peak current during the gate remain below the maximum specified for the PMT. A gated integrator with a 30 ns gate is used to amplify and average the Hα fluorescence seen by the PMT. Alternatively, the PMT signal can be digitized by a fast oscilloscope to obtain fluorescence lifetimes and quenching information.
24

The weak UV beam that is sent into the discharge cell is focused with a 150 mm lens. The cell is run with a slow flow of a few torr of helium carrier gas and a few percent hydrogen. The LIF is detected through a filtered (ungated) PMT. Simultaneous detection of LIF from the cell during each spectral scan of the arcjet LIF provides a zero-velocity comparison from which to measure Doppler shifts. This discharge cell provides wavelength calibration but does not provide density calibration. A separate discharge cell calibrates density inside the chamber when the arcjet is not operating.
The procedure for obtaining absolute number density is based on a method reported by Meier et al.19-22 After a relative number density scan when corresponding lifetime data are taken, the arcjet is turned off and moved away from the collection volume, the chamber is opened, and a second calibration cell is placed in the detection volume with the laser beam passing through it. The LIF signal and lifetime is measured for the hydrogen atoms present in the cell. Atoms are present due to the flow of hydrogen gas through a microwave discharge prior to entering the cell. Since the laser beam, detection optics and electronics have remained the same, the LIF from the arcjet and from the cell will have the same proportionality to absolute number density after correcting for any differences in quenching:
N HA =
SA
SC ⋅ N HC ⋅CQ
(1)
SA and S
C are the signal sizes (integrated over the entire spectral width) from the arcjet and the
cell, NHA and NH
C are the absolute number densities of atomic hydrogen in the arcjet and the cell,
and CQ is the scaling factor for the difference in quenching. CQ is given by the ratio of fluorescence decay rate in the arcjet to that in the calibration cell.
The absolute number density of hydrogen atoms in the discharge cell is obtained using a standard chemical titration method. A schematic of the calibration cell used for this method is shown in Figure 18. The cell is composed of glass tubing and is approximately 30 cm (12 in.) long and 5 cm (2 in.) in diameter. Important to the cell design is the long drift tube area with a Teflon™ tubing liner to reduce gas/wall interactions. This drift tube allows complete mixing of the titration gas and the gas of interest. In this case, the titration gas is NO2 and H is the gas to be calibrated.
25

Figure 18: Calibration Cell Schematic for In-situ Density Calibration
The hydrogen (with a helium carrier gas) enters the drift tube area near one end after
passing through a microwave discharge. A dilute mixture of NO2 in helium is added to the flow through a long thin tube and enters the larger drift tube region at a location past the point where the hydrogen enters. This reduces the amount of NO2 that might diffuse upstream and enter the microwave discharge.
The NO2 reacts rapidly with hydrogen atoms when the two are completely mixed in the large drift tube volume. The calibration involved flowing 1 sl/min of a 2% hydrogen in helium mixture and then the addition of 2% NO2 in helium until the signal decreased, typically at about .08 sl/min of NO2/He. A small vacuum pump brought the cell pressure down to 950 Pa (7.2 torr) during gas flow.
The LIF signal decreases until it is gone at the point where the partial pressure of added NO2 is equal to the partial pressure of hydrogen atoms in the cell. Control of the amount of NO2 added allows the determination of the amount of hydrogen atoms present in the calibration cell. Figure 19 shows data from one calibration run. The NO2 concentration at the x intercept is equal to the concentration of atomic hydrogen present as each hydrogen atom is reacted away for each NO2 molecule added in the fast reaction:
H+NO2 → OH+NO
26

The large amount of buffer gas and low amount of H significantly reduce possible secondary reactions, making them negligible for the purposes of this experiment. Calibration took place either before or after each arcjet firing, usually on the same day.
Figure 19: Determination of Atomic Hydrogen Density and Emitted Signal Through Titration of NO2 into
Calibration Cell
All thruster data were taken on a 1-kW-class arcjet designed by NASA Lewis Research Center.1 The cathode gap was set to 0.07 in. The arcjet operated at 137V, 10A (1.37 kW) on a hydrogen gas flow of 13.1 mg/s (8.74 sl/min) at an operating chamber pressure of 6 Pa (45 mtorr). The gas flow and power were chosen to closely match the conditions under which the most complete set of previous diagnostic data for a 1 kW hydrogen arcjet were taken, to facilitate comparisons between different data sets and between data and models.9,14,23,24 A voltage-current curve of our arcjet, was shown in a previous publication.3 The hydrogen flow controller for the arcjet as well as the flow meters for the discharge cell were calibrated using a wet test meter.
Results and Discussion
Figure 20 shows a sample spectral scan of the hydrogen atom profile from the arcjet and from the discharge cell, taken with an axial laser beam. Each profile is fit to a Gaussian shape using a Levenberg-Marquardt least squares fit25 and the wavelength shift of the two centers yields the axial velocity, while the width of each Gaussian yields the temperature. A number of possible uncertainties enter into this analysis. A focused pulsed laser beam creates a very high instantaneous energy density, which is needed to excite the two-photon transition, but also may induce other nonlinear processes. Multi-photon ionization (MPI) will occur, and partial saturation of the transition becomes possible, even though the two-photon absorption cross section is very small. In addition, amplified spontaneous emission (ASE) will take place, since a population inversion is created between the pumped n=3 level and the nearly empty n=2 level. The population
27

inversion can cause gain to occur for any photon emitted in the forward or backward direction along the laser beam.26-28 If ASE or MPI become large, they become a non-negligible loss mechanism for the LIF process. Saturation will cause power broadening of the Doppler profile of the transition, and saturation, ASE or MPI will cause the power dependence of the LIF signal to deviate from the expected behavior proportional to power squared.
Figure 20: Sample 2PLIF Spectrum of the Hydrogen Atom, Showing the Calibration Signal from the Discharge
Cell and the Signal from the Arcjet Plume
We have performed a power-dependence study, which is summarized in Figures 21 and 22. We find that when the laser beam to the arcjet is attenuated to below 0.03 mJ per pulse for the radial beam, the LIF is proportional to the power squared, as indicated by the slope of 2 on a log-log plot. At these lower laser powers, the ASE signal has fallen away drastically from its large size and does not appear to attenuate the LIF signal. At higher laser powers, reduction in LIF signal from the power squared proportionality is observed. In addition, the temperatures measured (shown in Figure 22) appear to increase at higher laser powers where saturation broadening becomes a significant component of the linewidth. At lower powers, the temperature remains constant at its true value.
28

Figure 21: Arcjet Study of LIF Signal Dependence on Laser Power Compared to ASE Power Dependence
Figure 22: Apparent Temperature for the Arcjet at Changing Laser Powers
29

Figure 23 shows the differences in the lineshape between the measured ASE signal and the measured LIF signal in wavelength space. Due to these differences, compensating for the ASE loss mechanism through measurement of the ASE was deemed unreliable. Efforts were made to operate at laser powers where ASE loss was insignificant and did not cause a deviation from the power squared behavior in the LIF signal. The temperature and number density data presented here were all obtained with a laser energy of about 0.03 mJ per pulse. Lower laser powers were found to approach signal-to-noise limits for our configuration, most notably when probing away from the center of the arcjet nozzle.
Fluo
resc
ence
Inte
nsity
(arb
)
Laser Wavelength (nm)
205.135 205.14 205.145 205.5
LIF
ASE
Figure 23: Narrower ASE Spectrum Compared with LIF Spectrum
Another broadening mechanism that is present is Stark broadening of the transition due to
the free electrons present in the arcjet plume. There is no direct measurement of the electron number density profile for this arcjet, but it has been measured for nearly identical conditions24 to be less than 2 x 10
12 cm
-3 at maximum in the center of the nozzle exit plane. This value of ne
would cause a Stark width of 0.002Å for the Lβ line.29 A simulated Voigt profile using this Lorentzian width shows that, for a typical measured linewidth of 0.029Å, accounting for the Stark broadening would cause the temperature from the Doppler portion of the linewidth to go down from 1600 K to 1490 K. This represents the likely maximum temperature uncertainty due to Stark broadening, and will be greatest at the center of the nozzle where ne is largest.
A small amount of line broadening is caused by the linewidth of the dye laser beam which, unlike that of cw ring dye lasers, is non-negligible compared with the atomic linewidth. The laser linewidth at 205 nm has been measured by taking an LIF spectrum of NO gas in the cell. Since
30

NO is much heavier than hydrogen, and is at room temperature, the width of the rotational lines in the LIF spectrum reflect only the linewidth of the laser (as long as care is taken to use unblended rotational lines). This has shown that the laser has a width of 0.28 cm-1 or 0.012 Å at 205 nm. The effect of the laser width is taken into account using the following relation:2
(∆ν )
2 = (∆νD + 2∆νl)
2 (2)
where ∆νD is the true Doppler width of the line (in cm-1), ∆νl is the width of the laser, ∆ν is the measured transition width, and the factor of two is due to the two-photon probe method.
Velocity is measured by observing the Doppler shift of the absorption line and determining the velocity relative to the incoming photons responsible for the shift.
v = ∆λλ 0
c (3)
where v is the velocity, ∆λ is the wavelength shift, λ0 is the zero velocity line center, and c is the speed of light. Determining the line center of a profile with the fitting process discussed earlier is relatively simple and quite accurate. The uncertainty from the data analysis is less than the symbol size of the data shown in the following velocity figures.
Figure 24 shows the radial distribution of axial velocities 0.4 mm from the arcjet nozzle exit. The velocities were measured with a laser beam entering the plume of the arcjet axially. For comparison, corresponding data (same arcjet conditions, same profile location) for LIF of the electronically excited hydrogen atoms from Stanford University are also shown. Figure 25 shows the corresponding distribution of the radial component of velocity when the beam is brought to the plume radially. Data for the plot were taken over several days and the scatter may indicate day to day operational changes in the arcjet as well as measurement and alignment uncertainties. It should be noted that velocity profiles of the ground state hydrogen atoms are in close agreement with previous measurements using excited state LIF.14
The profiles are extremely sensitive to centering in both vertical and horizontal directions and an alignment procedure is performed prior to evacuation of the chamber. After arcjet operation commences and a period of heating (approximately 30 minutes to an hour) takes place, sample velocity distributions are taken horizontally and vertically to center the optical detection with the peak velocity of the arcjet plume. This usually requires an adjustment of 0.25 mm to 0.5 mm from the initial alignment at atmosphere in one or both of the axes that make up the nozzle exit plane. The y (axial) axis zero is defined to be where the arcjet nozzle moves into the laser beam and reduces the LIF signal in half. Since the laser is focused to a spot size measured to be .040 mm ±0.01 mm, this position can be set with an uncertainty of at least ±0.1 mm. This is checked periodically to ensure that it remains constant. During the initial warming up period for the arcjet, approximately 0.5 mm of expansion is observed in the 1 kW arcjet nozzle.
31

-6 -4 -2 0 2 4 6Radial Position (mm)
0
2
4
6
8
10
12
14
Velocity
(km/s) Ground State
N=2 Excited State (Stanford)
Figure 24: Profile Across Nozzle Exit Plane (0.4 mm from exit) of the Axial Velocity Component of the
Ground State Hydrogen Atoms Containing Data from Several Different Days
Figure 26 shows a temperature profile at 0.4 mm from nozzle exit. The results indicate a
peak temperature around 1600 K - 1800 K in the center dropping to 1000 K – 1200 K over the 5-mm radius of the nozzle exit. The low signal to noise of the fluorescence (when low laser power is used, as described above) makes measurement of the Doppler width difficult, especially at the edges, though Doppler shift measurements are less affected. Temperature is based upon the square of the measured Doppler width and can be written in terms of width in the following manner:3
δλ = 7.16 x 10⁻⁷ λ0TM
(4)
where δλ is the linewidth due to Doppler broadening, λ0 is the line center, M is the molar mass of the gas, and T is the translational temperature. The constant in the equation is based upon the values of the speed of light and the molecular gas constant.
32

Figure 25: Profile Across Nozzle Exit Plane (0.4 mm from exit) of the Radial Velocity Component of the
Ground State Hydrogen Atoms Containing Data from Several Different Days
(the radial position is measured parallel to the incoming laser beam)
-6 -5 -4 -3 -2 -1 0 1 2 3 4 5 6Radial Position (mm)
0
200
400
600
800
1000
1200
1400
1600
1800
2000
Tem
pera
ture
(K)
Figure 26: Profile Across Nozzle Exit Plane (0.4 mm from exit) of the Translational Temperature of the
Ground State Hydrogen Atoms Containing Data from Two Different Days
(The error bars are longer on the lower side to reflect the estimated amount of Stark broadening)
33
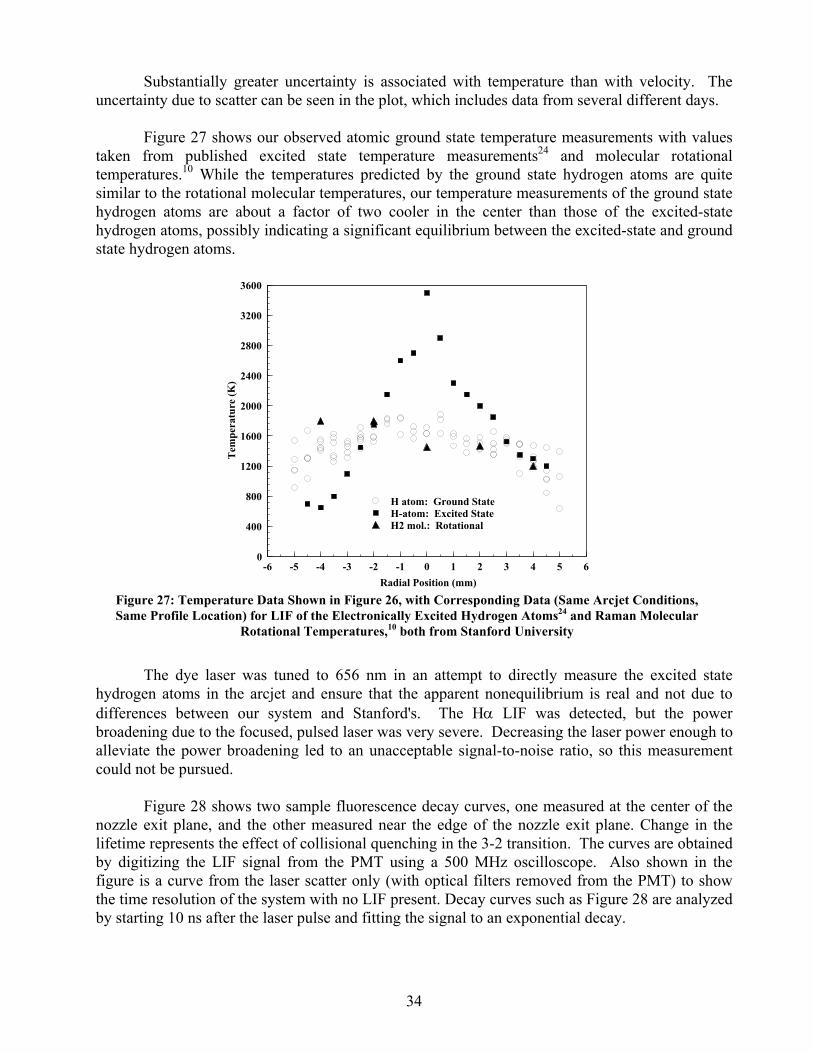
Substantially greater uncertainty is associated with temperature than with velocity. The uncertainty due to scatter can be seen in the plot, which includes data from several different days.
Figure 27 shows our observed atomic ground state temperature measurements with values taken from published excited state temperature measurements24 and molecular rotational temperatures.10 While the temperatures predicted by the ground state hydrogen atoms are quite similar to the rotational molecular temperatures, our temperature measurements of the ground state hydrogen atoms are about a factor of two cooler in the center than those of the excited-state hydrogen atoms, possibly indicating a significant equilibrium between the excited-state and ground state hydrogen atoms.
-6 -5 -4 -3 -2 -1 0 1 2 3 4 5 6Radial Position (mm)
0
400
800
1200
1600
2000
2400
2800
3200
3600
Tem
pera
ture
(K)
H atom: Ground StateH-atom: Excited State H2 mol.: Rotational
Figure 27: Temperature Data Shown in Figure 26, with Corresponding Data (Same Arcjet Conditions, Same Profile Location) for LIF of the Electronically Excited Hydrogen Atoms24 and Raman Molecular
Rotational Temperatures,10 both from Stanford University
The dye laser was tuned to 656 nm in an attempt to directly measure the excited state
hydrogen atoms in the arcjet and ensure that the apparent nonequilibrium is real and not due to differences between our system and Stanford's. The Hα LIF was detected, but the power broadening due to the focused, pulsed laser was very severe. Decreasing the laser power enough to alleviate the power broadening led to an unacceptable signal-to-noise ratio, so this measurement could not be pursued.
Figure 28 shows two sample fluorescence decay curves, one measured at the center of the nozzle exit plane, and the other measured near the edge of the nozzle exit plane. Change in the lifetime represents the effect of collisional quenching in the 3-2 transition. The curves are obtained by digitizing the LIF signal from the PMT using a 500 MHz oscilloscope. Also shown in the figure is a curve from the laser scatter only (with optical filters removed from the PMT) to show the time resolution of the system with no LIF present. Decay curves such as Figure 28 are analyzed by starting 10 ns after the laser pulse and fitting the signal to an exponential decay.
34

0 5 10 15 20 25 30 35 40Time (ns)
Fluo
resc
ence
Sig
nal (
arb)
Laser Pulse (~5 ns)r = 0 mm (7 ns)r = 4.5 mm (13 ns lifetime)
Figure 28: Fluorescence Decay for n=3 Hydrogen Atoms at Two Positions Along the Arcjet Nozzle Exit
Plane
(For comparison, a trace of the laser pulse alone (with no hydrogen atoms present) is shown)
Figure 29 shows results for lifetime measurements from several separate days as a function of position along the nozzle exit. The lifetimes measured in the arcjet plume indicate the collisional quenching due to electrons, H2, or most likely some combination of the two. The LIF signal is only proportional to number density if it is corrected for losses due to quenching.
The need to correct for collisional quenching is evident in Figure 30, which illustrates the density prediction before and after the correction for quenching. Note that the largest correction occurs in the center of the profile where the quenching is greatest and is minimal at the edges where quenching is relatively insignificant. In this case the correction is significant in the center region, and minimal at the edge of the profile.
Figure 31 shows the calibrated number density profile of hydrogen atoms near the exit plane of the nozzle (0.4 mm from nozzle exit plane). This is obtained from the area under the curve of the hydrogen atom profile (at low laser power to avoid ASE, MPI and saturation), and corrected by the fluorescence yield at each location. Separately calibrated data sets from many different days are included in the plot. Shown for comparison are the predictions for number density profile from computational arcjet models.5 The peak of the density profile is at the center of the nozzle exit plane and indicates a number density of 1 × 1016 cm-3 and falls off about 1 1/2 orders of magnitude over the 5 mm to the nozzle exit wall.
35

-6 -4 -2 0 2 4 6Radial Position (mm)
5
6
7
8
9
10
11
12
13
14
15
Life
time
(ns)
Figure 29: Fluorescence Lifetimes as a Function of Position Along Nozzle Exit from Many Different Days
(The line represents a best fit to the data)
Also shown in the figure are the predicted exit plane number density distributions from three arcjet models. The Boyd model is authored by I. D. Boyd at Cornell University.5 It is a Direct Simulation Monte Carlo (DSMC) particle code that predicts physical properties through most of the arcjet nozzle and out into the plume. The Butler model is authored by G. W. Butler at Olin Aerospace Corporation and is a Navier Stokes (NS) code that computes the flow properties throughout the arcjet nozzle, stopping at the nozzle exit.5 A separate NS code written by Megli, Krier, and Burton from the University of Illinois predicts results that are also shown in the figure. Like the Butler model, the calculations extend to the nozzle exit, but not into the plume.
The number density differences between the data and the model indicate almost an order of magnitude higher atomic density than predicted by the two Navier Stokes models and a factor of three higher than the DSMC prediction.
Shown in Table 1 is a comparison of the predictions for both atomic hydrogen and molecular hydrogen densities for each of the models. In addition, experimental results on species density from this work and that of Beattie and Cappelli at Stanford University are shown.10
36

-5 -4 -3 -2 -1 0 1 2 3 4 5Radial Position (mm)
1x10¹⁵
2x10¹⁵
3x10¹⁵
4x10¹⁵
5x10¹⁵
6x10¹⁵
7x10¹⁵
8x10¹⁵
9x10¹⁵
1x10¹⁶
Num
ber
Den
sity
(cm-3
)
density notcorrectedfor quenching
density correctedfor quenching
Figure 30: Significance of Correcting for Quenching When Determining Density from a Relative
Fluorescence Profile
-6 -5 -4 -3 -2 -1 0 1 2 3 4 5 6Radial Position (mm)
1x10¹⁵
1x10¹⁶
Num
ber
Den
sity
(cm-3
)
experimentModel: BoydModel: ButlerModel: Megli, Krier, Burton
Figure 31: Profile Across Nozzle Exit Plane (0.4 mm from exit) of the Absolute Number Density of Ground
State Hydrogen Atoms Containing Data from Two Different Days
37

Table 1. Listing of Atomic and Molecular Density Data Near the Center of the 1kW Class Arcjet Nozzle Exit for Three Modeling and Two Experimental Efforts
Arcjet Models (~1.4 kW, Hydrogen)
Arcjet Experiments
(~1.4 kW, Hydrogen)
Author
Butler5
Megli, Krier, and Burton
Boyd5
Pobst, Wysong,
and Spores
Beattie and Cappelli10
Affiliation
Olin
Aerospace
University of
Illinois
Cornell
University
Phillips
Laboratory
Stanford
University
Specific Energy
(MJ/kg)
100
105
100
105
100
H atom density (cm-3) ~ nozzle exit / center
9.3 × 10¹⁴
1.2 × 10¹⁵
3.6 × 10¹⁵
~1 × 10¹⁶
(Multi-Photon LIF)
---
H2 density (cm-3)
~ nozzle exit / center
8.5 × 10¹⁵
7 × 10¹⁵
8.2 × 10¹⁵
---
~5 × 10¹⁵
(Raman Scattering)
Molecular Dissociation
Fraction
5%
8%
18%
~50%
Note that the predictions for all three models agree well with each other and with the experiment for molecular hydrogen density at the centerline of nozzle exit. As seen in the previous figure, the differences in atomic number density can be quite large. These atomic discrepancies, in light of the molecular density agreements, indicate different molecular dissociation fractions predicted by the codes and by the combination of the two experiments at the center of the nozzle exit.
The two experimental efforts indicate a dissociation fraction as large as 50% at the nozzle exit center. This is an approximation for dissociation as the error bars on both experiments are quite large and the experiments were done on two different arcjets, though every effort was made to operate at similar arcjet conditions.
The predicted dissociation fraction from each of the models is substantially less ranging from 5% to 18% depending upon the model. Accurately predicting the dissociation fraction could be closely related to understanding the amount of frozen flow energy loss in the arcjet thruster and an important step in improving arcjet efficiency from the current 30% to 35% range.
Figure 32 shows a 2-dimensional profile of the hydrogen atomic number density data taken at 0.4 mm downstream from the nozzle exit. This figure shows a generally axisymmetric flow with non-smooth features at the edges of each density range. The rough contours are caused partially by the 1/distance algorithm used to create the contours from a Cartesian data set that was large and intensive to take, but still less in quantity of points than perhaps desirable for identifying precise
38
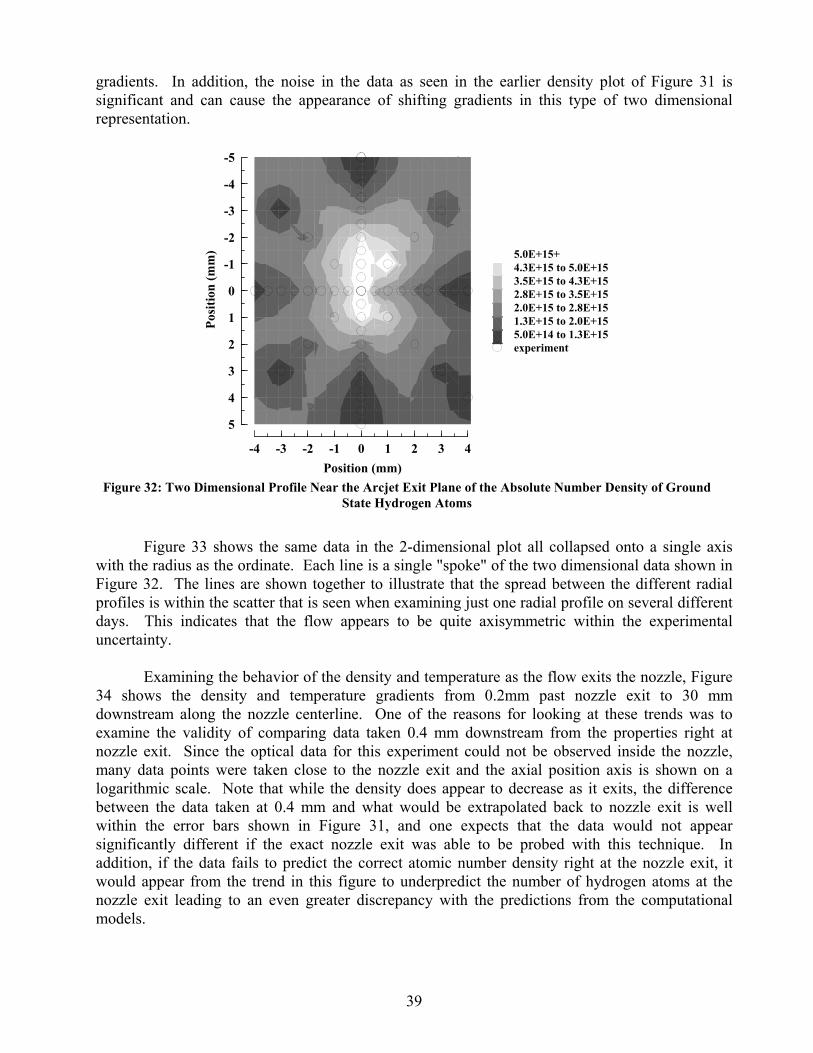
gradients. In addition, the noise in the data as seen in the earlier density plot of Figure 31 is significant and can cause the appearance of shifting gradients in this type of two dimensional representation.
-4 -3 -2 -1 0 1 2 3 4Position (mm)
-5
-4
-3
-2
-1
0
1
2
3
4
5
Posi
tion
(mm
) 5.0E+15+4.3E+15 to 5.0E+153.5E+15 to 4.3E+152.8E+15 to 3.5E+152.0E+15 to 2.8E+151.3E+15 to 2.0E+155.0E+14 to 1.3E+15experiment
Figure 32: Two Dimensional Profile Near the Arcjet Exit Plane of the Absolute Number Density of Ground
State Hydrogen Atoms
Figure 33 shows the same data in the 2-dimensional plot all collapsed onto a single axis
with the radius as the ordinate. Each line is a single "spoke" of the two dimensional data shown in Figure 32. The lines are shown together to illustrate that the spread between the different radial profiles is within the scatter that is seen when examining just one radial profile on several different days. This indicates that the flow appears to be quite axisymmetric within the experimental uncertainty.
Examining the behavior of the density and temperature as the flow exits the nozzle, Figure 34 shows the density and temperature gradients from 0.2mm past nozzle exit to 30 mm downstream along the nozzle centerline. One of the reasons for looking at these trends was to examine the validity of comparing data taken 0.4 mm downstream from the properties right at nozzle exit. Since the optical data for this experiment could not be observed inside the nozzle, many data points were taken close to the nozzle exit and the axial position axis is shown on a logarithmic scale. Note that while the density does appear to decrease as it exits, the difference between the data taken at 0.4 mm and what would be extrapolated back to nozzle exit is well within the error bars shown in Figure 31, and one expects that the data would not appear significantly different if the exact nozzle exit was able to be probed with this technique. In addition, if the data fails to predict the correct atomic number density right at the nozzle exit, it would appear from the trend in this figure to underpredict the number of hydrogen atoms at the nozzle exit leading to an even greater discrepancy with the predictions from the computational models.
39

0 1 2 3 4 5 6Radial Pos. (mm)
1014
1015
1016
Num
ber
Den
sity
(cm-3
)
Figure 33: Representation of Each "Spoke" of Data Taken in Figure 32 vs. Distance From Center
Conclusions
Using two-photon LIF, hydrogen ground state number densities, velocities and temperatures have been measured near the arcjet nozzle exit. General agreement with previous nozzle exit velocity distributions is seen, with no effect of translational slip being observed. Temperature measurements of the atomic ground state appear to be significantly cooler than those previously measured in excited states indicating non-equilibrium behavior.
Number density measurements at the nozzle exit are made, carefully avoiding such loss mechanisms as multi-photon ionization, amplified spontaneous emission, and laser saturation. Fluorescence quenching was measured and corrected for.
40

0.1 1 10Axial Position (mm)
1014
1015
1016
Num
ber
Den
sity
(cm-3
)
0
500
1000
1500
2000
2500
3000
3500
Tem
perature (K)
Figure 34: Centerline Density and Temperature Data Taken Axially from the Nozzle Exit
(The position scale is shown logarithmically to emphasize the gradients near the nozzle exit)
The number density distributions are compared with computational modeling data and indicate a significantly higher, more peaked number density than predicted. Including recent molecular density data, a higher dissociation fraction is observed than is currently predicted by the computational models indicating that frozen flow energy loss may be a more significant contribution to the arcjet's low efficiency.
Axial symmetry of the density at nozzle exit is observed within the scatter of the measurement and both density and temperature axial trends are observed indicating that data taken at 0.4 mm is likely representative of properties right at the nozzle exit and data across the nozzle exit in one direction is representative of the entire plane.
This effort has been completed and has successfully led to three publications and a journal
article that is currently being completed.
41
References
1. Smith, W. W., et al, “Low Power Hydrazine Arcjet Qualification,” IEPC Paper 91-148, Oct. 1991.
2. Vaughan, Charles E. and Cassady, R. J. “An Updated Assessment of Electric Propulsion Technology for Near-Earth Space Missions,” Paper AIAA- 92-3202, July 1992.
3. Pobst, Jeffrey A., Wysong, Ingrid J., Spores, Ronald A., “Laser Induced Fluorescence of Ground State Hydrogen Atoms at Nozzle Exit of an Arcjet Thruster,” AIAA Paper AIAA-95-1973, 26th Plasmadynamics and Lasers Conference, 19-22 June 1995, San Diego, California.
4. Keefer, D., Burtner, D., Moeller, T., and Rhodes, R., “Multiplexed Laser Induced Fluorescence and Non-Equilibrium Processes in Arcjets,” Paper AIAA-94-2656, 25th Plasmadynamics and Lasers Conference, 20-23 July 1994, Colorado Springs, Colorado.
5. Butler, G. W., Boyd, Iain D., and Cappelli, Mark A., “Non-Equilibrium Flow Phenomena in Low Power Hydrogen Arcjets,” Paper AIAA-95-2819, 31st Joint Propulsion Conference, 10-12 July 1995, San Diego, California.
6. Babu, V. S., Aithal, M., and Subramaniam, V. V., “Propellant Internal Mode Dis-equilibrium and Frozen flow Losses in Arcjets,” Paper AIAA-94-2655, 25th Plasmadynamics and Lasers Conference, 20-23 July 1994, Colorado Springs, Colorado.
7. Miller S., and Martinez-Sanchez, M., “Nonequilibrium Numerical Simulation of Radiation Cooled Arcjet Thrusters,” Paper IEPC-93-218, 23rd International Electric Propulsion Conference, 13-16, September, 1993, Seattle, Washington.
8. Megli, T. W., Krier, H., Burton, R. L., and Mertogul, A. E., “Two Temperature Modeling of N2/H2 Arcjets,” Paper AIAA-94-2413, 25th Plasmadynamics and Lasers Conference, 20-23 July 1994, Colorado Springs, Colorado.
9. Beattie, Doug R., and Cappelli, Mark A., “Molecular Hydrogen Raman Scattering in a Low Power Arcjet Thruster,” Paper AIAA-92-3566, 28th Joint Propulsion Conference, 6-8 July 1992, Nashville, Tennessee.
10. Beattie, Doug R., and Cappelli, Mark. A., “Raman Scattering Measurements of Molecular Hydrogen in an Arcjet Thruster Plume,” Paper AIAA-95-1956, 26th Plasmadynamics and Lasers Conference, 19-22 June 1995, San Diego, California.
11. Pollard, James E., “Arcjet diagnostics by XUV Absorption Spectroscopy,” Paper AIAA-92-2966, 23rd Plasmadynamics and Lasers Conference, 6-8 July 1992, Nashville, Tennessee.
12. Manzella, David H., and Cappelli, Mark A., “Vacuum Ultraviolet Absorption in a Hydrogen Arcjet,” Paper AIAA-92-3564, 23rd Plasmadynamics and Lasers Conference, 6-8 July 1992, Nashville, Tennessee.
42

13. Erwin, D. A., Pham-Van-diep, G. C., and Deininger, W. D., “Laser-induced Fluorescence Measurements of Flow Velocity in High-Power Arcjet Thruster Plumes,” AIAA J. 29, 1298 (1991).
14. Liebeskind, J. G., Hanson, R. K., and Cappelli, M. A., “Laser-induced Fluorescence Diagnostic for Temperature and Velocity Measurements in a Hydrogen Arcjet Plume,” Appl. Optics 32, 6117 (1993).
15. Goldsmith, J. E. M., “Multiphoton-excited Fluorescence Measurements of Atomic Hydrogen in Low-pressure Flames,” Proceedings of the 22nd Symposium (International) on Combustion, Combustion Institute, 1403 (1988).
16. Goldsmith, J. E. M., “Two-step Saturated Fluorescence Detection of Atomic Hydrogen in Flames,” Opt. Lett. 10, 116 (1985).
17. Goldsmith, J. E. M., Miller, J. A., Anderson, R. J. M., and Williams, L. R., “Multiphoton-excited Fluorescence Measurements of Absolute Concentration Profiles of Atomic Hydrogen in Low-pressure Flames,” Proceedings of the 23rd Symposium (International) on Combustion, Combustion Institute, 1821 (1990).
18. Preppernau, B. L., Dolson, D. A., Gottscho, R. A., and Miller, T. A., “Temporally Resolved Laser Diagnostic Measurements of Atomic Hydrogen Concentrations in RF Plasma Discharges,” Plasma Chem. and Plasma Proc. 9, 157 (1989).
19. Bittner, J., Kohse-Hoeinghaus, K., Meier, U., Kelm, S., and Just, T. H., “Determination of Absolute H Atom Concentrations in Low-Pressure Flames by Two-Photon Laser-Excited Fluorescence,” Combustion and Flame 71, 41-50 (Jan. 1988).
20. Meier, U., Kohse-Hoeinghaus, K., and Just, T. H., “H and O Atom Detection for Combustion Applications: Study of Quenching and Laser Photolysis Effects,” Chem. Phys. Lett. 126, 567 (1986).
21. Meier, U., Kohse-Hoeinghaus K., Schafer, L., and Klages, C.P., “Two-photon Excited LIF Determination of H-atom Concentrations Near a Heated Filament in a low-pressure H2 Environment,” Appl. Opt. 29, 4993 (1990).
22. Tserepi, A. D., Dunlop, J. R., Preppernau, B. L., and Miller, T. A., “Absolute H-atom Concentration Profiles in Continuous and Pulsed RF Discharges,” J. Appl. Phys. 72, No. 7, 2638 (1992).
23. Curran, F. M., and Haag, T. W., “An Extended Life and Performance Test of a Low Power Arcjet,” Paper AIAA-88-3106, 24th Joint Propulsion Conference, 11-18 July 1988, Boston, MA.
24. Storm P. V., and Cappelli, M. A., “High Spectral Resolution Emission Study of a Low Power Hydrogen Arcjet Plume,” Paper AIAA 95-1960, 26th Plasmadynamics and Lasers Conference, 19-22 June 1995, San Diego, California.
43

25. Press, W. H., Flannery, B. P., Teukolsky, S. A., and Vetterling, W. T., Numerical Recipes: The Art of Scientific Computing, 1st ed., Cambridge Univ. Press, Cambridge, 1986.
26. Georgiev, N., Nyholm, K., Fritzon, R., and Alden, M., “Developments of the Amplified Stimulated Emission Technique for Spatially Resolved Species Detection in Flames,” Optics Comm. 108, 71-76 (1994).
27. Brown M. S., and Jeffries, J. B., “Measurement of Atomic Concentrations in Reacting Flows Through Use of Stimulated Gain or Loss,” Applied Optics 34, 1127 (1995).
28. Goldsmith, J. E. M., “Two-photon-excited Stimulated Emission from Atomic Hydrogen in Flames,” J. Opt. Soc. Am. B, 6, 1979 (1989).
29. Vidal, C. R., Cooper, J., and Smith, E. W., “Hydrogen Stark-broadening Tables,” Astrophys. J. Suppl. No. 214, 25, 37-136 (1973).
30. Bamford, D. J., Jusinski, L. E., and Bischel, W. K., “Absolute Two-photon Absorption and Three-photon Ionization Cross Sections for Atomic Oxygen,” Phys. Rev A 34, 185-198 (July 1986).
44

Primary Distribution of this Report(PL-TR-97-3027):
AFRL/PRSE (4 CD + 1 HC + Orig.)Attn: Carl E. Ousley4 Draco DriveEdwards AFB CA 93524-7160
Raytheon ITSS (2 CD + 1 HC)Attn: J. A. Pobst10 E. Saturn Blvd.Edwards AFB CA 93524-7680
Raytheon ITSS (1 CD)Attn: I.J. Wysong10 E. Saturn Blvd.Edwards AFB CA 93524-7680
AFRL/PRSS (1 CD)Attn: G. G. Spanjers10 E. Saturn Blvd.Edwards AFB CA 93524-7680
AFRL/PRSO (1 CD)Attn: J.B. Malak4 Draco DriveEdwards AFB CA 93524-7160
AFRL/PR Technical Library (2 CD + 1 HC)6 Draco DriveEdwards AFB CA 93524-7130
Defense Technical Information Center(1 Electronic Submission via STINT)Attn: DTIC-ACQS (Acquisitions)8725 John J. Kingman Road, Suite 94Ft. Belvoir VA 22060-6218
Chemical Propulsion Information Agcy (1 CD)Attn: Tech Lib (Dottie Becker)10630 Little Patuxent Parkway, Suite 202Columbia MD 21044-3200
Dr. William Elliott (1 CD)HQ AFMC/HO4375 Chidlaw Road, Suite 6Wright-Patterson AFB OH 45433