PKPD modeling of acquired resistance to anti-cancer drug ... · PKPD modeling of acquired...
14
ORIGINAL PAPER PKPD modeling of acquired resistance to anti-cancer drug treatment Miro J. Eigenmann 1 • Nicolas Frances 1 • Thierry Lave ´ 2 • Antje-Christine Walz 1 Received: 2 July 2017 / Accepted: 26 October 2017 / Published online: 31 October 2017 Ó The Author(s) 2017. This article is an open access publication Abstract Non-small cell lung cancer (NSCLC) patients greatly benefit from the treatment with tyrosine kinase inhibitors (TKIs) targeting the epidermal growth factor receptor (EGFR). However, emergence of acquired resis- tance inevitable occurs after long-term treatment in most patients and limits clinical improvement. In the present study, resistance to drug treatment in patient-derived NSCLC xenograft mice was assessed and modeling and simulation was applied to understand the dynamics of drug resistance as a basis to explore more beneficial drug regi- men. Two semi-mechanistic models were fitted to tumor growth inhibition profiles during and after treatment with erlotinib or gefitinib. The base model proposes that as a result of drug treatment, tumor cells stop proliferating and undergo several stages of damage before they eventually die. The acquired resistance model adds a resistance term to the base model which assumes that resistant cells are emerging from the pool of damaged tumor cells. As a result, tumor cells sensitive to drug treatment will either die or be converted to a drug resistant cell population which is proliferating at a slower growth rate as compared to the sensitive cells. The observed tumor growth profiles were better described by the resistance model and emergence of resistance was concluded. In simulation studies, the selection of resistant cells was explored as well as the time- variant fraction of resistant over sensitive cells. The pro- posed model provides insight into the dynamic processes of emerging resistance. It predicts tumor regrowth during treatment driven by the selection of resistant cells and explains why faster tumor regrowth may occur after dis- continuation of TKI treatment. Finally, it is shown how the semi-mechanistic model can be used to explore different scenarios and to identify optimal treatment schedules in clinical trials. Keywords Acquired resistance PKPD model Simulation Tumor growth inhibition model Tyrosine kinase inhibitor Patient-derived tumor xenograft mice Introduction Targeted therapies such as tyrosine kinase inhibitors (TKIs) are widely used for cancer treatment. First generation of TKI includes erlotinib and gefitinib, two small molecule drugs with similar chemical structures which have been approved for the treatment of NSCLC [1–3] and subse- quently of various solid epidermoid cancers [4, 5]. Both molecules target the ATP binding site of EGFR and inhibit EGFR-induced activation of downstream signaling [6]. It has been reported that long term treatment with these EGFR-TKI drugs eventually leads to emergence of resis- tance in most patients [1, 7, 8]. Two main type of resistance have been described. Primary resistance, referring to patients who are not responsive to the drug treatment and secondary or acquired resistance, which is usually defined as progression of disease after an initial period of clinical benefit while the patient is still under treatment [9]. Electronic supplementary material The online version of this article (https://doi.org/10.1007/s10928-017-9553-x) contains supple- mentary material, which is available to authorized users. & Antje-Christine Walz [email protected] 1 Roche Pharma Research and Early Development, Quantitative Systems Pharmacology, Hoffmann-La Roche Ltd., Grenzacherstrasse, 124, 4070 Basel, Switzerland 2 Pharmaceutical Sciences Roche Innovation Centre Basel, Hoffmann-La Roche Ltd., Basel, Switzerland 123 J Pharmacokinet Pharmacodyn (2017) 44:617–630 DOI 10.1007/s10928-017-9553-x
-
Upload
nguyencong -
Category
Documents
-
view
215 -
download
0
Transcript of PKPD modeling of acquired resistance to anti-cancer drug ... · PKPD modeling of acquired...
ORIGINAL PAPER
PKPD modeling of acquired resistance to anti-cancer drugtreatment
Miro J. Eigenmann1• Nicolas Frances1
• Thierry Lave2• Antje-Christine Walz1
Received: 2 July 2017 / Accepted: 26 October 2017 / Published online: 31 October 2017
� The Author(s) 2017. This article is an open access publication
Abstract Non-small cell lung cancer (NSCLC) patients
greatly benefit from the treatment with tyrosine kinase
inhibitors (TKIs) targeting the epidermal growth factor
receptor (EGFR). However, emergence of acquired resis-
tance inevitable occurs after long-term treatment in most
patients and limits clinical improvement. In the present
study, resistance to drug treatment in patient-derived
NSCLC xenograft mice was assessed and modeling and
simulation was applied to understand the dynamics of drug
resistance as a basis to explore more beneficial drug regi-
men. Two semi-mechanistic models were fitted to tumor
growth inhibition profiles during and after treatment with
erlotinib or gefitinib. The base model proposes that as a
result of drug treatment, tumor cells stop proliferating and
undergo several stages of damage before they eventually
die. The acquired resistance model adds a resistance term
to the base model which assumes that resistant cells are
emerging from the pool of damaged tumor cells. As a
result, tumor cells sensitive to drug treatment will either die
or be converted to a drug resistant cell population which is
proliferating at a slower growth rate as compared to the
sensitive cells. The observed tumor growth profiles were
better described by the resistance model and emergence of
resistance was concluded. In simulation studies, the
selection of resistant cells was explored as well as the time-
variant fraction of resistant over sensitive cells. The pro-
posed model provides insight into the dynamic processes of
emerging resistance. It predicts tumor regrowth during
treatment driven by the selection of resistant cells and
explains why faster tumor regrowth may occur after dis-
continuation of TKI treatment. Finally, it is shown how the
semi-mechanistic model can be used to explore different
scenarios and to identify optimal treatment schedules in
clinical trials.
Keywords Acquired resistance � PKPD model �Simulation � Tumor growth inhibition model � Tyrosinekinase inhibitor � Patient-derived tumor xenograft mice
Introduction
Targeted therapies such as tyrosine kinase inhibitors (TKIs)
are widely used for cancer treatment. First generation of
TKI includes erlotinib and gefitinib, two small molecule
drugs with similar chemical structures which have been
approved for the treatment of NSCLC [1–3] and subse-
quently of various solid epidermoid cancers [4, 5]. Both
molecules target the ATP binding site of EGFR and inhibit
EGFR-induced activation of downstream signaling [6]. It
has been reported that long term treatment with these
EGFR-TKI drugs eventually leads to emergence of resis-
tance in most patients [1, 7, 8]. Two main type of resistance
have been described. Primary resistance, referring to
patients who are not responsive to the drug treatment and
secondary or acquired resistance, which is usually defined
as progression of disease after an initial period of clinical
benefit while the patient is still under treatment [9].
Electronic supplementary material The online version of thisarticle (https://doi.org/10.1007/s10928-017-9553-x) contains supple-mentary material, which is available to authorized users.
& Antje-Christine Walz
1 Roche Pharma Research and Early Development,
Quantitative Systems Pharmacology, Hoffmann-La Roche
Ltd., Grenzacherstrasse, 124, 4070 Basel, Switzerland
2 Pharmaceutical Sciences Roche Innovation Centre Basel,
Hoffmann-La Roche Ltd., Basel, Switzerland
123
J Pharmacokinet Pharmacodyn (2017) 44:617–630
DOI 10.1007/s10928-017-9553-x
Underlying mechanisms of resistance towards TKI drugs
have been thoroughly discussed in literature [8–14]. The
most frequently described molecular mechanism of
acquired resistance occurs in exon 20 (T790 M) [15–18].
This change leads to altered binding of the drug within the
ATP pocket [19]. Tumors with T790 M mutations were
found to have a slower, less aggressive course of tumor
progression [16, 20–22]. Despite initial responses, drug
effect drops and patients eventually progress due to
acquired resistance. In these cases, TKI treatment gets
commonly withdrawn and second line treatment is applied.
However, some reports mention that even though resis-
tance to the TKI treatment was identified, a discontinuation
of the treatment leads in some cases to a subsequent disease
flare [10, 15, 20]. Strategies to overcome resistance involve
combination therapies [23], mutant selective treatments
and altering conventional treatment schedules [22, 24–26].
Mathematical modeling has been applied in numerous
cases to investigate emergence of resistance and exploring
possibilities to overcome it [22, 27–30].
We recently conducted a translational PKPD study
based on in vitro and in vivo experiments to quantitatively
compare erlotinib and gefitinib and to retrospectively pre-
dict efficacious dose in humans [31]. The two compounds
were selected based on the strong tumor uptake differences
observed for erlotinib and gefitinib despite similar molec-
ular specificity. It was demonstrated that active drug
exposure at target site is higher for erlotinib despite having
lower total tumor to plasma ratios. Furthermore; the model-
based dose prediction matched the recommended clinical
doses well. However, model misspecification was apparent
in the high dose group which was not relevant to the
address the question of our previous work. It was specu-
lated that this was due to emergence of resistance and
therefore, these data were further explored in the present
study to investigate this in patient-derived NSCLC xeno-
grafts obtained by direct implants of surgically resected
tumors in mice. This animal model maintains morpholog-
ical similarities, tumor heterogeneity and recapitulates
molecular profiling of the original tumors [31]. The goal of
this work was to test if acquired resistance to treatment
with erlotinib and gefitinib can be observed in preclinical
studies and to simulate the dynamics of emergent resis-
tance. Applying parsimonious principles, we compared
model performance of two semi-mechanistic PK/PD
models with and without acquired resistance. This allowed
confirming or excluding emergence of resistance in xeno-
graft mice. With the final model, simulation studies were
conducted and the selection of resistant cells as well as
time-variant fraction of resistant to sensitive cells was
predicted. The proposed model provides insight into the
dynamic processes of emerging resistance and allows
exploration of dosing regimen.
Theoretical
PK model
An oral, 1-compartment model with first order absorption
and first order elimination, was fitted to the PK data from
the short and the long term experiments.
The PK model can be described with the following
equations:
dAd
dt¼ � ka � Ad Ad 0ð Þ ¼ D ð1Þ
dAp
dt¼ ka � Ad � ke � Ap Ap 0ð Þ ¼ 0 ð2Þ
Cp ¼Ap
V � ðD � IÞ ð3Þ
where Ad corresponds to the quantity of drug in the depot
compartment, Ap [lg] to the amount of drug in plasma,
Cp[lg/L] to the plasma concentration and D [mg/kg] is the
weight normalized dose. V [L] represents apparent volume
of distribution, ka [1/d] corresponds the absorption rate and
ke [1/d] to the elimination rate. For gefitinib, a dose-de-
pendent decrease in volume of distribution was observed
and captured with the gefitinib-specific parameter I, while
it was fixed to 0 for erlotinib. Individual PK parameters
estimates are later fixed in the PKPD models.
TGI base model
Tumor volume (TV) is composed of dividing cells (S) and
damaged cells due to drug treatment (T1–T3). Unperturbed
tumor growth is described by a nonlinear growth model. This
model assumes a continuous switch fromexponential to linear
growth behavior as the tumor volume increases [32]. The drug
effect is delayed relative to the drug exposure in plasma and
captured by a signal transduction model as described by
Simeoni and colleagues [33].We estimated the drug effect via
a killing function involving a direct and linear effect model
[34]. It is described with the following equations:
TV = S + T1 + T2 + T3 ð4ÞdS
dt¼ 2� k0 � k1 � S
2� k0 � Sþ k1� k2 � Cp � S S 0ð Þ ¼ TV0 ð5Þ
dT1
dt¼ k2 � S� Cp � T1� k1 T1 0ð Þ ¼ 0 ð6Þ
dT2
dt¼ k1 � ðT1� T2Þ T2 0ð Þ ¼ 0 ð7Þ
dT3
dt¼ k1 � ðT2� T3Þ T3 0ð Þ ¼ 0 ð8Þ
618 J Pharmacokinet Pharmacodyn (2017) 44:617–630
123
where TV0 is the tumor volume at the start of the study, k0and k1 are the exponential and linear growth parameters, k1is the rate accounting for the delayed effect and k2 repre-
sents the potency parameter of the compound.
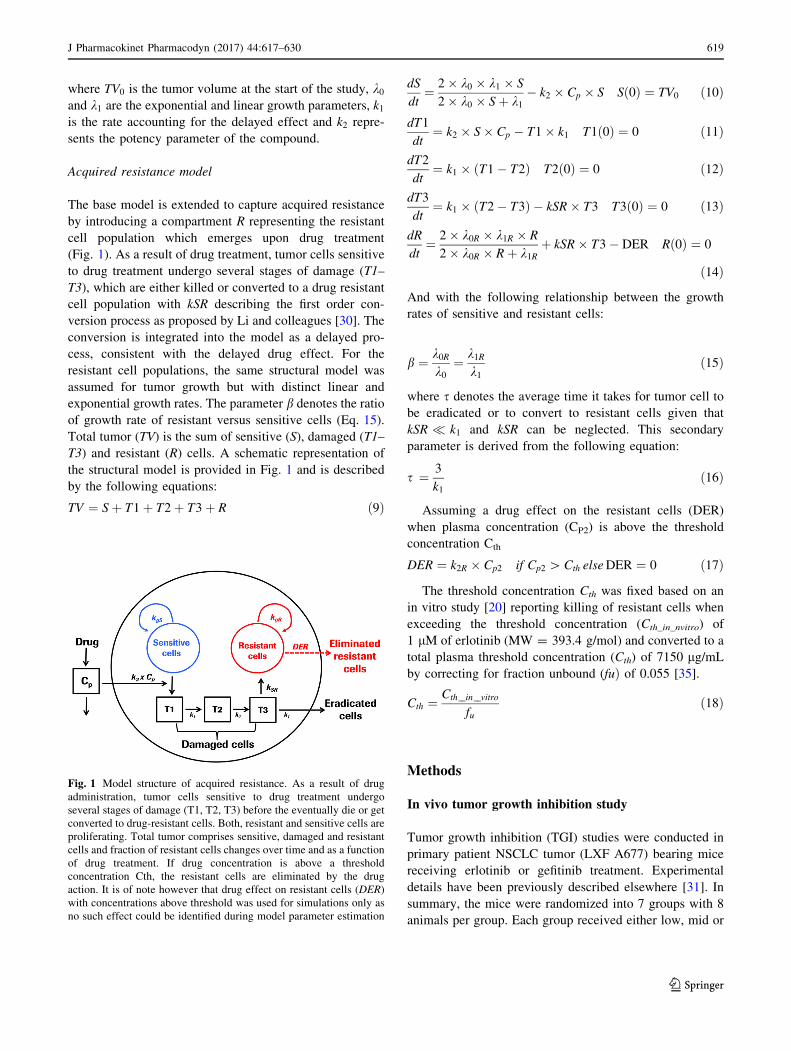
Acquired resistance model
The base model is extended to capture acquired resistance
by introducing a compartment R representing the resistant
cell population which emerges upon drug treatment
(Fig. 1). As a result of drug treatment, tumor cells sensitive
to drug treatment undergo several stages of damage (T1–
T3), which are either killed or converted to a drug resistant
cell population with kSR describing the first order con-
version process as proposed by Li and colleagues [30]. The
conversion is integrated into the model as a delayed pro-
cess, consistent with the delayed drug effect. For the
resistant cell populations, the same structural model was
assumed for tumor growth but with distinct linear and
exponential growth rates. The parameter b denotes the ratio
of growth rate of resistant versus sensitive cells (Eq. 15).
Total tumor (TV) is the sum of sensitive (S), damaged (T1–
T3) and resistant (R) cells. A schematic representation of
the structural model is provided in Fig. 1 and is described
by the following equations:
TV ¼ Sþ T1þ T2þ T3þ R ð9Þ
dS
dt¼ 2� k0 � k1 � S
2� k0 � Sþ k1� k2 � Cp � S S 0ð Þ ¼ TV0 ð10Þ
dT1
dt¼ k2 � S� Cp � T1� k1 T1 0ð Þ ¼ 0 ð11Þ
dT2
dt¼ k1 � ðT1� T2Þ T2 0ð Þ ¼ 0 ð12Þ
dT3
dt¼ k1 � T2� T3ð Þ � kSR� T3 T3 0ð Þ ¼ 0 ð13Þ
dR
dt¼ 2� k0R � k1R � R
2� k0R � Rþ k1Rþ kSR � T3� DER R 0ð Þ ¼ 0
ð14Þ
And with the following relationship between the growth
rates of sensitive and resistant cells:
b ¼ k0Rk0
¼ k1Rk1
ð15Þ
where s denotes the average time it takes for tumor cell to
be eradicated or to convert to resistant cells given that
kSR � k1 and kSR can be neglected. This secondary
parameter is derived from the following equation:
s ¼ 3
k1ð16Þ
Assuming a drug effect on the resistant cells (DER)
when plasma concentration (CP2) is above the threshold
concentration Cth
DER ¼ k2R � Cp2 if Cp2 [Cth elseDER ¼ 0 ð17Þ
The threshold concentration Cth was fixed based on an
in vitro study [20] reporting killing of resistant cells when
exceeding the threshold concentration (Cth_in_nvitro) of
1 lM of erlotinib (MW = 393.4 g/mol) and converted to a
total plasma threshold concentration (Cth) of 7150 lg/mL
by correcting for fraction unbound (fuÞ of 0.055 [35].
Cth ¼Cth in vitro
fuð18Þ
Methods
In vivo tumor growth inhibition study
Tumor growth inhibition (TGI) studies were conducted in
primary patient NSCLC tumor (LXF A677) bearing mice
receiving erlotinib or gefitinib treatment. Experimental
details have been previously described elsewhere [31]. In
summary, the mice were randomized into 7 groups with 8
animals per group. Each group received either low, mid or
Fig. 1 Model structure of acquired resistance. As a result of drug
administration, tumor cells sensitive to drug treatment undergo
several stages of damage (T1, T2, T3) before the eventually die or get
converted to drug-resistant cells. Both, resistant and sensitive cells are
proliferating. Total tumor comprises sensitive, damaged and resistant
cells and fraction of resistant cells changes over time and as a function
of drug treatment. If drug concentration is above a threshold
concentration Cth, the resistant cells are eliminated by the drug
action. It is of note however that drug effect on resistant cells (DER)
with concentrations above threshold was used for simulations only as
no such effect could be identified during model parameter estimation
J Pharmacokinet Pharmacodyn (2017) 44:617–630 619
123
high dose of erlotinib or gefitinib or vehicle only (control
group). The drugs were administered orally once per day
for 14 days. Tumor volume was monitored by caliper
measurements over 30 days and sparse PK samples were
collected. The detection limit for tumor volume was
5 mm3. The experimental study design is summarized in
table S1, supplementary material. An overview of missing
data due to early determination and data below limit of
quantification is summarized in supplementary table S2.
Parameter estimation
PKPD parameters were estimated using a population
approach with Monolix Version 4.2.2. (Lixoft), allowing
for estimation of fixed and random effects for each model
parameter and a residual error in one step [36]. Residual
errors for the PK were assumed to be proportional to pre-
dicted concentrations. For the PD, a combined error model
was selected. Diagnostic plots were inspected to select the
appropriate error model.
PK parameters estimated in previous report [31] were
used in the present study. The individual PK parameter
estimates were fixed and served as input in the PKPD
modeling.
PK parameters which were estimated and reported in a
previous publication [31] were used in the current study.
The individual PK parameter estimates were fixed and
served as input in the PKPD modeling. PD parameters were
estimated simultaneously by combining erlotinib and
gefitinib datasets while assuming the same tumor growth
rates of sensitive and resistant cells, delay parameter and
transfer rate to resistant cells. To allow a precise and
stable estimation of fixed effects, random effects were fixed
to low values if necessary. Model evaluation and selection
was based on model convergence, precision of the
parameter estimates, fitting criteria (Akaike Information
Criteria (AIC)) and visual inspection of diagnostic tools
such as visual predictive checks, residuals and observed
versus predicted plots.
Covariates
Covariates were tested for both PKPD models to test if
parameters change with dose. Based on the results (data not
shown) high dose treatment (100 mg/kg) was identified as
covariate for the transformation rate kSR in the resistance
model (Eqs. 9–14) and, in case of erlotinib, for the efficacy
parameter k2. The high dose group was assessed as cate-
gorical covariate in Monolix. Fixed effect and random
effect for the respective parameters are estimated for each
defined category (here low/mid vs. high dose) and the
statistical significance of differences between correspond-
ing estimates is evaluated and the corresponding p value
indicated. No PD covariates were identifiable and signifi-
cant (p value below 0.05) in case of the base TGI model
(Eqs. 4–8). A dose dependent change in the volume of
distribution was observed for gefitinib and computed by the
term V � D � Ið Þ (Eq. 3) as reported in [31]. I was esti-
mated for gefitinib and fixed to 0 for erlotinib (no dose
effect observed).
Simulation studies
Simulation studies were performed in Berkeley Madonna
v8.3.18. The aim of these simulation studies was to gen-
erate insights into dynamic changes of heterogeneous
tumors under drug treatment and to explore in silico other
treatment options in the preclinical as well as in the clinical
setting. The model codes are presented in supplementary
material (S3–S5). In order to compare dosing schedules in
mice, inter-individual variability was included on the
estimated model parameters (S4), 250 individual profiles
were simulated based on random sampling from the
respective parameter distribution space. The mean, the 5
and 95% confidence interval (CI) of the mean for these
profiles and additionally derived metrics were calculated:
CI ¼ l� 1:96 � rn
ð19Þ
where l represents the mean, r the standard deviation and
n the number of samples. Additional metrics were quanti-
fied, minimal tumor volume achieved under the treatment
schedule, time to progression and tumor burden over time
(AUCE). The minimal tumor volume was derived from the
simulation output. Time to progression was defined as
timespan after treatment start until the tumor volume
supersedes the tumor volume measured at treatment start.
In order to show the impact of timing when the two dosing
schedules are compared and the corresponding AUCE after
30 and after 60 days are reported.
Results
PKPD model reveals acquired resistance in patient
derived xenograft mice
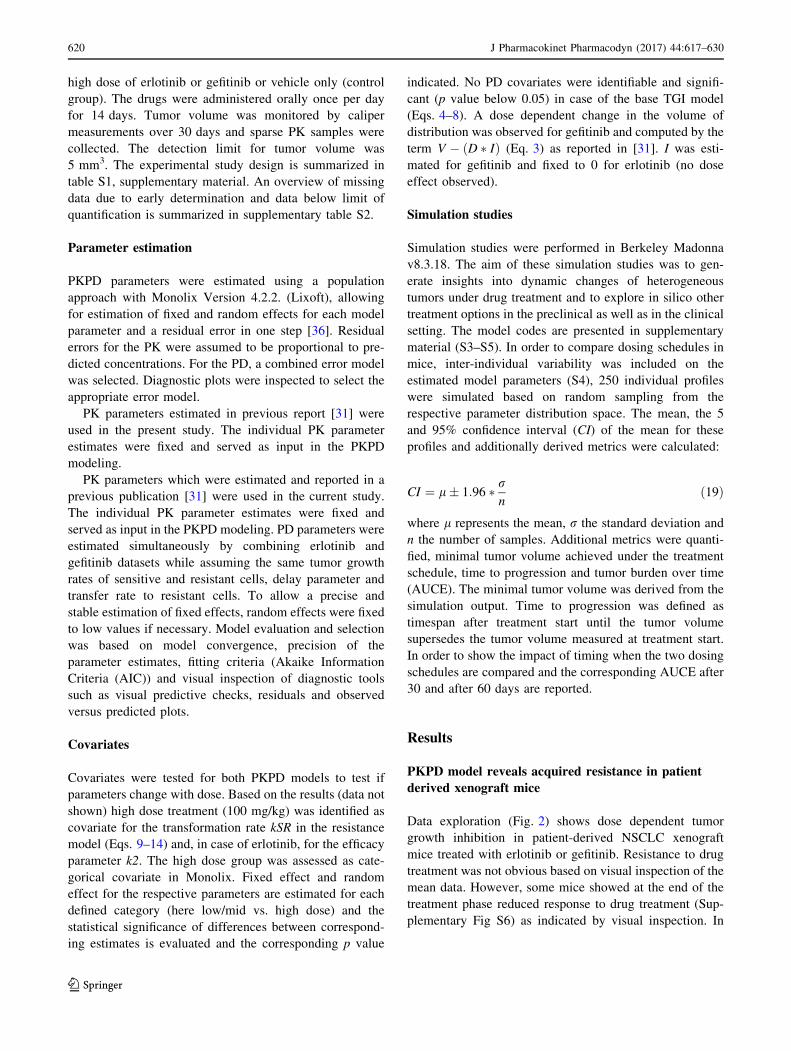
Data exploration (Fig. 2) shows dose dependent tumor
growth inhibition in patient-derived NSCLC xenograft
mice treated with erlotinib or gefitinib. Resistance to drug
treatment was not obvious based on visual inspection of the
mean data. However, some mice showed at the end of the
treatment phase reduced response to drug treatment (Sup-
plementary Fig S6) as indicated by visual inspection. In
620 J Pharmacokinet Pharmacodyn (2017) 44:617–630
123
addition an unexplained bias occurred when the TGI data
are described with a direct effect model [31]. Furthermore,
it has been observed that in patients long term treatment
inevitably leads to resistance [1]. These findings lead us to
investigate potential emergence of resistance in this TGI
study in xenograft mice. In order to confirm or exclude
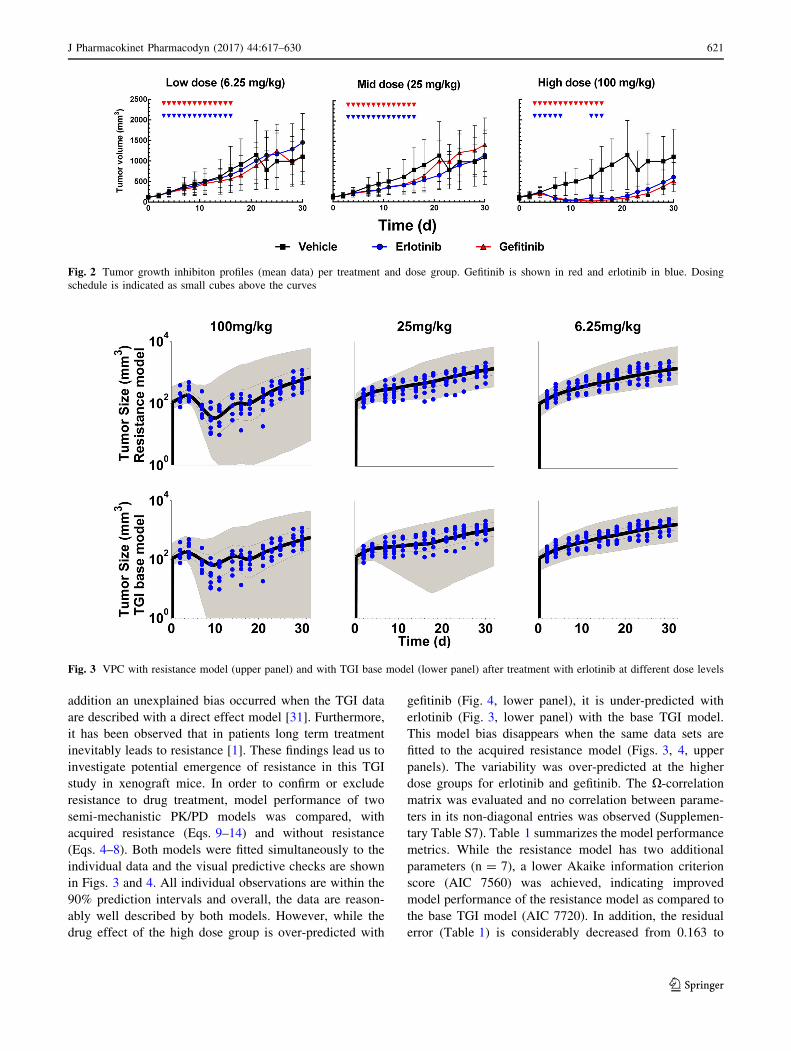
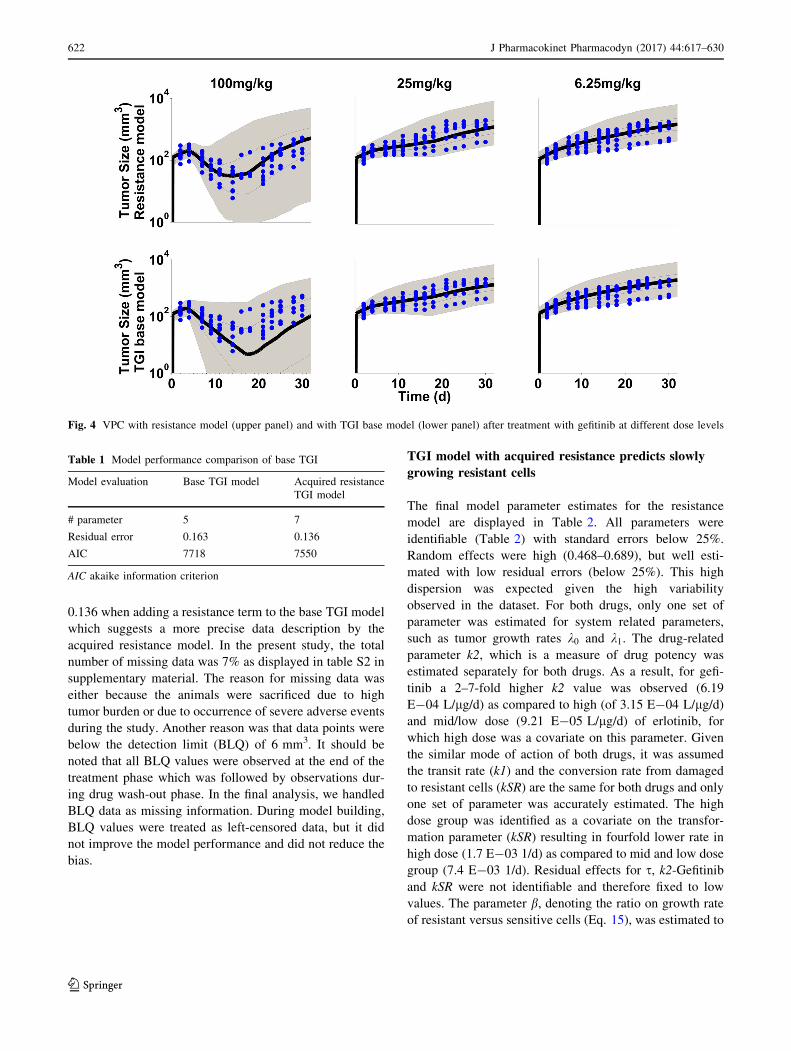
resistance to drug treatment, model performance of two
semi-mechanistic PK/PD models was compared, with
acquired resistance (Eqs. 9–14) and without resistance
(Eqs. 4–8). Both models were fitted simultaneously to the
individual data and the visual predictive checks are shown
in Figs. 3 and 4. All individual observations are within the
90% prediction intervals and overall, the data are reason-
ably well described by both models. However, while the
drug effect of the high dose group is over-predicted with
gefitinib (Fig. 4, lower panel), it is under-predicted with
erlotinib (Fig. 3, lower panel) with the base TGI model.
This model bias disappears when the same data sets are
fitted to the acquired resistance model (Figs. 3, 4, upper
panels). The variability was over-predicted at the higher
dose groups for erlotinib and gefitinib. The X-correlationmatrix was evaluated and no correlation between parame-
ters in its non-diagonal entries was observed (Supplemen-
tary Table S7). Table 1 summarizes the model performance
metrics. While the resistance model has two additional
parameters (n = 7), a lower Akaike information criterion
score (AIC 7560) was achieved, indicating improved
model performance of the resistance model as compared to
the base TGI model (AIC 7720). In addition, the residual
error (Table 1) is considerably decreased from 0.163 to
Fig. 2 Tumor growth inhibiton profiles (mean data) per treatment and dose group. Gefitinib is shown in red and erlotinib in blue. Dosing
schedule is indicated as small cubes above the curves
Fig. 3 VPC with resistance model (upper panel) and with TGI base model (lower panel) after treatment with erlotinib at different dose levels
J Pharmacokinet Pharmacodyn (2017) 44:617–630 621
123
0.136 when adding a resistance term to the base TGI model
which suggests a more precise data description by the
acquired resistance model. In the present study, the total
number of missing data was 7% as displayed in table S2 in
supplementary material. The reason for missing data was
either because the animals were sacrificed due to high
tumor burden or due to occurrence of severe adverse events
during the study. Another reason was that data points were
below the detection limit (BLQ) of 6 mm3. It should be
noted that all BLQ values were observed at the end of the
treatment phase which was followed by observations dur-
ing drug wash-out phase. In the final analysis, we handled
BLQ data as missing information. During model building,
BLQ values were treated as left-censored data, but it did
not improve the model performance and did not reduce the
bias.
TGI model with acquired resistance predicts slowly
growing resistant cells
The final model parameter estimates for the resistance
model are displayed in Table 2. All parameters were
identifiable (Table 2) with standard errors below 25%.
Random effects were high (0.468–0.689), but well esti-
mated with low residual errors (below 25%). This high
dispersion was expected given the high variability
observed in the dataset. For both drugs, only one set of
parameter was estimated for system related parameters,
such as tumor growth rates k0 and k1. The drug-related
parameter k2, which is a measure of drug potency was
estimated separately for both drugs. As a result, for gefi-
tinib a 2–7-fold higher k2 value was observed (6.19
E-04 L/lg/d) as compared to high (of 3.15 E-04 L/lg/d)and mid/low dose (9.21 E-05 L/lg/d) of erlotinib, for
which high dose was a covariate on this parameter. Given
the similar mode of action of both drugs, it was assumed
the transit rate (k1) and the conversion rate from damaged
to resistant cells (kSR) are the same for both drugs and only
one set of parameter was accurately estimated. The high
dose group was identified as a covariate on the transfor-
mation parameter (kSR) resulting in fourfold lower rate in
high dose (1.7 E-03 1/d) as compared to mid and low dose
group (7.4 E-03 1/d). Residual effects for s, k2-Gefitiniband kSR were not identifiable and therefore fixed to low
values. The parameter b, denoting the ratio on growth rate
of resistant versus sensitive cells (Eq. 15), was estimated to
Fig. 4 VPC with resistance model (upper panel) and with TGI base model (lower panel) after treatment with gefitinib at different dose levels
Table 1 Model performance comparison of base TGI
Model evaluation Base TGI model Acquired resistance
TGI model
# parameter 5 7
Residual error 0.163 0.136
AIC 7718 7550
AIC akaike information criterion
622 J Pharmacokinet Pharmacodyn (2017) 44:617–630
123
be 0.85. This result suggests slower growth of resistant
cells.
Time-variant fraction of resistant cells of total
tumor during and after treatment with erlotinib
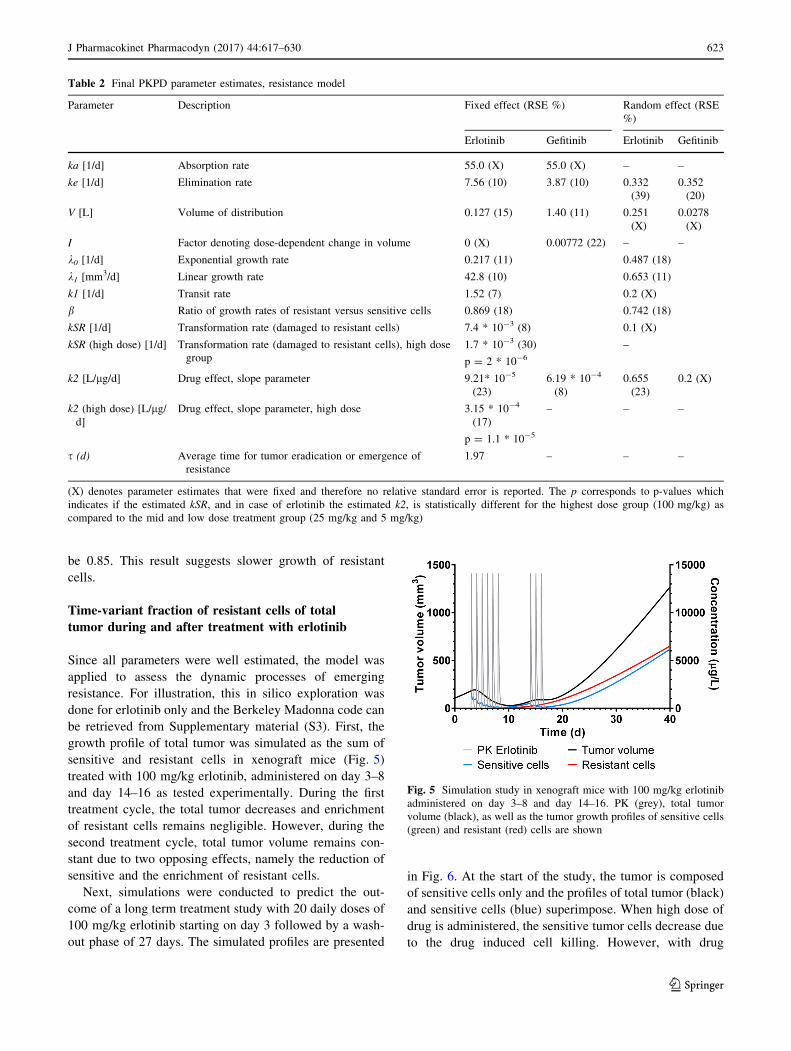
Since all parameters were well estimated, the model was
applied to assess the dynamic processes of emerging
resistance. For illustration, this in silico exploration was
done for erlotinib only and the Berkeley Madonna code can
be retrieved from Supplementary material (S3). First, the
growth profile of total tumor was simulated as the sum of
sensitive and resistant cells in xenograft mice (Fig. 5)
treated with 100 mg/kg erlotinib, administered on day 3–8
and day 14–16 as tested experimentally. During the first
treatment cycle, the total tumor decreases and enrichment
of resistant cells remains negligible. However, during the
second treatment cycle, total tumor volume remains con-
stant due to two opposing effects, namely the reduction of
sensitive and the enrichment of resistant cells.
Next, simulations were conducted to predict the out-
come of a long term treatment study with 20 daily doses of
100 mg/kg erlotinib starting on day 3 followed by a wash-
out phase of 27 days. The simulated profiles are presented
in Fig. 6. At the start of the study, the tumor is composed
of sensitive cells only and the profiles of total tumor (black)
and sensitive cells (blue) superimpose. When high dose of
drug is administered, the sensitive tumor cells decrease due
to the drug induced cell killing. However, with drug
Table 2 Final PKPD parameter estimates, resistance model
Parameter Description Fixed effect (RSE %) Random effect (RSE
%)
Erlotinib Gefitinib Erlotinib Gefitinib
ka [1/d] Absorption rate 55.0 (X) 55.0 (X) – –
ke [1/d] Elimination rate 7.56 (10) 3.87 (10) 0.332
(39)
0.352
(20)
V [L] Volume of distribution 0.127 (15) 1.40 (11) 0.251
(X)
0.0278
(X)
I Factor denoting dose-dependent change in volume 0 (X) 0.00772 (22) – –
k0 [1/d] Exponential growth rate 0.217 (11) 0.487 (18)
k1 [mm3/d] Linear growth rate 42.8 (10) 0.653 (11)
k1 [1/d] Transit rate 1.52 (7) 0.2 (X)
b Ratio of growth rates of resistant versus sensitive cells 0.869 (18) 0.742 (18)
kSR [1/d] Transformation rate (damaged to resistant cells) 7.4 * 10-3 (8) 0.1 (X)
kSR (high dose) [1/d] Transformation rate (damaged to resistant cells), high dose
group
1.7 * 10-3 (30)
p = 2 * 10-6
–
k2 [L/lg/d] Drug effect, slope parameter 9.21* 10-5
(23)
6.19 * 10-4
(8)
0.655
(23)
0.2 (X)
k2 (high dose) [L/lg/d]
Drug effect, slope parameter, high dose 3.15 * 10-4
(17)
p = 1.1 * 10-5
– – –
s (d) Average time for tumor eradication or emergence of
resistance
1.97 – – –
(X) denotes parameter estimates that were fixed and therefore no relative standard error is reported. The p corresponds to p-values which
indicates if the estimated kSR, and in case of erlotinib the estimated k2, is statistically different for the highest dose group (100 mg/kg) as
compared to the mid and low dose treatment group (25 mg/kg and 5 mg/kg)
Fig. 5 Simulation study in xenograft mice with 100 mg/kg erlotinib
administered on day 3–8 and day 14–16. PK (grey), total tumor
volume (black), as well as the tumor growth profiles of sensitive cells
(green) and resistant (red) cells are shown
J Pharmacokinet Pharmacodyn (2017) 44:617–630 623
123
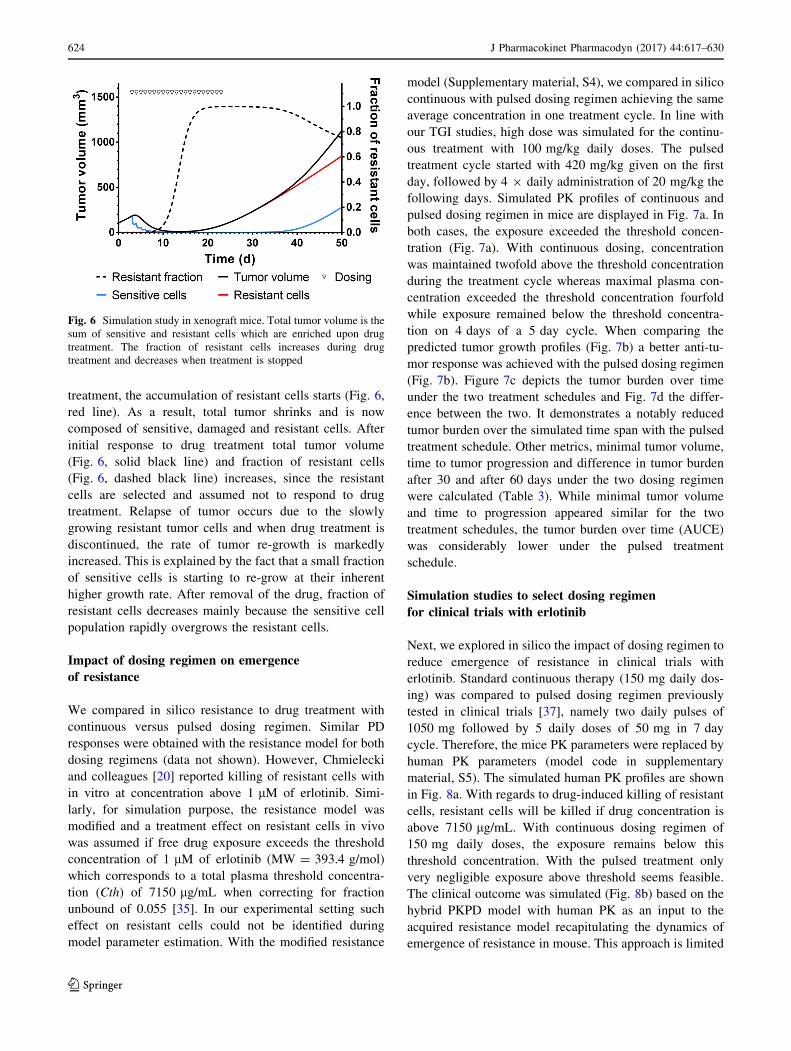
treatment, the accumulation of resistant cells starts (Fig. 6,
red line). As a result, total tumor shrinks and is now
composed of sensitive, damaged and resistant cells. After
initial response to drug treatment total tumor volume
(Fig. 6, solid black line) and fraction of resistant cells
(Fig. 6, dashed black line) increases, since the resistant
cells are selected and assumed not to respond to drug
treatment. Relapse of tumor occurs due to the slowly
growing resistant tumor cells and when drug treatment is
discontinued, the rate of tumor re-growth is markedly
increased. This is explained by the fact that a small fraction
of sensitive cells is starting to re-grow at their inherent
higher growth rate. After removal of the drug, fraction of
resistant cells decreases mainly because the sensitive cell
population rapidly overgrows the resistant cells.
Impact of dosing regimen on emergence
of resistance
We compared in silico resistance to drug treatment with
continuous versus pulsed dosing regimen. Similar PD
responses were obtained with the resistance model for both
dosing regimens (data not shown). However, Chmielecki
and colleagues [20] reported killing of resistant cells with
in vitro at concentration above 1 lM of erlotinib. Simi-
larly, for simulation purpose, the resistance model was
modified and a treatment effect on resistant cells in vivo
was assumed if free drug exposure exceeds the threshold
concentration of 1 lM of erlotinib (MW = 393.4 g/mol)
which corresponds to a total plasma threshold concentra-
tion (Cth) of 7150 lg/mL when correcting for fraction
unbound of 0.055 [35]. In our experimental setting such
effect on resistant cells could not be identified during
model parameter estimation. With the modified resistance
model (Supplementary material, S4), we compared in silico
continuous with pulsed dosing regimen achieving the same
average concentration in one treatment cycle. In line with
our TGI studies, high dose was simulated for the continu-
ous treatment with 100 mg/kg daily doses. The pulsed
treatment cycle started with 420 mg/kg given on the first
day, followed by 4 9 daily administration of 20 mg/kg the
following days. Simulated PK profiles of continuous and
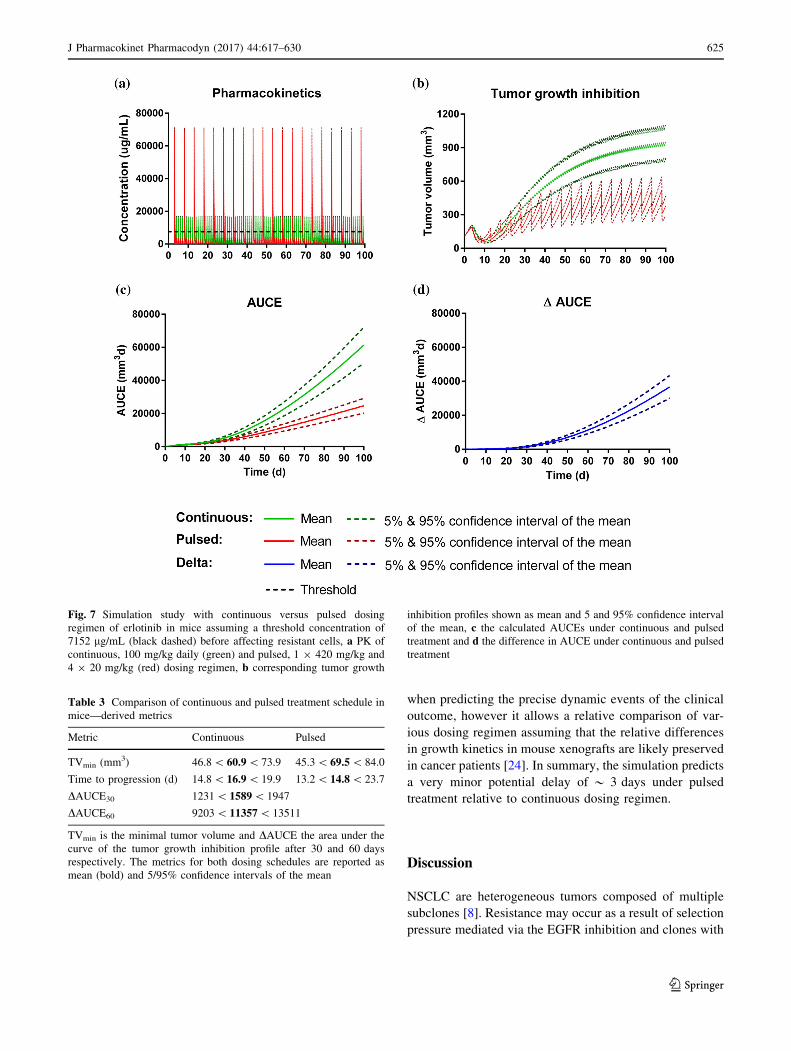
pulsed dosing regimen in mice are displayed in Fig. 7a. In
both cases, the exposure exceeded the threshold concen-
tration (Fig. 7a). With continuous dosing, concentration
was maintained twofold above the threshold concentration
during the treatment cycle whereas maximal plasma con-
centration exceeded the threshold concentration fourfold
while exposure remained below the threshold concentra-
tion on 4 days of a 5 day cycle. When comparing the
predicted tumor growth profiles (Fig. 7b) a better anti-tu-
mor response was achieved with the pulsed dosing regimen
(Fig. 7b). Figure 7c depicts the tumor burden over time
under the two treatment schedules and Fig. 7d the differ-
ence between the two. It demonstrates a notably reduced
tumor burden over the simulated time span with the pulsed
treatment schedule. Other metrics, minimal tumor volume,
time to tumor progression and difference in tumor burden
after 30 and after 60 days under the two dosing regimen
were calculated (Table 3). While minimal tumor volume
and time to progression appeared similar for the two
treatment schedules, the tumor burden over time (AUCE)
was considerably lower under the pulsed treatment
schedule.
Simulation studies to select dosing regimen
for clinical trials with erlotinib
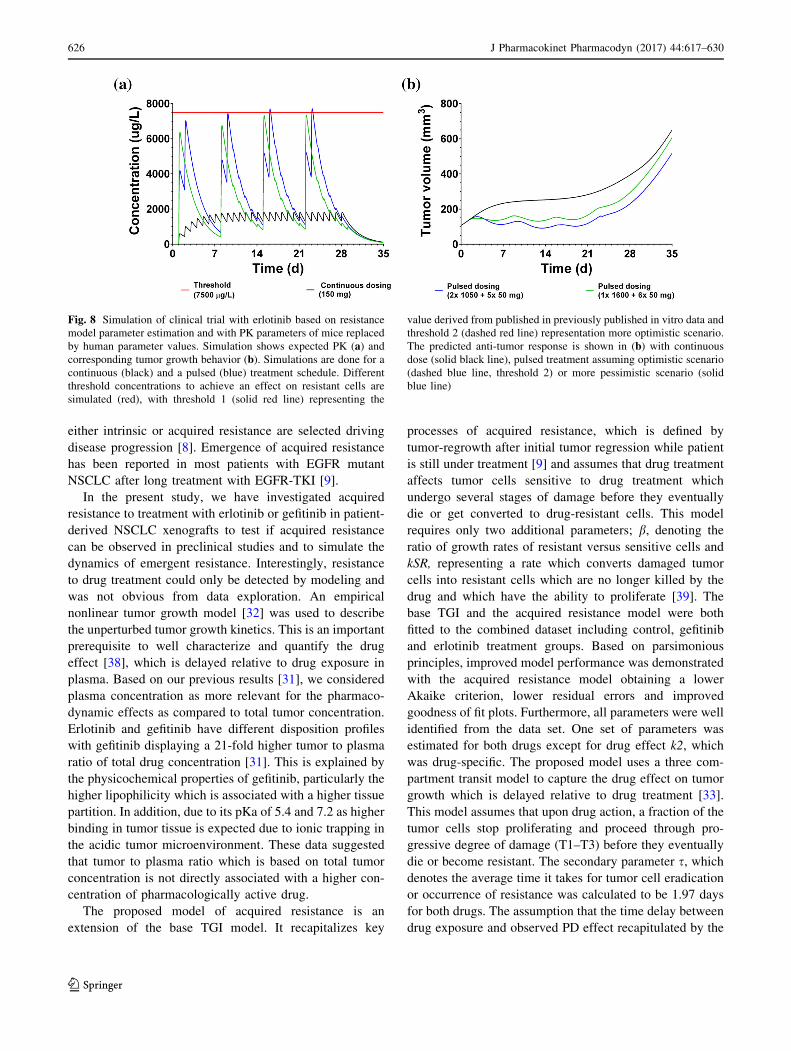
Next, we explored in silico the impact of dosing regimen to
reduce emergence of resistance in clinical trials with
erlotinib. Standard continuous therapy (150 mg daily dos-
ing) was compared to pulsed dosing regimen previously
tested in clinical trials [37], namely two daily pulses of
1050 mg followed by 5 daily doses of 50 mg in 7 day
cycle. Therefore, the mice PK parameters were replaced by
human PK parameters (model code in supplementary
material, S5). The simulated human PK profiles are shown
in Fig. 8a. With regards to drug-induced killing of resistant
cells, resistant cells will be killed if drug concentration is
above 7150 lg/mL. With continuous dosing regimen of
150 mg daily doses, the exposure remains below this
threshold concentration. With the pulsed treatment only
very negligible exposure above threshold seems feasible.
The clinical outcome was simulated (Fig. 8b) based on the
hybrid PKPD model with human PK as an input to the
acquired resistance model recapitulating the dynamics of
emergence of resistance in mouse. This approach is limited
Fig. 6 Simulation study in xenograft mice. Total tumor volume is the
sum of sensitive and resistant cells which are enriched upon drug
treatment. The fraction of resistant cells increases during drug
treatment and decreases when treatment is stopped
624 J Pharmacokinet Pharmacodyn (2017) 44:617–630
123
when predicting the precise dynamic events of the clinical
outcome, however it allows a relative comparison of var-
ious dosing regimen assuming that the relative differences
in growth kinetics in mouse xenografts are likely preserved
in cancer patients [24]. In summary, the simulation predicts
a very minor potential delay of * 3 days under pulsed
treatment relative to continuous dosing regimen.
Discussion
NSCLC are heterogeneous tumors composed of multiple
subclones [8]. Resistance may occur as a result of selection
pressure mediated via the EGFR inhibition and clones with
Fig. 7 Simulation study with continuous versus pulsed dosing
regimen of erlotinib in mice assuming a threshold concentration of
7152 lg/mL (black dashed) before affecting resistant cells, a PK of
continuous, 100 mg/kg daily (green) and pulsed, 1 9 420 mg/kg and
4 9 20 mg/kg (red) dosing regimen, b corresponding tumor growth
inhibition profiles shown as mean and 5 and 95% confidence interval
of the mean, c the calculated AUCEs under continuous and pulsed
treatment and d the difference in AUCE under continuous and pulsed
treatment
Table 3 Comparison of continuous and pulsed treatment schedule in
mice—derived metrics
Metric Continuous Pulsed
TVmin (mm3) 46.8\ 60.9\ 73.9 45.3\ 69.5\ 84.0
Time to progression (d) 14.8\ 16.9\ 19.9 13.2\ 14.8\ 23.7
DAUCE30 1231\ 1589\ 1947
DAUCE60 9203\ 11357\ 13511
TVmin is the minimal tumor volume and DAUCE the area under the
curve of the tumor growth inhibition profile after 30 and 60 days
respectively. The metrics for both dosing schedules are reported as
mean (bold) and 5/95% confidence intervals of the mean
J Pharmacokinet Pharmacodyn (2017) 44:617–630 625
123
either intrinsic or acquired resistance are selected driving
disease progression [8]. Emergence of acquired resistance
has been reported in most patients with EGFR mutant
NSCLC after long treatment with EGFR-TKI [9].
In the present study, we have investigated acquired
resistance to treatment with erlotinib or gefitinib in patient-
derived NSCLC xenografts to test if acquired resistance
can be observed in preclinical studies and to simulate the
dynamics of emergent resistance. Interestingly, resistance
to drug treatment could only be detected by modeling and
was not obvious from data exploration. An empirical
nonlinear tumor growth model [32] was used to describe
the unperturbed tumor growth kinetics. This is an important
prerequisite to well characterize and quantify the drug
effect [38], which is delayed relative to drug exposure in
plasma. Based on our previous results [31], we considered
plasma concentration as more relevant for the pharmaco-
dynamic effects as compared to total tumor concentration.
Erlotinib and gefitinib have different disposition profiles
with gefitinib displaying a 21-fold higher tumor to plasma
ratio of total drug concentration [31]. This is explained by
the physicochemical properties of gefitinib, particularly the
higher lipophilicity which is associated with a higher tissue
partition. In addition, due to its pKa of 5.4 and 7.2 as higher
binding in tumor tissue is expected due to ionic trapping in
the acidic tumor microenvironment. These data suggested
that tumor to plasma ratio which is based on total tumor
concentration is not directly associated with a higher con-
centration of pharmacologically active drug.
The proposed model of acquired resistance is an
extension of the base TGI model. It recapitalizes key
processes of acquired resistance, which is defined by
tumor-regrowth after initial tumor regression while patient
is still under treatment [9] and assumes that drug treatment
affects tumor cells sensitive to drug treatment which
undergo several stages of damage before they eventually
die or get converted to drug-resistant cells. This model
requires only two additional parameters; b, denoting the
ratio of growth rates of resistant versus sensitive cells and
kSR, representing a rate which converts damaged tumor
cells into resistant cells which are no longer killed by the
drug and which have the ability to proliferate [39]. The
base TGI and the acquired resistance model were both
fitted to the combined dataset including control, gefitinib
and erlotinib treatment groups. Based on parsimonious
principles, improved model performance was demonstrated
with the acquired resistance model obtaining a lower
Akaike criterion, lower residual errors and improved
goodness of fit plots. Furthermore, all parameters were well
identified from the data set. One set of parameters was
estimated for both drugs except for drug effect k2, which
was drug-specific. The proposed model uses a three com-
partment transit model to capture the drug effect on tumor
growth which is delayed relative to drug treatment [33].
This model assumes that upon drug action, a fraction of the
tumor cells stop proliferating and proceed through pro-
gressive degree of damage (T1–T3) before they eventually
die or become resistant. The secondary parameter s, whichdenotes the average time it takes for tumor cell eradication
or occurrence of resistance was calculated to be 1.97 days
for both drugs. The assumption that the time delay between
drug exposure and observed PD effect recapitulated by the
Fig. 8 Simulation of clinical trial with erlotinib based on resistance
model parameter estimation and with PK parameters of mice replaced
by human parameter values. Simulation shows expected PK (a) andcorresponding tumor growth behavior (b). Simulations are done for a
continuous (black) and a pulsed (blue) treatment schedule. Different
threshold concentrations to achieve an effect on resistant cells are
simulated (red), with threshold 1 (solid red line) representing the
value derived from published in previously published in vitro data and
threshold 2 (dashed red line) representation more optimistic scenario.
The predicted anti-tumor response is shown in (b) with continuous
dose (solid black line), pulsed treatment assuming optimistic scenario
(dashed blue line, threshold 2) or more pessimistic scenario (solid
blue line)
626 J Pharmacokinet Pharmacodyn (2017) 44:617–630
123
transit rate parameter k1 is the same for both drugs is
substantiated with reports on experimental data demon-
strating the similarity in molecular specificity particularly
with regards to downstream signaling. Both, erlotinib and
gefitinib are competitive inhibitors of the EGFR tyrosine
kinase and have been shown to possess almost identical
pharmacodynamic activities across a range of in vitro and
xenograft experiments [31, 40]. Furthermore, it has been
described, that the course of acquired resistance [20] as
well as the molecular mechanisms [17] are the same for
both drugs. Therefore, we assume that the parameters
related to acquired resistance are the same.
We identified the high dose group as covariate on the
conversion rate kSR. Interestingly, the concentration
reached at this dose is above the threshold concentration
above which cells are assumed to be killed when taking the
in vitro results into consideration [21]. In addition, the high
dose of erlotinib was identified as a covariate on the drug
effect parameter k2, suggestion a higher potency of high
dose group. This dose-dependency indicates a nonlinear
drug effect relationship. A sigmoid Emax-model was tested
to capture the nonlinear drug effect but underlying
parameters could not be identified under the current study
design. Furthermore, the parameters Emax and EC50 were
highly correlated. This suggests that the dose range tested
was not sufficient to explore the maximal response. The
higher k2 value of the high dose can be interpreted as an
increase in steepness of the dose–response curve at this
dose level. This is most likely around the EC50 whereas
the mid and low dose most likely below 20% of the
maximal response. Measuring additional dose levels higher
than 100 mg/kg or between the mid and high dose would
allow exploring the non-linear drug effect. Another limi-
tation of the current study design was that tumor samples
were not tested for presence of resistant cells and the
model-derived hypothesis was not substantiated with bio-
logical evidence. Genotyping of patient derived tumors in
mice is recommended in further tumor growth inhibition
studies to assess genetic alteration leading to TKI drug
resistance.
Wang and colleagues reported that * 20–30% of
NSCLC patients have no objective tumor regression on
initial EGFR TKI treatment due to intrinsic or primary
resistance to EGFR TKIs [39]. The proposed model does
not capture primary resistance to drug treatment and is
restricted to acquired resistance which occurs as a result of
drug treatment. It should be noted that in the current study,
initially, all animals responded to the drug treatment. In
addition, it was not possible to estimate an initial pool of
resistant cells (data not shown) to the observed data most
likely because resistant tumor cells are negligible at the
start of the study [21]. The model was applied to assess the
dynamic processes of acquired resistance which is of
clinical relevance. We simulated the response on overall
tumor growth and the accumulation of resistant cells during
and after long term treatment assuming no drug effect on
resistant cells. The model predicts tumor shrinkage at the
beginning of drug treatment followed by relapse during
treatment with a high fraction of resistant cells. In line with
clinical reports, the model suggests a worsening of diseases
progression after discontinuation of drug treatment due to
the rebound of faster growing sensitive tumor cells
[10, 15, 20]. This explanation is further supported by
in vitro findings [21] demonstrating that that sensitive and
drug resistant EGFR-mutant cells exhibit differential
growth dynamics with drug resistant cells showing slower
growth. Furthermore, resistant tumors are composed of a
heterogeneous mix of TKI-sensitive and -resistant tumor
cells and that stopping TKI therapy may permit expansion
[21]. In this in vitro study, EGFR-resistant cells were killed
by high concentration of erlotinib and it was suggested that
a pulsed treatment with high doses followed by lower doses
might be more beneficial than the traditional continuous
dosing schedule. Interestingly, a clinical trial was initiated
in order to test this potential benefit [37]. In the present
study, we could not identify a killing term on resistant cells
(data not shown). However, in simulations studies we
predicted a reduction in overall tumor volume when sim-
ulation dosing schedules achieving exposures above the
threshold concentration of 7150 lg/mL above which
resistant cells is assumed to be killed. With this model
expansion, we explored, based on in silico simulations, if
the suggested pulsed dosing regimen is superior to con-
tinuous treatment. In mice, we compared continuous to
pulsed dosing regimen with both regimen achieving the
same average concentration. After long term treatment, the
pulsed dosing regimen is predicted to have an improved
anti-tumor response in mice albeit only short exposure
peaks above the threshold concentration are achieved. The
continuous dosing regimen did not prevent emergence of
resistance despite having exposure levels slightly above the
threshold during the whole treatment period. Based on PK
data only, this result may be counterintuitive and illustrates
how in silico exploration can be used to better understand
the driving forces of a PD endpoint. In a next step, it is
proposed to test this new hypothesis experimentally and to
conduct vivo experiments to verify the outcome of the
simulation study. This will increase the confidence that
intermittent dosing regimen has an impact and reduces
emergence of resistance.
The proposed PKPD model is a semi-mechanistic model
which allows mechanistic interpretation of the drug effect
and enables simulations of untested scenarios. Several
retrospective studies could show a clear relationship of the
predicted efficacious exposure derived from the transla-
tional PKPD model and the observed clinical activity in
J Pharmacokinet Pharmacodyn (2017) 44:617–630 627
123
cancer patients when accounting for the PK differences
between the species [31, 40, 41]. Therefore, we proposed a
hybrid PKPD model where human PK is used as input to
the acquired resistance model developed in mice. Tumor
growth rate in patient is generally observed slower than in
mice and the proposed hybrid PKPD model is not intended
to predict tumor growth dynamic in treated patients. Kill-
ing rate is also described as correlated to tumor growth rate
[42] and one could assume that net effect (growth minus
killing) could indeed translate from mice to human without
parameter scaling. This approach is supported by published
translational PKPD models [31, 40, 41]. If the goal was to
predict the time course of tumor growth and shrinkage in
patients, then all PKPD model components need to be
scaled to cancer patients. The challenge is to obtain rele-
vant parameters on tumor growth and shrinkage which
greatly depends on the context. For instance, it is reported
that the doubling time of cancer cells in in vitro systems is
much faster as compared to the doubling time after
engrafting into xenograft mice [43]. In addition, the time-
scale of tumor shrinkage in mice greatly differs cancer
patients [42]. In summary, when scaling the full PKPD
model to humans, additional uncertainty is introduced
which will reduced the confidence in model prediction.
Therefore, the hybrid model was seen as the better
approach to compare different dosing regimens without the
additional burden of scaling tumor growth and tumor
shrinkage parameters.
With the hybrid model, we simulated the expected
response in cancer patients of a previously reported
improved treatment schedule based on an evolutionary
modeling approach [21, 44]. This dosing schedule combi-
nes high-dose pulse and daily low-dose administration of
erlotinib and was previously tested in a Phase I trial [37].
The results of this Phase I study showed no improvement
with regards to progression free survival or delay of
emergence of resistance [37]. In line, our simulation results
showed a minor delay in tumor-regrowth compared to the
standard therapy treatment of 150 mg daily doses. It was
concluded that the pulse dosing was too low to affect
resistant cells to ultimately improve the clinical outcome.
Higher doses would need to be administered in order to
achieve sufficient exposure to kill resistant cells. However,
this will be limited to the tolerability of high doses. In order
to increase confidence in this threshold concentration, it is
suggested to compare this experimentally as proposed with
the simulation study which suggests a benefit of the pulsed
dosing regimen. In this study, continuous and pulsed dos-
ing regimen are compared with regards to tumor growth.
According to the simulations, this beneficial effect could
become apparent after 60 days of treatment. The proposed
dosing regimen will achieved the same overall exposure.
The continuous dosing regimen remains below the
threshold concentration, whereas the pulsed treatment
reaching concentration above the threshold concentration.
Conclusion
We proposed a semi-mechanistic model following parsi-
monious principles to characterize emergence of resistance
to drug treatment in patient derived NSCLC xenograft
mice. The model provides mechanistic insights into the
dynamic processes of acquired resistance. It predicts tumor
regrowth during treatment driven by the selection of
resistant cells and it offers an explanation why faster tumor
regrowth may occur after discontinuation of TKI treatment.
The model was further applied to compare in silico dif-
ferent dosing regimen and their impact on acquired resis-
tance. This allows to explore hypothesis and to design
studies allowing testing those. Finally, we propose to
explore in silico different scenarios and to identify optimal
treatment schedules for clinical trials.
Compliance with ethical standards
Conflict of interest All authors were full-time employees of F.
Hoffmann-La Roche Ltd and potentially owned stock in F. Hoff-
mann-La Roche Ltd when work presented in this manuscript was
conducted.
Open Access This article is distributed under the terms of the
Creative Commons Attribution 4.0 International License (http://crea
tivecommons.org/licenses/by/4.0/), which permits unrestricted use,
distribution, and reproduction in any medium, provided you give
appropriate credit to the original author(s) and the source, provide a
link to the Creative Commons license, and indicate if changes were
made.
References
1. Mok TS, Wu YL, Thongprasert S, Yang CH, Chu DT, Saijo N,
Sunpaweravong P, Han B, Margono B, Ichinose Y, Nishiwaki Y,
Ohe Y, Yang JJ, Chewaskulyong B, Jiang H, Duffield EL,
Watkins CL, Armour AA, Fukuoka M (2009) Gefitinib or car-
boplatin-paclitaxel in pulmonary adenocarcinoma. N Engl J Med
361(10):947–957. https://doi.org/10.1056/NEJMoa0810699
2. Paez JG, Janne PA, Lee JC, Tracy S, Greulich H, Gabriel S,
Herman P, Kaye FJ, Lindeman N, Boggon TJ, Naoki K, Sasaki H,
Fujii Y, Eck MJ, Sellers WR, Johnson BE, Meyerson M (2004)
EGFR mutations in lung cancer: correlation with clinical
response to gefitinib therapy. Science 304(5676):1497–1500.
https://doi.org/10.1126/science.1099314
3. Shepherd FA, Rodrigues Pereira J, Ciuleanu T, Tan EH, Hirsh V,
Thongprasert S, Campos D, Maoleekoonpiroj S, Smylie M,
Martins R, van Kooten M, Dediu M, Findlay B, Tu D, Johnston
D, Bezjak A, Clark G, Santabarbara P, Seymour L (2005) Erlo-
tinib in previously treated non-small-cell lung cancer. N Engl J
Med 353(2):123–132. https://doi.org/10.1056/NEJMoa050753
4. Albanell J, Gascon P (2005) Small molecules with EGFR-TK
inhibitor activity. Curr Drug Targets 6(3):259–274
628 J Pharmacokinet Pharmacodyn (2017) 44:617–630
123
5. Yewale C, Baradia D, Vhora I, Patil S, Misra A (2013) Epidermal
growth factor receptor targeting in cancer: a review of trends and
strategies. Biomaterials 34(34):8690–8707. https://doi.org/10.
1016/j.biomaterials.2013.07.100
6. Bronte G, Rolfo C, Giovannetti E, Cicero G, Pauwels P, Passiglia
F, Castiglia M, Rizzo S, Vullo FL, Fiorentino E, Van Meerbeeck
J, Russo A (2014) Are erlotinib and gefitinib interchangeable,
opposite or complementary for non-small cell lung cancer treat-
ment? biological, pharmacological and clinical aspects. Crit Rev
Oncol Hematol 89(2):300–313. https://doi.org/10.1016/j.cri
trevonc.2013.08.003
7. Jackman D, Pao W, Riely GJ, Engelman JA, Kris MG, Janne PA,
Lynch T, Johnson BE, Miller VA (2010) Clinical definition of
acquired resistance to epidermal growth factor receptor tyrosine
kinase inhibitors in non-small-cell lung cancer. J Clin Oncol
28(2):357–360. https://doi.org/10.1200/JCO.2009.24.7049
8. Morgillo F, Della Corte CM, Fasano M, Ciardiello F (2016)
Mechanisms of resistance to EGFR-targeted drugs: lung cancer.
ESMO Open 1(3):e000060. https://doi.org/10.1136/esmoopen-
2016-000060
9. Lovly CM (2015) Combating acquired resistance to tyrosine
kinase inhibitors in lung cancer. Am Soc Clin Oncol. https://doi.
org/10.14694/EdBook_AM.2015.35.e165
10. Chen Q, Quan Q, Ding L, Hong X, Zhou N, Liang Y, Wu H
(2015) Continuation of epidermal growth factor receptor tyrosine
kinase inhibitor treatment prolongs disease control in non-small-
cell lung cancers with acquired resistance to EGFR tyrosine
kinase inhibitors. Oncotarget 6(28):24904–24911. https://doi.org/
10.18632/oncotarget.4570
11. Engelman JA, Janne PA (2008) Mechanisms of acquired resis-
tance to epidermal growth factor receptor tyrosine kinase inhi-
bitors in non-small cell lung cancer. Clin Cancer Res
14(10):2895–2899. https://doi.org/10.1158/1078-0432.CCR-07-
2248
12. Guix M, Faber AC, Wang SE, Olivares MG, Song Y, Qu S,
Rinehart C, Seidel B, Yee D, Arteaga CL, Engelman JA (2008)
Acquired resistance to EGFR tyrosine kinase inhibitors in cancer
cells is mediated by loss of IGF-binding proteins. J Clin Invest
118(7):2609–2619. https://doi.org/10.1172/JCI34588
13. Kosaka T, Yamaki E, Mogi A, Kuwano H (2011) Mechanisms of
resistance to EGFR TKIs and development of a new generation of
drugs in non-small-cell lung cancer. J Biomed Biotechnol
2011:165214. https://doi.org/10.1155/2011/165214
14. Sierra JR, Cepero V, Giordano S (2010) Molecular mechanisms
of acquired resistance to tyrosine kinase targeted therapy. Mol
Cancer 9:75. https://doi.org/10.1186/1476-4598-9-75
15. Gainor JF, Shaw AT (2013) Emerging paradigms in the devel-
opment of resistance to tyrosine kinase inhibitors in lung cancer.
J Clin Oncol 31(31):3987–3996. https://doi.org/10.1200/JCO.
2012.45.2029
16. Oxnard GR, Arcila ME, Sima CS, Riely GJ, Chmielecki J, Kris
MG, Pao W, Ladanyi M, Miller VA (2011) Acquired resistance
to EGFR tyrosine kinase inhibitors in EGFR-mutant lung cancer:
distinct natural history of patients with tumors harboring the
T790 M mutation. Clin Cancer Res 17(6):1616–1622. https://doi.
org/10.1158/1078-0432.CCR-10-2692
17. Yu HA, Arcila ME, Rekhtman N, Sima CS, Zakowski MF, Pao
W, Kris MG, Miller VA, Ladanyi M, Riely GJ (2013) Analysis of
tumor specimens at the time of acquired resistance to EGFR-TKI
therapy in 155 patients with EGFR-mutant lung cancers. Clin
Cancer Res 19(8):2240–2247. https://doi.org/10.1158/1078-0432.
CCR-12-2246
18. Pao W, Miller VA, Politi KA, Riely GJ, Somwar R, Zakowski
MF, Kris MG, Varmus H (2005) Acquired resistance of lung
adenocarcinomas to gefitinib or erlotinib is associated with a
second mutation in the EGFR kinase domain. PLoS Med
2(3):e73. https://doi.org/10.1371/journal.pmed.0020073
19. Yun CH, Mengwasser KE, Toms AV, Woo MS, Greulich H,
Wong KK, Meyerson M, Eck MJ (2008) The T790M mutation in
EGFR kinase causes drug resistance by increasing the affinity for
ATP. Proc Natl Acad Sci USA 105(6):2070–2075. https://doi.org/
10.1073/pnas.0709662105
20. Chaft JE, Oxnard GR, Sima CS, Kris MG, Miller VA, Riely GJ
(2011) Disease flare after tyrosine kinase inhibitor discontinua-
tion in patients with EGFR-mutant lung cancer and acquired
resistance to erlotinib or gefitinib: implications for clinical trial
design. Clin Cancer Res 17(19):6298–6303. https://doi.org/10.
1158/1078-0432.CCR-11-1468
21. Chmielecki J, Foo J, Oxnard GR, Hutchinson K, Ohashi K,
Somwar R, Wang L, Amato KR, Arcila M, Sos ML, Socci ND,
Viale A, de Stanchina E, Ginsberg MS, Thomas RK, Kris MG,
Inoue A, Ladanyi M, Miller VA, Michor F, Pao W (2011)
Optimization of dosing for EGFR-mutant non-small cell lung
cancer with evolutionary cancer modeling. Sci Transl Med
3(90):90ra59. https://doi.org/10.1126/scitranslmed.3002356
22. Chong CR, Janne PA (2013) The quest to overcome resistance to
EGFR-targeted therapies in cancer. Nat Med 19(11):1389–1400.
https://doi.org/10.1038/nm.3388
23. Yoshimura N, Okishio K, Mitsuoka S, Kimura T, Kawaguchi T,
Kobayashi M, Hirashima T, Daga H, Takeda K, Hirata K, Kudoh
S (2013) Prospective assessment of continuation of erlotinib or
gefitinib in patients with acquired resistance to erlotinib or gefi-
tinib followed by the addition of pemetrexed. J Thorac Oncol
8(1):96–101. https://doi.org/10.1097/JTO.0b013e3182762bfb
24. Foo J, Michor F (2010) Evolution of resistance to anti-cancer
therapy during general dosing schedules. J Theor Biol
263(2):179–188. https://doi.org/10.1016/j.jtbi.2009.11.022
25. Katayama R, Khan TM, Benes C, Lifshits E, Ebi H, Rivera VM,
Shakespeare WC, Iafrate AJ, Engelman JA, Shaw AT (2011)
Therapeutic strategies to overcome crizotinib resistance in non-
small cell lung cancers harboring the fusion oncogene EML4-
ALK. Proc Natl Acad Sci USA 108(18):7535–7540. https://doi.
org/10.1073/pnas.1019559108
26. Riely GJ, Kris MG, Zhao B, Akhurst T, Milton DT, Moore E,
Tyson L, Pao W, Rizvi NA, Schwartz LH, Miller VA (2007)
Prospective assessment of discontinuation and reinitiation of
erlotinib or gefitinib in patients with acquired resistance to erlo-
tinib or gefitinib followed by the addition of everolimus. Clin
Cancer Res 13(17):5150–5155. https://doi.org/10.1158/1078-
0432.CCR-07-0560
27. Das Thakur M, Salangsang F, Landman AS, Sellers WR, Pryer
NK, Levesque MP, Dummer R, McMahon M, Stuart DD (2013)
Modelling vemurafenib resistance in melanoma reveals a strategy
to forestall drug resistance. Nature 494(7436):251–255. https://
doi.org/10.1038/nature11814
28. Foo J, Michor F (2014) Evolution of acquired resistance to anti-
cancer therapy. J Theor Biol 355:10–20. https://doi.org/10.1016/j.
jtbi.2014.02.025
29. Hadjiandreou MM, Mitsis GD (2014) Mathematical modeling of
tumor growth, drug-resistance, toxicity, and optimal therapy
design. IEEE Trans Biomed Eng 61(2):415–425. https://doi.org/
10.1109/TBME.2013.2280189
30. Li RC, Nix DE, Schentag JJ (1994) Pharmacodynamic modeling
of bacterial kinetics: beta-lactam antibiotics against Escherichia
coli. J Pharm Sci 83(7):970–975
31. Eigenmann MJ, Frances N, Hoffmann G, Lave T, Walz AC
(2016) Combining nonclinical experiments with translational
pkpd modeling to differentiate erlotinib and gefitinib. Mol Cancer
Ther 15(12):3110–3119. https://doi.org/10.1158/1535-7163.mct-
16-0076
J Pharmacokinet Pharmacodyn (2017) 44:617–630 629
123
32. Koch G, Walz A, Lahu G, Schropp J (2009) Modeling of tumor
growth and anticancer effects of combination therapy. J Pharma-
cokinet Pharmacodyn 36(2):179–197. https://doi.org/10.1007/
s10928-009-9117-9
33. Simeoni M, Magni P, Cammia C, De Nicolao G, Croci V, Pesenti
E, Germani M, Poggesi I, Rocchetti M (2004) Predictive phar-
macokinetic-pharmacodynamic modeling of tumor growth
kinetics in xenograft models after administration of anticancer
agents. Cancer Res 64(3):1094–1101
34. Jusko WJ (1971) Pharmacodynamics of chemotherapeutic
effects: dose-time-response relationships for phase-nonspecific
agents. J Pharm Sci 60(6):892–895
35. Hoshino-Yoshino A, Kato M, Nakano K, Ishigai M, Kudo T, Ito
K (2011) Bridging from preclinical to clinical studies for tyrosine
kinase inhibitors based on pharmacokinetics/pharmacodynamics
and toxicokinetics/toxicodynamics. Drug Metab Pharmacokinet
26(6):612–620. https://doi.org/10.2133/dmpk.DMPK-11-RG-043
36. Sheiner LB, Beal SL (1980) Evaluation of methods for estimating
population pharmacokinetics parameters. I. Michaelis-Menten
model: routine clinical pharmacokinetic data. J Pharmacokinet
Biopharm 8(6):553–571
37. Yu HA, Sima C, Feldman D, Liu LL, Vaitheesvaran B, Cross J,
Rudin CM, Kris MG, Pao W, Michor F, Riely GJ (2017) Phase 1
study of twice weekly pulse dose and daily low-dose erlotinib as
initial treatment for patients with EGFR-mutant lung cancers
dagger. Ann Oncol 28(2):278–284. https://doi.org/10.1093/
annonc/mdw556
38. Mould DR, Walz AC, Lave T, Gibbs JP, Frame B (2015)
Developing exposure/response models for anticancer drug
treatment: special considerations. CPT Pharmacomet Syst Phar-
macol 4(1):e00016. https://doi.org/10.1002/psp4.16
39. Wang J, Wang B, Chu H, Yao Y (2016) Intrinsic resistance to
EGFR tyrosine kinase inhibitors in advanced non-small-cell lung
cancer with activating EGFR mutations. Onco Targets Ther
9:3711–3726. https://doi.org/10.2147/ott.s106399
40. Rocchetti M, Simeoni M, Pesenti E, De Nicolao G, Poggesi I
(2007) Predicting the active doses in humans from animal studies:
a novel approach in oncology. Eur J Cancer 43(12):1862–1868.
https://doi.org/10.1016/j.ejca.2007.05.011
41. Wong H, Choo EF, Alicke B, Ding X, La H, McNamara E, Theil
FP, Tibbitts J, Friedman LS, Hop CE, Gould SE (2012) Antitu-
mor activity of targeted and cytotoxic agents in murine subcu-
taneous tumor models correlates with clinical response. Clin
Cancer Res 18(14):3846–3855. https://doi.org/10.1158/1078-
0432.ccr-12-0738
42. Mitchison TJ (2012) The proliferation rate paradox in antimitotic
chemotherapy. Mol Biol Cell 23(1):1–6. https://doi.org/10.1091/
mbc.E10-04-0335
43. Lee JY, Kim MS, Kim EH, Chung N, Jeong YK (2016) Retro-
spective growth kinetics and radiosensitivity analysis of various
human xenograft models. Lab Anim Res 32(4):187–193. https://
doi.org/10.5625/lar.2016.32.4.187
44. Foo J, Chmielecki J, Pao W, Michor F (2012) Effects of phar-
macokinetic processes and varied dosing schedules on the
dynamics of acquired resistance to erlotinib in EGFR-mutant lung
cancer. J Thorac Oncol 7(10):1583–1593. https://doi.org/10.1097/
JTO.0b013e31826146ee
630 J Pharmacokinet Pharmacodyn (2017) 44:617–630
123