PKN ORLEN · Banks and Companies Ranking in the Pomorze and Kujawy regions. ORLEN Budonaft •...
206
Transcript of PKN ORLEN · Banks and Companies Ranking in the Pomorze and Kujawy regions. ORLEN Budonaft •...


PKN ORLEN• ORLEN was considered to be the most valuable Polish
brand in the MARQA 2009 ranking of Polish most
valuable brands organised by Rzeczpospolita daily.
• Two awards for PKN ORLEN Social Responsibility Report
in the “2009 Social Responsibility Reports” competi-
tion organised by the Polish Corporate Responsibility
Forum.
• The “Best Investor Relations in Poland 2009” award
granted by IR Magazine.
• “The Queen of Sport Laurel” in the “Sponsor” category
granted by the Polish Athletics Federation.
• “Consumer Laurel” and “Builder of the Fleet Market”
statuette in recognition of PKN ORLEN’s achievements,
awarded by consumers and industrial circles, respectively.
• PKN ORLEN’s fleet cards were awarded the “Fleet
Product of the Year” title in the Polish Fleet Awards
2009 plebiscite organised by Magazyn Flota periodi-
cal and Fleet Management Institute Central-Eastern
Europe.
• 1st place in the WarsawScan ranking, in the category
of websites devoted to investor relations.
• ORLEN Team among the winners of Dakar Raly: Jakub
Przygoński – 11th place, Jacek Czachor – 20th place,
and Hołowczyc /Fortin car team – 5th place in general
classification.
• The success of ORLEN Team motorcyclists: Jakub
Przygoński – 2nd place and Jacek Czachor – 3rd place
in FIM World Cup.
• Prestigious “Abu Dhabi Spirit of the Rally” award won
by the ORLEN Team: Krzysztof Hołowczyc and Łukasz
Kurzeja awarded for great driving and very good results
at the ORLEN Platinum 66th Rally in Poland, eighth
eliminations for the World Rally Championship.
• ORLEN MONSTER JAM awarded in the “event market-
ing” category of the Golden Arrow competition.
• 1st place in the “Friendliness, Sector, Industry” category
of the 5th edition of the KOMPAS Polish employer
ranking.
• 3rd place in the “Employer for Engineer” plebiscite.
• “Industry leader: fuels, oils” award in the “Universum
Student Survey 2009”.
UNIPETROL • 5th place among “Top 100” Czech companies in
terms of revenue.
• 8th place among “Top 100” Czech companies in
terms of the best 2008 Annual Report.
• “Zlaty Strednik 2008” – award granted in the Czech
Republic for the utmost quality of Annual Reports.
• 22nd place in the Deloitte’s Central Europe Top 500
ranking.
• 2nd place in the “Energy Sector” category of the
prestigious “Best CEE Companies” competition
organised by Euromoney.
• PETROLaward for BENZINA in the “Public and Profes-
sional Activity” category for the “Benzina Transfor-
mation at the Turn of Centuries” publication.
• PETROLaward for Ceska Rafinerska in the “Techno-
logy and Products” category for the modernisation
of the LPG unit at the Kralupy Refinery.
ORLEN Lietuva • “Authorised Economic Operator’s” (AEO) Certificate.
• International ISO 9001 Certificate
ORLEN Deutschland • 4th place in the German ranking of the most popular
petrol stations organised by Tankstelle-Magazin.
Rafineria Trzebinia • “Environmentally Friendly Company” certificate in
the 3rd edition of an environmental competition
organised by the European Environmental Respon-
sibility Forum.
• “Environmental Partner” title granted in the 10th edi-
tion of the Polish “Environmentally Friendly” contest.
• “Corporate Social Responsibility Leaders – Good Com-
pany” logo awarded by the Forum Biznesu Gazety
Prawnej (Business Forum of Gazeta Prawna newspaper).
• EUROBRAND title awarded for pharmaceutical glyc-
erine in the product category of a competition
organised under the auspices of the Polish Minister
of Economy and Minister of Regional Development.
• Award for BIOESTERS manufactured by the Trzebinia
Refinery in the Polish Environmental Pantheon 2009
contest.
ORLEN Oil• The Company received the prestigious “Teraz Polska”
promotional logo awarded to Polish products and
services for its Platinum oils.
• “Customer Lauer” for the best product in the
“Motor Oil” category.
• The “Pearl of the Polish Economy” title in the “Large
Pearls” category.
• Certificate of the Polish Chamber of Commerce
confirming an entry in the Honorary Book of Awards.
ANWIL• “Environmentally Friendly Company” title in an en-
vironmental competition organised by the European
Environmental Responsibility Forum.
• CSR24/7Rating Certificate for the third place in a
Corporate Social Responsibility (CSR3) ranking.
• Eighth Diamond to the Polish Business Leader Statuette.
• Award granted by the Polish Minister of Environment
for special scientific and research achievements in 2009.
• EUROPOWER 2009 award in the “Electrical Power
Solutions for the Industry” category granted at the
2009 EUROPOWER Conference.
IKS ”SOLINO” • 2nd place in the “Profitability” category; 10th place
in the – “Capital Efficiency” category, 19th place
in the ‘Revenue” category and 22nd place in the –
“Revenue Growth Dynamics” in the Golden 100
Banks and Companies Ranking in the Pomorze and
Kujawy regions.
ORLEN Budonaft • “Market Euroleader 2009” and “Market Leader
2009” certificates in the “Best Service – Petrol Sta-
tion Construction” category.
• Integrated Management System Certificate with re-
spect to the following standards: EN-ISO 9001:2008,
EN ISO 14001:2004 and PN-N 18001:2004.
ORLEN Laboratorium • “Reliable Company” title awarded for timely per-
formance of all obligations and respect for the
environment and consumer rights.
• “Mazowsze Company of the Year 2009” – award
granted in the corporate services category.
• “Top Quality” Title – Company of the Year 2009.
ORLEN Ochrona • “Business Gazelle” title awarded by Puls Biznesu, a
prestigious Polish periodical, for dynamic development.
ORLEN Petrocentrum • 23rd among “Top 500” companies according to a
ranking by Rzeczpospolita daily.
• 123rd place in Deloitte’s 3rd “Central Europe Top
500” ranking.
The most important awards and certificates received by ORLEN Group companies in 2009
Annual Report 2009

pkn
oR
len
An
nU
Al
Rep
oR
T 20
09
2
3
Contents
PKN ORLEN Supervisory Board ......................................................................................................................... 4
Letter from the Chairman of the PKN ORLEN Supervisory Board ..................................................................... 5
PKN ORLEN Management Board .................................................................................................................... 6
Letter from the President of the PKN ORLEN Management Board ................................................................... 8
About PKN ORLEN ....................................................................................................................................... 12
ORLEN Group strategy ................................................................................................................................. 22
Upstream segment ........................................................................................................................................ 26
Refinery segment ........................................................................................................................................... 30
Logistics ........................................................................................................................................................ 40
Wholesale segment ...................................................................................................................................... 48
Oil segment .................................................................................................................................................. 56
Retail segment ............................................................................................................................................. 62
Petrochemical segment .................................................................................................................................. 72
Chemical segment ........................................................................................................................................ 80
ORLEN Group ................................................................................................................................................ 86
Employees .................................................................................................................................................... 92
Environmental protection ............................................................................................................................. 98
Opinion from an Independent Certified Auditor .......................................................................................... 104
Consolidated Financial Statement ............................................................................................................... 108
Contact data ............................................................................................................................................... 203
pkn
oR
len
RA
poR
T R
oC
zny
200
9
4
pkn oRlen Supervisory Board*
Maciej MataczyńskiChairman of the Supervisory Board
Independent Member of the Supervisory Board
Marek karabułaDeputy Chairman of the Supervisory Board
Angelina SarotaSecretary of the Supervisory Board
Grzegorz BorowiecMember of the Supervisory Board
krzysztof kołachIndependent Member of the Supervisory Board
Jarosław Stanisław RocławskiMember of the Supervisory Board
piotr WielowieyskiIndependent Member of the Supervisory Board
Janusz zielińskiIndependent Member of the Supervisory Board
* Composition of Supervisory Board as of 2 June 2010.
• pk
n o
Rle
n S
Upe
Rv
iSo
Ry
Bo
AR
d

5
letter from the Chairman of the pkn oRlen Supervisory Board
dear Sir or Madam,
2009, difficult as it was for the entire economy, and in particular for the fuel
industry, was for PKN ORLEN a year of consistent implementation of its long-term
corporate development strategy and moving to a leader position in the Polish
and European fuel sector.
Despite unfavourable macroeconomic factors, which in our sector resulted in major
reduction of fuel margin and differential, PKN ORLEN managed to generate profit,
reduce debt level and, most importantly, continue to develop.
Maciej Mataczyński
Chairman of the Supervisory Board of PKN ORLEN SA
The Company optimised a number of corporate procedures, in particular concerning expenditure and investment
projects. Those optimisation measures were a particular concern of the Supervisory Board and a subject of our
close cooperation with the Management Board. We are pleased to report, as a result of our efforts, PLN 2.3 billion
in debt reduction and PLN 1.1 billion in profit.
Furthermore, 2009 was for PKN ORLEN a year of investment projects, according to its long-term development
plans. The Company continued investment works in the PX/PTA facility in Włocławek and extension of the pro-
duction plant in Płock. Moreover, we continued our development in the Upstream area, including in the energy
sector. With a view to improving energy security, the Company signed a number of crude oil supply contracts
and adopted a strategy for the development of its storage infrastructure. We also consequently implemented
several investment and optimisation projects aimed at expanding and improving the effectiveness of our foreign
assets – the Mažeikių refinery and the Czech Unipetrol.
I would like to kindly thank all those who contributed to our success in the current harsh period: the Employees,
the Management Board and Members of the Supervisory Board. But for your collective hard work, we would
not have achieved such good results. 2009 was a difficult time for us all, but thanks to all the efforts we took,
we are ready for the chances and opportunities that await us in the new year.
I am convinced that 2010 will be a year of even more intense development for PKN ORLEN. We will continue our
measures aimed at optimising and economising our business, and I believe that improving economic conditions
will open up new opportunities for ORLEN to profit from.
pkn
oR
len
An
nU
Al
Rep
oR
T 20
09
6
pkn oRlen Management Board*
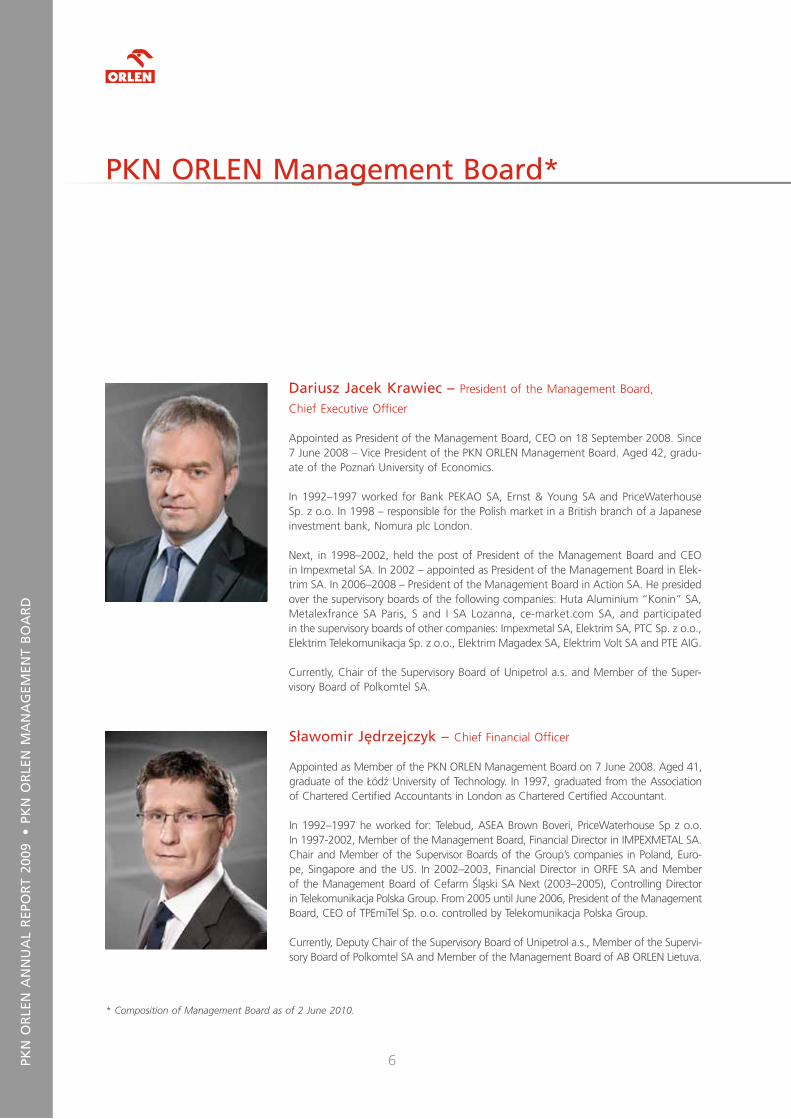
dariusz Jacek krawiec – President of the Management Board,Chief Executive Officer
Appointed as President of the Management Board, CEO on 18 September 2008. Since 7 June 2008 – Vice President of the PKN ORLEN Management Board. Aged 42, gradu-ate of the Poznań University of Economics.
In 1992–1997 worked for Bank PEKAO SA, Ernst & Young SA and PriceWaterhouse Sp. z o.o. In 1998 – responsible for the Polish market in a British branch of a Japanese investment bank, Nomura plc London.
Next, in 1998–2002, held the post of President of the Management Board and CEO in Impexmetal SA. In 2002 – appointed as President of the Management Board in Elek-trim SA. In 2006–2008 – President of the Management Board in Action SA. He presided over the supervisory boards of the following companies: Huta Aluminium “Konin” SA, Metalexfrance SA Paris, S and I SA Lozanna, ce-market.com SA, and participated in the supervisory boards of other companies: Impexmetal SA, Elektrim SA, PTC Sp. z o.o., Elektrim Telekomunikacja Sp. z o.o., Elektrim Magadex SA, Elektrim Volt SA and PTE AIG.
Currently, Chair of the Supervisory Board of Unipetrol a.s. and Member of the Super-visory Board of Polkomtel SA.
Sławomir Jędrzejczyk – Chief Financial Officer
Appointed as Member of the PKN ORLEN Management Board on 7 June 2008. Aged 41, graduate of the Łódź University of Technology. In 1997, graduated from the Association of Chartered Certified Accountants in London as Chartered Certified Accountant.
In 1992–1997 he worked for: Telebud, ASEA Brown Boveri, PriceWaterhouse Sp z o.o. In 1997-2002, Member of the Management Board, Financial Director in IMPEXMETAL SA. Chair and Member of the Supervisor Boards of the Group’s companies in Poland, Euro-pe, Singapore and the US. In 2002–2003, Financial Director in ORFE SA and Member of the Management Board of Cefarm Śląski SA Next (2003–2005), Controlling Director in Telekomunikacja Polska Group. From 2005 until June 2006, President of the Management Board, CEO of TPEmiTel Sp. o.o. controlled by Telekomunikacja Polska Group.
Currently, Deputy Chair of the Supervisory Board of Unipetrol a.s., Member of the Supervi-sory Board of Polkomtel SA and Member of the Management Board of AB ORLEN Lietuva.
* Composition of Management Board as of 2 June 2010.
• pk
n o
Rle
n M
An
AG
eMen
T B
oA
Rd

7
krystian pater – Member of the Management Board, Refinery Operations
Appointed to the position of Member of the PKN ORLEN Management Board on 7 June 2008. Aged 45; a graduate of the Faculty of Chemistry at the Nicolaus Copernicus University in Toruń.
Attended the following postgraduate courses: “Chemical engineering and equipment” at the Warsaw University of Technology (1989), “Marketing and Management” at Paweł Włodkowic University College (1997), “Fuel Sector Management” (1998) and “Enterprise Value Management” (2001–2002) at the Warsaw School of Economics. From 1993, worked for Petrochemia Płock SA, and later – for PKN ORLEN, where in the period of 2005 to 2007 he held the post of the Executive Director, Refining Production. Member of the PKN ORLEN Management Board since 15 March 2007.
Currently, Member of the Management Board, CEO of AB ORLEN Lietuva and Member of the Supervisory Board of Unipetrol a.s. Also: Vice President of the Management Board of SITPNiG, Member of the Management Board of CONCAWE and Chair of the Oil Company Association in Płock (Stowarzyszenie Płockich Naftowców).
Wojciech kotlarek – Member of the Management Board, Sales
Appointed to the position of Member of the PKN ORLEN Management Board on 7 June 2008. Aged 48, graduate of the Krakow University of Science and Technology, Faculty of Drilling, Oil and Gas. In 1997–2002, attended post-graduate courses at the Warsaw School of Economics: “Project Management” and “Enterprise Management Strategy.”
In 1988–1999 held managerial positions in Polskie Górnictwo Naftowe i Gazownictwo, Dora Sp. j.v. and Neste Polska Sp. z o.o. In 1999–2006 worked for PKN ORLEN as Director of the Regional Wholesale Office. Later (2006–2008), Vice President of the Management Board, Chief Operating Officer in Petrolot.
Currently, he is the Chair of the Supervisory Boards of the following companies: IKS “Solino” SA and ORLEN Transport SA.
Marek Serafin – Member of the Management Board, Petrochemical Operations
Appointed to the position of Member of the PKN ORLEN Management Board on 7 June 2008. Aged 40, graduated from the Faculty of Civil Engineering at the Poznań University of Technology Graduate of an MBA course of the London Business School at the Warsaw University of Technology Business School.
In 1994–1998 Experienced Senior Consultant at Arthur Andersen, later, in 1998–1999, worked as Operating Planning Director in Lech Browary Wielkopolski SA owned by Kom-pania Piwowarska SA. In 1999–2002, worked for Impexmetal SA Group, first as Opera-tional Director at the Huta Aluminium “Konin” SA aluminium factory, then as President of the Management Board, CEO of Huta “Zawiercie” SA Since 2002 – General Manager at the ArcelorMittal Group and President of the Management Board of Huta Warszawa, and President of the Management Board of Silscrap Sp. z o.o.
Currently: President of the Supervisory Board of ANWIL SA and Basell Orlen Polyolefins Sp. z o.o., and Vice-President of the Management Board of Unipetrol a.s.
pkn
oR
len
An
nU
Al
Rep
oR
T 20
09
8
letter from the presidentof the pkn oRlen Management Board
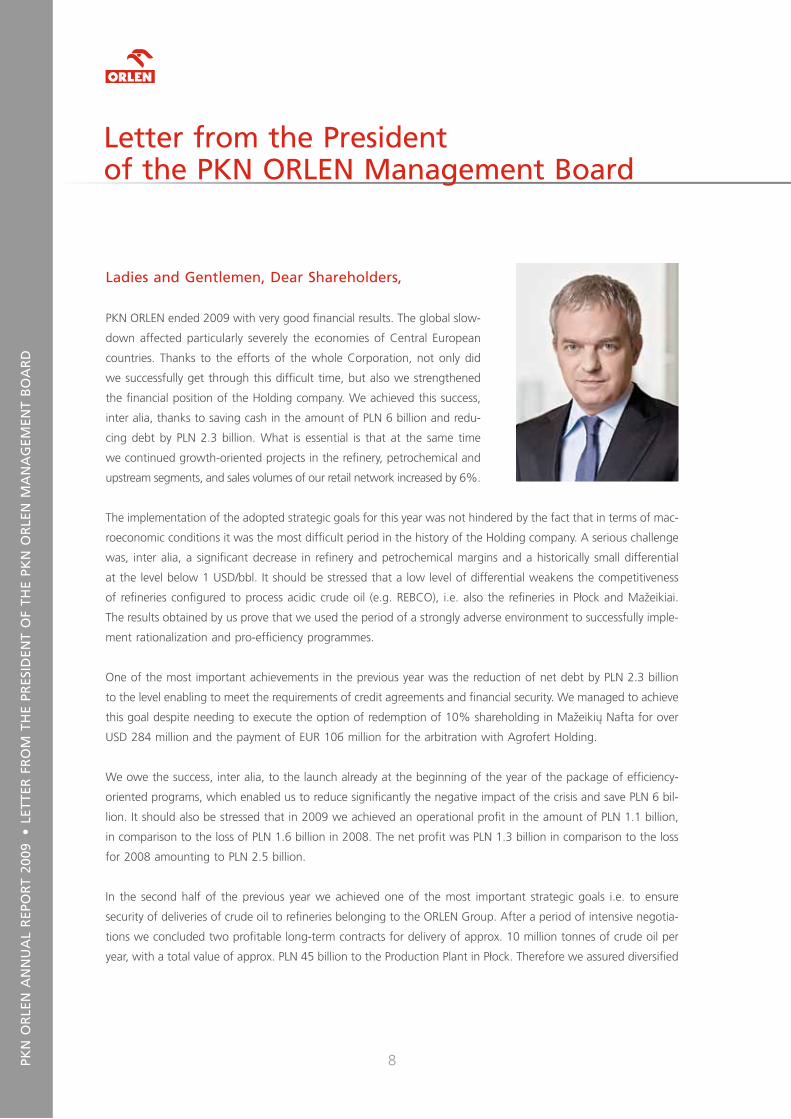
ladies and Gentlemen, dear Shareholders,
PKN ORLEN ended 2009 with very good financial results. The global slow-
down affected particularly severely the economies of Central European
countries. Thanks to the efforts of the whole Corporation, not only did
we successfully get through this difficult time, but also we strengthened
the financial position of the Holding company. We achieved this success,
inter alia, thanks to saving cash in the amount of PLN 6 billion and redu-
cing debt by PLN 2.3 billion. What is essential is that at the same time
we continued growth-oriented projects in the refinery, petrochemical and
upstream segments, and sales volumes of our retail network increased by 6%.
The implementation of the adopted strategic goals for this year was not hindered by the fact that in terms of mac-
roeconomic conditions it was the most difficult period in the history of the Holding company. A serious challenge
was, inter alia, a significant decrease in refinery and petrochemical margins and a historically small differential
at the level below 1 USD/bbl. It should be stressed that a low level of differential weakens the competitiveness
of refineries configured to process acidic crude oil (e.g. REBCO), i.e. also the refineries in Płock and Mažeikiai.
The results obtained by us prove that we used the period of a strongly adverse environment to successfully imple-
ment rationalization and pro-efficiency programmes.
One of the most important achievements in the previous year was the reduction of net debt by PLN 2.3 billion
to the level enabling to meet the requirements of credit agreements and financial security. We managed to achieve
this goal despite needing to execute the option of redemption of 10% shareholding in Mažeikių Nafta for over
USD 284 million and the payment of EUR 106 million for the arbitration with Agrofert Holding.
We owe the success, inter alia, to the launch already at the beginning of the year of the package of efficiency-
oriented programs, which enabled us to reduce significantly the negative impact of the crisis and save PLN 6 bil-
lion. It should also be stressed that in 2009 we achieved an operational profit in the amount of PLN 1.1 billion,
in comparison to the loss of PLN 1.6 billion in 2008. The net profit was PLN 1.3 billion in comparison to the loss
for 2008 amounting to PLN 2.5 billion.
In the second half of the previous year we achieved one of the most important strategic goals i.e. to ensure
security of deliveries of crude oil to refineries belonging to the ORLEN Group. After a period of intensive negotia-
tions we concluded two profitable long-term contracts for delivery of approx. 10 million tonnes of crude oil per
year, with a total value of approx. PLN 45 billion to the Production Plant in Płock. Therefore we assured diversified
• le
TTeR
fR
oM
Th
e pR
eSid
enT
of
The
pkn
oR
len
MA
nA
GeM
enT
Bo
AR
d

9
and optimal deliveries in terms of processing capabilities for the period of three years, which with the previously
concluded contracts will satisfy over 80 per cent of our needs.
The contracts guarantee that – in case of inability to deliver crude oil through the Friendship pipeline – deliveries
will be made alternatively at the same price by sea.
Very good results in the previous year were obtained in the retail segment, which confirms the accuracy
of the adopted direction of growth in respective markets. Volume sales in our retail network increased by 6%,
and operational profit of the segment was 37% higher than one year earlier. In this period we opened 49 new
stations, and 44 modernized and rebranded sites were put into service for our customers. We observed a very big
interest in our new gastronomic offer of Stop Cafe, and our network grew last year by 92 Stop Cafe Bistro points.
In terms of divestment of assets from outside our basic activities, the previous year was the time of intensive works
on the preparation for the sale of PKN ORLEN’s shares in Anwil and Polkomtel. In both cases we managed to meet
last year’s assumptions for the timetable of disinvestment. Thanks to that, at the beginning of 2010 we received
three binding offers for the purchase of shares in Anwil and we commenced their examination. At the same time
we have prepared an information package on Polkomtel for potential investors.
We also continued the process of building competence in the upstream segment. Last year the company we jointly
created with Kuwait Energy Company was granted the concession for exploration in the Latvian economic zone
of the Baltic Sea. We also established a close cooperation with PGNiG within the joint-venture regarding joint
exploration and production in the area of deposits located in Wielkopolska region. We also initiated an innovative
project aiming at examining the possibilities for producing natural gas from unconventional deposits in the areas
covered by our concessions in the region of Lublin.
In the framework of building the energy segment, in 2009 we focused not only on the improvement of ope-
rational efficiency, but also on new projects. We carried out one of the largest processes of changing energy
suppliers within TPA (Third Party Access) in the history of Poland, and the first in our history joint purchase
of energy for PKN ORLEN and the companies of the Capital Group. We launched the programme of cost reduc-
tions of in Unipetrol. We assume that the first positive effects of these actions will be already seen in 2010.
In Mažeikiai, on the other hand, we commenced detailed analyses regarding the future of the power plant.
We have started preparatory works for the construction of a gas cycle unit in Włocławek. The aim of the project
is the diversification of revenues for PKN ORLEN. In Płock we have started works relating to the preparation for
implementation of the programme of ecological and energy investments.

pkn
oR
len
An
nU
Al
Rep
oR
T 20
09
10
In terms of reinforcement of energy security and in the face of the increasing storage needs of the Corporation,
we have elaborated and approved the so-called Cavern Strategy, which will enable the growth of the storage
infrastructure of the Capital Group and will increase the operating capacity of IKS Solino.
We are also undertaking actions related to the construction of product pipelines to refineries in Trzebinia and
Wrocław.
In the previous year all refineries belonging to the Holding company processed 27.4 million tonnes of crude oil
in total, which is 3% less than in 2008 due to maintenance shutdowns and optimization of processing in the pe-
riod of the largest drop in refinery margin and demand. Despite difficult conditions, PKN ORLEN consistently
carried out tasks resulting from the strategy for growth of the refinery segment on all home markets. In Płock
the Hydrogen Production Plant was opened, and the project of construction of the diesel oil hydrodesulphurization
VII unit entered the ultimate phase, which will result in launching the installation in mid-2010. The new instal-
lation of Hydrogen Production Plant and the system of diesel desulphurization LK-1 were also added to ORLEN
Lietuva refinery. In the Czech Unipetrol the installation of Fluid Catalytic Cracking (FCC) underwent optimization,
the programme of optimization of costs was also implemented there.
The activities of the oil segment were gathered under the ORLEN Oil brand. In the scope of the investment in this
respect a filling terminal was put into service in Płock.
The petrochemical segment operated in difficult economic conditions. Both the demand and price quotations
remained at a low level. The recovery was observed only in the last quarter of the previous year, when sales
dynamics reached 21% in comparison to the same period in 2008. In this segment we continued our key invest-
ments related to the construction of the complex of installations for production of paraxylene (PX) and purified
terephthalic acid (PTA), which will lengthen the chain of creating value and will reinforce operational efficiency
of the segment.
A challenge for the Holding company was to meet last year’s increased National Indicative Target (NIT). At the begin-
ning of the year we completed an investment programme including the modernization of filling terminals for
blending esters, and our logistics network reached the optimal level of adjustment to the requirements of the Act
on biofuels. We have also increased the availability of biofuels for individual customers by opening 50 Bioester
sales points in BLISKA stations. In total, PKN ORLEN introduced 510 thousand tonnes of biocomponents and
biofuels to the market. Despite new, more beneficial fiscal solutions the costs of meeting the NIT amounted
to over PLN 170 million.
• le
TTeR
fR
oM
Th
e pR
eSid
enT
of
The
pkn
oR
len
MA
nA
GeM
enT
Bo
AR
d
11
The level of wholesale fuel sales in all markets in which the Holding company operates reached nearly 15 million
tonnes of fuels last year and was lower than the one observed in 2008. The decrease in the volumes resulted from
the lower demand for fuels, especially in the Czech Republic and in the Baltic countries. In the operational sphere,
we reinforced the position of the Group in the Slovak market and we have increased involvement of the Holding
company in the Ukrainian market. In Poland we have implemented the system of regional prices, which improved
our flexibility and competitiveness in the market.
Despite unfavorable circumstances we are closing the year with the feeling of a job well done. It would not be pos-
sible without the participation of workers and co-workers of the Holding company, whom I would like to thank
very much for their involvement and effort. I would also like to thank our Shareholders for the trust they placed
in us, and members of the Supervisory Board for strategic support in the implementation of the most important
goals and projects. I am convinced that our cooperation will be equally successful in 2010, giving service to all
stakeholders of ORLEN Capital Group.
We are on the right track, and the planned and consistently implemented actions will enable us to maintain
a strong position on the market in 2010.
Dariusz Jacek Krawiec
President of the Management Board of PKN ORLEN SA

The BiRTh of A MARkeT leAdeR In May 1998, the Polish Council of Ministers decided to merge CPN SA and Petrochemia Płock SA into a single national crude oil corporation. On 7 September 1999, Polski Koncern Naftowy SA was established. The new corporation needed a new, strong brand not only to become the Company’s image on the domestic market but also to compete with international holdings on European markets. Its task was to open up completely new perspectives. The new brand was supposed to bring to mind the dominant concepts of corporate strategy: global, crude oil, modern and national. It was decided that the brand should reflect the Company’s Polish origins, quality, strength and power, and that it should distinguish a fuel and petrochemical manufacturer.

About pkn oRlen
* In this context, ORLEN Group refers to the Company and its consolidated subsidiaries, excluding the affiliated entities.
14pkn
oR
len
An
nU
Al
Rep
oR
T 20
09 •
AB
oU
T pk
n o
Rle
n
our mission
Aiming to become the regional leader,
we ensure long-term value creation for our shareholders
by offering our customers products
and services of the highest quality.
All our operations adhere to ’best practice’
principles of corporate governance and social
responsibility, with a focus on care for our
employees and the natural environment.
our motto
Whenever you need us.
About pkn oRlen
We are a regional leader of the refinery and petrochemi-
cal industry, a leading producer and dealer of refinery
and petrochemical products. We process crude oil into
unleaded petrol, diesel fuel, furnace oil, aviation fuel,
plastics and petrochemical products.
We have our refineries in Poland, the Czech Republic
and Lithuania. The Company’s refinery and petrochemi-
cal facilities located in Płock are ranked among the most
modern and effective facilities of the kind in Europe.
We have the largest fuel station network in Central
Europe, covering Poland, Germany, the Czech Repu-
blic, and Lithuania. ORLEN retail network is based
on an effective logistics infrastructure consisting of over
and underground storage facilities and a network
of long-distance pipelines.
As at the end of 2009, the number of ORLEN Group
employees totalled 22,535 people, including 4,482
in PKN ORLEN, 4,343 in Unipetrol Group, 3,025
in ORLEN Lietuva Group and 115 in ORLEN Deutschland.
15
pkn oRlen on the Capital Market
PKN ORLEN shares are listed on the Warsaw Stock
Exchange and in the form of Global Depository Rece-
ipts (GDRs) on the London Stock Exchange. Trading
in depository receipts also takes place in the USA
on the OTC market. The shares of PKN ORLEN were
first listed in November 1999.
The Company shares are listed on the official market
at the Warsaw Stock Exchange in the continuous trading
system and are included among the largest company
indexes: WIG20 and WIG, and WIG-fuel index. Since
19 November 2009, the shares of PKN ORLEN have been
included among the Respect Index, an index of compa-
nies involved in corporate social responsibility. The Com-
pany’s capital share amounts to PLN 534,636,326.25
and is divided into 427,709,061 ordinary bearer shares
with a par value of PLN 1.25 per share.
The Bank of New York Mellon is the depository
of the Company’s depository receipts. The transaction
unit on the London Stock Exchange is 1 GDR, which
equals to two shares of the Company.
One of PKN ORLEN subsidiaries, Unipetrol, is also
present on the capital market.
Unipetrol shares are listed on the Prague Stock Exchange
and OTC market (RM-SYSTÉM, a.s.). The Company’s
capital share is divided into 181,334,764 ordinary
shares with a par value of CZK 100 per share, of which
67,108,265 shares are currently traded. Bonds issued
by Unipetrol are also listed on the Prague Stock
Exchange. Currently, 2,000 bonds of total par value
of CZK 2,000,000,000 are traded.
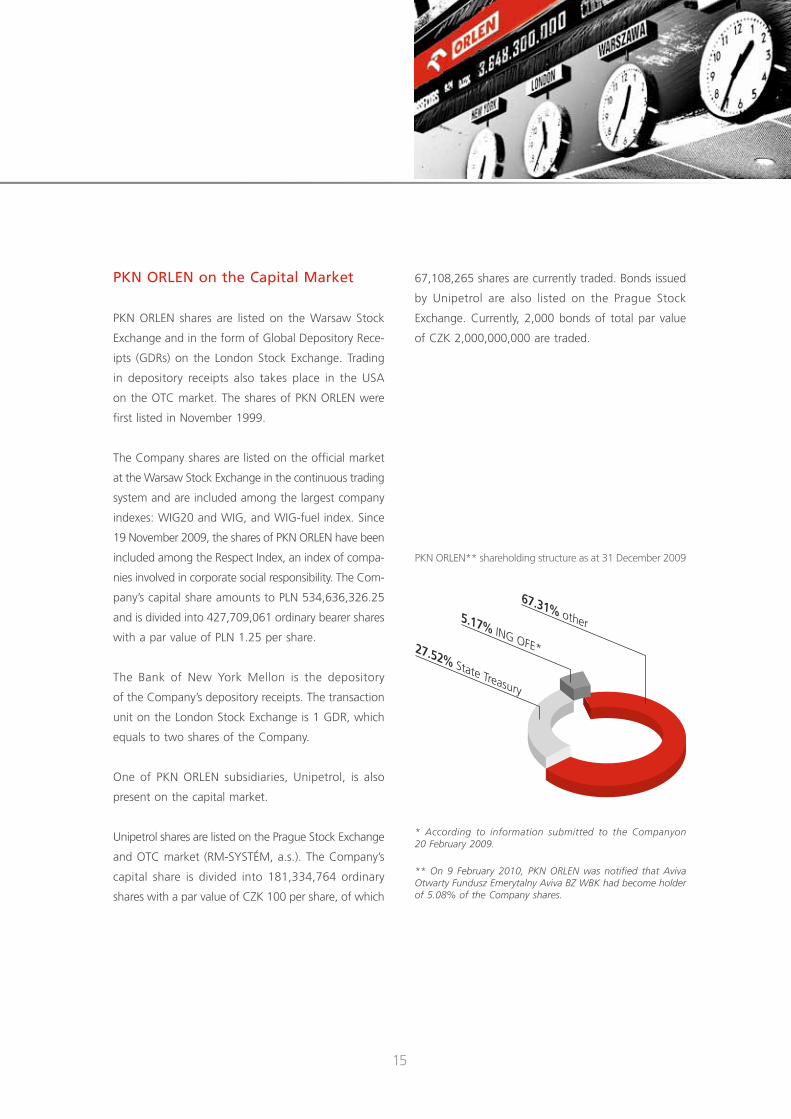
* According to information submitted to the Companyon 20 February 2009.
** On 9 February 2010, PKN ORLEN was notified that Aviva Otwarty Fundusz Emerytalny Aviva BZ WBK had become holder of 5.08% of the Company shares.
67.31% other5.17% ING OFE*27.52% State Treasury
PKN ORLEN** shareholding structure as at 31 December 2009

16pkn
oR
len
An
nU
Al
Rep
oR
T 20
09 •
AB
oU
T pk
n o
Rle
n
oRlen Brand
The image of the ORLEN brand was presented for
the first time in 2000 on the occasion of the second is-
sue of Company shares on the Warsaw Stock Exchange.
The Company’s flagship is its network of fuel stations,
whose standards meet the requirements determined
in ORLEN corporate brand strategy. ORLEN logo is also
used with motor fuels, operating fuels, car lubricants
and a broad range of automotive chemicals.
Moreover, the brand image is shaped by the ORLEN
Rally Team, which represents both the Company and
the country in the most important rally events organised
in Poland and internationally.
In 2009, ORLEN brand was declared, for the third time
in succession, the most valuable domestic brand. Our cor-
porate brand came first in the MARQA ranking, according
to which it is worth over PLN 3,648.3 mn. We reported
a 27% increase in the value of the brand, compared
to 2008, when it was estimated at PLN 2,869.1 mn.
According to an Independent Polish Brand Reputation
Ranking, “PremiumBrand 2009,” ORLEN is a High
Reputation Brand, meaning that we are perceived as
a reliable and responsible business partner.
ORLEN has also been awarded the Superbrands Pol-
ska title, which is another proof of its strong posi-
tion on the domestic market. Our brand has received
the latter title for the fourth time already.
ORLEN fuel stations
Currently, ORLEN brand includes a fuel station net-
work in Poland and Lithuania. These are all modern
fuel stations offering top quality fuels and services,
and a friendly stop-over and resting place. ORLEN
stations offer consumer loyalty programmes and car
fleet services.
For the eight time in succession (since 2002), ORLEN
fuel stations received the Golden European Trusted
Brands Logo in a European consumer survey conducted
by Reader’s Digest.
VERVA is a brand of new-generation fuel enriched
with a set of additives which ensure the dynamics
and power of the engine, better acceleration, lower
fuel consumption and, consequently, lower user costs.
FLOTA is a professional fleet programme focused
on business customers. It offers partnership approach
and advanced technological solutions. Fleet cards are
tailored to the needs of various size companies ope-
rating in different business sectors. The brand offers
comprehensive advantages to customers from various
B2B sectors, such as safe and convenient payment for
fuel and services, and sound financial management
through better control over fuel costs.
VITAY is the brand of the Polish most extensive cus-
tomer loyalty programme, created for the customers
of ORLEN fuel stations. The programme includes a broad
range of rewards. It is easily available and user friendly,
and the rules of collecting points are simple. Super
VITAY is a unique, prestigious programme designed
for the most loyal customers.
17
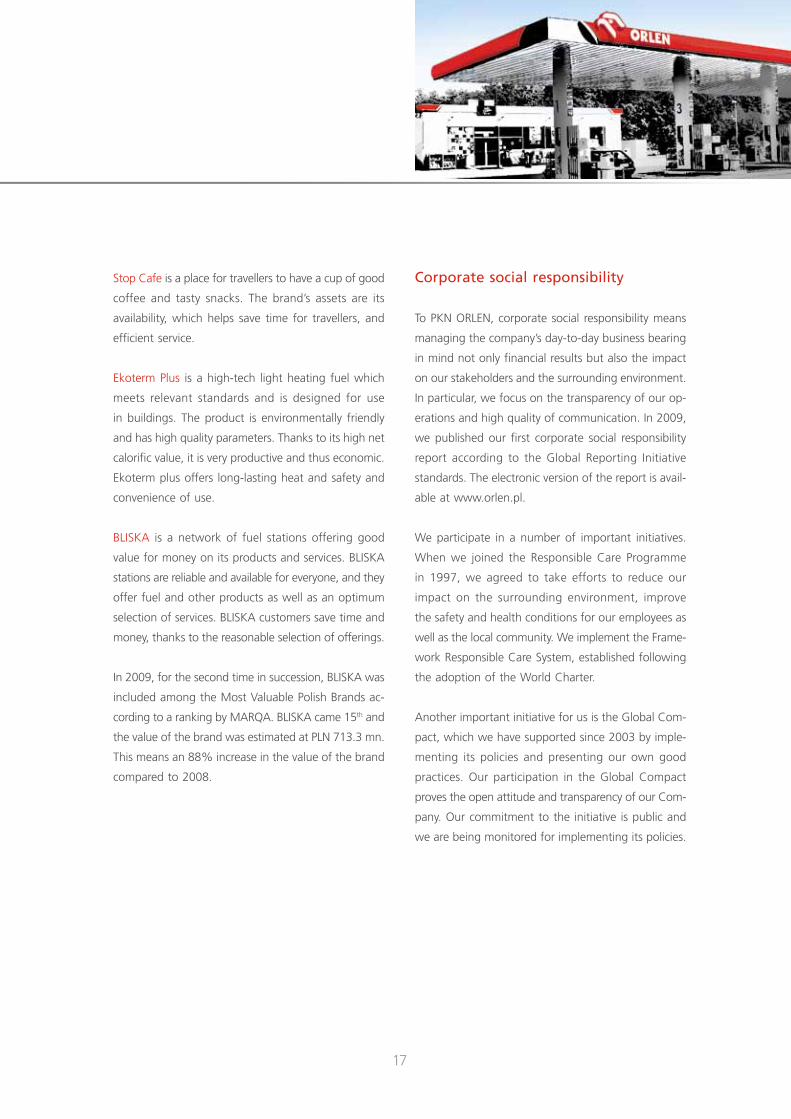
Stop Cafe is a place for travellers to have a cup of good
coffee and tasty snacks. The brand’s assets are its
availability, which helps save time for travellers, and
efficient service.
Ekoterm Plus is a high-tech light heating fuel which
meets relevant standards and is designed for use
in buildings. The product is environmentally friendly
and has high quality parameters. Thanks to its high net
calorific value, it is very productive and thus economic.
Ekoterm plus offers long-lasting heat and safety and
convenience of use.
BLISKA is a network of fuel stations offering good
value for money on its products and services. BLISKA
stations are reliable and available for everyone, and they
offer fuel and other products as well as an optimum
selection of services. BLISKA customers save time and
money, thanks to the reasonable selection of offerings.
In 2009, for the second time in succession, BLISKA was
included among the Most Valuable Polish Brands ac-
cording to a ranking by MARQA. BLISKA came 15th and
the value of the brand was estimated at PLN 713.3 mn.
This means an 88% increase in the value of the brand
compared to 2008.
Corporate social responsibility
To PKN ORLEN, corporate social responsibility means
managing the company’s day-to-day business bearing
in mind not only financial results but also the impact
on our stakeholders and the surrounding environment.
In particular, we focus on the transparency of our op-
erations and high quality of communication. In 2009,
we published our first corporate social responsibility
report according to the Global Reporting Initiative
standards. The electronic version of the report is avail-
able at www.orlen.pl.
We participate in a number of important initiatives.
When we joined the Responsible Care Programme
in 1997, we agreed to take efforts to reduce our
impact on the surrounding environment, improve
the safety and health conditions for our employees as
well as the local community. We implement the Frame-
work Responsible Care System, established following
the adoption of the World Charter.
Another important initiative for us is the Global Com-
pact, which we have supported since 2003 by imple-
menting its policies and presenting our own good
practices. Our participation in the Global Compact
proves the open attitude and transparency of our Com-
pany. Our commitment to the initiative is public and
we are being monitored for implementing its policies.
18pkn
oR
len
An
nU
Al
Rep
oR
T 20
09 •
AB
oU
T pk
n o
Rle
n
PKN ORLEN is also known for its charity activities, includ-
ing through the ORLEN Gift from the Heart Foundation
established in 2001. For years, the Foundation has
been supporting nearly 300 children’s homes in Poland.
We organise a number of scholarship programmes for
various groups of students. In 2009, we launched a spe-
cial programme addressed to primary and secondary
schools in Płock. The Foundation also focuses on various
aspects of safety. In particular, the Foundation, in as-
sociation with PKN ORLEN, implements a programme
the objective of which is to assist professional and
voluntary fire brigades across Poland.
Local initiatives constitute an important part of our
social involvement. We continue the intersectoral
partnership programme launched in 2002. The Com-
pany regularly supports the “Grant Fund for Płock,”
the purpose of which is to support innovative projects
aimed at impro ving the level of life in the city of Płock.
Corporate Governance
The PKN ORLEN Management Board takes all reason-
able efforts to ensure the observance of the principles
of corporate governance in all aspects of the Company
business. As a public company listed on the Warsaw
Stock Exchange, we observe all the principles recom-
mended by the code of “Good Practices of Companies
Listed on the Warsaw Stock Exchange.”
According to the code of “Good Practices of Compa-
nies Listed on the Warsaw Stock Exchange,” general
meetings are attended by Members of the PKN ORLEN
Management Board and Supervisory Board. Media rep-
resentatives are also invited to every General Meeting.
The PKN ORLEN Supervisory Board consists of nine
members. Four of them are independent, which means
that the Board is independent from the Company, accor-
ding to the aforementioned code of good practices.
There are four committees within the Supervisory Board:
• Audit Committee;
• Corporate Governance Committee;
• Development & Strategy Committee;
• Appointment & Remuneration Committee.
Each Committee is participated by at least one of
the inde pendent Members of PKN ORLEN Supervisory
Board.
We take various measures to streamline communication
with our surroundings. We use modern communication
technologies to reach broad circles of capital market

19
representatives. We organise live online broadcast
of press briefings after every important event in the life
of the company, such as the publication of quarterly
results or Company strategy, or after General Meetings,
with simultaneous translation to English
In 2009 we were awarded several times for our efforts
to communicate with the capital market participants.
In April 2009, the corporate website received the highest
rating from independent market analysts and brokers
in the WarsawScan 2009 ranking, as well as taking
second place in the Good Investor Communications
category.
In June 2009, we won the “Best Investor Relations
in Poland” award. The award is granted annually
by a specialist international periodical, IR Magazine,
on the basis of an independent survey conducted
among over 700 representatives of the international
capital market. Last year, the battle for the “Best
Investor Relations in the Czech Republic 2009” saw
the first nomination of ORLEN’s Unipetrol.
In March 2010, PKN ORLEN received two awards
in the “Stock Market Company of the Year” con-
test organised by Puls Biznesu newspaper and Pentor
Research International. The Company was awarded
in the best investor relations category and came 4th
among the most dynamically developing companies.
Social sponsoring
Being the largest company in Poland, we focus mainly
on promoting Polish culture and national heritage.
The most important cultural project in 2009 concerned
our continuing cooperation with the National Museum
in Warsaw, where we sponsored the Gallery of Polish
Painting. The crowning achievement of our coopera-
tion wit the Museum was the “My Life” exhibition
of Jacek Malczewski’s paintings.
As the largest Polish company, we could not but partici-
pate in the organisation of several important business
events during which the most dynamic enterprises
on the Polish market were awarded. For example,
we sponsored the awarding ceremony of the “Most
Valuable Polish Brand” ranking by Rzeczpospolita and
the issue of the newspaper’s “Most Valuable Polish
Brand” supplement; moreover, we actively partici-
pated in various seminars and conferences devoted
to the deve lopment of the Polish and European chemi-
cals and energy industries.
Being a responsible company strongly linked with
the region in which we operate, we took a number
of measures to support the local community. The most
important of them was our continuing cooperation
with the Regional Museum in Płock. The ORLEN Rally,
held in the vicinity of Płock, has already become a fixed
event in our sporting calendar. The event is appreci-
ated not only by fans but also by organisers as a one
of the rounds of the Polish Car Rally Championship
and Central European Cup.
20pkn
oR
len
An
nU
Al
Rep
oR
T 20
09 •
AB
oU
T pk
n o
Rle
n
We cooperate with a local sports club, “Wisła” Płock.
Apart from supporting a team of senior handball play-
ers, we organised another edition of ORLEN Handball
Mini League for primary school pupils – a potential
new generation of athletes.
Last but not least, on the local scale, we purchased
equipment for the Emergency Ward and Operating
Rooms of the Regional Hospital in Płock, which will
not only significantly improve the quality of health
services offered to the local people but also contribute
to the treatment of injured employees in the case
of accidents at our production plant.
oRlen. Safe Roads
Our “ORLEN. Safe Roads” (“OSR”) project definitely
goes beyond the local scale. Its objective is to teach
the principles of road safety.
The project has been implemented for 3 years and each
year we focused on a different aspect of road safety.
In the 1st and 2nd years of the project, we organised
a Competition for Initiative Ideas aimed at improv-
ing road safety in its most general sense. In 2009,
we focused on one specific problem and suggested
possible solutions to it. The third edition of the “OSR”
programme had a new formula, its guiding motto being:
“Parents set example for their children.” The purpose
of the project was to make parents aware of their
own role in the day-to-day education of their children.
The 3rd edition of the Programme used a dedicated
website: www.orlenbezpiecznedrogi.pl with teaching
materials and tests for children and parents, designed
with the assistance of a psychologist.
Following several years of efforts to promote road
safety, we joined the European Road Safety Charter.
The accession ceremony took place on 16 October
2009. Thus, we joined a prestigious group of companies
in an initiative organised by the European Commission.
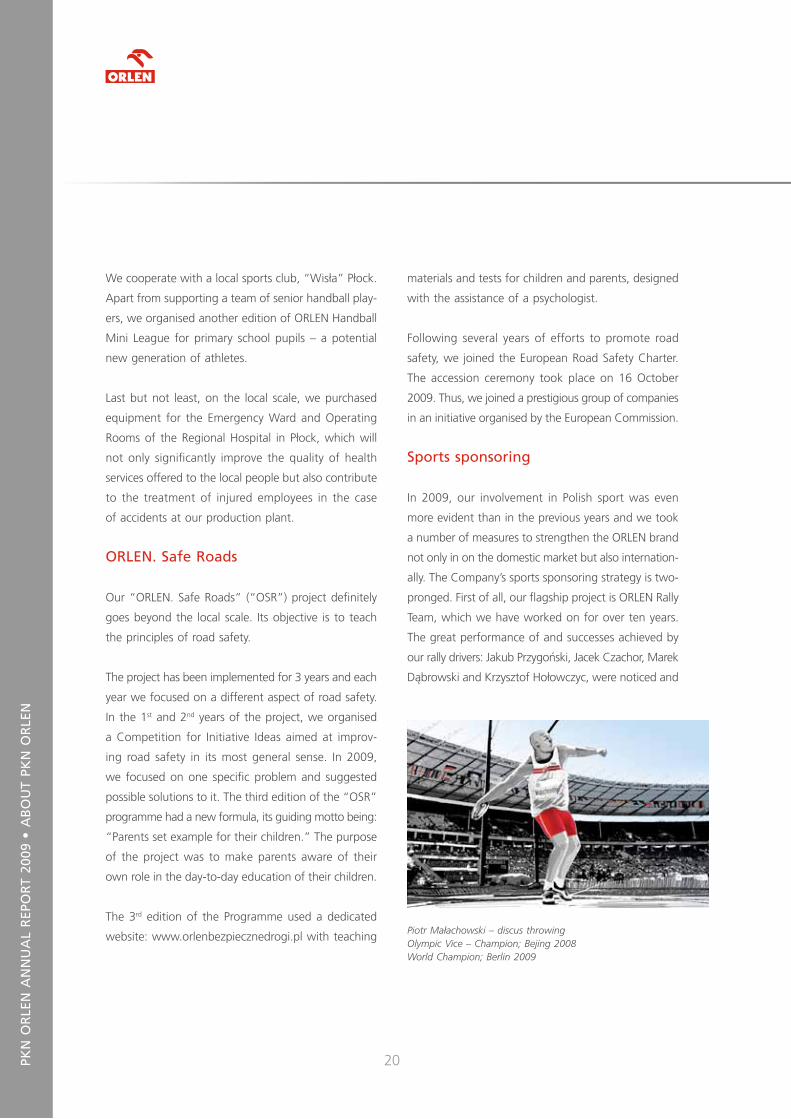
Sports sponsoring
In 2009, our involvement in Polish sport was even
more evident than in the previous years and we took
a number of measures to strengthen the ORLEN brand
not only in on the domestic market but also internation-
ally. The Company’s sports sponsoring strategy is two-
pronged. First of all, our flagship project is ORLEN Rally
Team, which we have worked on for over ten years.
The great performance of and successes achieved by
our rally drivers: Jakub Przygoński, Jacek Czachor, Marek
Dąbrowski and Krzysztof Hołowczyc, were noticed and
Piotr Małachowski – discus throwing Olympic Vice – Champion; Bejing 2008 World Champion; Berlin 2009

21
appreciated by the Polish President. They all received
awards for their contribution to Polish sport. Another
direction of our sponsoring activity was athletic sports,
mainly based on the image of the members of ORLEN
Sports Team: Anita Włodarczyk, Tomasz Majewski and
Piotr Małachowski, who dominated in track-and-field
events last year. Last year, we also supported the Wisła
Płock handball team, runner-up in Polish champion-
ships, and sponsored major international events held
in Poland: Eurobasket and Women’s European Vol-
leyball Championships. Moreover, we cooperate with
the Polish Olympic Committee and sponsor the Polish
Olympic Representation.
Anita Włodarczyk – hammer throwing World record holder World Champion; Berlin 2009
Tomasz Majewski – shot-put Olympic Champion; Bejing 2008 World Champion; Berlin 2009
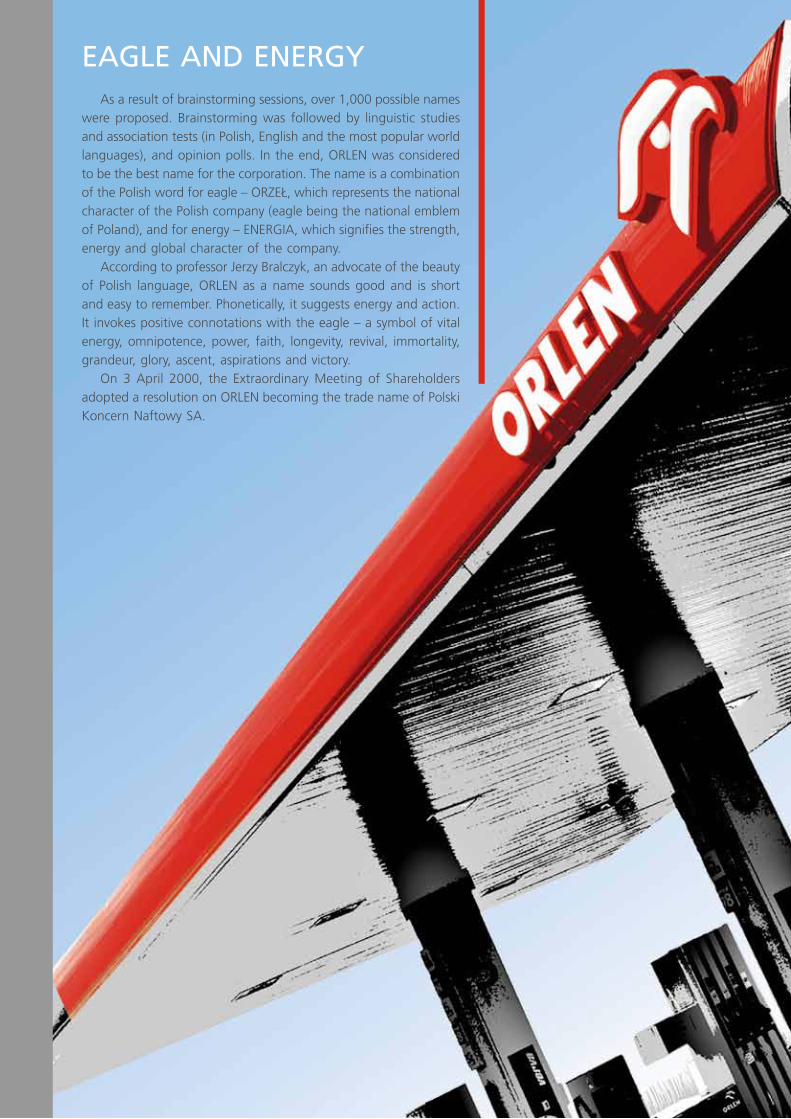
eAGle And eneRGy As a result of brainstorming sessions, over 1,000 possible names were proposed. Brainstorming was followed by linguistic studies and association tests (in Polish, English and the most popular world languages), and opinion polls. In the end, ORLEN was considered to be the best name for the corporation. The name is a combination of the Polish word for eagle – ORZEŁ, which represents the national character of the Polish company (eagle being the national emblem of Poland), and for energy – ENERGIA, which signifies the strength, energy and global character of the company. According to professor Jerzy Bralczyk, an advocate of the beauty of Polish language, ORLEN as a name sounds good and is short and easy to remember. Phonetically, it suggests energy and action.It invokes positive connotations with the eagle – a symbol of vital energy, omnipotence, power, faith, longevity, revival, immortality, grandeur, glory, ascent, aspirations and victory. On 3 April 2000, the Extraordinary Meeting of Shareholders adopted a resolution on ORLEN becoming the trade name of Polski Koncern Naftowy SA.

oRlen Group strategy

24pkn
oR
len
An
nU
Al
Rep
oR
T 20
09 •
oR
len
GR
oU
p ST
RA
TeG
y
oRlen Group strategy
Our current corporate strategy was adopted and pub-
lished by the end of 2008. Because the strategy was
developed at a time when the current economic crisis
began, it had to protect the Company against the effects
of economic recession, but at the same time ensure
a good and safe starting point for the Company’s
further development.
In terms of macroeconomic conditions, 2009 was
the most difficult period in the entire history of the Com-
pany. The major challenges at that time included
a slump in refinery margin and differential. However,
thanks to a set of programmes aimed at improving
the Company efficiency, launched at the very beginning
of the year, we managed to reduce the negative impact
of the crisis situation significantly, and PKN ORLEN
gained additional PLN 6 bn in cash.
Despite the difficult market situation, last year, PKN
ORLEN earned PLN 5 bn in cash on its business op-
erations, which was PLN 1.5 bn more than in 2008.
Thus, all our goals were achieved, and our revenue
from operations exceeded our capital expenditure.
We reduced our net debt by PLN 2.3 bn, to the level
of PLN 10.3 bn.
In the report period, we focused mainly on three
aspects of our business:
• Improved efficiency of our core business;
• Divestment of non-core business;
• Making way for the Company development in new
areas: energy and upstream sectors.
One of the key measures in 2009, aimed at improv-
ing the efficiency of our core business, was invest-
ment projects at the Płock refinery sector, the purpose
of which was to increase the rate of medium distillates
production and crude oil processing, and the process-
ing of charge for the petrochemical section. We will
be able to benefit fully from the effects of those projects
after the Diesel Desulphurisation (HON) and Paraxylene
(PX) units are started up. By the end of 2009, our fuel
output rate went up by 3 percentage points compared
to 2008, which was due to more efficient crude oil
processing.
While improving the efficiency of our processes,
we worked to strengthen the assets of our core busi-
ness. We focused, among others, on our logistics assets,
which are an important element of our competitive
advantage. In 2009, we worked to increase the opera-
tional performance of the existing underground crude
oil and fuel storage facilities, and to increase our storage
capacities because of the Company’s growing needs.
The key strategic objective of our wholesale sector
in 2009 was to maintain its leading position in the res-
pective countries of our operation. One of the major
achievements of the latter sector was the distribution
of over one-third of the entire volume through its
own retail network.

25
In the case of the retail fuel sales, our strategy focu-
sed on strengthening the brand and increasing sales
effec tiveness at fuel stations, and raising the margin
on non-fuel sales. One of our important achievements
in 2009 was an over 6% increase in retail sales vo-
lu me and a growth dynamics at a higher rate than
the market rate, as a result of which our share in all
markets went up by 1 percentage point on average,
while in Poland the market share went up by 31%.
Moreover, as a result of our retail (foodservice and shops)
strategy, we increased our non-fuel margin by 20%.
We reported equally good results in petrochemical sales,
which went up by 2% compared to 2008. Our petro-
chemical sector was influenced by investments in new
products and further improvement of performance.
The most important investment projects in the pet-
rochemical sector were the Paraxylene (PX) and puri-
fied terephthalic acid (PTA) production units in Płock.
The project is progressing as planned, the progress
rates for the respective units at the end of 2009 being
97 % and 81%. We plan to complete works in 2010.
Last year, PKN ORLEN achieved one of its strategic
objectives, namely we concluded several new long-
term crude oil supply contracts. Following negotiations
with our contractors, we agreed on very good financial
conditions. The total value of those contracts amounted
to PLN 45 bn, which is a historic result on the Polish
market. The recent contracts have a very important
advantage over the previous ones, namely they contain
provisions which fully guarantee the security of supplies.
While focusing on our core business in 2009, we con-
tinued divestment of assets in the chemical sector
(ANWILl) and telecommunications sector (Polkomtel).
In terms of capital investments, we bought minority
shares in several companies not related with the areas
of business in which we operate.
Aware of the challenges that face us – namely the need
to ensure the security and diversity of supplies and
the growing energy prices, we continued our upstream
operations. In 2009, in cooperation with Kuwait Ener gy
Company, we started an upstream project on the Baltic
Shelf. Together with PGNiG, we established an explora-
tion and production JV company operating in the region
of Wielkopolska.
We also develop our energy production sector, taking
advantage of the current favourable conditions
on the electrical energy market. To that end, we in-
tend to get involved in the construction of a power
plant in Włocławek. We will continue our projects
in the upstream and energy sectors both individually
and in collaboration with local and foreign business
partners. An important step forward in the integration
of our corporate goodwill is the construction of a multi-
utility company with a diversified portfolio of operations.

GRAphiC SyMBol Another stage in the development of the corporate brand was to design a graphic symbol that would correspond to the trade name. A competition was organised, participated by the most distinguished Polish artists and graphic designers, winners of local and international competitions. The jury chose the design proposed by Professor Henryk Chyliński, teacher at the Academy of Fine Arts in Warsaw and author, among others, of the symbols of the Teraz Polska foundation and Polish national radio station. The design showed an eagle’s head In the author’s opinion, the eagle, as a symbol, has similar connotations in many cultures. It represents wisdom, strength and dignity. This means that the basic message of the company’s image will be clearly understood also outside Poland. Besides, the eagle is Poland’s emblem, thus the white and red colours of the logo emphasise the Polish identity of the company.

Upstream segment

28pkn
oR
len
An
nU
Al
Rep
oR
T 20
09 •
UpS
TReA
M S
eGM
enT
Upstream segment
In line with ORLEN Group strategy and Polish energy
security policy, we plan to develop our upstream ope-
rations further, in order to secure access to our own
resources. In order to solidify ORLEN Group position
in the upstream sector, we set about optimising our
upstream operations.
Our main premise and objective were to integrate
the upstream area within ORLEN Upstream, to which
we transferred all the relevant tasks, together with
adequate human resources.
Our consistent organic growth policy combined with
the development of competences results in a team
of specialists capable of comprehensive evaluation
of upstream projects both in terms of their technological
aspects and economic potential. We constantly monitor
the global upstream projects market, which enables
us to evaluate fully any new acquisition possibilities. Our
project database, which we constantly expand, makes
it possible to select the right projects and adjust them
to our corporate needs and possibilities.
The major expansion projects implemented in the ups-
tream sector in 2009 included:
• Ongoing exploration and research project on the Bal-
tic Shelf in the Latvian Economic Zone;
• Consecutive stages of the exploration and produc-
tion project in the Lublin basin region;
• Studies and analyses of 67 exploration and produc-
tion projects/assets in various geographic locations;
• Comprehensive analysis of selected projects related
to the purchase of production assets or corporate
acquisitions outside Poland;
• Cooperation with business partners whose assets
are located in Poland.
Over the next few years, we will continue the following
three ongoing projects:
• Project in Lublin region,
• Offshore project on the Baltic Sea;
• Sieraków Project.
Project in Lublin region gives us the exclusive right
to explore crude oil and natural gas deposits over
a 5-year period and in 5 concession areas in Lublin
region. Geologically, this is a very interesting area,
in the vicinity of which several hydrocarbon deposits
were discovered. In 2009, we re-examined historic seis-
mic data and we expect that as the next step we will
select field data acquisition areas in 2010.
Offshore project on the Baltic Sea is an exploration and
production project which we implement in association
with our partner, Kuwait Energy Company (KEC).
In 2009, Balin Energy, a joint venture of PKN ORLEN and
KEC, received the second E&P concession in the Latvian
Economic Zone of the Baltic Sea. With a larger conces-
sion area, the economics of our exploration works will
improve and individual costs will go down. For our team,
the project is a chance to gain unique experience and
competences in the field of offshore upstream works.

29
Sieraków Project is a follow-up of preliminary exploration
and research work done by Polskie Górnictwo Naftowe
i Gazownictwo (PGNiG) in the area of the Polish Plain.
The proposed project is located in an area with the most
promising possibilities in terms of hydrocarbon depos-
its in Poland. As it was initially determined, crude oil
accu mulations within the Sieraków structure occur near
the largest crude oil beds in Poland discovered recently
by PGNiG. A joint project with PGNiG is the next step
in the process of diversifying PKN ORLEN exploration
and production project portfolio.
We expect that our projects under the crude oil and
natural gas E&P strategy will help stabilise the corporate
margin levels. A production assets portfolio, sustainable
in terms of their progress, geographic location and
type of raw materials, will ensure stable development
of our Company at an acceptable risk level.
BALTIC SEA
Sieraków projectKarbon project
Kambr project
LITHUANIA
POLAND

loGo of The BRAnd The starting point for developing the ORLEN brand logo was an analysis of the guidelines provided for in the corporate mission and vision, as well as of the environment in which the new brand was supposed to function. Since the company is a huge and continu-ally expanding and diversifying business operator, the analysis also covered potential areas of application for the new brand. Another factor that was considered was the position of the new brand im-age against the images of competitive brands. This gave us specific requirements concerning the new logo. The next step was drafting designs, application tests and a number of analyses involving, among others, preferences, associations, ergonomics and memorability. The result of the entire process was a logo consisting of an eagle’s head – the symbol selected in the competition – and a rectangular field with the ORLEN name inside. The image of the ORLEN brand was presented for the first time in 2000 at the occasion of the second issue of Company shares on the Warsaw Stock Exchange.

Refinery segment
32pkn
oR
len
An
nU
Al
Rep
oR
T 20
09 •
Ref
ineR
y S
eGM
enT
Refinery segment
In 2009, the ORLEN Group refinery segment consisted
of the refinery plant in Płock, production assets of Rafin-
eria Trzebinia SA and Rafineria Nafty Jedlicze SA and
ORLEN Asfalt, ORLEN Eko (Poland), the Litvinov, Kralupy
and Paramo refinery plants (the Czech Republic), and
the ORLEN Lietuva refinery (Lithuania).
Crude oil processing
In 2009, the 7 refineries of ORLEN Group processed
nearly 27.4 mn tonnes of crude oil, which is appr. 3%
less than in 2008.
In all ORLEN Group refineries, production was mainly
based on REBCO, Russian crude oil, whose share
in the total processed volume was 91.2%. The other
crude oil brands processed in our refineries were:
Saldana, Sahara, Brent, Forties, Oseberg and Statfjord.
poland
Fuel Production
In 2009, we continued our efforts to meet the Na-
tional Index Target (NIT) for biofuels. The NIT set for
PKN ORLEN was fulfilled at 4.623%.
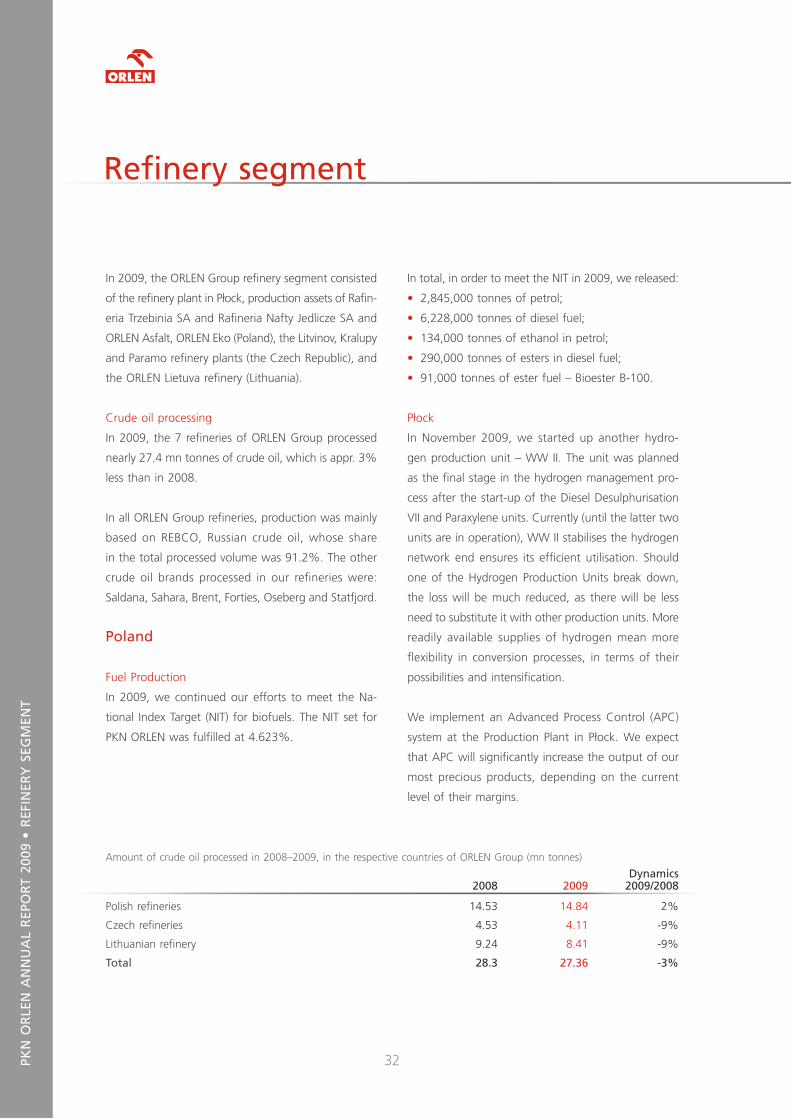
Amount of crude oil processed in 2008–2009, in the respective countries of ORLEN Group (mn tonnes)
2008 2009dynamics
2009/2008
Polish refineries 14.53 14.84 2%
Czech refineries 4.53 4.11 -9%
Lithuanian refinery 9.24 8.41 -9%
Total 28.3 27.36 -3%
In total, in order to meet the NIT in 2009, we released:
• 2,845,000 tonnes of petrol;
• 6,228,000 tonnes of diesel fuel;
• 134,000 tonnes of ethanol in petrol;
• 290,000 tonnes of esters in diesel fuel;
• 91,000 tonnes of ester fuel – Bioester B-100.
Płock
In November 2009, we started up another hydro-
gen production unit – WW II. The unit was planned
as the final stage in the hydrogen management pro-
cess after the start-up of the Diesel Desulphurisation
VII and Paraxylene units. Currently (until the latter two
units are in operation), WW II stabilises the hydrogen
network end ensures its efficient utilisation. Should
one of the Hydrogen Production Units break down,
the loss will be much reduced, as there will be less
need to substitute it with other production units. More
readily available supplies of hydrogen mean more
flexibility in conversion processes, in terms of their
possibilities and intensification.
We implement an Advanced Process Control (APC)
system at the Production Plant in Płock. We expect
that APC will significantly increase the output of our
most precious products, depending on the current
level of their margins.
33
Production volume of selected refinery products in PKN ORLEN in 2008–2009 (Płock, ‘000 tonnes)
2008 2009dynamics
2009/2008
Crude oil processing 14,218 14,526 2.17%
Total petrol 2,800 3,055 9.11%
Total diesel fuel 5,078 5,330 4.96%
Ekoterm Plus heating oil 840 790 -5.98%
Aviation fuel 418 291 -30.38%
Propane-butane fraction 221 210 -4.98%
Total fuels 9,358 9,676 3.4%
Fuel output (%) 65.82 66.61 1.2%
Output of white products (%) 77.98 78.08 0.13 p.p.
Following the Fuel Study performed by Solomon Associa-
tes, we individually developed several tools to monitor
certain key performance indices, such as: energy me-
dia consumption, number and reasons of production
units’ arrests, quality parameters of products. We use
the monitoring data to calculate key performance
indices (KPI) of our production units and refineries
in order to review the Company’s competitive position.
KPIs are also indicators that we consider in our current
and future operational decisions.
Another programme in the production area, aimed
at increasing our profit, was the NCM3 project
imple mented in association with the Solomon Asso-
ciates consulting company. NCM3 lead to a number
of initia tives to improve the performance of the plant
in Płock, to bring it to the level of the best companies
in the world. In 2009, the economic effects of those
initiatives amounted to appr. PLN 23 mn.
In 2009, we started preparing for pilot energy consump-
tion tests at the DRW III and Olefins II units, focusing
in particular on energy efficiency analysis and proposed
solutions to reduce energy consumption levels.
On 8 July 2009, we signed a contract with Rafako
to design, deliver and install (a turn-key project) a mo-
dern heat recovery steam generator at the FKKII unit
for the cooling technological gas. The energy thus
recovered will be used to produce up to 40 tonnes/hour
of 4 MPag technological steam. We expect to start
the operation of the steam generation in the autumn
of 2010.
Also, early in July, we resumed an investment project
involving a new boiler no. 8 at the Combined Heat
and Power Plant of the Production Plant in Płock. With
this boiler, the Płock facility will improve its total tech-
nological steam balance and will be able to modernise
34pkn
oR
len
An
nU
Al
Rep
oR
T 20
09 •
Ref
ineR
y S
eGM
enT
the existing boilers at the Combined heat and Power
Plant. The project is necessary to fulfil environmental
standards with respect to nitrogen oxide and dust emis-
sion, which are expected to enter into force in 2016.
The boiler will generate up to 420 tonnes of steam
per hour, the steam parameters being 13.6 MPag and
5400C. We plan to start up the boiler no. 8 by late
June 2010.
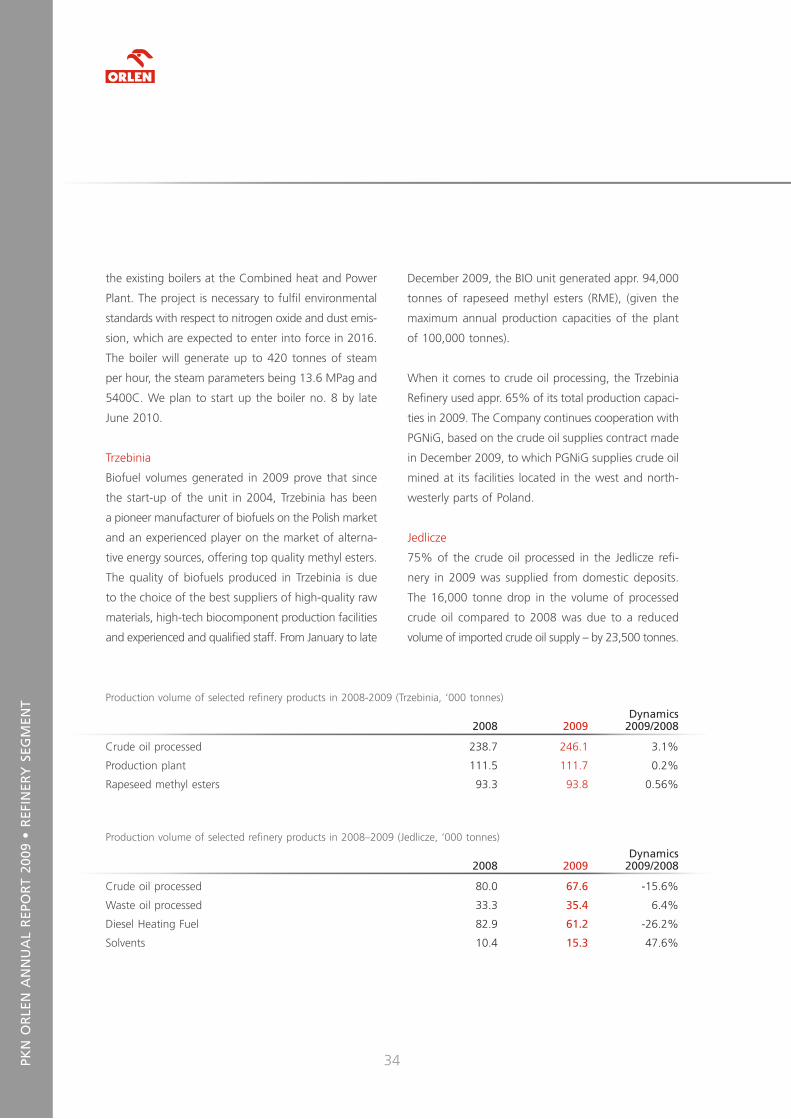
Trzebinia
Biofuel volumes generated in 2009 prove that since
the start-up of the unit in 2004, Trzebinia has been
a pioneer manufacturer of biofuels on the Polish market
and an experienced player on the market of alterna-
tive energy sources, offe ring top quality methyl esters.
The quality of biofuels produced in Trzebinia is due
to the choice of the best suppliers of high-quality raw
materials, high-tech biocomponent production facilities
and experienced and qualified staff. From January to late
December 2009, the BIO unit generated appr. 94,000
tonnes of rapeseed methyl esters (RME), (given the
maximum annual production capacities of the plant
of 100,000 tonnes).
When it comes to crude oil processing, the Trzebinia
Refinery used appr. 65% of its total production capaci-
ties in 2009. The Company continues cooperation with
PGNiG, based on the crude oil supplies contract made
in December 2009, to which PGNiG supplies crude oil
mined at its facilities located in the west and north-
westerly parts of Poland.
Jedlicze
75% of the crude oil processed in the Jedlicze refi-
nery in 2009 was supplied from domestic deposits.
The 16,000 tonne drop in the volume of processed
crude oil compared to 2008 was due to a reduced
volume of imported crude oil supply – by 23,500 tonnes.
Production volume of selected refinery products in 2008-2009 (Trzebinia, ‘000 tonnes)
2008 2009dynamics
2009/2008
Crude oil processed 238.7 246.1 3.1%
Production plant 111.5 111.7 0.2%
Rapeseed methyl esters 93.3 93.8 0.56%
Production volume of selected refinery products in 2008–2009 (Jedlicze, ‘000 tonnes)
2008 2009dynamics
2009/2008
Crude oil processed 80.0 67.6 -15.6%
Waste oil processed 33.3 35.4 6.4%
Diesel Heating Fuel 82.9 61.2 -26.2%
Solvents 10.4 15.3 47.6%
35
Production at the Rafineria Nafty Jedlicze is mainly based
on the following four groups of products: heating oil,
base oil, solvents and special purpose petrol. The largest
group of products manufactured at the Jedlicze refinery
is heating oil used for heating purposes, including heavy
heating oil used in the production of bituminous mass.
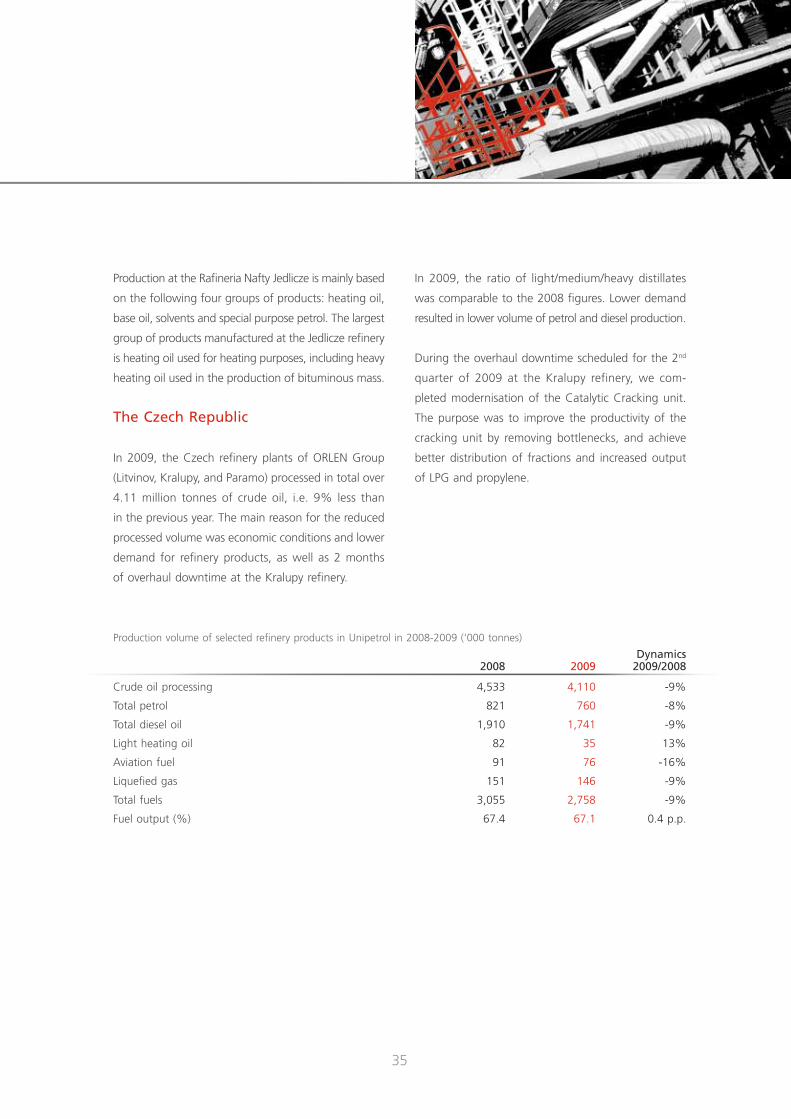
The Czech Republic
In 2009, the Czech refinery plants of ORLEN Group
(Litvinov, Kralupy, and Paramo) processed in total over
4.11 million tonnes of crude oil, i.e. 9% less than
in the previous year. The main reason for the reduced
processed volume was economic conditions and lower
demand for refinery products, as well as 2 months
of overhaul downtime at the Kralupy refinery.
In 2009, the ratio of light/medium/heavy distillates
was comparable to the 2008 figures. Lower demand
resulted in lower volume of petrol and diesel production.
During the overhaul downtime scheduled for the 2nd
quarter of 2009 at the Kralupy refinery, we com-
pleted modernisation of the Catalytic Cracking unit.
The purpose was to improve the productivity of the
cracking unit by removing bottlenecks, and achieve
better distribution of fractions and increased output
of LPG and propylene.
Production volume of selected refinery products in Unipetrol in 2008-2009 (‘000 tonnes)
2008 2009dynamics
2009/2008
Crude oil processing 4,533 4,110 -9%
Total petrol 821 760 -8%
Total diesel oil 1,910 1,741 -9%
Light heating oil 82 35 13%
Aviation fuel 91 76 -16%
Liquefied gas 151 146 -9%
Total fuels 3,055 2,758 -9%
Fuel output (%) 67.4 67.1 0.4 p.p.

36pkn
oR
len
An
nU
Al
Rep
oR
T 20
09 •
Ref
ineR
y S
eGM
enT
lithuania
In 2009, the refinery processed a total of over 8.4 mil-
lion tonnes of crude oil, i.e. 9% less than in the previ-
ous year. The main reason for the reduced processed
volume were economic conditions and lower demand
for refinery products.
In the spring of 2009, we replaced a hydrodesul-
phurisation reactor at the Lithuanian refinery, which
enabled us to manufacture a full range of low-sulphur
oils according to the EU 10 ppm sulphur content
limit in diesel fuels. With the new reactor, the en-
tire facility will be much more productive. At around
the same time, we completed the construction of a new
hydrogen plant, which had started back in 2007.
The new unit will help stabilise hydrogen manage-
ment at the refinery and will supply hydrogen to both
hydrodesulphurisation lines. We continued modernis-
ing refinery facilities in order to ensure their safe and
uninterrupted operation. The costs of related works
amounted to appr. USD 30 mn.
Production volume of selected refinery products in 2008–2009 (ORLEN Lietuva; ‘000 tonnes)
2008 2009dynamics
2009/2008
Crude oil processing 9,241 8,407 -9.0%
Other charge 338 325 -3.8%
Total charge 9,579 8,731 -8.9%
Total petrol 2,827 2,724 -3.6%
Diesel fuel 3,197 3,165 -1%
Light heating oil 7 7 0%
JET fuel 483 228 -52.7%
LPG 396 273 -31.1%
Total fuel 6,910 6,396 -7.4%
Fuel output (%) 72.0 73 -1.8%
Output of white products (%) 72.0 73 -1.8 p.p.

37
Bitumen
Poland
In 2009, we reported an increased production of road,
modified and industrial bitumen compared to the pre-
vious year. The increase was due to higher market
demand.
In 2009, ORLEN Asfalt offered new modified bitumens
manufactured according to the PN-EN 14023:2009 stan-
dard, instead of the previous modified bitumens manu-
factured according to the IBDiM Technical Approval.
Industrial bitumens were monitored according to the new
reference document, PN-EN 13304:2009. The standard
for road bitumens changed as well, and we adjusted
our production to the new PN-EN 12591:2009 standard.
In 2009 domestic bitumen sales went up by 21%,
while the volume of export sales went down, and yet
the profitability of export was higher than in 2008.
The Company used the surplus of products for export
to increase its seasonal sales domestically.
Source: Own study based on market information.
Share in the domestic bitumen market in 2009 (1.58 m tonnes)
42% Lotos Asfalt14% Import44% ORLEN Asfalt
12.88.66.40.5 1.90.20.1 14.2 55.3
The CzechRepublic
GermanyRomaniaSlovakiaAustriaLithuania
HungaryUkraine
Estonia
Geographic structure of export sales at ORLEN Asfalt
in 2009 (%) – total sale 41,453 Mg
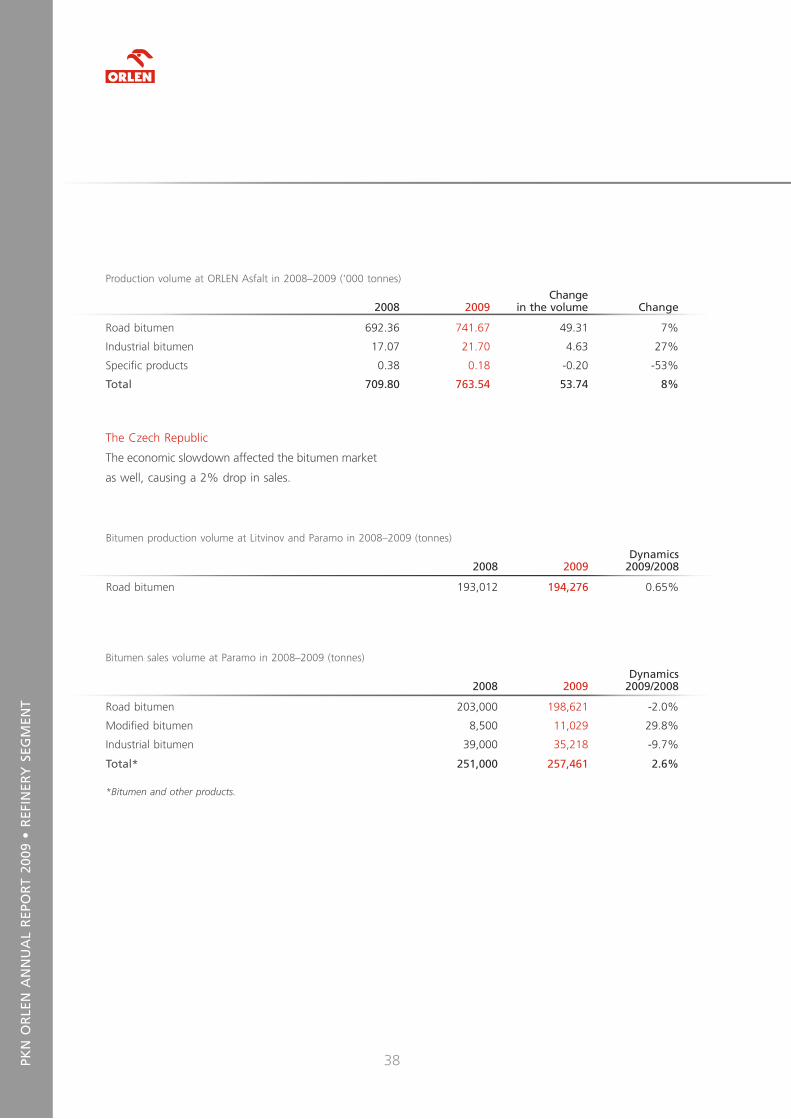
38pkn
oR
len
An
nU
Al
Rep
oR
T 20
09 •
Ref
ineR
y S
eGM
enT
The Czech Republic
The economic slowdown affected the bitumen market
as well, causing a 2% drop in sales.
Production volume at ORLEN Asfalt in 2008–2009 (‘000 tonnes)
2008 2009Change
in the volume Change
Road bitumen 692.36 741.67 49.31 7%
Industrial bitumen 17.07 21.70 4.63 27%
Specific products 0.38 0.18 -0.20 -53%
Total 709.80 763.54 53.74 8%
Bitumen production volume at Litvinov and Paramo in 2008–2009 (tonnes)
2008 2009dynamics
2009/2008
Road bitumen 193,012 194,276 0.65%
Bitumen sales volume at Paramo in 2008–2009 (tonnes)
2008 2009dynamics
2009/2008
Road bitumen 203,000 198,621 -2.0%
Modified bitumen 8,500 11,029 29.8%
Industrial bitumen 39,000 35,218 -9.7%
Total* 251,000 257,461 2.6%
*Bitumen and other products.
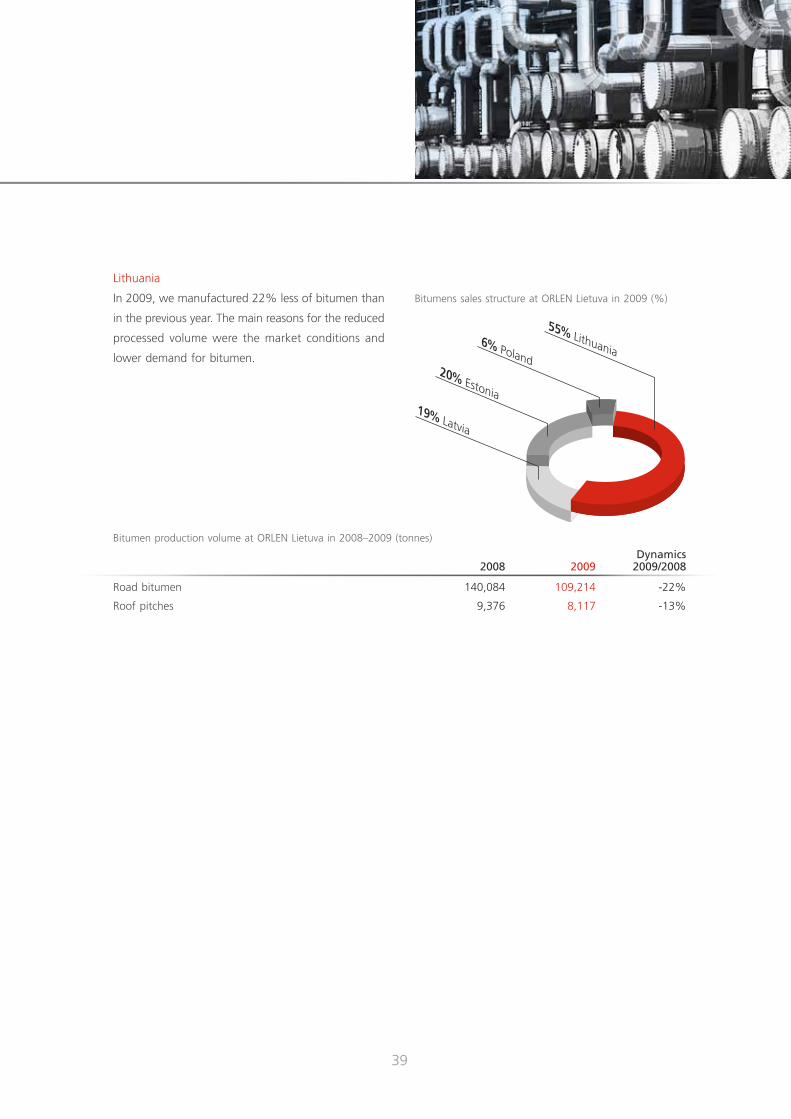
39
55% Lithuania6% Poland
20% Estonia19% Latvia
Lithuania
In 2009, we manufactured 22% less of bitumen than
in the previous year. The main reasons for the reduced
processed volume were the market conditions and
lower demand for bitumen.
Bitumen production volume at ORLEN Lietuva in 2008–2009 (tonnes)
2008 2009dynamics
2009/2008
Road bitumen 140,084 109,214 -22%
Roof pitches 9,376 8,117 -13%
Bitumens sales structure at ORLEN Lietuva in 2009 (%)
CoRpoRATe ColoURS Our visual identity, apart from the name, graphic symbol of eagle’s head and the brand logo combining the name with the emblem, comprises also the company colours. The colours of the logo were chosen based on the common perception of the typical colours of the fuel industry: silver, grey and graphite, and the national red and white colours. Those particular colours were chosen also following an analysis of the colours used by our competitors. We had to make sure that the selection of col-ours for ORLEN fuel station would not cause direct association with other existing fuel station networks. The results of an opinion poll conducted in 2000 proved that our choice was a success: respondents who were shown the image and colours of the new brand without being told which particular company they symbolised, suggested that they represented a refinery and petrochemical business or a new chain of fuel stations.
logistics
42pkn
oR
len
An
nU
Al
Rep
oR
T 20
09 •
lo
GiS
TiC
S
logistics
To ensure fluent and efficient flow of raw materials and
finished products, ORLEN Group uses an infrastructure
which consists of: fuel terminals, land and offshore
transshipment facilities, a network of industrial raw
material and product pipelines as well as road and
rail transport.
The most important events in the area of logistics
in 2009 were;
• Launch of the “Self-service” project aimed at higher
automation of the refuelling process at the Com-
pany’s own terminals;
• Restructuring of terminals in order to reduce their
operating costs;
• Establishing a Loss Management Unit in the area
of Logistics to minimise loss;
• Increasing the capacity of the Fuel Terminal
in Wrocław from the original 12,500 m3 to over
50,000m3 by 2011 – a project related to the con-
struction of a pipeline to Wrocław;
• Construction of a fuel pipeline from Ostrów Wielko-
polski to Wrocław – date of completion scheduled
for 2010.
Mandatory Reserves
In 2009, we stored our mandatory crude oil reserves
at the Production Plant in Płock, in underground cavities
at IKS “Solino” and at the refinery in Mažeikiai. Fuel was
stored in 24 locations in Poland and at several leased ter-
minals in Lithuania. By the end of 2009, the total value
of the above reserved amounted to appr. PLN 5.5 bn
(Poland) and USD 200 mn (Lithuania).
Poland
IN 2009, PKN ORLEN maintained mandatory reserves
covering 76 days of domestic consumption, while
Material Reserves Agency provided for another 14 days
of reserves.
We participate in discussions on a new law which
would increase the Government’s involvement in sto-
ring mandatory crude oil reserves. PKN ORLEN supports
solutions which would:
• Improve Poland’s energy security by giving the Gov-
ernment more power to control mandatory reserves;
• Release companies from the obligation to pay for
mandatory reserves.
The Czech Republic
According to the Czech law, mandatory crude oil and
fuel reserves are maintained by a dedicated govern-
ment agency.
Lithuania
By the end of 2009, mandatory reserves in Lithuania
covered 90 days, of which ORLEN Lietuva provided for
60 days (the other 30-day reserves were maintained
by the Lithuanian State Agency). Crude oil reserves were
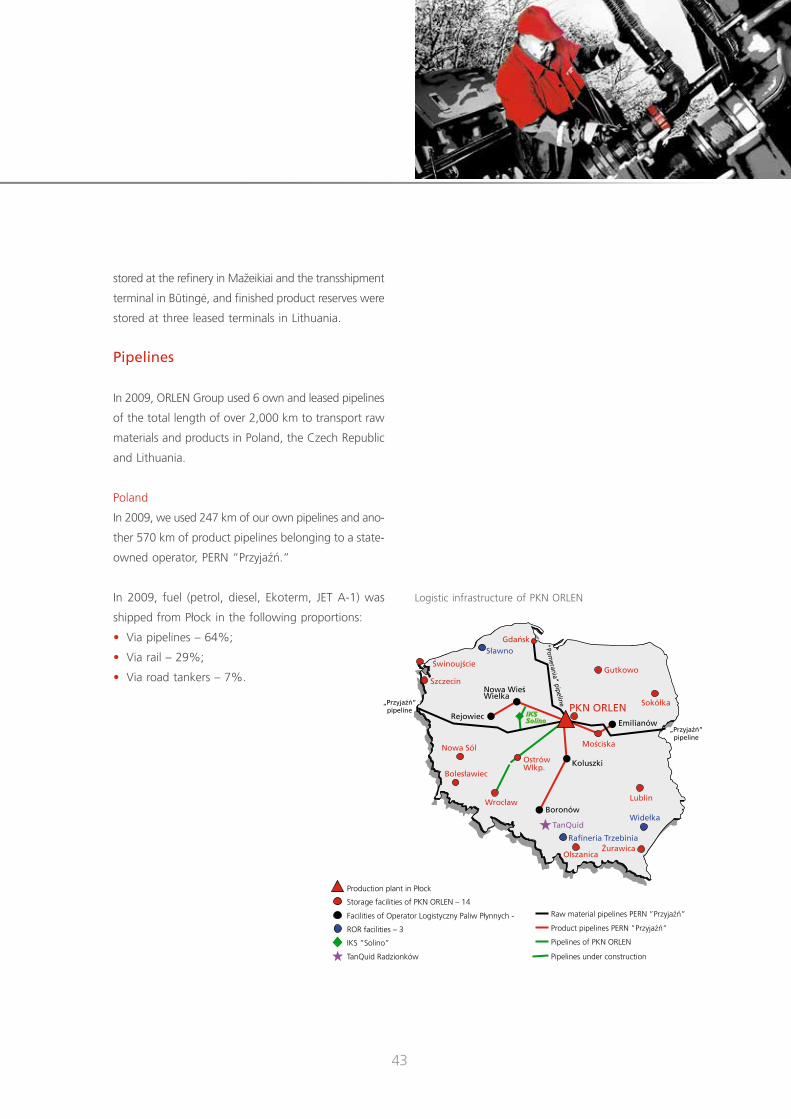
43
stored at the refinery in Mažeikiai and the transshipment
terminal in Būtingė, and finished product reserves were
stored at three leased terminals in Lithuania.
pipelines
In 2009, ORLEN Group used 6 own and leased pipelines
of the total length of over 2,000 km to transport raw
materials and products in Poland, the Czech Republic
and Lithuania.
Poland
In 2009, we used 247 km of our own pipelines and ano-
ther 570 km of product pipelines belonging to a state-
owned operator, PERN “Przyjaźń.”
In 2009, fuel (petrol, diesel, Ekoterm, JET A-1) was
shipped from Płock in the following proportions:
• Via pipelines – 64%;
• Via rail – 29%;
• Via road tankers – 7%.
Logistic infrastructure of PKN ORLEN
S³awno
Świnoujście
Szczecin
Nowa Sól
Wroc³aw
TanQuid
Boronów
Rafineria Trzebinia
Olszanica¯urawica
Lublin
Mościska
Sokó³ka
Gutkowo
Gdañsk
PKN ORLENEmilianów
Koluszki
Wide³ka
OstrówWlkp.
Nowa Wieś Wielka
Rejowiec IKS Solino
”Pomerania” pipeline
„Przyjaźñ”pipeline
„Przyjaźñ”pipeline
Boles³awiec
Production plant in P³ock
Storage facilities of PKN ORLEN – 14
Facilities of Operator Logistyczny Paliw P³ynnych - 5
ROR facilities – 3
IKS ”Solino”
TanQuid Radzionków
Raw material pipelines PERN ”Przyjaźñ”
Product pipelines PERN ”Przyjaźñ”
Pipelines of PKN ORLEN
Pipelines under construction

44pkn
oR
len
An
nU
Al
Rep
oR
T 20
09 •
lo
GiS
TiC
S
The Czech Republic
In 2009, like in previous years, Unipetrol Group used
1,100 km of pipelines belonging to the state-owned
operator, CEPRO.
Lithuania
The “Friendship” pipeline, which used to deliver crude
oil to the refinery in Mažeikiai until 2006, remains closed.
In 2009, ORLEN Lietuva used a section of the product
pipeline from Belarus to Ventspills, Latvia, to transport
diesel fuel from Belarusian refineries.
Pipeline network in Lithuania
Fuel distribution network in the Czech Republic
Ventspils Terminal
Džūkste
Možeikiai Refinery
Būtingė Terminal
BiržaiPump
Station
Ilūkste
Polotsk
from Yaroslav
from Samara
Bia³oruś
£otwa
Crude pipelines*Product pipelines
Hajek
Roudnice
Mstetice
Cerekvice
Slapanov
SmyslovBelcice
Tresmona
Vcelna
Velka BitesPlesovec
Klobouky
Bratyslava
Sedlinice(under construction)
Strelice
Loukov
Potehy PardubiceKralupy
Litvinov
CRaf rafineries Storage facilities Cepro – capacity 280,000 m3
Raw material pipelines Mero
Product pipelines Cepro – appr. 1,000 km
*Out of use.
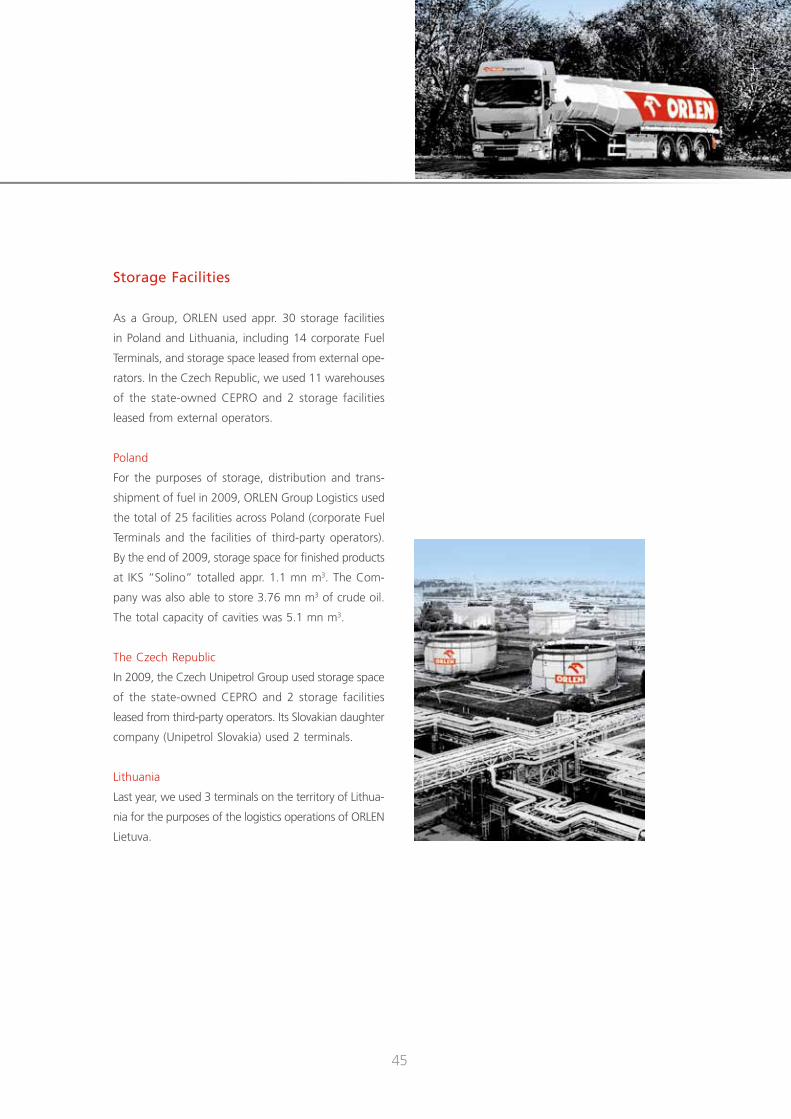
45
Storage facilities
As a Group, ORLEN used appr. 30 storage facilities
in Poland and Lithuania, including 14 corporate Fuel
Terminals, and storage space leased from external ope-
rators. In the Czech Republic, we used 11 warehouses
of the state-owned CEPRO and 2 storage facilities
leased from external operators.
Poland
For the purposes of storage, distribution and trans-
shipment of fuel in 2009, ORLEN Group Logistics used
the total of 25 facilities across Poland (corporate Fuel
Terminals and the facilities of third-party operators).
By the end of 2009, storage space for finished products
at IKS “Solino” totalled appr. 1.1 mn m3. The Com-
pany was also able to store 3.76 mn m3 of crude oil.
The total capacity of cavities was 5.1 mn m3.
The Czech Republic
In 2009, the Czech Unipetrol Group used storage space
of the state-owned CEPRO and 2 storage facilities
leased from third-party operators. Its Slovakian daughter
company (Unipetrol Slovakia) used 2 terminals.
Lithuania
Last year, we used 3 terminals on the territory of Lithua-
nia for the purposes of the logistics operations of ORLEN
Lietuva.

46pkn
oR
len
An
nU
Al
Rep
oR
T 20
09 •
lo
GiS
TiC
S
Rail Transport
Poland
PKN ORLEN transported appr. 8.1 mn tonnes of products
via rail, including 6.3 mn tonnes of motor fuel, which
represents an increase by 2.0 mn tonnes and 1.7 mn
tonnes, respectively, compared to 2008.
The Czech Republic
The total volume of sold products transported via rail
across the Czech Republic amounted to appr. 850,000
tonnes, including appr. 660,000 tonnes of fuel.
The volume of sold products transported by Unipet-
rol Doprava, a rail transport company, amounted
to 410,000 tonnes.
Lithuania
The total volume of rail transport was appr. 7.4 mn
tonnes, of which appr. 4.8 mn tonnes were loaded
on ships and exported outside Lithuania.
Road Transport
In 2009, an ORLEN Group company, ORLEN Transport,
delivered fuel to our fuel stations across Poland.
In the Czech Republic, fuel was delivered to Benzina
stations by a Unipetrol Group company – Petrotrans.
In Lithuania, we outsourced fuel delivery services
to ORLEN Lietuva stations from UAB Simeon, the com-
pany which had won a tender organised in 2007.
ORLEN Lietuva used its own means to deliver JET A-1
aviation fuel to its Lithuanian and Latvian customers.
47
Maritime cargo handling
In 2009, we transshipped appr. 6 million tonnes of prod-
ucts in Poland and Lithuania combined, which is com-
parable to the 2008 figure.
Poland
We used docks in Gdynia and Świnoujście to handle
over 1 mn tonnes of products, in particular heavy
heating oil for export (0.67 mn tonnes).
Lithuania
The volume of ORLEN Lietuva products transshipped
in marine docks amounted to appr. 4.8 mn tonnes
in 2009.
investment projects
In 2010, we will continue several projects in the area
of logistics:
Poland
• closing the 3rd stage of the process of restructuring
logistics by employment optimisation and process
automation at the Fuel Terminals, which will result
in higher cost efficiency in the area. We will be
redefining the organisation and management of logi-
stics in order to adapt to the changing internal and
external conditions;
• Finalising the “Self-service” project designed to achieve
more automated operation of the Fuel Terminals;
• Launching a “Cavity strategy” which focuses, in par-
ticular, on initiating long-term measures to prolong
the operating life and increase the safety of the exist-
ing underground crude oil and fuel storage facilities
at IKS “Solino,” and the possibility of constructing
new underground hydrogen storage space.
We plan to start 105 km of product pipeline between
Ostrów Wielkopolski and Wrocław in 2010.
The Czech Republic
• Strengthening the position of Unipetrol Group in Slo-
vakia;
• Remodelling rail cargo handling devices in Litvinov;
• Securing motor fuel supplies to Unipetrol Slovakia.
Lithuania
• Opening a main railway line in the direction of Latvia
and Estonia;
• Reducing costs and rail and harbour charges for
ORLEN Lietuva;
• Reducing the costs of maintaining mandatory
reserves.
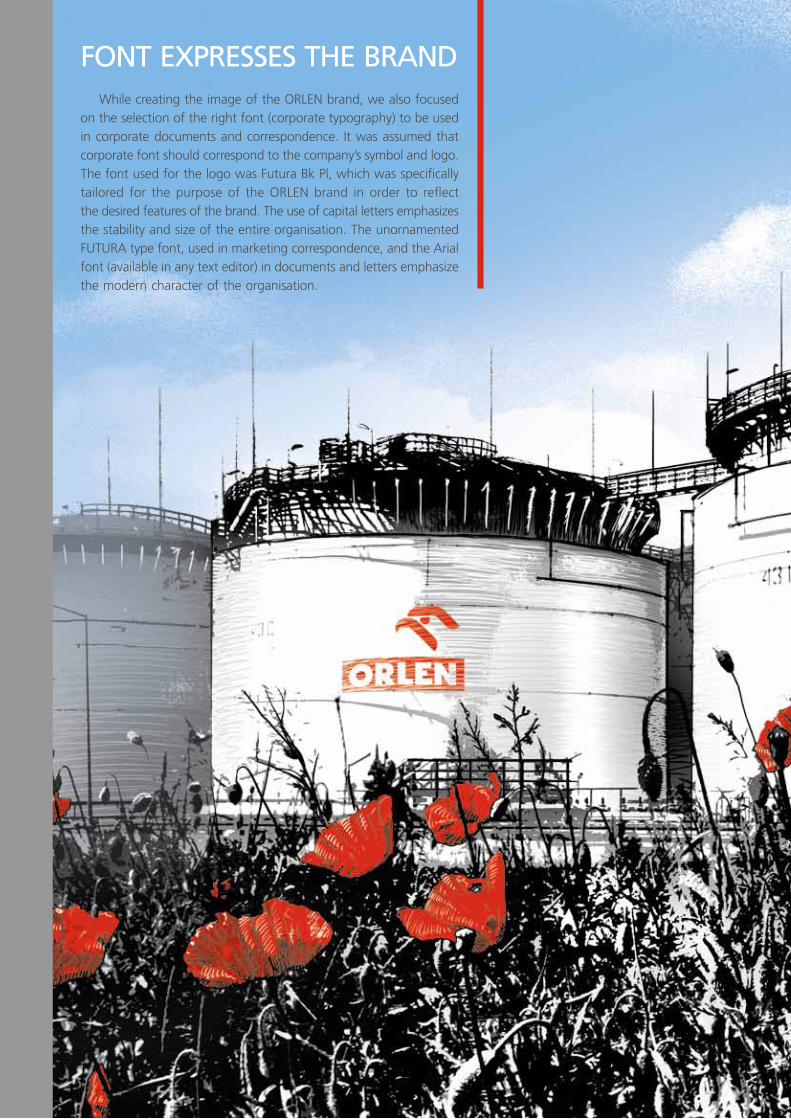
fonT eXpReSSeS The BRAnd While creating the image of the ORLEN brand, we also focused on the selection of the right font (corporate typography) to be used in corporate documents and correspondence. It was assumed that corporate font should correspond to the company’s symbol and logo. The font used for the logo was Futura Bk Pl, which was specifically tailored for the purpose of the ORLEN brand in order to reflect the desired features of the brand. The use of capital letters emphasizes the stability and size of the entire organisation. The unornamented FUTURA type font, used in marketing correspondence, and the Arial font (available in any text editor) in documents and letters emphasize the modern character of the organisation.
Wholesale segment

50pkn
oR
len
An
nU
Al
Rep
oR
T 20
09 •
Wh
ole
SAle
SeG
Men
T
Wholesale segment
In 2009 ORLEN Group continued the wholesale of fuel
and non-fuel products on the territory of Poland,
the Czech Republic, Germany, Slovakia and Lithuania.
The Group’s wholesale segment consisted of PKN ORLEN
wholesale units, 5 Regional Market Operators, Petrolot,
ORLEN Gaz (Poland), Uniraf Slovakia (Slovakia), Unipetrol
BUI (the Czech Republic), ORLEN Lietuva (Lithuania,
Ukraine, Poland, sea sales).
oRlen Group – fuels
The total volume of fuel sold by ORLEN Group in 2009
was appr. 6% (i.e. 1.0 mn tonnes) less than in the previ-
ous year. More than half of our fuel sales was generated
by diesel fuel, whose sales, however, dropped by 5%
compared to 2008.
The high dynamics of fuel sales in Poland was possible
mainly due to higher sales volume in the key customer
group comprising Polish and international corpora-
tions. Fuel sales were also enhanced by promotions
offered at storage facilities, i.e. reduced SPOT prices
on selected products.
The lower volume of sales was mainly due to lower fuel
consumption, whose dynamics was -16% in Lithuania
and -4% in the Czech Republic. Despite negative
market conditions, the drop in sales that the Group
reported (-12% in Lithuania and -2% in the Czech
Republic) was above the average market tendencies
in the respective countries.
Apart from local customers (in Poland, the Czech Re-
public, Slovakia, Germany, Baltic States), ORLEN Group
sold its fuel also to Ukraine, Nigeria, Moldova and UK.
Poland
In 2009, motor fuel consumption (petrol, diesel, LPG)
in Poland went up by app. 2%(1) compared to the pre-
vious year. Domestic fuel consumption was stimulated
mainly by the country’s dynamic economic growth
at the rate of 1.7% GDP, which resulted in higher
demand for transport services. Growing consumption
was also due to a much higher number of registered
vehicles.
Petrol consumption in 2009 remained at a similar level
compared to 2008, which proves that this particular
market has been stable for the last several years. Like
in previous years, in 2009 we reported growing domes-
tic consumption of diesel fuel. Another reason behind
the growing consumption of diesel, beside the high GDP
rate, was the fact that many companies are replacing
their fleet with diesel engine vehicles. On the other
hand, the consumption of light heating oil dropped by
appr. 2% in 2009. This was due to the entry into force
of a new law which limits the sales of this particular
product to farmers.
In 2009, the petrol imported to Poland covered 13%(2)
of domestic petrol consumption, the volume being
appr. 3 pp smaller than in the previous year. The share
of imported diesel dropped from 33% in 2008 to 30%
in 2009. On the other hand, the share of imported
light heating oil in domestic consumption went up
from 19% in 2008 to 23% in 2009.
Most of the imported motor fuel originated from
Germany, followed by: Slovakia, Lithuania and Belarus.
The entire volume of imported light heating oil came
from Germany.
1 Source: Agencja Rynku Energii SA, POGP.2 Source: Report POPiHN 2009.

51
ORLEN Group fuel sales volume on local markets (1,000 tonnes)
2008 2009Polish
companiesCzech
companiesLithuanian companies Other* Total
Polishcompanies
Czech companies
Lithuanian companies Other* Total Dynamics
Petrol 1,624 545 2,801 195 5,165 1,714 542 2,770 186 5,212 1%
Diesel fuel 3,943 1,088 3,160 370 8,561 4,017 1,066 2,669 344 8,096 -5%
Light heating oil 921 25 8 286 1,240 807 22 7 268 1,103 -11%
JET A-1 482 88 480 – 1,050 293 75 227 – 595 -43%
LPG 263 98 187 – 548 209 94 131 – 434 -21%
Total 6,970 1,746 6,448 851 16,015 6,830 1,705 5,673 798 15,005 -6%
* Wholesale volume in Slovakia and Germany.
ORLEN Group share in local fuel sales markets in 2008–2009
2008 2009 dynamics
PKN ORLEN*– Poland 61.60% 61.90% 0.30 p.p.
Unipetrol** – the Czech Republic 30.90% 31.40% 0.50 p.p.
ORLEN Lietuva**– Lithuania 89.10% 90.30% 1.20 p.p.
* Share in wholesale and retail sales of petrol, diesel and light heating oil.
** Share in wholesale and retail sales of petrol, diesel and JET A-1.
Fuel consumption in Poland in 2008–2009 (‘000 tonnes)
2008 2009 dynamics
Petrol 4,273 4,257 -0.4%
Diesel fuel 10,475 10,958 4.6%
Light heating oil 1,204 1,184 -1.7%
LPG 1,774 1,681 -5.2%
Total 17,726 18,080 2.0%
Fuel import to Poland in 2008–2009 (‘000 tonnes)
2008 2009 dynamics
Petrol 666 492 -26%
Diesel fuel 2,248 2,149 -4%
Light heating oil 7 15 126%
Total 2,920 2,657 -9%
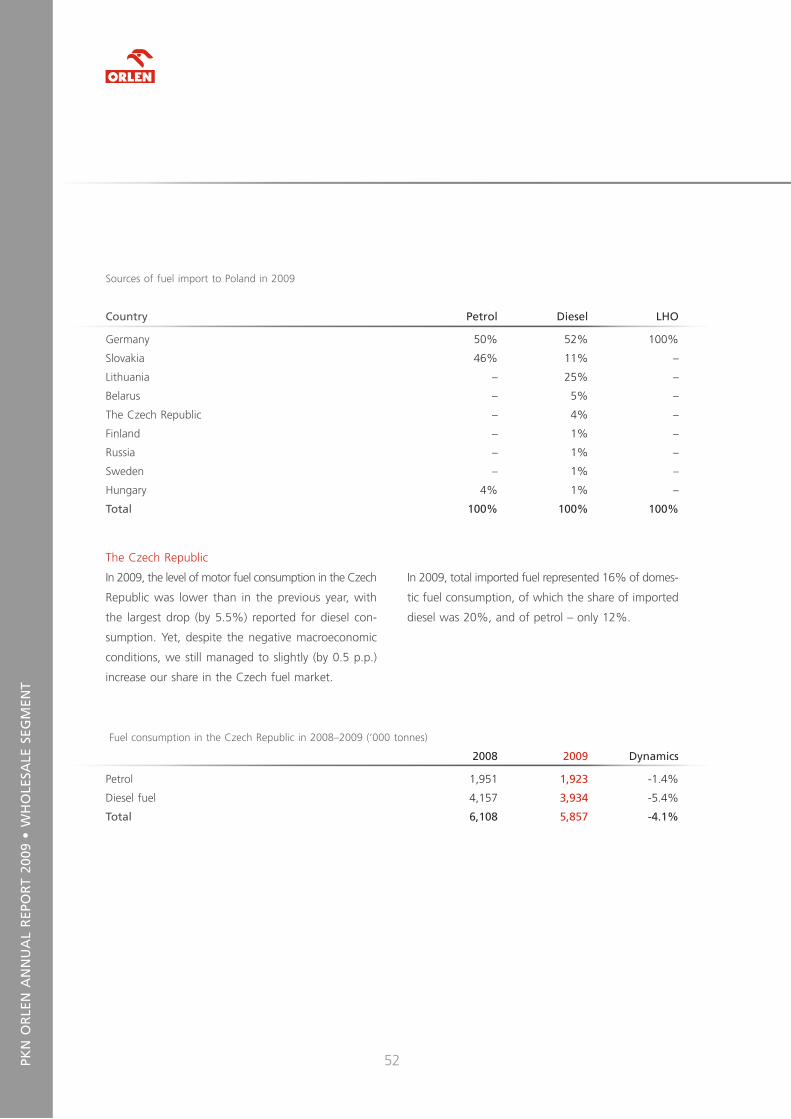
52pkn
oR
len
An
nU
Al
Rep
oR
T 20
09 •
Wh
ole
SAle
SeG
Men
T
Sources of fuel import to Poland in 2009
Country petrol diesel lho
Germany 50% 52% 100%
Slovakia 46% 11% –
Lithuania – 25% –
Belarus – 5% –
The Czech Republic – 4% –
Finland – 1% –
Russia – 1% –
Sweden – 1% –
Hungary 4% 1% –
Total 100% 100% 100%
The Czech Republic
In 2009, the level of motor fuel consumption in the Czech
Republic was lower than in the previous year, with
the largest drop (by 5.5%) reported for diesel con-
sumption. Yet, despite the negative macroeconomic
conditions, we still managed to slightly (by 0.5 p.p.)
increase our share in the Czech fuel market.
Fuel consumption in the Czech Republic in 2008–2009 (‘000 tonnes)
2008 2009 dynamics
Petrol 1,951 1,923 -1.4%
Diesel fuel 4,157 3,934 -5.4%
Total 6,108 5,857 -4.1%
In 2009, total imported fuel represented 16% of domes-
tic fuel consumption, of which the share of imported
diesel was 20%, and of petrol – only 12%.

53
Fuel consumption in Lithuania in 2008–2009 (‘000 tonnes)
2008 2009 dynamics
Petrol 429 379 -11.7%
Diesel fuel 1,126 992 -11.9%
JET A-1 77 39 -49.4%
LPG 252 172 -31.7%
Total 1,555 1,371 -11.8%
Lithuania
oRlen Group – non-fuel products
Total wholesale volume of non-fuel products by ORLEN
Group in 2009 amounted to 5,674,000 tonnes, i.e. 7%
less than in 2008.
The main consumers of petrochemical products of-
fered by PKN ORLEN were the manufacturers of: plas-
tics (PE, PP, PVC, PET), synthetic rubber, ethoxylates
(used in the production of surface active agents) and
Non-fuel sales by ORLEN Group in 2008–2009 (‘000 tonnes)
2008 2009Polish
companiesCzech
companiesLithuanian companies Total
Growth/fall
Polishcompanies
Czech companies
Lithuanian companies Total
Growth/fall
Heating oil III 961 146 1,798 2,905 29% 930 85 1,466 2,482 -15%P fractions 338 – – 338 13% 315 – – 315 -7%Sulphur 130 34 76 241 26% 135 31 70 236 -2%Refinery 60 232 178 470 -23% 70 375 169 614 31%Ethylene – 153 – 153 -1% – 143 – 143 -6%Propylene 6 27 – 33 -32% 14 36 – 50 54%Benzene 95 179 – 274 -1% 83 182 – 265 -3%Glycols 88 – – 88 -14% 84 – – 84 -4%Toluene 103 – – 103 -14% 91 – – 91 -11%Paraxylene 25 – – 25 -22% 1 – – 1 -97%Orthoxylene 21 – – 21 -19% 21 – – 21 -1%Butadiene 55 – – 55 -7% 57 – – 57 2%C fractions – 211 – 211 24% – 168 – 168 -20%Polyolefins – 482 – 482 21% – 500 – 500 4%Ammonia – 195 – 195 11% – 234 – 234 20%OXO alcohols – 56 – 56 4% – 18 – 18 -68%Industrial oil – 21 – 21 -27% – 18 – 18 -12%Petrochemical 186 225 – 411 -6% 186 192 – 378 -8%Total nonfuel 2,069 1,960 2,052 6,080 12% 1,987 1,982 1,705 5,674 -7%
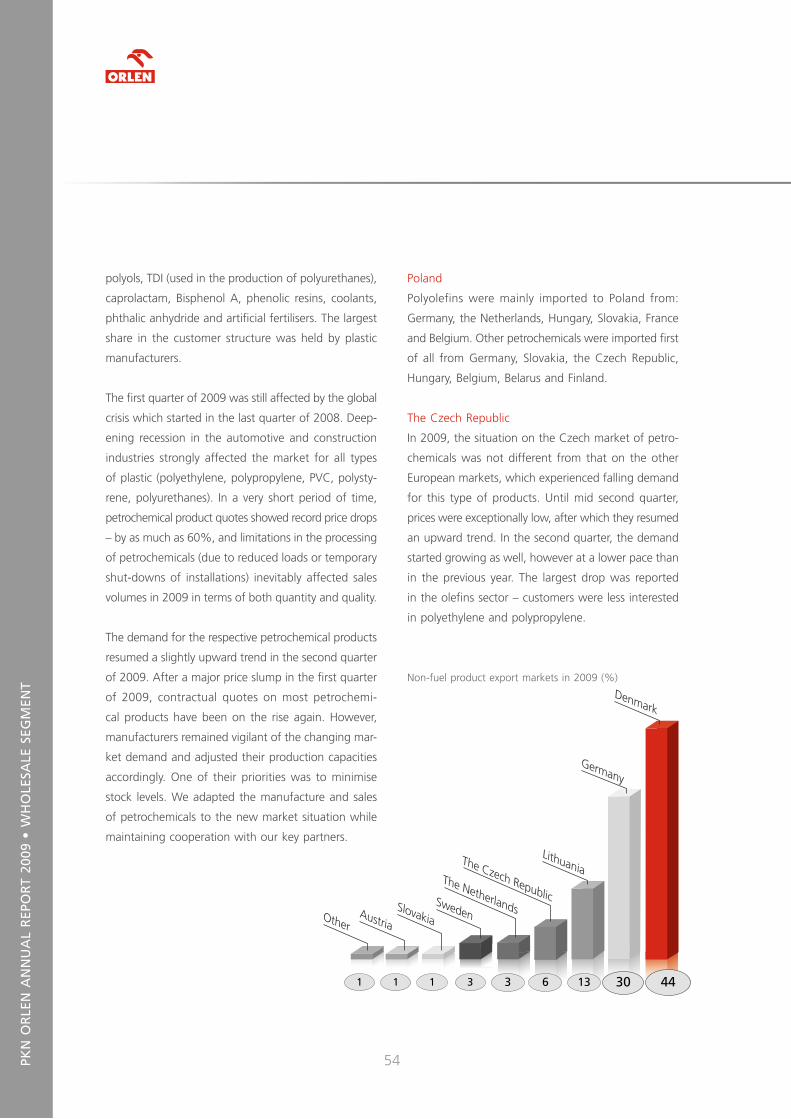
54pkn
oR
len
An
nU
Al
Rep
oR
T 20
09 •
Wh
ole
SAle
SeG
Men
T
polyols, TDI (used in the production of polyurethanes),
caprolactam, Bisphenol A, phenolic resins, coolants,
phthalic anhydride and artificial fertilisers. The largest
share in the customer structure was held by plastic
manufacturers.
The first quarter of 2009 was still affected by the global
crisis which started in the last quarter of 2008. Deep-
ening recession in the automotive and construction
industries strongly affected the market for all types
of plastic (polyethylene, polypropylene, PVC, polysty-
rene, polyurethanes). In a very short period of time,
petrochemical product quotes showed record price drops
– by as much as 60%, and limitations in the processing
of petrochemicals (due to reduced loads or temporary
shut-downs of installations) inevitably affected sales
volumes in 2009 in terms of both quantity and quality.
The demand for the respective petrochemical products
resumed a slightly upward trend in the second quarter
of 2009. After a major price slump in the first quarter
of 2009, contractual quotes on most petrochemi-
cal products have been on the rise again. However,
manufacturers remained vigilant of the changing mar-
ket demand and adjusted their production capacities
accordingly. One of their priorities was to minimise
stock levels. We adapted the manufacture and sales
of petrochemicals to the new market situation while
maintaining cooperation with our key partners.
Poland
Polyolefins were mainly imported to Poland from:
Germany, the Netherlands, Hungary, Slovakia, France
and Belgium. Other petrochemicals were imported first
of all from Germany, Slovakia, the Czech Republic,
Hungary, Belgium, Belarus and Finland.
The Czech Republic
In 2009, the situation on the Czech market of petro-
chemicals was not different from that on the other
European markets, which experienced falling demand
for this type of products. Until mid second quarter,
prices were exceptionally low, after which they resumed
an upward trend. In the second quarter, the demand
started growing as well, however at a lower pace than
in the previous year. The largest drop was reported
in the olefins sector – customers were less interested
in polyethylene and polypropylene.
Non-fuel product export markets in 2009 (%)
13631 311 4430
Denmark
Germany
LithuaniaThe Czech Republic
The NetherlandsSweden
SlovakiaAustriaOther
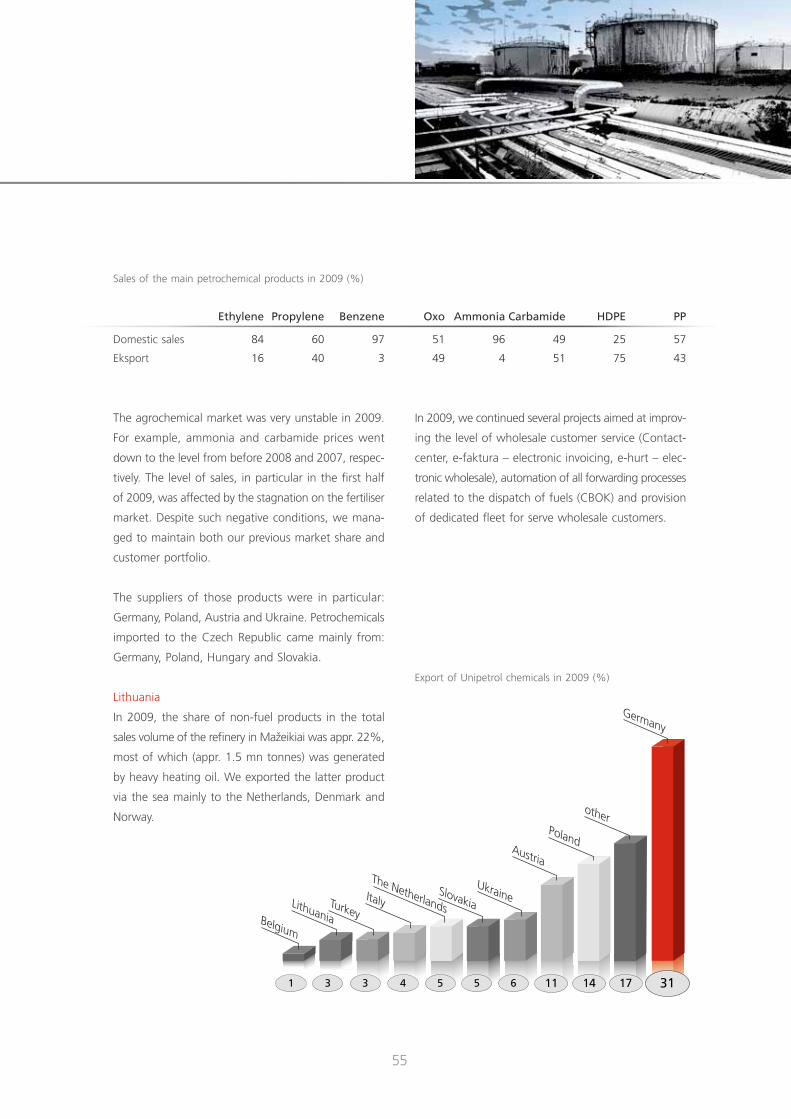
55
Export of Unipetrol chemicals in 2009 (%)
The agrochemical market was very unstable in 2009.
For example, ammonia and carbamide prices went
down to the level from before 2008 and 2007, respec-
tively. The level of sales, in particular in the first half
of 2009, was affected by the stagnation on the fertiliser
market. Despite such negative conditions, we mana-
ged to maintain both our previous market share and
customer portfolio.
The suppliers of those products were in particular:
Germany, Poland, Austria and Ukraine. Petrochemicals
imported to the Czech Republic came mainly from:
Germany, Poland, Hungary and Slovakia.
Lithuania
In 2009, the share of non-fuel products in the total
sales volume of the refinery in Mažeikiai was appr. 22%,
most of which (appr. 1.5 mn tonnes) was generated
by heavy heating oil. We exported the latter product
via the sea mainly to the Netherlands, Denmark and
Norway.
In 2009, we continued several projects aimed at improv-
ing the level of wholesale customer service (Contact-
center, e-faktura – electronic invoicing, e-hurt – elec-
tronic wholesale), automation of all forwarding processes
related to the dispatch of fuels (CBOK) and provision
of dedicated fleet for serve wholesale customers.
14 17115 5 64331 31
Germany
otherPoland
Austria
UkraineSlovakia
The NetherlandsItalyTurkey
LithuaniaBelgium
Sales of the main petrochemical products in 2009 (%)
ethylene propylene Benzene oxo Ammonia Carbamide hdpe pp
Domestic sales 84 60 97 51 96 49 25 57
Eksport 16 40 3 49 4 51 75 43
oRlen pRodUCTS Since it was created in 2000, the ORLEN brand has been the axis of corporate marketing, which enabled the company to shape its cohe rent image. The ORLEN logo is visible both at Premium fuel stations and on motor oils, operating fuels, car lubricants and industrial lubri-cants as well as on a broad range of automotive chemicals offered by ORLEN Oil. All those products are manufactured using the latest technologies and dedicated to a large group of users, ranging from passenger car and truck drivers through farmers and construction companies using heavy construction equipment, motorcyclists and motorboat sailors to sea transport companies. The topmost quality of ORLEN Oil products is testified by a number of famous car pro-ducers and manufacturers of industrial equipment.

oil segment

58pkn
oR
len
An
nU
Al
Rep
oR
T 20
09 •
oil
SeG
Men
T
oil segment
In 2009, the ORLEN Group oil segment consisted
of ORLEN Oil in Poland and Paramo in the Czech
Republic.
The sales volume generated by the ORLEN Group’s entire
oil segment was 404,700 tonnes, i.e. appr. 7.6% less
than in 2008. Base oil and lubricant sales amounted
to appr. 215,600 tonnes, which is more than 6% less
than in 2008.
poland
The 14% drop in production volume in 2009 was mainly
due to the economic situation in the country. Another
important reason behind the slow-down in production
was the scheduled overhaul downtime at the oil block
ORLEN Group oil segment sales volume in 2008–2009 (tonnes)
2008 2009 dynamics
Lubricants and base oils 229,642 215,639 -6.1%
Other products 208,624 189,132 -9.3%
Total 438,276 404,771 -7.6%
unit. The volume of lubricant production in 2009 was
adjusted to the shrinking demand for this particular
type of products.
2009 was a year of intensified efforts in the Research
and Development area. We implemented 42 projects,
which resulted in the launch of new products on the
market and modified technologies to better suit cus-
tomer demands and European and global standards.
We installed a crystallisation modifier to improve
the efficiency of the Mektol unit. To make the Com-
pany independent of external suppliers, we tested
the possibilities of deriving Brighstock-type base oil
from Paramo’s raw materials and improving the ther-
mooxidising stability of the 2nd group of Paramo oils
at the HROS unit in Płock.

59
Sales volume at ORLEN Oil in 2008–2009 (tonnes)
2008 2009 dynamics
Lubricants and base oils 157,463 151,992 -3.5%
Other products 198,065 182,184 -8%
Total 355,528 334,176 -6%
Production volume at ORLEN Oil in 2008–2009 (tonnes)
2008 2009 dynamics
Lubricants, base oils and process oils 226,682 195,461 -13.8%
Other products 226,852 204,978 -9.6%
Total 453,534 400,439 -11.7%
Sales
With an over 20% share in the market, ORLEN Oil
is one of the leaders of the Polish lubricants industry.
Despite difficult market conditions and lower demand
for lubricants, the Company maintained its strong posi-
tion thanks to several projects launched in mid 2009
with a view to improving the level of customer service
– among others by broadening the range of products
offered and reorganising the distribution network and
logistics systems.
In 2009, we continued the most important and so far
the largest investment project in the history of ORLEN
Oil, namely the construction of a dispatch terminal for
road tankers at the Production Plant in Płock. The ter-
minal was put in operation in August 2009. We also
worked on modernising and renovating the Company’s
existing fixed assets, such as: the DCS at the MEKTOL
unit at the Płock Plant, packing lines at production
plants or implementation of APC at the Furfurol unit
at the Płock Plant.
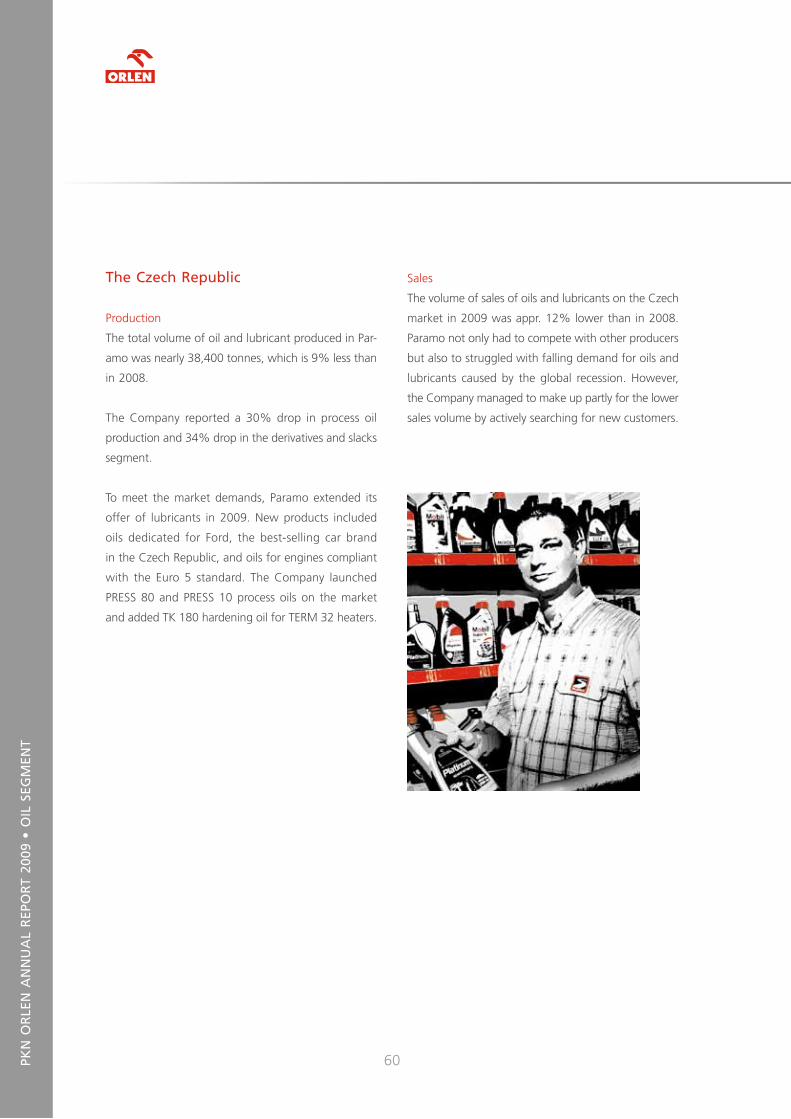
60pkn
oR
len
An
nU
Al
Rep
oR
T 20
09 •
oil
SeG
Men
T
The Czech Republic
Production
The total volume of oil and lubricant produced in Par-
amo was nearly 38,400 tonnes, which is 9% less than
in 2008.
The Company reported a 30% drop in process oil
production and 34% drop in the derivatives and slacks
segment.
To meet the market demands, Paramo extended its
offer of lubricants in 2009. New products included
oils dedicated for Ford, the best-selling car brand
in the Czech Republic, and oils for engines compliant
with the Euro 5 standard. The Company launched
PRESS 80 and PRESS 10 process oils on the market
and added TK 180 hardening oil for TERM 32 heaters.
Sales
The volume of sales of oils and lubricants on the Czech
market in 2009 was appr. 12% lower than in 2008.
Paramo not only had to compete with other producers
but also to struggled with falling demand for oils and
lubricants caused by the global recession. However,
the Company managed to make up partly for the lower
sales volume by actively searching for new customers.
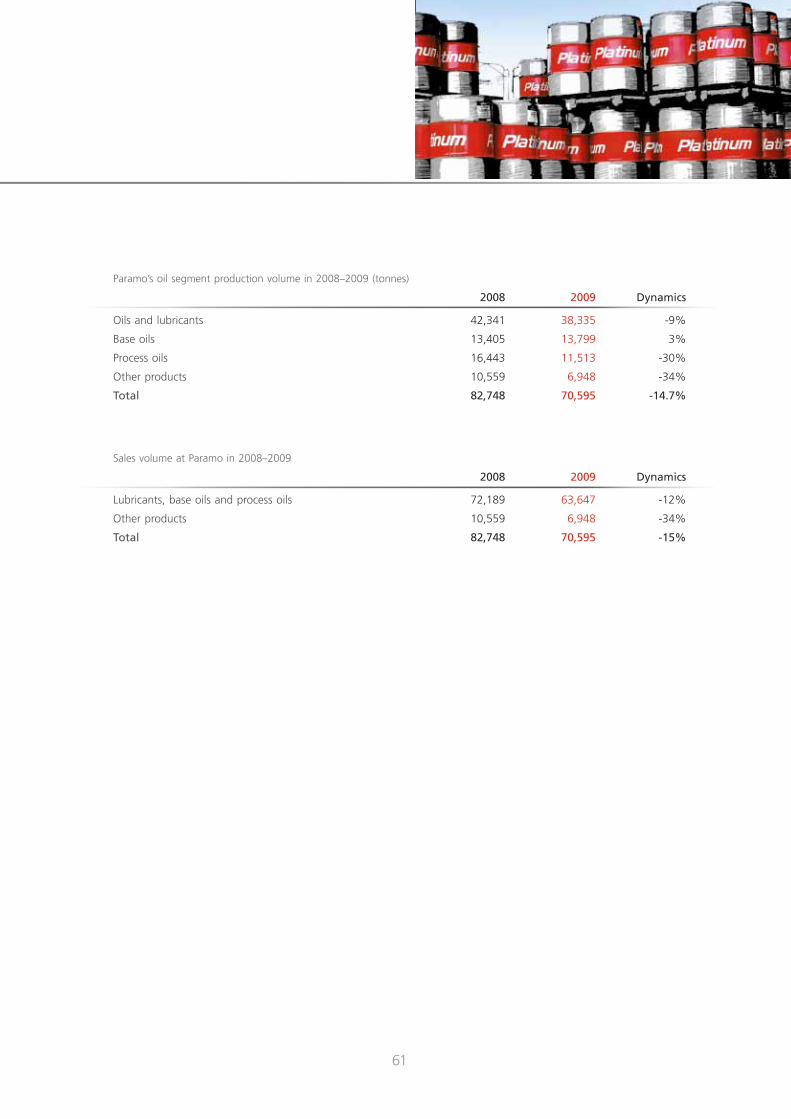
61
Sales volume at Paramo in 2008–2009
2008 2009 dynamics
Lubricants, base oils and process oils 72,189 63,647 -12%
Other products 10,559 6,948 -34%
Total 82,748 70,595 -15%
Paramo’s oil segment production volume in 2008–2009 (tonnes)
2008 2009 dynamics
Oils and lubricants 42,341 38,335 -9%
Base oils 13,405 13,799 3%
Process oils 16,443 11,513 -30%
Other products 10,559 6,948 -34%
Total 82,748 70,595 -14.7%

MARkeT iMAGe The image of ORLEN fuel stations was based on the standards defined in the corporate brand strategy. It was agreed that the im-age of all the stations in the new chain will comprise uniform and standardised elements. The idea was to create a coherent image and positive perception of the chain among customers. The opening of the first fuel station was preceded by design work and prototype and pilot programmes. The first ORLEN fuel station was opened on 10 November 2000 at the “Orle” housing estate in Jelenia Góra. The first in the chain, the station was meant to attract attention with its silver, red and graphite colours. Today, the red and silver fuel stations have become a part of the local landscape all across Poland. In 2009, PKN ORLEN managed a net-work of 940 ORLEN stations in Poland. The eagle-branded stations represent our brand in Lithuania and Germany as well.

Retail segment
64pkn
oR
len
An
nU
Al
Rep
oR
T 20
09 •
ReT
Ail
SeG
Men
T
Retail segment
In 2009, ORLEN Group carried out retail sales in Poland,
Germany, the Czech Republic and Lithuania. The enti-
ties responsible for managing commercial operations
on the respective markets were PKN ORLEN, ORLEN
Deutschland, Benzina and Ventus Nafta.
In the case of fuel, we reported high sales dynamics,
generated mainly by PKN ORLEN (7.3% growth) and
ORLEN Deutschland (2.2% growth). There was also
a slight improvement in the sales of non-fuel prod-
ucts in Poland (by 19.1%) and Germany (by 12.2%).
By the end of 2009, ORLEN Group managed 2,640
fuel stations which sold nearly 8.1 bn litres of fuel.
Approximately 40% of all facilities were Premium
fuel stations characterised by the highest service stan-
dard and offering the richest variety of fuel, non-fuel
products and food services. The Premium segment
fuel stations in Poland and Lithuania were operating
under the ORLEN brand, and in the Czech Republic
under the BENZINA Plus brand.
ORLEN Group’s economy fuel stations operate under
the following brands: BLISKA (Poland), Star, (Ger-
many) and BENZINA (the Czech Republic). Customers
at economy stations were offered fuel of verified quality
and basic products and services needed on the road.
Thanks to our attractive products and services offered
in Poland, the Czech Republic, Germany and Lithuania,
we managed to increase our retail market shares for
a consecutive year.
poland
2009 was a very successful year. Within 12 months,
the Company sold over 5.4 bn litres of petrol fuel
through its Polish retail network. Thanks to our con-
sistent development strategy, we managed to increase
the share our retail network in the Polish retail market
to 31.2%. Despite a significantly reduced level of capital
expenditure, our fuel sales in 2009 went up by 8.2%
at our own stations and by 26.3% at franchised sta-
tions. The result is due to our efforts to strengthen
the position of the ORLEN brand on the fuel stations
market as well as to increase sales dynamics at BLISKA
economy stations.
Share of ORLEN Group companies in local fuel retail markets in 2008–2009
2008 2009 dynamics
Poland * 29.5% 31.2% 1.7 p.p.
Germany ** 4.6% 4.7% 0.1 p.p.
The Czech Republic 13.7% 13.8% 0.1 p.p.
Litwa 3.6% 4.0% 0.4 p.p.
*Share in the retail market estimated on the basis of ARE consumption data.**Total sales (through all channels).

65
In 2009, we increased the number of Stop Cafes at our
Premium fuel stations, including Stop Cafe Bistros,
to a total of 467. The foodservice facilities are our
reaction to the changing habits of Polish drivers who
now tend to take short breaks in their journey at fuel
stations. We also implemented a new operating system
for our outlets, based on the SAP Retail system, which
will help us to more efficiently manage our outlets and
stock levels, and streamline the ordering procedure
and handling of supplies, and reduce financial and
accounting costs. With the new system, we will also
be able to apply innovative marketing techniques and,
last but not least, learn a lot about our customers and
their purchasing habits. We will use the knowledge
we acquire to develop our non-fuel offer further.
As at 31 December 2009, PKN ORLEN’s retail network
in Poland comprised of 1,747 fuel stations, of which
1,300 were own stations, 336 – franchise stations and
81 – affiliated stations , including stations functioning
under the brands of Petrochemia Płock and CPN.
In 2009, our enriched fuel, VERVA ON and VERVA
98, became increasingly popular among our custom-
ers. The share of the VERVA brand in total fuel sales
at Premium stations went up from 16.6% in 2008
to 17.6% in 2009.
Increased fuel sales effectiveness, extended non-fuel
offer and cost optimisation programmes implemented
at fuel stations all translated into very good financial
results in the retail segment in 2009. We plan to further
Number of ORLEN Group fuel stations in respective countries
in 2008–2009
2008 2009
Poland 1,803 1,747
Germany 509 521
The Czech Republic 334 337
Lithuania 35 35
Total 2,681 2,640
Number of fuel stations in Poland per brand in 2008–2009
2008 2009
Own stations 1,339 1,330
Franchised stations 318 336
Affiliated stations 146 81
Total 1,803 1,747
Number of fuel stations in Poland per brand in 2008–2009
2008 2009
ORLEN 924 940
BLISKA 406 424
Petrochemia Płock/CPN 473 383
Total 1,803 1,747
1 The Company has entirely resigned from sponsorship agreements in order to focus on the franchise sector. This means that the Petrochemia Płock and CPN brands will be gradually removed from the market.

66pkn
oR
len
An
nU
Al
Rep
oR
T 20
09 •
ReT
Ail
SeG
Men
T
develop our networks of our own and franchised sta-
tions over the coming years, focusing on the optimisa-
tion of operating expenses and improving customer
service standards.
In 2009, we released the total of 510,000 tonnes
of biocomponents and biofuels on the market, thus
complying with the 2009 National Indicator Goal
of 4.6% (our actual ratio was 4.62% of biocompo-
nent content in fuel). In the report period, we used
over 130,000 tonnes of bioethanol to produce petrol
and over 290,000 tonnes of ester in diesel fuel. Apart
from that, we increased the sales of Bioseter (being
fuel in itself) via our wholesale and retail networks
by appr. 50% (to over 90,000 tonnes). We gradually
improved the availability of Bioester to individual cus-
tomers, by introducing it on 324 of our BLISKA stations.
In 2009, we reported increased activity of the partici-
pants of the Vitay programme. The programme, covering
over 2.3 mn active customers, in 2009 was joined by
another 500,000 clients, and the number of collected
rewards much exceeded 1.5 mn. In the report period,
over 500,000 participants of the programme were of-
fered a new kind of personalised promotion printed
on Vitay receipts or texted on mobile phones.
In August 2009, we launched a new BiznesTank prog-
ramme dedicated to small and medium-sized enter-
prises. The BiznesTank programme is another of PKN’s
another card product, besides the FLOTA programme,
using microprocessor cards. BiznesTank cards have
a small chip which not only protects the data relating
to the customer’s company and fleet cars, but, more
importantly, reduces the time of customer handling
and invoicing at a fuel station. With a BiznesTank card,
our customers have access to au automatic transac-
tion handling on preferential conditions at appr. 1,300
of ORLEN and BLISKA stations across Poland. This saves
the time they would otherwise have to spend to buy
fuel. Currently, this is the most advanced discount card
on the Polish market, its advantages being the security
of transactions and reduced time of handling opera-
tions at fuel stations all over the country.
As in the previous years, the development and achieve-
ments of the FLOTA Programme in 2009 were noticed
and appreciated both by our customers and fleet market
experts in Poland. Our achievements in implementing
the FLOTA Programme are best proven by the follow-
ing awards:
• Fleet product of the Year (April 2009);
• Customer Laurel for the FLOTA Programme (December
2009) – Golden Label;
• Builder of the Polish Fleet Market (December 2009).
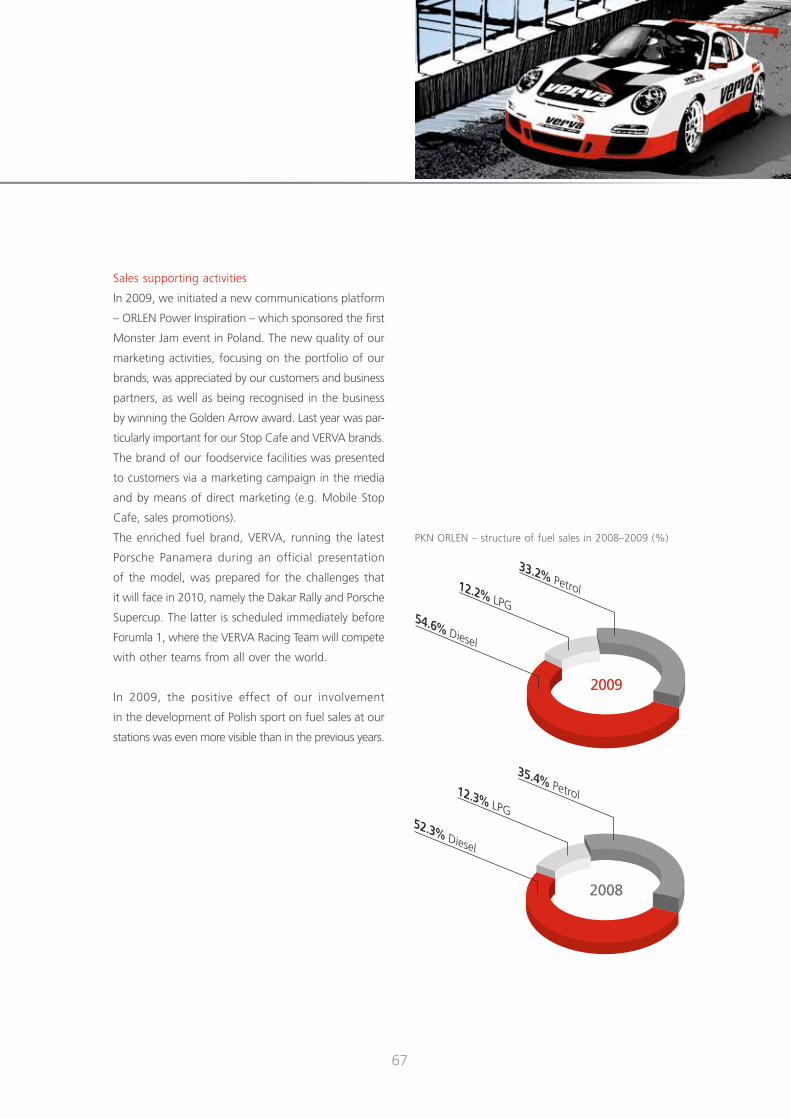
67
Sales supporting activities
In 2009, we initiated a new communications platform
– ORLEN Power Inspiration – which sponsored the first
Monster Jam event in Poland. The new quality of our
marketing activities, focusing on the portfolio of our
brands, was appreciated by our customers and business
partners, as well as being recognised in the business
by winning the Golden Arrow award. Last year was par-
ticularly important for our Stop Cafe and VERVA brands.
The brand of our foodservice facilities was presented
to customers via a marketing campaign in the media
and by means of direct marketing (e.g. Mobile Stop
Cafe, sales promotions).
The enriched fuel brand, VERVA, running the latest
Porsche Panamera during an official presentation
of the model, was prepared for the challenges that
it will face in 2010, namely the Dakar Rally and Porsche
Supercup. The latter is scheduled immediately before
Forumla 1, where the VERVA Racing Team will compete
with other teams from all over the world.
In 2009, the positive effect of our involvement
in the deve lopment of Polish sport on fuel sales at our
stations was even more visible than in the previous years.
PKN ORLEN – structure of fuel sales in 2008–2009 (%)
2009
33.2% Petrol12.2% LPG54.6% Diesel
2008
35.4% Petrol12.3% LPG52.3% Diesel

68pkn
oR
len
An
nU
Al
Rep
oR
T 20
09 •
ReT
Ail
SeG
Men
T
The Czech Republic
By the end of 2009, Benzina managed a network
of 337 Premium and Economy fuel stations. In 2009,
107 stations complied with the highest requirements
of the Premium BENZINA Plus brand offering a wide
range of services and non-fuel products. The Economy
segment, on the other hand, comprised of 230 fuel
stations. 325 stations operated in the CoDo formula
(Company-owned Dealer-operated) and the other 12 –
in the DoFo formula (Dealer-owned Franchise-operated).
* Data of the Ministry of Finance.
Despite poor macroeconomic conditions resulting
in nega tive market dynamics for retail fuel sales (-3.6%*),
Benzina managed to generate a record level of EBIT.
The rebranding process continued in 2009, the purpose
of which is to ensure a top quality service in the fuel
station network, performed to 90%, and the Company’s
one undeniable success, considering the challenges
it faced last year, was the 26% increase in revenue
generated by the foodservice facilities at fuel stations.
Demand for premium fuel was on the rise in 2009.
In 2007, Benzina launched premium VERVA 100 petrol
and in 2008, reacting to the growing demand, it offe-
red premium VERVA Diesel fuel. The sales of premium
fuel went up by 67.2% over the 12 months of 2009,
compared to 2008.
In 2009, the Company focused on improving the stand-
ards of its Premium and Economy stations, intensively
developing its fuel and non-fuel offer and making use
of synergy effects in its existing sub-brands. To meet
customer demands, the Company added VERVA Diesel
fuel to 29 of its “standard” BENZINA stations which
are in the process of being re-branded to the Premium
segment.
Benzina, in cooperation with PKN ORLEN, developed
and launched a new product, innovative on the Czech
fuel market, namely VERVA ON diesel with cetane
number 60, thus gaining huge advantage over the Com-
pany’s largest competitors. As a result of the measures
taken, VERVA ON diesel fuel sales doubled compared
to 2008. Another measure which supported fuel sales
was a promotional campaign called “Drive on brands”
(Ujíždějte na značkách), which additionally improved
Benzina – structure of fuel sales in 2008–2009 (%)
2008
45.1% Petrol0.1% LPG54.7% Diesel
2009
43.1% Petrol0.0% LPG56.9% Diesel

69
the perception of Benzina brand by associating it with
other prestigious brands involved in the campaign,
such as Rossignol or Diadora.
lithuania
By the end of 2009, ORLEN group operated a network
of 35 fuel stations in Lithuania, managed by Ventus
Nafta. Most of them (26) operated in the CoCo formula
(Company-owned Company-operated), and the other
nine – in the DoFo formula (Dealer-owned Franchise-
operated).
By the end of 2009, there were 23 fuel stations
in the Premium segment, operating under the ORLEN
Lietuva brand, characterized by a wide range of con-
venience products and foodservice facilities under
the Stop Cafe Bistro format, tailored to meet the needs
of the most demanding customers. The other 12 sta-
tions operated under the Ventus brand.
In 2009, the margin on non-fuel products and services
was over 23% lower than in the previous year. The fall
was mainly due to a new law which allows fuel stations
to sell alcoholic beverages only at daytime.
We minimised the negative effect of dropping fuel
and non-fuel sales on the level of margin by cost
optimisation both at fuel stations and in Ventus Nafta.
AB Ventus Nafta – structure of fuel sales in 2008–2009 (%)
2008
29.2% Petrol21.1% LPG49.8% Diesel
2009
31.2% Petrol23.0% LPG45.9% Diesel

70pkn
oR
len
An
nU
Al
Rep
oR
T 20
09 •
ReT
Ail
SeG
Men
T
Sponsoring activities
ORLEN Lietuva being the sponsor of the Lithuanian
natio nal team, Ventus Nafta organised a campaign
across the country called “Go Eagles” (Pirmyn Ereliai),
to stimulate the sales of VERVA fuel. In 2009, the share
of premium fuel in total fuel sales was over 17%.
In the summer of 2009, a promotional campaign was
organised together with the Mega shopping centre
(in Kaunas), aimed at the customers of Ventus Nafta
stations and the shopping centre, which, despite its limi-
ted geographic range, resulted in a 6% rise in the sales
in the entire network reported during the campaign.
In 2009, the Lithuanian retail fuel market suffered from
deteriorating macroeconomic indicators. The main rea-
sons for the shrinking of the market were the overall
economic slowdown (22% drop in retail sales compared
to 2008*) and recession in the transport, construction
and related industries which, in turn, resulted in lower
sales volumes generated by business customers.
The overall negative market trend was also reflected
in the performance of Ventus Nafta, which in 2009
reported a 5.6% fall in the volume of sales compared
to 2008, while the sales dynamics of Lithuania’s entire
retail fuel market was on the level of - 17.1%. Mean-
while, the sales of diesel fuel and LPG at the Com-
pany’s CoCo stations went up by 3.6% and 4.7%,
respectively, compared to the previous year, and Ventus
Nafta increased its market share to 4.1% (compared
to the 3.6% share in 2008).
In a ranking of “Lithuania’s top 500 enterprises” orga-
nised by Verslo Žinios, Ventus Nafta came in 69th place,
8 places higher than in 2008.
Germany
By the end of 2009, ORLEN Deutschland managed
a network of 521 petrol stations, including 4 under
the ORLEN brand, 485 under the STAR brand and 32
stations located at hypermarkets.
In 2009, the level of retail prices on the German market
was appr. 10% lower than in 2008. Given the lower
prices, customers were less willing to search for cheaper
fuel, however, despite that, ORLEN Deutschland man-
aged to generate good sales results. This proves that our
network is strengthening its position on the Economy
fuel station market.
This trend was only one of the factors that contrib-
uted to ORLEN Deutschland’s success last year aswell
as the record total sales volume of nearly 2 bn litres.
The surging fuel sales at STAR stations were mainly
due to the brand’s consistent positioning, large capital
expenditure, successful acquisition of individual facili-
ties and a large-scale marketing campaign supported
by sponsoring activities.
* According to the data of the Lithuanian Office of Statistics.

71
ORLEN Deutschland structure of fuel sales in 2008–2009 (%)
In 2009, ORLEN Deutschland thoroughly reconstructed
and modernised 3 of its fuel stations and rebranded
9 more stations. We continued the process of providing
fuel stations with new price pylons, which we installed
at 28 stations in 2009. In 2010, we plan to thoroughly
modernise 8 fuel stations, replace pylons at 40 stations
and fully rebrand 2 stations.
Sponsoring activities
In 2009, ORLEN Deutschland continued its cooperation
with three Bundesliga football teams: Hertha Berlin,
Hamburger SV and Bayer 04 Leverkusen. We will
continue our cooperation in 2010.
In 2001, ORLEN Deutschland will focus on a higher rec-
ognition for the STAR brand and on winning customer
trust. The objective is to increase the level of brand
recognition radically, compared to previous years.
2009
63.4% Petrol1.3% LPG35.3% Diesel
2008
64.8% Petrol0.8% LPG34.4% Diesel

BRAnd pRoTeCTion Before the ORLEN brand made its market debut in 2000, we had submitted the Company’s name, graphic symbol and logo as trade-marks to the Polish Patent Office and obtained relevant protection certificates according to Polish and international legislation. Currently, the ORLEN brand is a protected trademark on the EU market and in several countries across the world. Protection also cov-ers the various forms of corporate logo, the image of the ORLEN fuel stations and the names and logos of products and services owned by PKN ORLEN SA. In 2009, we had patent protection on more than 20 trademarks associated with the corporate the ORLEN brand, 20 advertising slogans developed for the purposes of the Company and over 130 product and service trademarks.

petrochemical segment
74pkn
oR
len
An
nU
Al
Rep
oR
T 20
09 •
peT
Ro
Ch
eMiC
Al
SeG
Men
T
petrochemical segment
In 2009, ORLEN Group’s petrochemical segment con-
sisted of selected units of the Petrochemical Production
Plant in Płock and the following companies: Basell
Orlen Polyolefins and Unipetrol RPA. We are the sole
manufacturer of olefins, polyolefins and most petro-
chemicals in Poland and the Czech Republic. The high
quality of our products and our efficient distribution
network make us one of the strongest market players
in this part of Europe.
petrochemicals(1)
In the first half of 2009, we still experienced the after-
math of the economic breakdown from the second half
of 2008. Demand for petrochemicals was significantly
limited as a result of the slowdown in the car and
construction industries.
The market situation was also reflected in the prices
of petrochemical products, which were quite low,
in particular in the 1st and 2nd quarters of 2009. Prices
started visibly growing by the end of the 2nd quarter
last year, which, combined with the limited demand,
especially for olefins and polyolefins, resulted in a lower
level of cracker utilisation across Europe. Also, stock
levels shrank in the entire supply chain.
ORLEN Group factories in Poland and the Czech Republic
manufactured over 930,000 tonnes of ethylene, which
is appr. 7% less than in 2008. The volume of propylene
production in the report period levelled 575,000 tonnes,
which is a 3% drop compared to the previous year.
The limited production volume of the two basic petro-
chemicals was mainly due to limited demand for those
products and optimisation of the operation of units
interlinked within the production chain.
Production volume of selected petrochemicals in PKN ORLEN in 2008–2009 (tonnes)
2008 2009 dynamics
Ethylene 539,866* 516,288 -4%Propylene** 356,079* 358,195 1%Butadiene 57,398 54,794 -5%Benzene 141,004* 117,540 -17%Toluene 127,436* 122,164 -4%Paraxylene 24,148 – -100%Phenol 43,763 33,108 -24%Acetone 27,796 21,052 -24%Glycols 87,464 68,709 -21%Cooling fluids 10,072 11,666 16%Solvents 10,486 7,021 -33%Sulphur 132,195 134,850 2%Ethylene oxide 12,409 17,689 43%
* Total produce for sale and own consumption.**Total propylene manufactured at the Production Plant in Płock.
1 Information on the sales of petrochemicals (non-fuel products) is also provided in the “Wholesale Segment” section of this Report.

75
Poland
The factor most strongly affecting the level of petro-
chemical production in 2009 was the major reduc-
tions in demand for products among manufacturers
of plastic products (polyethylene, polypropylene, PVC,
PET), synthetic rubber, ethoxylates (used in the produc-
tion of surface active agents) and polyols, TDI (used
in the production of polyurethanes), caprolactam,
Bisphenol A, phenolic resins, coolants, phthalic anhy-
dride and artificial fertilisers. Limited production was
also due to technical problems with the Olefin II unit
halfway through the year.
The key recipients of ethylene and propylene from
the Płock plants were fertiliser manufacturers, in par-
ticular ANWIL and Basell Orlen Polyolefins. Other pro-
ducts, apart from the local market, were sold mainly
to Denmark, Germany, Lithuania and the Czech Repu-
blic. In 2009, the total value of export sales from Płock
dropped by 34% compared to 2008.
Polyolefins were mainly imported to Poland from:
Germany, the Netherlands, Hungary and Slovakia.
Other petrochemicals were imported first of all from
Germany, Slovakia, the Czech Republic, Hungary, Bel-
gium, Belarus and Finland.
The paraxylene unit which had been shut off in the last
quarter of 2008 was out of operation throughout
the entire of 2009. By mid 2009, we also stopped
using an old and inefficient Ethylene Oxide I unit (TE I).
In 2010, we plan to increase ethylene oxide produc-
tion at the TE II installation, which is currently being
modernised, to such a level as to make up for the lost
Non–fuel sales by ORLEN Group in 2008–2009 (‘000 tonnes)
2008 2009Polish
companiesCzech
companiesLithuanian companies Total
Growth/fall
Polishcompanies
Czech companies
Lithuanian companies Total
Growth/fall
Heating oil III 961 146 1,798 2,905 29% 930 85 1,466 2,482 -15%P fractions 338 – – 338 13% 315 – – 315 -7%Sulphur 130 34 76 241 26% 135 31 70 236 -2%Rafinery 60 232 178 470 -23% 70 375 169 614 31%Ethylene – 153 – 153 -1% – 143 – 143 -6%Propylene 6 27 – 33 -32% 14 36 – 50 54%Benzene 95 179 – 274 -1% 83 182 – 265 -3%Glykols 88 – – 88 -14% 84 – – 84 -4%Toluene 103 – – 103 -14% 91 – – 91 -11%Paraxylene 25 – – 25 -22% 1 – – 1 -97%Orthoxylene 21 – – 21 -19% 21 – – 21 -1%Butadiene 55 – – 55 -7% 57 – – 57 2%C fractions – 211 – 211 24% – 168 – 168 -20%Polyolefins – 482 – 482 21% – 500 – 500 4%Ammonia – 195 – 195 11% – 234 – 234 20%OXO alcohols – 56 – 56 4% – 18 – 18 -68%Industrial oil – 21 – 21 -27% – 18 – 18 -12%Petrochemical 186 225 – 411 -6% 186 192 – 378 -8%Total nonfuel 2,069 1,960 2,052 6,080 12% 1,987 1,982 1,705 5,674 -7%

76pkn
oR
len
An
nU
Al
Rep
oR
T 20
09 •
peT
Ro
Ch
eMiC
Al
SeG
Men
T
production volume generated by the old unit. In 2010,
we also plan to start manufacturing paraxylene for
the production of PTA in the PX/PTA facility which
is currently under construction.
The Czech Republic
The situation on the Czech petrochemical market did
not differ from that on other European markets, both
in terms of limited demand and reduced price levels.
The agrochemical market witnessed high price fluctua-
tions and limited sales volumes due to the slowdown
in the fertiliser industry, which was particularly true
of the first half of the year.
The petrochemicals manufactured at Unipetrol RPA were
mainly allocated on the Czech market under long-term
contracts. The main recipients of the produce of Czech
plants were the following companies: Spolana, Synthos,
Agrobohemie and Deza. Despite lower overall sales
volume to Central Europe, recipients from countries
like Germany, Poland, Ukraine and Austria held very
important positions in our customer portfolio.
Polyolefins were imported to the Czech Republic mainly
from Germany, Ukraine and Russia.
Poland provided considerable amounts of polypro-
pylene. Other petrochemical products were imported
from: Germany, Russia, Slovakia, Hungary and Poland.
Limited production volume of base olefins – ethy-
lene and propylene – was due to not only negative
market factors but also to certain technical problems
at the Olefin unit in the first half of the year, combined
with an unplanned outage of the Polypropylene unit
in the second half of the year. Despite such hindrances,
the mechanical availability of those units was sufficient
to cover customer demands.
Production volume of selected petrochemicals in Unipetrol RPA in 2008–2009 (tonnes)
2008 2009 dynamics
Ethylene 464,727 416,094 -10%
Propylene 238,743 217,232 -9%
Benzene 179,381 181,666 1%
Carbamide 189,598 164,000 -14%
Ammonia 260,313 265,874 2%
Oxo alcohols 55,049 17,192 -69%
Sales of the main petrochemical products in 2009 (%)
ethylene propylene Benzene oxo Ammonia Carbamide hdpe pp
Domestic sales 84 60 97 51 96 49 25 57
Export 16 40 3 49 4 51 75 43
77
Production volume of polyolefins at BOP in 2008–2009 (‘000 tonnes)
2008 2009 dynamics
LDPE (Low Density Polyethylene) 102 92 -10%
HDPE (High Density Polyethylene) 251 242 -3%
PP (Polypropylene) 341 327 -4%
Sales volume of polyolefins at BOP in 2008–2009 (‘000 tonnes)
2008 2009 dynamics
HDPE 258.0 250.9 -3%
LDPE 106.8 91.3 -15%
PP 352.2 336.8 -4%
Total 717 679.0 -5%
plastic Materials
The total volume of polyolefins manufactured by ORLEN
Group in 2009 was only slightly lower than the 2008
figure.
In the report period, the production of polyethylene
at our plants in Poland and the Czech Republic totalled
appr. 607,000 tonnes, which was 6% less than in 2008.
Polypropylene production volume in 2009 amounted
to over 535,000 tonnes, which was appr. 2% less
than the figure generated by ORLEN group in 2008.
Poland
In total, the Basell Orlen Polyolefins (BOP) generated
over 30,000 tonnes of products less than in 2008.
The lower production volume both in the polyethylene
and polypropylene segment was due to limited demand
for plastics, mainly from car parts producers.
Over 37% of overall sales from Basell Orlen Polyolefins
were allocated on the Polish market. The rest was
distributed within the European supply chain of Lyon-
dellBasell. In 2009, the main international recipients
of the produce of the Płock plant were customers
from Germany, the Netherlands, France, Italy, Spain
and Hungary.
All of the Basell Orlen Polyolefins products are packed
and shipped from a modern Logistics Platform consist-
ing of 63 silos of 400 tonnes each, located in Płock
over an area of more than 95,000 m2.

78pkn
oR
len
An
nU
Al
Rep
oR
T 20
09 •
peT
Ro
Ch
eMiC
Al
SeG
Men
T
The Czech Republic
Unipetrol managed to deal with the crisis situation quite
well, reporting a 6% drop in the production of HDPE
and a 1% increase in the production of PP. HDPE sales
volume in 2009 was appr. 1% lower than in 2008.
In the Czech Republic, lower demand for polyolefins
was visible already in 2008. The slowdown was the most
evident in the foil and bottle segment, as well as that
of daily use plastic products. The deepening financial
crisis also resulted in a significantly reduced demand
from the automotive and construction sectors.
The key foreign recipients of polyethylene and polypro-
pylene manufactured in the Czech plants are German
companies.
investment
In 2009, the volume of exported HDPE was similar
to the 2008 figure, whereas in the case of PP, export
volume went up by as much as 36%.
The most important projects implemented in 2009
were the ongoing reconstruction of the PX (paraxylene)
unit and PTA (purified terephthalic acid) unit, which
started in 2007.
By the end of 2009, the progress of the PX project was:
• 92.5% of the basic unit – out of the assumed
97.2%.
Polyolefins production volume at Unipetrol in 2008–2009 (‘000 tonnes)
2008 2009 dynamics
HDPE 291.9 273.6 -6%
PP 205.7 208.6 1%
Total 497.6 482.2 -3%
Polyolefins sales volume at Unipetrol in 2008–2009 (‘000 tonnes)
2008 2009 dynamics
HDPE 288.5 285.8 -1%
PP 196.4 213.8 9%
Total 484.9 499.6 3%
79
The start-up of a unit providing raw material for the pro-
duction of purified terephthalic acid, with annual
capacity of 400,000 tonnes, is scheduled for 2010.
By the end of 2009, the progress of the PTA unit was:
• Overall project tasks: 84.2% of the projected 80.9%;
• Basic unit (ISBL and OSBL1): 85.8% of the projected
82.2%;
• Infrastructure (OSBL2): 70% of the projected 92%.
The unit, with an annual production capacity of 600,000
tonnes of acid, will be started up in the 2010 on an area
adjacent to the premises of ANWIL Włocławek.
In the Czech Republic, we continued a project aimed
at increasing the productivity of the polypropylene unit.
As planned, the unit’s production capacity in 2009
reached 285,000 per annum. We also completed
the renovation of the benzene extractive distillation unit,
as a result of which the product output rate in the 2nd
quarter of 2009 was 20% higher than in 2008.
UndeR The WinGSof The BRAnd Over the last ten years, the brand image has also been created by the ORLEN flagship marketing communication project, the ORLEN Rally Team, which represents both the Company and the country in the most important rally events organised in Poland and internation-ally. The team is particularly known for its participation in the extre-mely difficult Dakar Rally. Another project founded on the corporate brand is the ORLEN Athletics Team, which relies on the image of the contestants who succeeded during the 2009 World Championship in Athletics in Berlin. The Company also cooperates with the Polish Olympics Committee and has become the sponsor of Polish Olympic Representation. The ORLEN brand is also associated with the ORLEN Gift of the Heart Foundation, which takes care of Family Children’s Homes and provides financial and material help to natural persons, non-governmental organisations and institutions acting in the area of health protection, recreation and rehabilitation of the disabled.

Chemical segment

82pkn
oR
len
An
nU
Al
Rep
oR
T 20
09 •
Ch
eMiC
Al
SeG
Men
T
Chemical segment
In 2009, ORLEN Group’s chemical segment comprised
ANWIL in Włocławek and its subsidiary, Spolana, with
its offices in Neratowice, the Czech Republic (ANWIL
Group).
It was the third year of operational integration
of the Polish and Czech Companies. Previously, ANWIL
was the key ammonia supplier to Spolana. However,
due to the falling ammonia prices, especially in the 2nd
half of 2009, caused by the slowdown on the nitrog-
enous fertiliser market, recipients (including Spolana)
started looking for cheaper ammonia among producers
from eastern countries.
Finally, the slowdown situation on the caprolactam
market reversed late into the year, and we ended up
with a total production volume comparable to the 2008
figure. The volume of ammoniu m sulphate, a parallel
product generated in the production of caprolactam,
manufactured in Spolana, was also similar to the level
reported in the previous year.
The production volume of unprocessed PVC in Spolana
dropped by over 5%, to a level reflecting the actual
market demand. The over 21% reduction in the pro-
duction of sodium hydroxide at Spolana was due
to limited demand for the simultaneously generated
chlorine (used in the production of PVC) as well as for
sodium hydroxide itself.
Lower demand from the recipients of PVC, in particular
among the manufacturers of construction materials
(e.g. wires, window profiles and others) meant that
the production of processed PVC at the ANWIL plant
went down by over 22%. Meanwhile, the production
volume of unprocessed PVC went up by over 6%, mainly
due to more effective sales of the product on foreign
markets (including new markets in Asia). The over
3% increase in sodium hydroxide production volume
was due to a higher demand for the simultaneously
generated chlorine (used in the production of PVC).
nitrogenous fertilisers
The global financial crisis, which also affected the agri-
cultural sector, meant that the prices of most agricultural
products dropped, which in turn resulted in a reduced
purchasing capacity among farmers.
In 2009, as a result of the global financial crisis, Western
European countries reported a 70% drop in the sales
of nitro-chalk. Meanwhile, due to a slump in fertiliser
prices compared to the previous year (recorded all over
Europe), and the need for farmers to replenish annual
stocks of nitrogen as well as our active pro-market policy
(in particular in our core domestic market), we managed
to generate record sales in Poland in 2009.
ANWIL manufactured a smaller amount of fertilisers com-
pared to 2008 (over 890,000 tonnes). In the reported
period, the total volume of nitrogenous fertilisers
produced by other Polish manufacturers dropped
by 20%. The total volume of nitrogenous fertilisers
produced by the entire chemical segment amounted
to 1,068,000 tonnes.
In the 2008/2009 season, ORLEN Group’s chemical
segment covered nearly 19% of the Polish nitroge-
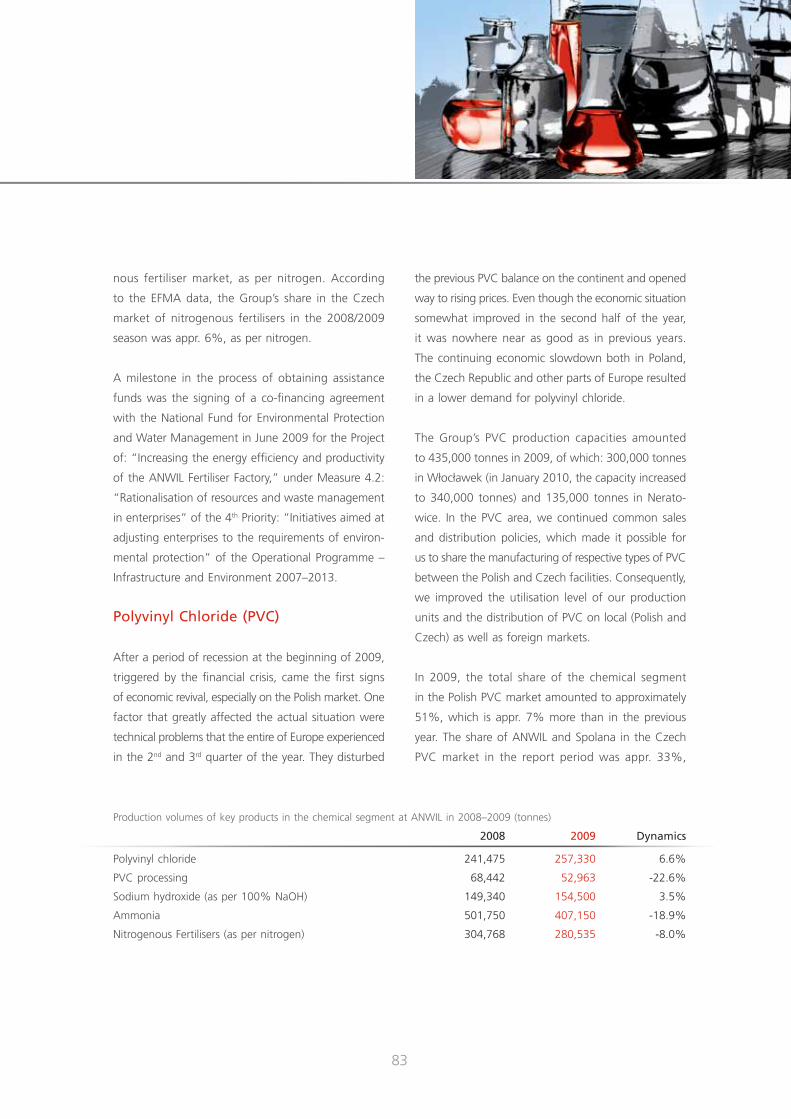
83
nous fertiliser market, as per nitrogen. According
to the EFMA data, the Group’s share in the Czech
market of nitro genous fertilisers in the 2008/2009
season was appr. 6%, as per nitrogen.
A milestone in the process of obtaining assistance
funds was the signing of a co-financing agreement
with the National Fund for Environmental Protection
and Water Management in June 2009 for the Project
of: “Increasing the energy efficiency and producti vity
of the ANWIL Fertiliser Factory,” under Measure 4.2:
“Rationalisation of resources and waste management
in enterprises” of the 4th Priority: “Initiatives aimed at
adjusting enterprises to the requirements of environ-
mental protection” of the Operational Programme –
Infrastructure and Environment 2007–2013.
polyvinyl Chloride (pvC)
After a period of recession at the beginning of 2009,
triggered by the financial crisis, came the first signs
of economic revival, especially on the Polish market. One
factor that greatly affected the actual situation were
technical problems that the entire of Europe experienced
in the 2nd and 3rd quarter of the year. They disturbed
the previous PVC balance on the continent and opened
way to rising prices. Even though the economic situ ation
somewhat improved in the second half of the year,
it was nowhere near as good as in previous years.
The continuing economic slowdown both in Poland,
the Czech Republic and other parts of Europe resulted
in a lower demand for polyvinyl chloride.
The Group’s PVC production capacities amounted
to 435,000 tonnes in 2009, of which: 300,000 tonnes
in Włocławek (in January 2010, the capacity increased
to 340,000 tonnes) and 135,000 tonnes in Nerato-
wice. In the PVC area, we continued common sales
and distribution policies, which made it possible for
us to share the manufacturing of respective types of PVC
between the Polish and Czech facilities. Consequently,
we improved the utilisation level of our production
units and the distribution of PVC on local (Polish and
Czech) as well as foreign markets.
In 2009, the total share of the chemical segment
in the Polish PVC market amounted to approximately
51%, which is appr. 7% more than in the previous
year. The share of ANWIL and Spolana in the Czech
PVC market in the report period was appr. 33%,
Production volumes of key products in the chemical segment at ANWIL in 2008–2009 (tonnes)
2008 2009 dynamics
Polyvinyl chloride 241,475 257,330 6.6%
PVC processing 68,442 52,963 -22.6%
Sodium hydroxide (as per 100% NaOH) 149,340 154,500 3.5%
Ammonia 501,750 407,150 -18.9%
Nitrogenous Fertilisers (as per nitrogen) 304,768 280,535 -8.0%
84pkn
oR
len
An
nU
Al
Rep
oR
T 20
09 •
Ch
eMiC
Al
SeG
Men
T
representing a more than doubled increase compared
to 2008. Meanwhile, the demand for unprocessed
PVC on both markets was over ten percent lower than
in the previous year.
The most important investment project in the PVC
area was the completion of ANWIL’s project to increase
the production capacities of the plant in Włocławek
to 340,000 tonnes. The improved unit was put in ope-
ration towards the end of 2009.
While looking for new possibilities of development,
we started the construction of a PTA unit in Włocławek.
More information on that project is available in the sec-
tion devoted to our petrochemical segment.
Production volumes of key products in the chemical segment at Spolana in 2008–2009 (tonnes)
2008 2009 dynamics
Polyvinyl chloride 124,033 117,239 -5.5%
Sodium hydroxide (as per 100% NaOH) 113,135 88,488 -21.8%
PVC processing 7,196 343 -95.2%
Caprolactam 37,572 38,801 3.3%
Ammonium sulphate (as per nitrogen) 36,580 36,906 0.9%
Another of ANWIL’s important projects was to continue
the construction of an oxygen generating unit which,
once it has replaced the current, long-used facility, will
provide for the increased demand of the Włocławek
plant as well as supplying oxygen to the PTA unit.
The project is progressing as planned.
Due to limited synergy between the area and PKN ORLEN’s
core business, we decided to release the capital employed
in the PVC and nitrogenous fertilisers, while at the same
time maintaining the role of a strategic supplier of raw
materials for the chemical industry.
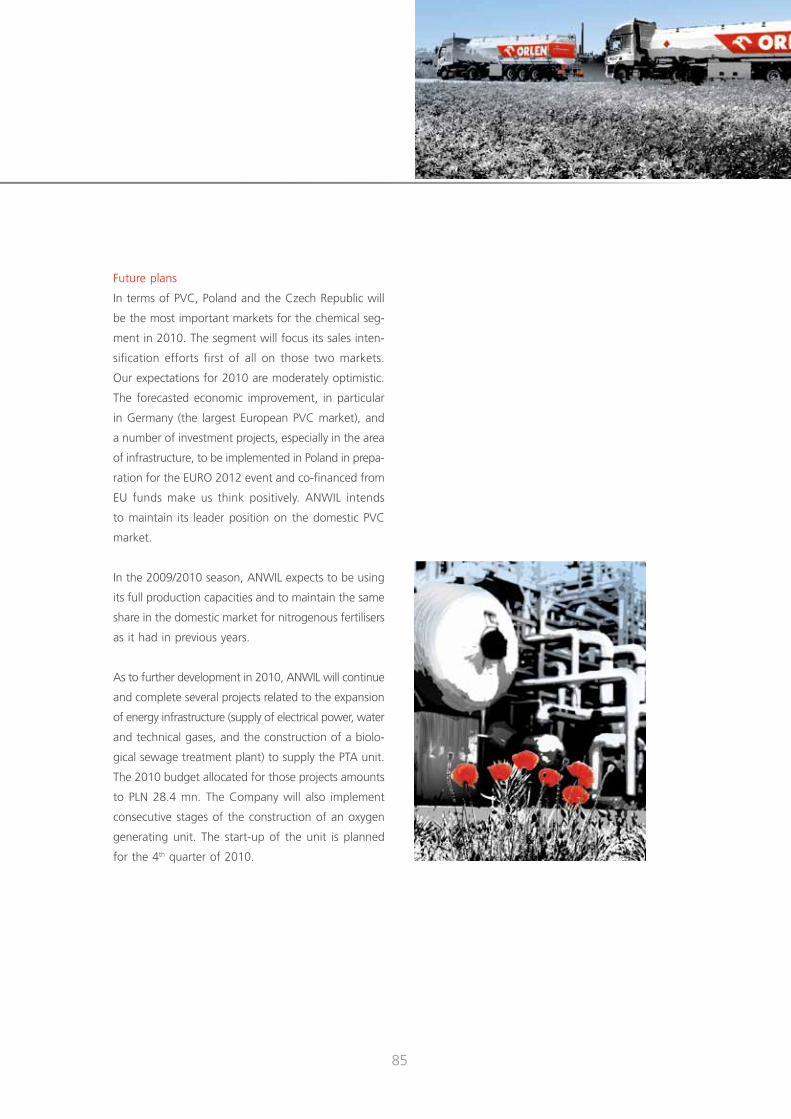
85
Future plans
In terms of PVC, Poland and the Czech Republic will
be the most important markets for the chemical seg-
ment in 2010. The segment will focus its sales inten-
sification efforts first of all on those two markets.
Our expectations for 2010 are moderately optimistic.
The forecasted economic improvement, in particular
in Germany (the largest European PVC market), and
a number of investment projects, especially in the area
of infrastructure, to be implemented in Poland in prepa-
ration for the EURO 2012 event and co-financed from
EU funds make us think positively. ANWIL intends
to maintain its leader position on the domestic PVC
market.
In the 2009/2010 season, ANWIL expects to be using
its full production capacities and to maintain the same
share in the domestic market for nitrogenous fertilisers
as it had in previous years.
As to further development in 2010, ANWIL will continue
and complete several projects related to the expansion
of energy infrastructure (supply of electrical power, water
and technical gases, and the construction of a biolo-
gical sewage treatment plant) to supply the PTA unit.
The 2010 budget allocated for those projects amounts
to PLN 28.4 mn. The Company will also implement
consecutive stages of the construction of an oxygen
generating unit. The start-up of the unit is planned
for the 4th quarter of 2010.
HAMBURG
PRAGA
P£OCK
MAZEIKIAI
oRlen Group The assumption of the corporate monolithic visual identity system was to standardise labelling in the Capital Group companies, thus enabling respective companies to build their market position using the corporate image and associating themselves with the potential of the largest Corporation in Central Europe. This is also a clear and straightforward message to our customers that they deal with the same economic organisation. The ORLEN brand is used by compa-nies that represent the Group’s core business and create added value by strengthening such competences of the corporate brand as: novelty, technological advancement, progress or innovativeness. Companies operating outside the Group’s core business and not supporting the corporate competences have the right to use the GRUPA ORLEN logo. In 2009, 28 companies used the ORLEN logo, under relevant license agreements, as an element of their name, and 7 other com-panies added the Grupa ORLEN name to their own logo.
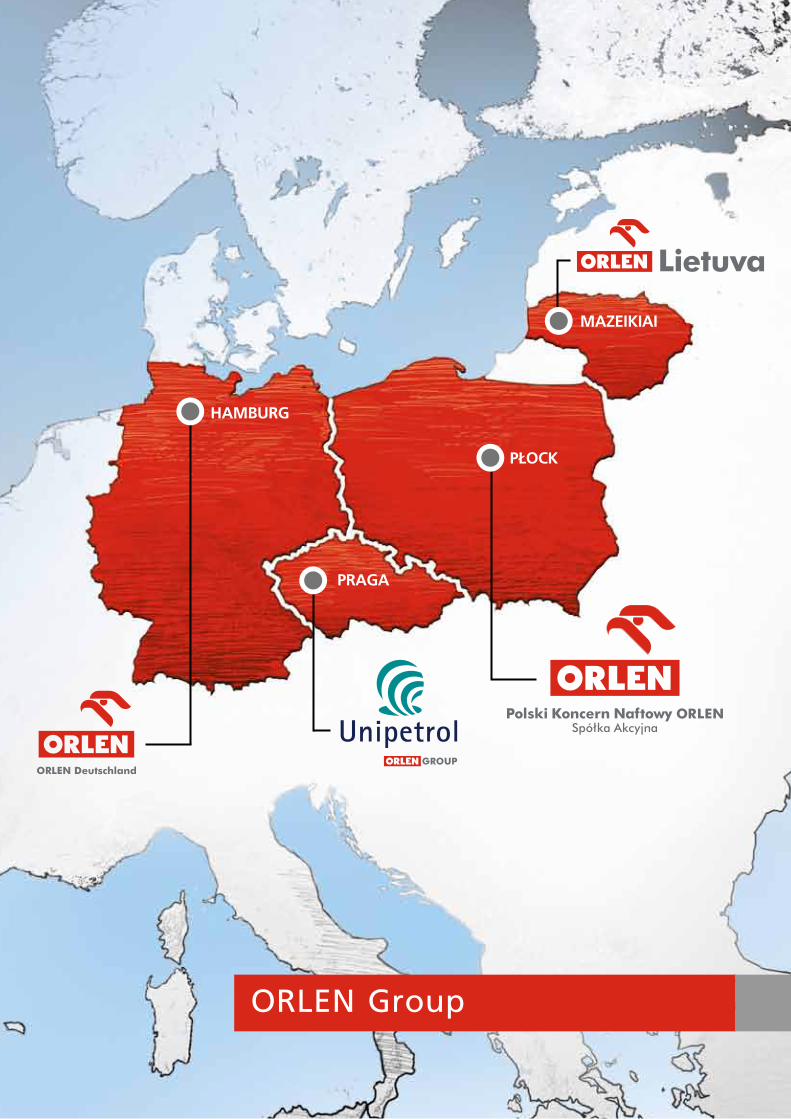
HAMBURG
PRAGA
P£OCK
MAZEIKIAI
oRlen Group

88pkn
oR
len
An
nU
Al
Rep
oR
T 20
09 •
oR
len
GR
oU
p
oRlen Group
We manage and supervise ORLEN Group Companies
via a number of divisions within PKN ORLEN and
several business units.
By the end of 2009, PKN ORLEN held stocks or shares
directly in 58 commercial companies, including:
• 34 subsidiaries (over 50% of shares);
• 2 co-related companies (over 50% of shares);
• 2 affiliated companies (between 20% and 50%
of shares);
• 20 minority companies (less than 20% of shares) and
companies in the process of liquidation or bankruptcy.
In 2009, our capital projects focused on streamlining
the ownership structure within the capital group and
divestment of non-core business.
In April 2009, PKN ORLEN bought from the Govern-
ment of the Lithuanian Republic (GLR) 9.98% shares
in Mažeikių Nafta. The transaction was performed
pursuant to a put option agreement made between
PKN ORLEN and RRL on 9 June 2006. Having agreed
on the specific terms of payment, PKN ORLEN bought
from the Lithuanian Repu blic Government 70,750,000
ordinary shares in Mažeikių Nafta, i.e. all the shares
offered in the put option. Accor ding to the put option
agreement, the strike price for the subject of the trans-
action was USD 284,450,375 (USD 4.0205 per share).
Having exercised the put option agreement, PKN ORLEN
obtained 100% shares in the share capital of Mažeikių
Nafta. On 1 September 2009, PKN ORLEN, the sole
shareholder of Mažeikių Nafta, changed the Comapny’s
name to ORLEN Lietuva.
The following divestment projects were implemented
in 2009, as part of a capital restructuring programme:
• selling 84.79% shares in ANWIL;
• selling 24.39% shares in Polkomtel.
According to the ORLEN Group strategy adopted to-
wards the end of 2008, in December 2008 we started
the divestment process of the 84.79% shares held
in ANWIL. Following an initial stage, we started con-
tacting potential investors in the second half of 2009.
Having signed a confidentiality agreement, potential
investors received an information memorandum. Prelimi-
nary offers to purchase ANWIL shares were submitted
in October 2009 and firm offers – in January 2010.
We will continue the sales process in 2010.
Meanwhile, PKN ORLEN set about selling its 24.39%
shares in Polkomtel. Here, the divestment project is two-
pronged. On the one hand, we are preparing to sell
shares through trade sale. However, we also considering
the option of selling shares through an initial public
offering (IPO). By the end of 2009, we also started
preparing for vendor due diligence (VDD) at Polkom-
tel. At the moment, we are finishing the preparation
of information packages for investors. We are also
consulting the principles of future corporate govern-
ance with Polkomtel’s other shareholders.
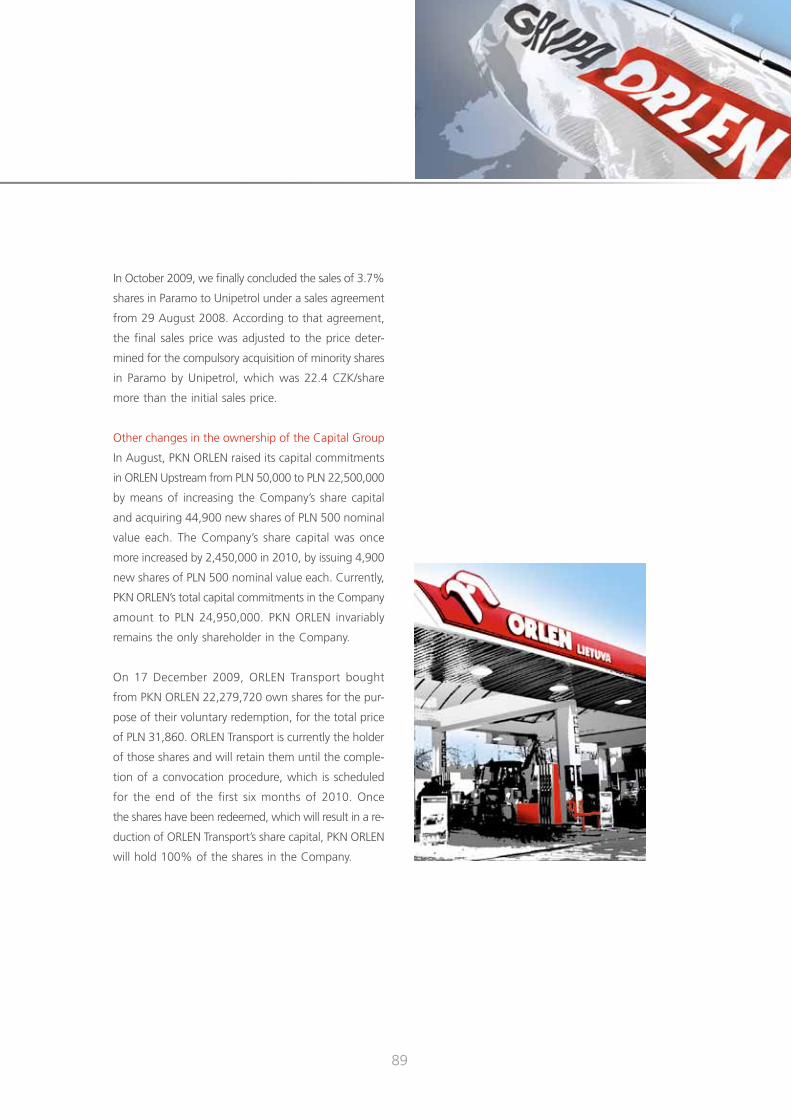
89
In October 2009, we finally concluded the sales of 3.7%
shares in Paramo to Unipetrol under a sales agreement
from 29 August 2008. According to that agreement,
the final sales price was adjusted to the price deter-
mined for the compulsory acquisition of minority shares
in Paramo by Unipetrol, which was 22.4 CZK/share
more than the initial sales price.
Other changes in the ownership of the Capital Group
In August, PKN ORLEN raised its capital commitments
in ORLEN Upstream from PLN 50,000 to PLN 22,500,000
by means of increasing the Company’s share capital
and acquiring 44,900 new shares of PLN 500 nominal
value each. The Company’s share capital was once
more increased by 2,450,000 in 2010, by issuing 4,900
new shares of PLN 500 nominal value each. Currently,
PKN ORLEN’s total capital commitments in the Company
amount to PLN 24,950,000. PKN ORLEN invariably
remains the only shareholder in the Company.
On 17 December 2009, ORLEN Transport bought
from PKN ORLEN 22,279,720 own shares for the pur-
pose of their voluntary redemption, for the total price
of PLN 31,860. ORLEN Transport is currently the holder
of those shares and will retain them until the comple-
tion of a convocation procedure, which is scheduled
for the end of the first six months of 2010. Once
the shares have been redeemed, which will result in a re-
duction of ORLEN Transport’s share capital, PKN ORLEN
will hold 100% of the shares in the Company.
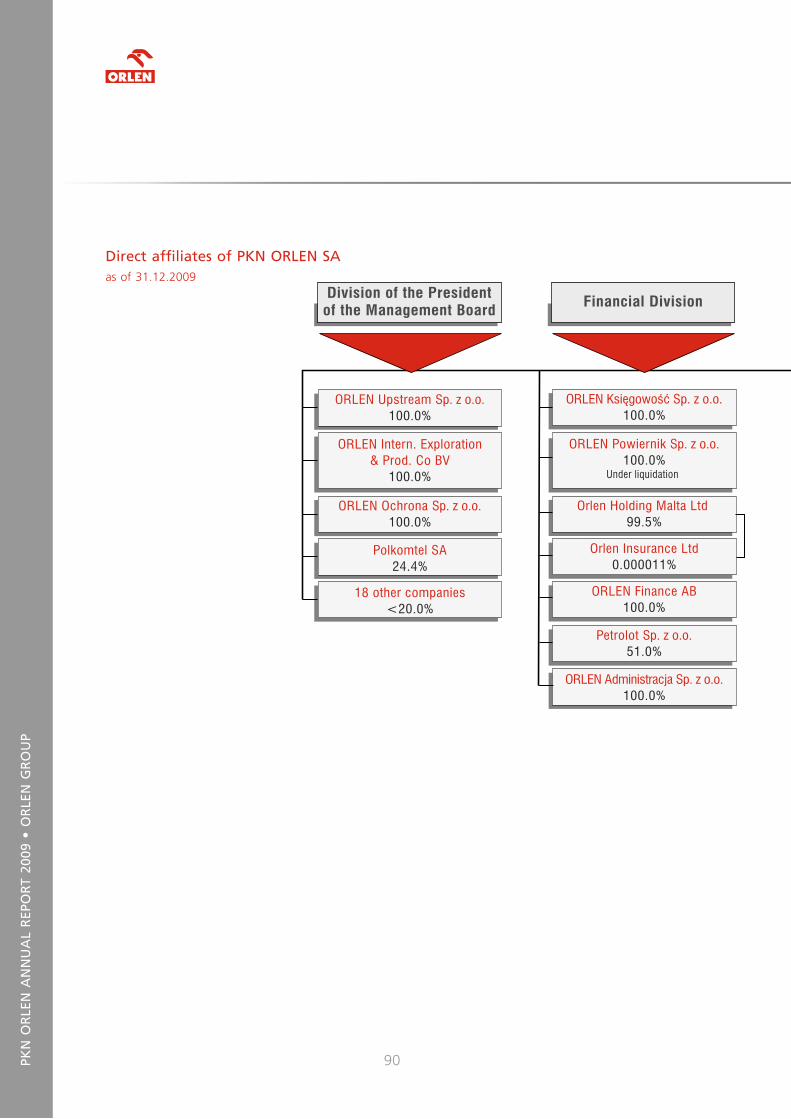
90pkn
oR
len
An
nU
Al
Rep
oR
T 20
09 •
oR
len
GR
oU
p
direct affiliates of pkn oRlen SAas of 31.12.2009
Chemiepetrol GmbH20.0%
Under liquidation
ORLEN Gaz Sp. z o.o.100.0%
ORLEN PetroCentrum Sp. z o.o.100.0%
ORLEN PetroTank Sp. z o.o.100.0%
SHIP – SERVICE SA60.9%
ORLEN Deutschland GmbH100.0%
ORLEN Budonaft Sp. z o.o.100.0%
ORLEN Centrum Serwisowe Sp. z o.o.
98.0%
Naftopor t Sp. z o.o.18.0%
IKS „Solino” SA70.5%
ORLEN KolTrans Sp. z o.o.99.9%
ORLEN Transpor t SA66.8%
ORLEN Transpor t Kraków Sp. z o.o.
98.39%Under bankruptcy
ORLEN Upstream Sp. z o.o.100.0%
ORLEN Intern. Exploration& Prod. Co BV
100.0%
ORLEN Ochrona Sp. z o.o.100.0%
Polkomtel SA24.4%
18 other companies<20.0%
ORLEN Księgowość Sp. z o.o.100.0%
ORLEN Powiernik Sp. z o.o.100.0%
Under liquidation
Orlen Holding Malta Ltd 99.5%
Orlen Insurance Ltd0.000011%
ORLEN Finance AB100.0%
Petrolot Sp. z o.o.51.0%
ORLEN Administracja Sp. z o.o.100.0%
ORLEN Oil Sp. z o.o.51.7%
ORLEN Lietuva SA90.02%
ORLEN Asfalt Sp. z o.o.82.5%
Rafineria Nafty Jedlicze SA75.0%
Rafineria Trzebinia SA77.2%
ORLEN Eko Sp. z o.o.100.0%
ORLEN Automatyka Sp. z o.o.52.4%
ORLEN Wir Sp. z o.o.51.0%
Basell Orlen Polyolefins Sp. z o.o.
50.0%
ANWIL SA84.8%
ORLEN Prewencja Sp. z o.o.100.0%
ORLEN Laboratorium Sp. z o.o.94.9%
ORLEN Projekt SA51.0%
Unipetrol a.s.63.0%
ORLEN Medica Sp. z o.o.100.0%
Płocki Park Przemysłowo-Technologiczny SA
50.0%
Division of the Presidentof the Management Board Financial Division Petrochemicals
Division Refinery Division Sales Division

91
Chemiepetrol GmbH20.0%
Under liquidation
ORLEN Gaz Sp. z o.o.100.0%
ORLEN PetroCentrum Sp. z o.o.100.0%
ORLEN PetroTank Sp. z o.o.100.0%
SHIP – SERVICE SA60.9%
ORLEN Deutschland GmbH100.0%
ORLEN Budonaft Sp. z o.o.100.0%
ORLEN Centrum Serwisowe Sp. z o.o.
98.0%
Naftopor t Sp. z o.o.18.0%
IKS „Solino” SA70.5%
ORLEN KolTrans Sp. z o.o.99.9%
ORLEN Transpor t SA66.8%
ORLEN Transpor t Kraków Sp. z o.o.
98.39%Under bankruptcy
ORLEN Upstream Sp. z o.o.100.0%
ORLEN Intern. Exploration& Prod. Co BV
100.0%
ORLEN Ochrona Sp. z o.o.100.0%
Polkomtel SA24.4%
18 other companies<20.0%
ORLEN Księgowość Sp. z o.o.100.0%
ORLEN Powiernik Sp. z o.o.100.0%
Under liquidation
Orlen Holding Malta Ltd 99.5%
Orlen Insurance Ltd0.000011%
ORLEN Finance AB100.0%
Petrolot Sp. z o.o.51.0%
ORLEN Administracja Sp. z o.o.100.0%
ORLEN Oil Sp. z o.o.51.7%
ORLEN Lietuva SA90.02%
ORLEN Asfalt Sp. z o.o.82.5%
Rafineria Nafty Jedlicze SA75.0%
Rafineria Trzebinia SA77.2%
ORLEN Eko Sp. z o.o.100.0%
ORLEN Automatyka Sp. z o.o.52.4%
ORLEN Wir Sp. z o.o.51.0%
Basell Orlen Polyolefins Sp. z o.o.
50.0%
ANWIL SA84.8%
ORLEN Prewencja Sp. z o.o.100.0%
ORLEN Laboratorium Sp. z o.o.94.9%
ORLEN Projekt SA51.0%
Unipetrol a.s.63.0%
ORLEN Medica Sp. z o.o.100.0%
Płocki Park Przemysłowo-Technologiczny SA
50.0%
Division of the Presidentof the Management Board Financial Division Petrochemicals
Division Refinery Division Sales Division

oRlen fUel STATionS VERVA is a next-generation brand of fuel enriched with a set of ad-ditives which ensure the dynamics and power of the engine, better acceleration, lower fuel consumption and, consequently, lower user costs. VERVA is the power that lets the driver feel the victory. VERVA brand was displayed on Porsche 911 GT3 during the Por-sche Supercup, held immediately before the Formula 1 events, where the VERVA Racing Team competes with teams from all over the world. Stop Cafe is a place to have a cup of good coffee and a tasty and healthy snack. The brand’s asset is its availability, which saves time for people on the road. The Stop Cafe brand, responding to the needs and lifestyles of current and potential customers, offers comfortable sitting space and quick service.

employees
94pkn
oR
len
An
nU
Al
Rep
oR
T 20
09 •
eM
plo
yee
S
employees
As at the end of 2009, ORLEN group employed 22,535
people, of which 4,482 worked for PKN ORLEN, 4,343
for Unipetrol Group, 115 for ORLEN Deutschland and
3,025 for ORLEN Lietuva Group.
64 employees from PKN ORLEN Logistics segment decid-
ed to leave under the Voluntary Retirement Programme.
The total of 252 employees participated in the Voluntary
Retirement and Early Retirement Programme.
pkn oRlen employment Structure
In 2009, the majority of PKN ORLEN personnel were
secondary school and university graduates (84.40%
of all employees), whereas most employees wor king
for Unipetrol Group had secondary vocational education
diplomas (40.41% of the workforce), and in ORLEN
Lietuva the largest employee group were primary school
and university graduates (65% of the total number
of employees).
In terms of age groups, in PKN ORLEN, the most
numerous were employees aged 31 to 40 (30.61%),
the same as in ORLEN Lietuva, where the share of that
age group was 33.62%, whereas in Unipetrol Group,
the largest group of employees were 41 to 50 years
old (33.72%).
Women represented 20.46% of PKN ORLEN’s work-
force in 2009, men being the remaining 79.54%.
In Unipetrol Group, a vast majority of employees
were men (74.45%), women representing 25.55%
of the personnel. ORLEN Lietuva, too, had most male
employees in 2009 (68.73%), the rest (31.27%) be-
ing women.
Corporate Collective labour Agreement
Following the signing of a Corporate Collective La-
bour Agreement (CCLA), a number of measures were
taken in 2009 to streamline the implementation of its
provisions.
Changes concerned in particular the were following:
• internal regulations and other documents related
to or based on the CCLA;
• implementation of the provisions of CCLA in indi-
vidual employment relationships;
• adjusting the HR computer system to the new recruit-
ment and remuneration procedures.
The following additional measures were simultaneously
taken to support the implementation of the CCLA:
communicating with the entire personnel of PKN ORLEN
and trainings dedicated to managerial personnel with
respect to employee evaluation and bonus systems.
1) In this context, ORLEN Group refers to the Company and its consolidated subsidiaries, excluding the affiliated entities.
95
Recruitment policy in pkn oRlen
In 2009, the main objectives of the Company’s recruit-
ment policy were to:
• ensure the continuity of business processes;
• implementation of the recruitment strategy in com-
pliance with current procedures and the principles
of corporate culture, corporate governance and
corporate social responsibility.
In 2009, the core recruitment processes in PKN ORLEN
were related to recruiting:
• managerial and operational personnel to work
at the new PTA (Purified Terephthalic Acid) Plant;
• operational personnel for the new PX (Paraxylene)
unit.
Student training
PKN ORLEN organises student training all year round
and in all areas of its business. Training is organised
either in corporate headquarters or in local units, in one
of the following forms:
• group training, organised in cooperation with schools/
universities;
• individual training;
• diploma training.
In 2009, the Training Programme was joined by
appr. 270 students of the following local schools and
universities:
• 114 of the Płock Branch of Warsaw University
of Technology (Faculty of Chemistry, Mechanics and
Economics);
• 115 students of the Zespół Szkół Centrum Edukacji
secondary school in Płock (specialty: Chemistry Tech-
nician)
• 15 students of Policealne Studium Zawodowe voca-
tional college in Płock (specialty: Chemistry Techni-
cian);
• 26 students of the Zespół Szkół Budowlanych nr 1
secondary construction school in Płock (specialty:
Environmental Protection Technician).
Moreover, we accepted 7 undergraduate students
of the Płock Branch of Warsaw University of Technology
to have their long-term diploma training at our facili-
ties. The costs of the latter training were covered from
the funds of the Human Capital Operational Programme
(European Social Fund) obtained by the University.
In October 2009, PKN ORLEN signed a cooperation
agreement with the Płock Branch of the Warsaw Univer-
sity Technology for another three years.
on-the-Job Training
PKN ORLEN has organised on-the-job training since
2002, in cooperation with Labour Offices across Poland,
in particular the Labour Offices in Płock, namely the local
Municipal Labour Office and Poviat Labour Office.
In 2009, on-the-job training was joined by 35 gradua tes
of whone attended secondary schools and universities.

96pkn
oR
len
An
nU
Al
Rep
oR
T 20
09 •
eM
plo
yee
S
employee Training
The purpose of PKN ORLEN’s employee training policy
in 2009 was to support business areas in achieving
their objectives by providing them with the necessary
know-how and practical skills. We trained a total
of 7,067 employees. The number includes employees
who participated in more than one training.
One of the most important projects completed in 2009
was the “Manager’s role in team management,”
a project which ended in the first quarter of 2009 and
whose purpose was to create new corporate culture
based on the provisions of the Corporate Collective
Labour Agreement, taking into account, in particular,
the role of the manager in the human capital manage-
ment process as well as in motivating, evaluating and
rewarding employees. The training was dedicated to all
team managers in PKN ORLEN, in order to acquaint
them with the innovative provisions of the CCLA.
In 2009, we completed the second edition of “PKN
ORLEN Project management Academy.” The purpose
of the project based on PMI standards was to give
participants practical and theoretical skills in project
management and to build a coherent project mana-
gement culture in the organisation by developing
a common methodology to be used in all projects
implemented by our employees.
We completed another project in 2009: “HR System
Development Programme – Stationary Training (LSO).”
The basic goal of the project was to automate the pro-
cess of training and participant registration, training
budget control, and training and trainer evaluation.
Awards
In 2009, PKN ORLEN took the 1st place in the “Friendli-
ness, Business, Industry” category of the 5th edition
of the KOMPAS Polish employer ranking. The BEST
Student Association awarded us the 3rd place in their
“Employer for Engineer” ranking. PKN ORLEN won
the title of the “Industry Leader: Fuel, Oil” in the “Uni-
versum Student Survey 2009”.
Management by objectives (MBo)
On 1 April 2009, PKN ORLEN changed the rules of its
employee bonus system. Now, the annual bonus system
covers only middle and senior managerial personnel.
Sales personnel and junior managerial staff are included
in a quarterly-annual bonus system, whereas specialists
and engineers – in a quarterly bonus system.
As at the end of 2009, the annual bonus system
covered 356 employees.
In ORLEN Group, the annual bonus system covers Mem-
bers of the Management Boards and other core perso-
nnel of the respective Companies. The main purpose
of the MBO-based annual bonus system is to support
the strategy of increasing ORLEN Group’s goodwill.
97
Social Benefits
PKN ORLEN provided the following social benefits:
co-financing of employee holidays, sanatorium treat-
ment, holidays for children, recreation and sports
activities, rehabilitation treatment and cultural and
educational activities, non-repayable financial or in-kind
aid, repayable housing loans and Christmas presents
for children. We provided a total of over 36 thousand
various benefits.
Remuneration policy in oRlen Group
In 2009, we standardised PKN ORLEN’s remunera-
tion policy by implementing the Corporate Collective
Labour Agreement. The new CCLA enables coherent
remuneration policies to be applied to respective job
positions. The process of equalising basic salary levels
for respective job levels will take five years.
The new bonus system introduced in the CCLA is more
motivating for employees. The respective systems: quar-
terly, quarterly-annual and annual, based on the existing
MBO system, make it possible to reward employees
for the good performance of their tasks.

AWARdS foR The BRAnd ORLEN is a brand that serves people in their daily life, accor ding to the corporate motto: “Always there when you need us”. The opi-nion poll conducted in 2009 showed 99% prompted awareness and 72% spontaneous awareness of the ORLEN brand. The ORLEN brand won the “High Reputation Brand” title in an Independent Polish Brand Reputation Ranking, “PremiumBrand 2009”. Brand reputa-tion is the main factor behind the decision to buy or use a specific product, thus the title won by ORLEN proves that the corporation is perceived as a reliable and responsible business partner. ORLEN was also awarded the Superbrands Polska title, which, too, confirms its strong position on the domestic market. Ever since 2002 (for the 8th time in succession in 2009), ORLEN brand fuel stations have won the Golden European Trusted Brands Logo in a consumer survey conducted across Europe by Reader’s Digest. Consumers value highly the standard of services and the competi-tive and broad range of fuels and non-fuel products offered at our stations. All those awards granted by economists, business people and consumers prove the high quality of the ORLEN brand.

environmental protection
100pkn
oR
len
An
nU
Al
Rep
oR
T 20
09 •
en
viR
on
Men
TAl
pRo
TeC
Tio
n
environmental protection
All initiatives taken by PKN ORLEN in 2009 aimed
at ensuring maximum environmental neutrality of our
production, storage and distribution processes.
Economically, 2009 was a difficult year, both on the global
and local scale. However, the macroeconomic situation
did not affect much the Company’s environmental activi-
ties. We implemented several environmental initiatives
and investment projects, the latter being the construc-
tion of, for example:
• Paraxylene unit;
• HON VII;
• II Hydrogen Production Plant;
• Claus II;
• Boiler no. K8 at the Combined Heat and Power
Plant.
In 2009, capital expenditure on tasks related to environ-
mental protection at ORLEN’s Production Plant in Płock
alone amounted to over PLN 191 mn. As a result
of those initiatives, we were obliged to change the inte-
grated permit for the units operating at PKN ORLEN
Production Plant.
In July 2009, we obtained a decision from the Marshal
of Mazowieckie Voivodeship which contained, among
others, the following modifications:
• the permit covered the new unit (which is was one
of the preconditions for their start-up);
• the planned increase in the volume of processed
crude oil to 16 mn Mg/year was approved;
• a mathematic model to monitor the noise level
produced by respective units, instead of the former
environmental measurement method, was approved;
• the permit was extended until 1 June 2015.
Apart from the changes in the integrated permit,
we had our permits for the Refinery and Combined
Heat and Power Plant to participate in the Community
CO2 emission allowances trading scheme modified
according to new legislation concerning the monitoring
of CO2 emission. A similar permit was for the first time
obtained for the petrochemical cracking unit Olefins
II. All the units covered by the system had their 2009
reports positively verified and did not exceed their
average annual allocations.
In 2009, we reported an appr. 0.5% drop in total
emissions to the atmosphere compared to the previ-
ous year, while the volume of processed oil went up
by over 2%. The drop in total emissions was accom-
panied by increased emissions of pollutants such as:
SO2, NOx and CO, while the emissions of hydrocarbon
and dust dropped.
The amount of water uptaken from the Vistula dropped
by 2.4%, as did the volume of sewage discharged
(by 8.3%) compared to the previous year. This was
possible thanks to an increased reuse of water.
We also reported a lower environmental impact
of the Płock Plant in terms of waste generation vo-
lume (-34%) and packaging released on the market
(-41% by weight).
In 2009, we completed the muting of selected sources
of high acoustic power, as declared in an applica-
tion for the integrated permit. The final stage was
the muting of air ventilators at the boilers of the Com-
bined Heat and Power Plant. As a result of the above
measures, as well as the new method of monitoring
101
the environmental impact, we were able to eliminate
cases of exceeding top noise levels in acoustically
protected areas.
We implemented several important environmental
projects at our fuel stations, too. Among others,
we intro duced a selective collection of batteries and
replaced throw-away plastic bags with environmentally-
friendly, reusable paper, oxy-biodegradable foil and
polypropylene bags. The bags were launched under
a new brand name: GO Eco.
Last year was also important for our Responsible Care
(RC) Programme. In 2009, we started implementing
the Framework Responsible Care Management System,
which supplements the existing safety management
systems, in the broad meaning of the term.
The “Catch the Hare” contest, organised by RC, is beco-
ming increasingly popular among our personnel, and
one of our employees won the competition last year.
Another undeniable success, though we did not directly
contribute to it, was the hatching of new falcon
nestlings on the Claus chimney nest box. This year,
we organised a “Name the Falcon” competition, and
the four younglings were called: Orleńka, Petronela,
Rafek and Naftek.
In 2009, the Płock Production Plant, namely the Moczary
reservoir, hosted a group of beavers. Though they help
the natural environment, their presence was a nuisance
for the Refinery.
Thus, we hired the only specialist team in Poland
to catch and remove the animals.
They caught 3 adult and 2 young beavers and trans-
ported them to the middle section of the Osetnica River.
Air protection
According to the control measurements carried out
by the Company and authorised auditing bodies
in 2009, the top emission limits set out in the Inte-
grated Permit were not exceeded by the refinery and
petrochemical facilities in Płock.
investment projects for environmental protection
Capital expenditure on projects related to environ-
mental protection at the Production Plant in Płock itself
amounted to over PLN 191 mn, which represented
9.24% of the total capital expenditure in Płock in 2009.
The most important initiatives aimed at reducing
the Plant’s impact on respective environmental com-
ponents included:
• construction of HON VII Unit and the accompanying
infrastructure;
• construction of Claus II Unit and the accompanying
infrastructure;
• muting the air ventilators at the CHP boilers.
We adjusted our fuel stations to the current environ-
mental legislation and we constantly modernise them
to improve their environmental safety.
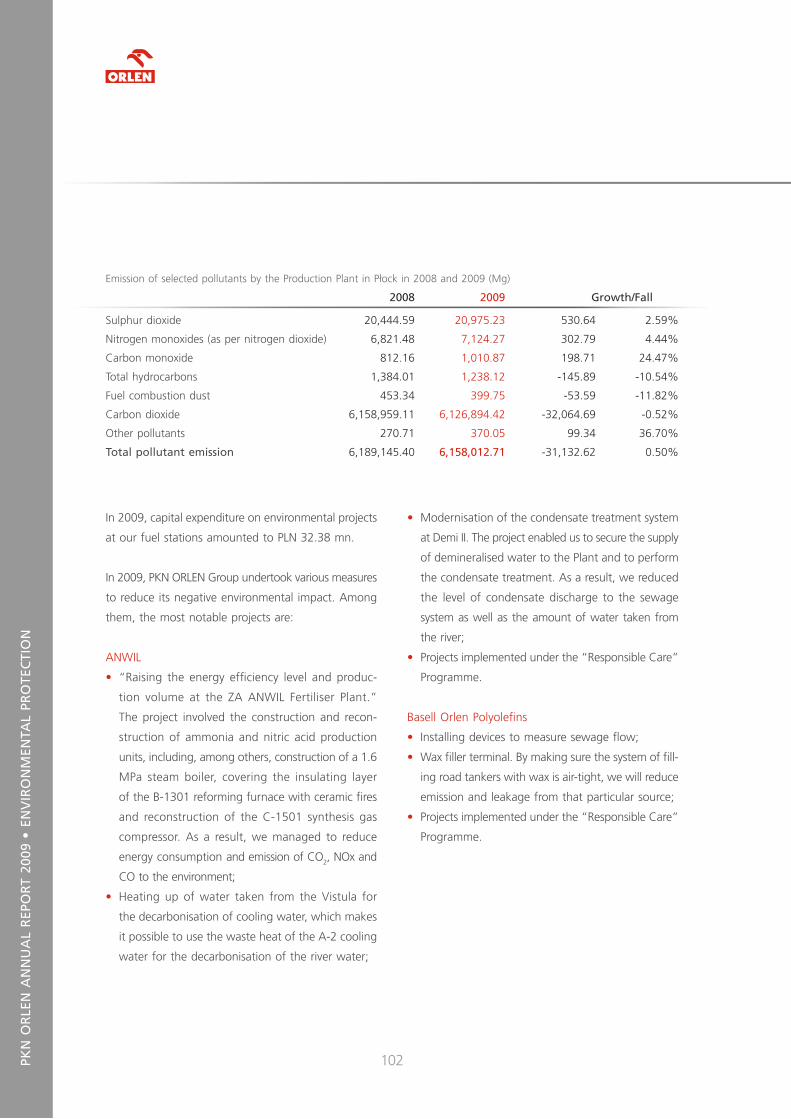
102pkn
oR
len
An
nU
Al
Rep
oR
T 20
09 •
en
viR
on
Men
TAl
pRo
TeC
Tio
n
In 2009, capital expenditure on environmental projects
at our fuel stations amounted to PLN 32.38 mn.
In 2009, PKN ORLEN Group undertook various measures
to reduce its negative environmental impact. Among
them, the most notable projects are:
ANWIL
• “Raising the energy efficiency level and produc-
tion volume at the ZA ANWIL Fertiliser Plant.”
The project involved the construction and recon-
struction of ammo nia and nitric acid production
units, including, among others, construction of a 1.6
MPa steam boiler, covering the insulating layer
of the B-1301 reforming furnace with ceramic fires
and reconstruction of the C-1501 synthesis gas
compressor. As a result, we managed to reduce
energy consumption and emission of CO2, NOx and
CO to the environment;
• Heating up of water taken from the Vistula for
the decarbonisation of cooling water, which makes
it possible to use the waste heat of the A-2 cooling
water for the decarbonisation of the river water;
Emission of selected pollutants by the Production Plant in Płock in 2008 and 2009 (Mg)
2008 2009 Growth/fall
Sulphur dioxide 20,444.59 20,975.23 530.64 2.59%
Nitrogen monoxides (as per nitrogen dioxide) 6,821.48 7,124.27 302.79 4.44%
Carbon monoxide 812.16 1,010.87 198.71 24.47%
Total hydrocarbons 1,384.01 1,238.12 -145.89 -10.54%
Fuel combustion dust 453.34 399.75 -53.59 -11.82%
Carbon dioxide 6,158,959.11 6,126,894.42 -32,064.69 -0.52%
Other pollutants 270.71 370.05 99.34 36.70%
Total pollutant emission 6,189,145.40 6,158,012.71 -31,132.62 0.50%
• Modernisation of the condensate treatment system
at Demi II. The project enabled us to secure the supply
of demineralised water to the Plant and to perform
the condensate treatment. As a result, we reduced
the level of condensate discharge to the sewage
system as well as the amount of water taken from
the river;
• Projects implemented under the “Responsible Care”
Programme.
Basell Orlen Polyolefins
• Installing devices to measure sewage flow;
• Wax filler terminal. By making sure the system of fill-
ing road tankers with wax is air-tight, we will reduce
emission and leakage from that particular source;
• Projects implemented under the “Responsible Care”
Programme.
103
Inowrocławskie Kopalnie Soli “SOLINO” – Salt Mines
in Inowrocław
• Certificate of Approval for the modernisation
of the sewage system at the Salt Mine and “Góra”
underground oil and fuel storage.
• Projects implemented under the “Responsible Care”
Programme.
ORLEN Asfalt
• Replacing insulation on oxidisers – renovation works.
The result is reduced heat emission to the atmos-
phere.
• Projects implemented under the “Responsible Care”
Programme.
ORLEN Centrum Serwisowe – servicing centre
• Modernisation of the boiler room. The result is redu-
ced heat medium and lower emission charges.
• Purchasing new vehicles according to the EURO 4
and EURO 5 standards. The result is lower emission
and emission charges.
ORLEN Eko
• The Company achieved the expected environmental
effect after a year of operating the new hazardous
waste thermal treatment unit;
• Extending hazardous waste storage space. As a result,
it is now possible to neutralise on the spot the waste
generated in the process of thermal treatment;
• Projects implemented under the “Responsible Care”
Programme.
ORLEN Gaz
• Construction of stormwater sewage system within
the LPG Sea Terminal in Szczecin. Effect – removing
stormwater from paved surface.
ORLEN Transport
• Leasing 20 EURO 5 class tractor units. The result
is reduced CO2 emission to the atmosphere.
Rafineria Nafty Jedlicze – refinery
• Adjusting storage tanks to current legislation.
Insta lling leak-proof platforms to secure soil from
the pene tration of crude oil products, securing
the interior of the tanks, installing a constant measu-
ring system to monitor the fill-up level of the tanks,
installing an anti-overflow system;
• Modernising the power generation system at the plant
– the environmental effect will be obtained by repla-
cing natural resources (natural gas, bituminous coal
and furnace oil) consumed by the CHP with by-
products (fuel) generated at Rafineria Nafty Jedlicze,
which will make heat production much more effective.

The MoST vAlUABle poliSh BRAnd The new brand was quickly accepted by consumers and for the last ten years, it has contributed to the growth of the company’s goodwill. Polski Koncern Naftowy ORLEN SA has become one of the best known and most recognisable companies in Central Europe, with its brand supporting its strong position on the local market and expansion into neighbouring countries. In 2009, the ORLEN brand was declared, for the third time in succession, the most valuable domestic brand. Our corporate brand came first in an independent MARQA ranking, organised under the auspices of Rzeczpospolita daily, and was valued at PLN 3,648.3 mn, i.e. 27% more than in 2008. Since 2000, ORLEN has also come on top of the “Top 100 com-panies” according to Rzeczpospolita daily and “Top 500 companies” according to Polityka weekly.
Auditor’s opinion
106PKN
OR
LEN
AN
NU
AL
REP
OR
T 20
09 •
OPI
NIO
N O
F TH
E IN
DEP
END
ENT
AU
DIT
OR
To the General Meeting of Polski Koncern Naftowy ORLEN Spó³ka Akcyjna
We have audited the accompanying consolidated -
nancial statements of Polski Koncern Naftowy ORLEN
Spó³ka Akcyjna Group seated in P³ock, 7 Chemików
Street (“PKN ORLEN SA Group”, “Group”), which
comprise the consolidated balance sheet as at 31 De-
cember 2008, with total assets and total liabilities
and equity of PLN 46,975,750 thousand, the consoli-
dated income statement for the year then ended with
a net loss of PLN 2,526,626 thousand, the consolidated
statement of changes in equity for the year then ended
with a decrease in equity of PLN 2,041,113 thousand,
the consolidated cash ow statement for the year
then ended with a decrease in cash amounting to PLN
155,624 thousand and notes to the consolidated nan-
cial statements, comprising a summary of signi cant
accounting policies and other explanatory notes.
Management’s Responsibility
Management of the parent entity is responsible for the
preparation and fair presentation of these consoli-
dated nancial statements in accordance with Inter-
national Financial Reporting Standards as adopted
by European Union and with other applicable regula-
tions. This responsibility includes: designing, imple-
menting and maintaining internal control relevant
to the preparation and fair presentation of consoli-
dated nancial statements that are free from material
misstatements, whether due to fraud or error; select-
ing and applying appropriate accounting policies;
Opinion of the Independent Auditor
and making accounting estimates that are reasonable
in the circumstances.
Auditor’s Responsibility
Our responsibility, based on our audit, is to express
an opinion on these consolidated nancial statements.
We conducted our audit in accordance with section 7
of the Accounting Act dated 29 September 1994
(Of cial Journal from 2002, No. 76, item 694 with
amendments) (“the Accounting Act”), the professional
standards established by the Polish National Coun-
cil of Certi ed Auditors and International Standards
on Auditing. Those standards require that we comply
with relevant ethical requirements and plan and per-
form the audit to obtain reasonable assurance whether
the nancial statements are free from material mis-
statement.
An audit involves performing procedures to obtain
audit evidence about the amounts and disclosures
in the nancial statements. The procedures selected
depend on our judgement, including the assessment
of the risks of material misstatement of the nancial
statements, whether due to fraud or error. In making
those risk assessments, we consider internal control
relevant to the entity’s preparation and fair presenta-
tion of the nancial statements in order to design audit
procedures that are appropriate in the circumstances,
but not for the purpose of expressing an opinion
on the effectiveness of the entity’s internal control.
An audit also includes evaluating the appropriateness
of accounting principles used and the reasonable-
ness of accounting estimates made by management,
106
107 PKN
OR
LEN
SA
CA
PITA
L G
RO
UP
as well as evaluating the overall presentation of the -
nancial statements.
We believe that the audit evidence we have obtained
is suf cient and appropriate to provide a basis for our
opinion.
Opinion
In our opinion, the accompanying consolidated nan-
cial statements of PKN ORLEN SA Group have been
prepared and present fairly in all material respects
the nancial position of the Group as at 31 Decem-
ber 2008 and of its nancial performance and its cash
ows for the year then ended, in accordance with In-
ternational Financial Reporting Standards as adopted
by the European Union, and are in compliance with
the respective regulations that apply to the consoli-
dated nancial statements, applicable to the Group.
Other Matters
As required under the Accounting Act we also report
that the Report on the Group’s operations includes,
in all material respects, the information required by
Art. 49 of the Accounting Act and by Minister of Fi-
nance Regulation dated 19 February 2009 on current
and periodic information provided by issuers of securi-
ties and the conditions for recognition as equivalent
information required by the law of a non-Member
State (Of cial Journal from 2009, No. 33, item 259)
and the information is consistent with the consoli-
dated nancial statements.
For KPMG Audyt Sp. z o.o.
ul. Ch³odna 51; 00-867 Warsaw
Certi ed Auditor No. 9451/7175
Certi ed Auditor No. 10268/7598
Monika Bartoszewicz
Leszek Dubicki,
Member of the Management Board
27 April 2009, Warsaw, Poland
107
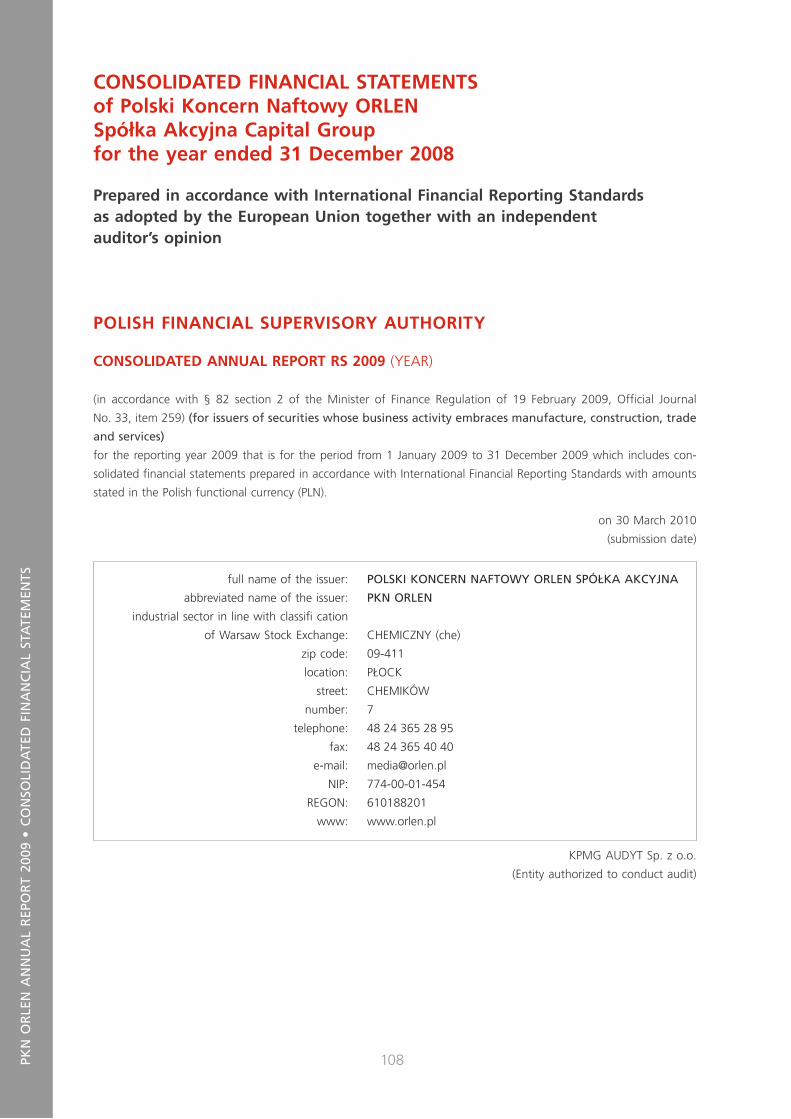
108
PKN
OR
LEN
AN
NU
AL
REP
OR
T 20
09 •
CO
NSO
LID
ATE
D F
INA
NC
IAL
STA
TEM
ENTS
POLISH FINANCIAL SUPERVISORY AUTHORITY
CONSOLIDATED ANNUAL REPORT RS 2009 (YEAR)
(in accordance with § 82 section 2 of the Minister of Finance Regulation of 19 February 2009, Of cial Journal
No. 33, item 259) (for issuers of securities whose business activity embraces manufacture, construction, trade
and services)
for the reporting year 2009 that is for the period from 1 January 2009 to 31 December 2009 which includes con-
solidated nancial statements prepared in accordance with International Financial Reporting Standards with amounts
stated in the Polish functional currency (PLN).
on 30 March 2010
(submission date)
KPMG AUDYT Sp. z o.o.
(Entity authorized to conduct audit)
full name of the issuer: POLSKI KONCERN NAFTOWY ORLEN SPÓ£KA AKCYJNA
abbreviated name of the issuer: PKN ORLEN
industrial sector in line with classi cation
of Warsaw Stock Exchange: CHEMICZNY (che)
zip code: 09-411
location: P£OCK
street: CHEMIKÓW
number: 7
telephone: 48 24 365 28 95
fax: 48 24 365 40 40
e-mail: [email protected]
NIP: 774-00-01-454
REGON: 610188201
www: www.orlen.pl
CONSOLIDATED FINANCIAL STATEMENTSof Polski Koncern Naftowy ORLENSpó³ka Akcyjna Capital Groupfor the year ended 31 December 2008
Prepared in accordance with International Financial Reporting Standards as adopted by the European Union together with an independent auditor’s opinion
108

109
PKN
OR
LEN
SA
CA
PITA
L G
RO
UP
SELECTED FINANCIAL DATA
PLN thousand EUR thousand
for the year for the year for the year for the year
31.12.2009 31.12.2008 31.12.2009 31.12.2008
I. Total sales revenues 67,927,990 79,533,225 15,649,447 18,323,095
II. Pro t/(Loss) from operations 1,097,076 (1,603,322) 252,748 (369,378)
III. Pro t/(Loss) before tax 1,440,652 (2,915,403) 331,902 (671,659)
IV. Net pro t/(loss) attributable to equity holders of the parent 1,308,521 (2,505,242) 301,461 (577,165)
V. Net pro t/(loss) 1,300,167 (2,526,626) 299,536 (582,091)
VI. Total comprehensive income attributable to equity holders of the parent 1,233,166 (1,419,748) 284,100 (327,086)
VII. Total comprehensive income 1,211,414 (1,137,168) 279,089 (261,984)
VIII. Net cash provided by operating activities 5,161,793 3,616,760 1,189,188 833,240
IX. Net cash (used in) investing activities (2,539,997) (4,384,957) (585,172) (1,010,219)
X. Net cash (used in)/ provided by nancing activities (1,021,584) 612,573 (235,355) 141,126
XI. Net change in cash and cash equivalents 1,600,212 (155,624) 368,661 (35,853)
XII. Net pro t and diluted net pro t per share attributable to equity holders of the parent (in PLN/EUR per share) 3.06 (5.86) 0.70 (1.35)
as at31.12.2009
as at31.12.2008
as at31.12.2009
as at31.12.2008
XIII. Non-current assets 29,727,329 29,280,856 7,236,096 7,127,417
XIV. Current assets 19,433,046 17,694,894 4,730,307 4,307,213
XV. Total assets 49,160,375 46,975,750 11,966,403 11,434,631
XVI. Long-term liabilities 13,242,204 4,634,178 3,223,359 1,128,031
XVII. Short-term liabilities 14,210,960 21,809,925 3,459,169 5,308,876
XVIII. Equity 21,707,211 20,531,647 5,283,874 4,997,723
XIX. Equity attributable to equity holders of the parent 19,037,903 17,813,091 4,634,123 4,335,984
XX. Share capital 1,057,635 1,057,635 257,445 257,445
XXI. Number of issued ordinary shares 427,709,061 427,709,061 427,709,061 427,709,061
XXII. Book value and diluted book value per share attributable to equity holders of the parent (in PLN/EUR per share) 44.51 41.65 10.83 10.14
The above data for 2009 and 2008 were translated into EUR by the following exchange rates:
• speci c items of assets, equity and liabilities – by the average exchange rate published by the National Bank of Poland
as of 31 December 2009 – 4.1082 PLN/EUR;
• speci c items of statement of comprehensive income and statement of cash ows – by the arithmetic average
of average exchange rates published by the National Bank of Poland as of every last day of month during the period
1 January – 31 December 2009– 4.3406 PLN/EUR.
109

PKN
OR
LEN
AN
NU
AL
REP
OR
T 20
09 •
CO
NSO
LID
ATE
D F
INA
NC
IAL
STA
TEM
ENTS
110
CONSOLIDATED STATEMENT OF FINANCIAL POSITIONPREPARED AS AT 31 DECEMBER 2009(all amounts in PLN thousand)(Translation of a document originally issued in Polish)
Noteas at
31.12.2009as at
31.12.2008
ASSETS
Non-current assets
Property, plant and equipment 6 27,070,437 26,268,757
Investment property 7 71,487 71,757
Intangible assets 8 690,376 644,681
Perpetual usufruct of land 9 96,043 99,247
Investments in associates 10 1,401,586 1,561,132
Deferred tax assets 29 290,820 485,362
Financial assets available for sale 10 59,633 62,174
Non-current loans and receivables 11 46,947 87,746
Current assets 29,727,329 29,280,856
Current assets
Inventory 13 10,619,859 9,089,047
Trade and other receivables 14 5,417,486 6,356,174
Short-term nancial assets 15 181,005 257,832
Income tax receivable 34,032 392,042
Prepayments 207,447 204,088
Cash and cash equivalents 16 2,941,039 1,344,224
Non-current assets classi ed as held for sale 17 32,178 51,487
19,433,046 17,694,894
Total assets 49,160,375 46,975,750
LIABILITIES AND SHAREHOLDERS’ EQUITY
Equity 18
Share capital 18.2 1,057,635 1,057,635
Share premium 18.3 1,227,253 1,227,253
Hedging reserve 14,849 (99,793)
Foreign exchange differences on subsidiaries from consolidation (266,789) (76,792)
Retained earnings 17,004,955 15,704,788
Total equity attributable to equity holders of the parent 19,037,903 17,813,091
Non-controlling interest 18.4 2,669,308 2,718,556
TOTAL EQUITY 21,707,211 20,531,647
LIABILITIES
Long-term liabilities
Interest-bearing loans and borrowings 19 11,610,532 2,610,651
Provisions 20 661,921 747,287
Deferred tax liabilities 29 836,330 1,134,686
Other long-term liabilities 21 133,421 141,554
13,242,204 4,634,178
110

PKN
OR
LEN
SA
CA
PITA
L G
RO
UP
111
Noteas at
31.12.2009as at
31.12.2008
Short-term liabilities
Trade and other liabilities 22 11,494,542 8,377,167
Interest-bearing loans and borrowings 19 1,593,695 11,282,114
Income tax liability 24,169 35,454
Provisions 20 847,117 753,060
Deferred income 23 133,963 149,521
Other nancial liabilities 24 117,474 1,212,609
14,210,960 21,809,925
Total liabilities 27,453,164 26,444,103
Total liabilities and shareholders’ equity 49,160,375 46,975,750
111

PKN
OR
LEN
AN
NU
AL
REP
OR
T 20
09 •
CO
NSO
LID
ATE
D F
INA
NC
IAL
STA
TEM
ENTS
112
CONSOLIDATED STATEMENT OF COMPREHENSIVE INCOMEFOR THE YEAR ENDED 31 DECEMBER 2009(all amounts in PLN thousand)(Translation of a document originally issued in Polish)
Notefor the year ended
31.12.2009for the year ended
31.12.2008
Sales revenues 25 67,927,990 79,533,225
Cost of sales 26 (61,848,701) (73,999,322)
Gross pro t on sales 6,079,289 5,533,903
Distribution expenses (3,507,700) (3,323,721)
General and administrative expenses (1,504,707) (1,462,477)
Other operating revenues 27 1,263,759 747,930
Other operating expenses 27 (1,233,565) (3,098,957)
Pro t/(Loss) from operations 1,097,076 (1,603,322)
Financial revenues 1,094,275 702,800
Financial expenses (1,023,074) (2,281,414)
Financial revenues and expenses 28 71,201 (1,578,614)
Share in pro t from investments accounted for under equity method 272,375 266,533
Pro t/(Loss) before tax 1,440,652 (2,915,403)
Income tax expenses 29 (140,485) 388,777
Net pro t/(loss) 1,300,167 (2,526,626)
Items of comprehensive income:
Hedging instruments valuation (4,491) (120,954)
Hedging instruments settlement 146,024 (108,125)
Foreign exchange differences on consolidation (203,395) 1,572,553
Deferred tax on other comprehensive income (26,891) 45,984
Total items of other comprehensive income (88,753) 1,389,458
Total comprehensive income 1,211,414 (1,137,168)
Net pro t/(loss) attributable to:
equity holders of the parent 1,308,521 (2,505,242)
non-controlling interest (8,354) (21,384)
1,300,167 (2,526,626)
Total comprehensive income attributable to:
equity holders of the parent 1,233,166 (1,419,748)
non-controlling interest (21,752) 282,580
1,211,414 (1,137,168)
Net pro t/(loss) and diluted net pro t/(loss) per share attributable to equity holders of the parent (in PLN per share) 3.06 (5.86)
112

PKN
OR
LEN
SA
CA
PITA
L G
RO
UP
113
CONSOLIDATED STATEMENT OF CASH FLOWSFOR THE YEAR ENDED 31 DECEMBER 2009(all amounts in PLN thousand)(Translation of a document originally issued in Polish)
Notefor the year ended31 december 2009
for the year ended31 december 2008
Cash ows-operating activities
Net pro t/(loss) 1,300,167 (2,526,626)
Adjustments for:
Share in pro t from investments accounted for under equity method (272,375) (266,533)
Depreciation and amortisation 26 2,567,646 2,491,383
Foreign exchange (gains )/losses (122,715) 731,385
Interest and dividend, net 383,602 533,187
(Pro t)/Loss on investing activities (714,716) 2,310,714
Change in receivables 30 656,332 986,782
Change in inventories 30 (1,662,679) 1,778,832
Change in liabilities 30 2,820,956 (1,409,397)
Change in provisions 30 (2,086) (21,945)
Income tax expense 29 140,485 (388,777)
Income tax received / (paid) 19,255 (594,971)
Other adjustments 47,921 (7,274)
Net cash provided by operating activities 5,161,793 3,616,760
Cash ows-investing activities
Acquisition of property, plant and equipment and intangible assets (2,670,628) (3,969,409)
Disposal of property, plant and equipment and intangible assets 827,802 125,478
Disposal of shares 1,354 199,654
Acquisition of shares (1,019,488) (736,860)
Interest and dividend received 423,922 199,269
Loans granted (83,023) (2,732)
Proceeds from repayment of loans 7,375 5,072
Dividends paid to non-controlling interest (13,382) (185,858)
Other (13,929) (19,571)
Net cash (used in) investing activities (2,539,997) (4,384,957)
Cash ows- nancing activities
Proceeds from loans and borrowings 11,192,817 10,962,933
Debt securities is sued – 479,172
Repayment of loans and borrowings (11,461,010) (8,714,481)
Redemption of debt securities – (825,498)
Interest paid (666,133) (563,576)
Dividends paid – (692,888)
Payment of liabilities under nance lease agreements (80,384) (35,682)
Other (6,874) 2,593
Net cash (used in)/ provided by nancing activities (1,021,584) 612,573
Net change in cash and cash equivalents 1,600,212 (155,624)
Effect of exchange rate changes (3,397) 1,616
113
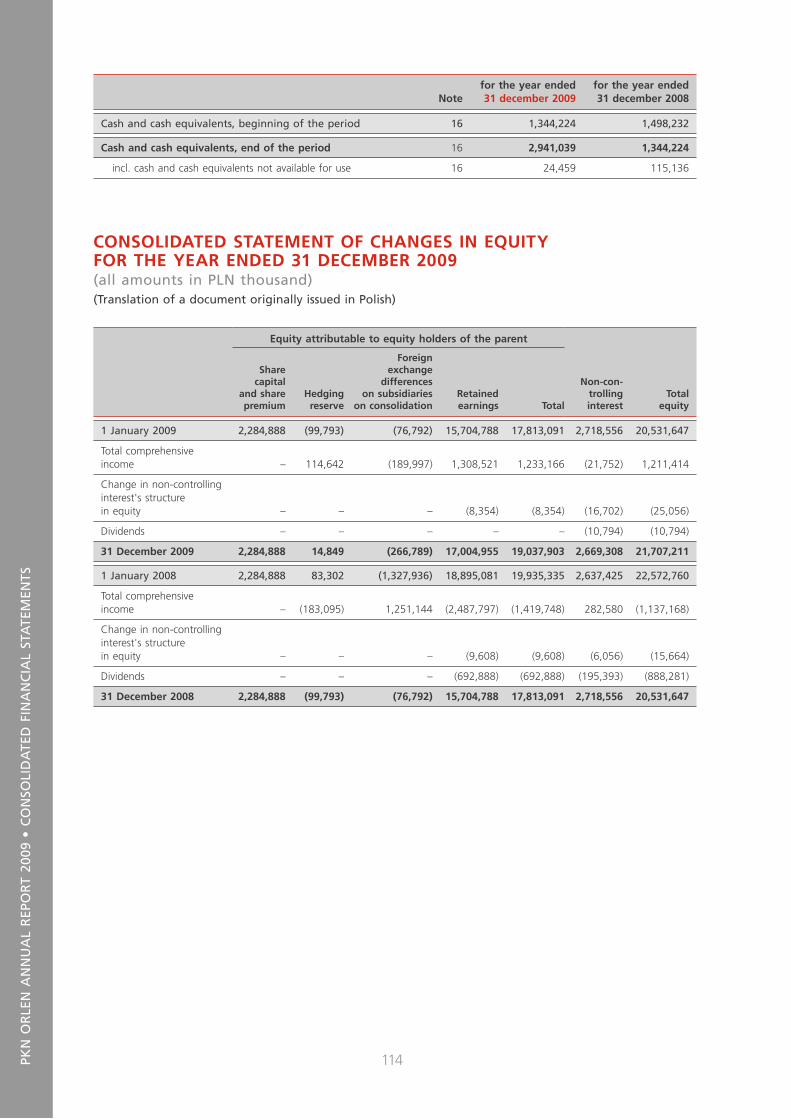
PKN
OR
LEN
AN
NU
AL
REP
OR
T 20
09 •
CO
NSO
LID
ATE
D F
INA
NC
IAL
STA
TEM
ENTS
114
Notefor the year ended31 december 2009
for the year ended31 december 2008
Cash and cash equivalents, beginning of the period 16 1,344,224 1,498,232
Cash and cash equivalents, end of the period 16 2,941,039 1,344,224
incl. cash and cash equivalents not available for use 16 24,459 115,136
CONSOLIDATED STATEMENT OF CHANGES IN EQUITYFOR THE YEAR ENDED 31 DECEMBER 2009(all amounts in PLN thousand)(Translation of a document originally issued in Polish)
Equity attributable to equity holders of the parent
Non-con-trolling interest
Totalequity
Share capital
and share premium
Hedging reserve
Foreign exchange
differences on subsidiaries
on consolidationRetained earnings Total
1 January 2009 2,284,888 (99,793) (76,792) 15,704,788 17,813,091 2,718,556 20,531,647
Total comprehensive income – 114,642 (189,997) 1,308,521 1,233,166 (21,752) 1,211,414
Change in non-controlling interest's structure in equity – – – (8,354) (8,354) (16,702) (25,056)
Dividends – – – – – (10,794) (10,794)
31 December 2009 2,284,888 14,849 (266,789) 17,004,955 19,037,903 2,669,308 21,707,211
1 January 2008 2,284,888 83,302 (1,327,936) 18,895,081 19,935,335 2,637,425 22,572,760
Total comprehensive income – (183,095) 1,251,144 (2,487,797) (1,419,748) 282,580 (1,137,168)
Change in non-controlling interest's structure in equity – – – (9,608) (9,608) (6,056) (15,664)
Dividends – – – (692,888) (692,888) (195,393) (888,281)
31 December 2008 2,284,888 (99,793) (76,792) 15,704,788 17,813,091 2,718,556 20,531,647
114

PKN
OR
LEN
SA
CA
PITA
L G
RO
UP
Exp
lan
ato
ry n
ote
s to
co
nso
lidat
ed
nan
cial
sta
tem
ents
fo
r th
e ye
ar e
nd
ed 3
1 d
ecem
ber
200
9 (a
ll am
ou
nts
in
PLN
th
ou
san
d)
115
EXPLANATORY NOTES TO CONSOLIDATED FINANCIAL STATEMENTSFOR THE YEAR ENDED 31 DECEMBER 2009(all amounts in PLN thousand)(Translation of a document originally issued in Polish)
1. GENERAL INFORMATION
1.1. Principal activity of the Group, composition of the Management Board and the Supervisory Board of the Parent
The Parent Company of Polski Koncern Naftowy ORLEN Capital Group (“Group”, “Capital Group”) is Polski Koncern
Naftowy ORLEN SA (“Company”, ”PKN ORLEN”, “Parent”, “Issuer”) seated in P³ock, 7 Chemików Street.
According to the Articles of Association established by the resolution of the Supervisory Board of PKN ORLEN SA dated
22 September 2009, with changes adopted by the Annual General Meeting of PKN ORLEN SA dated 15 July 2009,
registered in the commercial register based on the decision of the District Court for the capital city Warsaw Commercial
Department of the National Court Register dated 22 September 2009 ref. act 16333/09/929, activity of PKN ORLEN SA
includes among others:
• Processing of crude oil and manufacturing of oil-derivative products and semi nished products (re nery and petro-
chemical);
• Domestic and foreign trade on own account, on a commission and as a consignee, including in particular: the trade
in crude oil, oil-derivative and other fuel, sale of motor vehicles, parts and accessories for motor vehicles, sale of in-
dustrial and consumer goods;
• Research and development activity, project work, construction and production activities on own account and as a con-
signee, in the areas of processing, storage, packaging and trade in solid, liquid and gaseous oil fuels, derivative
chemical products as well as transportation: road, rail, water and by pipeline;
• Storage of crude oil and liquid fuels, creation and management of oil stock in accordance with appropriate regula-
tions;
• Services connected to the principal activity, in particular: sea and land reloading, re ning of gas and oil including
ethylization, dyeing and blending of components;
• Purchase, trade and processing of used lubricant oils and other chemical waste;
• Manufacturing, transportation and trade in heating energy and electricity;
• Overhaul of appliances used in principle activities, especially re nery and petrochemical installations, oil storage ap-
pliances, petrol stations and means of transportation;
• Operation of petrol stations, bars, restaurants and hotels as well as catering activities;
• Activities of nance holdings;
• Brokerage activities and other nancial activities, except for insurance and pension funds;
• Crude oil exploration and extraction;
• Natural gas exploration and extraction;
• Manufacture of basic chemicals, fertilizers and nitrogen compounds, plastics and synthetic rubber in primary forms;
• Services to the entire society, medical services, re protection, education;
• Manufacture of steel products, precious metals, metal molding, repair and maintenance of fabricated metal products.
Additionally the Capital Group consists of the companies located in different countries, operating mainly in re nery,
petrochemical and chemical sector.
115
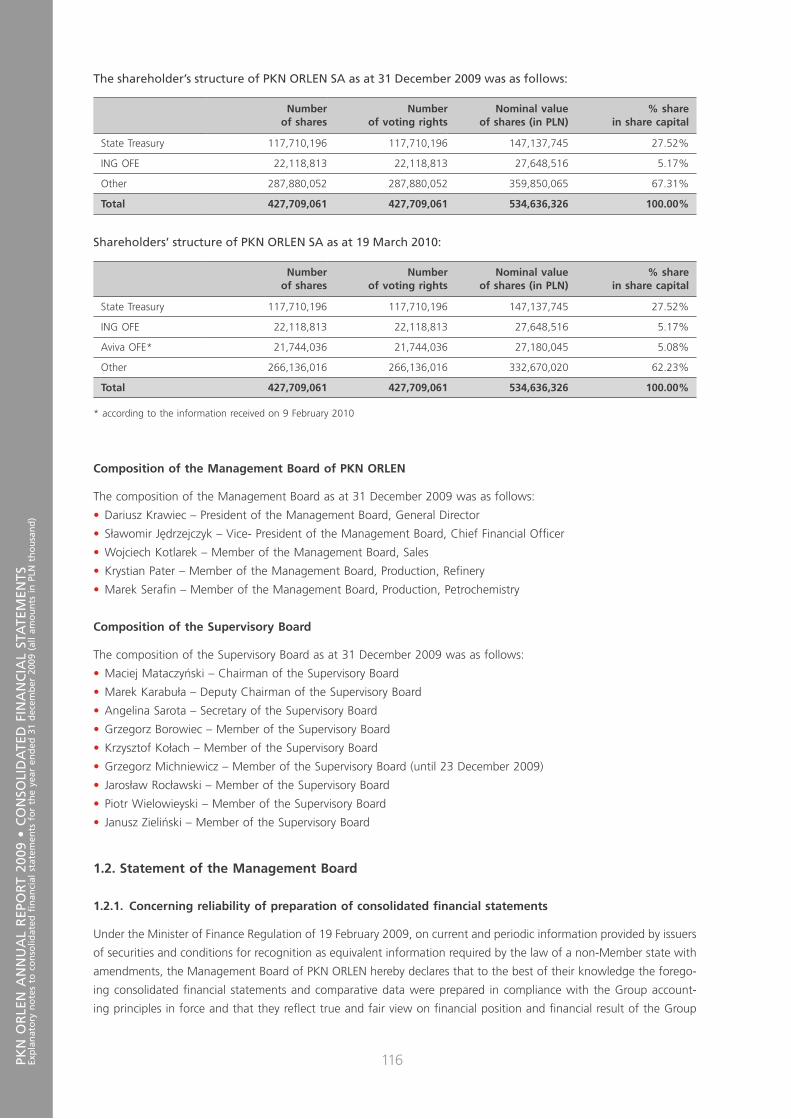
PKN
OR
LEN
AN
NU
AL
REP
OR
T 20
09 •
CO
NSO
LID
ATE
D F
INA
NC
IAL
STA
TEM
ENTS
Exp
lan
ato
ry n
ote
s to
co
nso
lidat
ed
nan
cial
sta
tem
ents
fo
r th
e ye
ar e
nd
ed 3
1 d
ecem
ber
200
9 (a
ll am
ou
nts
in
PLN
th
ou
san
d)
116
The shareholder’s structure of PKN ORLEN SA as at 31 December 2009 was as follows:
Numberof shares
Numberof voting rights
Nominal valueof shares (in PLN)
% sharein share capital
State Treasury 117,710,196 117,710,196 147,137,745 27.52%
ING OFE 22,118,813 22,118,813 27,648,516 5.17%
Other 287,880,052 287,880,052 359,850,065 67.31%
Total 427,709,061 427,709,061 534,636,326 100.00%
Shareholders’ structure of PKN ORLEN SA as at 19 March 2010:
Numberof shares
Numberof voting rights
Nominal valueof shares (in PLN)
% sharein share capital
State Treasury 117,710,196 117,710,196 147,137,745 27.52%
ING OFE 22,118,813 22,118,813 27,648,516 5.17%
Aviva OFE* 21,744,036 21,744,036 27,180,045 5.08%
Other 266,136,016 266,136,016 332,670,020 62.23%
Total 427,709,061 427,709,061 534,636,326 100.00%
* according to the information received on 9 February 2010
Composition of the Management Board of PKN ORLEN
The composition of the Management Board as at 31 December 2009 was as follows:
• Dariusz Krawiec – President of the Management Board, General Director
• S³awomir Jêdrzejczyk – Vice- President of the Management Board, Chief Financial Of cer
• Wojciech Kotlarek – Member of the Management Board, Sales
• Krystian Pater – Member of the Management Board, Production, Re nery
• Marek Sera n – Member of the Management Board, Production, Petrochemistry
Composition of the Supervisory Board
The composition of the Supervisory Board as at 31 December 2009 was as follows:
• Maciej Mataczyñski – Chairman of the Supervisory Board
• Marek Karabu³a – Deputy Chairman of the Supervisory Board
• Angelina Sarota – Secretary of the Supervisory Board
• Grzegorz Borowiec – Member of the Supervisory Board
• Krzysztof Ko³ach – Member of the Supervisory Board
• Grzegorz Michniewicz – Member of the Supervisory Board (until 23 December 2009)
• Jaros³aw Roc³awski – Member of the Supervisory Board
• Piotr Wielowieyski – Member of the Supervisory Board
• Janusz Zieliñski – Member of the Supervisory Board
1.2. Statement of the Management Board
1.2.1. Concerning reliability of preparation of consolidated nancial statements
Under the Minister of Finance Regulation of 19 February 2009, on current and periodic information provided by issuers
of securities and conditions for recognition as equivalent information required by the law of a non-Member state with
amendments, the Management Board of PKN ORLEN hereby declares that to the best of their knowledge the forego-
ing consolidated nancial statements and comparative data were prepared in compliance with the Group account-
ing principles in force and that they re ect true and fair view on nancial position and nancial result of the Group
116

PKN
OR
LEN
SA
CA
PITA
L G
RO
UP
Exp
lan
ato
ry n
ote
s to
co
nso
lidat
ed
nan
cial
sta
tem
ents
fo
r th
e ye
ar e
nd
ed 3
1 d
ecem
ber
200
9 (a
ll am
ou
nts
in
PLN
th
ou
san
d)
117
and that the Management Board Report on the Group’s Operations presents true overview of development, achieve-
ment and business situation of the Group, including basic risks and exposures.
1.2.2. Concerning entity authorized to conduct audit
The Management Board of PKN ORLEN declares that the entity authorized to conduct audit and conducting the audit
of the consolidated nancial statements, was selected in compliance with the law and that the entity and auditors
conducting the audit met the conditions to issue an independent opinion in compliance with relevant regulations.
In compliance with principles of corporate governance adopted by the Management Board of PKN ORLEN the audi-
tor was selected by the Supervisory Board by means of resolution No 485/2005 of 21 January 2005 on the selection
of an auditor. The Supervisory Board made the selection in order to ensure complete independence and objectivity
of the selection itself as well as ful llment of tasks by the auditor. On 23 August 2007 the Supervisory Board has pro-
longed contract with KPMG Audyt Sp. z o.o., as a quali ed auditor to audit and review unconsolidated and consolidated
nancial statements of PKN ORLEN and key entities belonging to the PKN ORLEN Capital Group for the years 2008–2009.
2. PRINCIPLES OF ACCOUNTING
2.1. Principles of presentation
The consolidated nancial statements were prepared in accordance with requirements of International Financial Reporting
Standards (“IFRS”) approved by the European Union (EU) obligatory as at 31 December 2009 and in the scope required
under the Minister of Finance Regulation of 19 February 2009 on current and periodic information provided by issu-
ers of securities and conditions of recognition as equivalent information required by the law of a non-Member State
(Of cial Journal no. 33, item 259) with later amendments and contain period from 1 January to 31 December 2009
and comparative period from 1 January to 31 December 2008.
The presented consolidated nancial statements are compliant with requirements of all IFRSs adopted by the EU
and present a true and fair view of the Group’s nancial position as at 31 December 2009 and 31 December 2008,
results of its operations and cash ows for the year ended 31 December 2009 and 31 December 2008.
The consolidated nancial statements have been prepared assuming that the Group will continue to operate as a go-
ing concern in the foreseeable future. As at the date of approval of these nancial statements there is no evidence
indicating that the Group will not be able to continue its operations as a going concern.
The foregoing nancial statements, except for the statement of cash ow, have been prepared using the accrual basis
of accounting.
2.2. Impact of Standards and interpretations and amendments to existing standards on the consolidated nancial statements of the Capital Group
The foregoing annual consolidated nancial statements have been prepared in accordance with requirements of In-
ternational Financial Reporting Standards (“IFRS”) approved by the European Union (EU)
2.2.1. Binding amendments to IFRSs
The foregoing consolidated nancial statements were affected by amendments to the following standards and inter-
pretations:
IFRS 7 “Financial Instruments: Disclosures” – amendments published on 5 March 2009 and approved by the EU
on 27 November 2009. Amendments are applicable to reporting periods beginning on or after 1 January 2009. The pur-
pose of amendments to IFRS 7 is to enhance the quality of disclosures regarding nancial instruments. Amendments
implement a three-leveled hierarchy of disclosures regarding fair value measurement and requirement to disclose ad-
117
PKN
OR
LEN
AN
NU
AL
REP
OR
T 20
09 •
CO
NSO
LID
ATE
D F
INA
NC
IAL
STA
TEM
ENTS
Exp
lan
ato
ry n
ote
s to
co
nso
lidat
ed
nan
cial
sta
tem
ents
fo
r th
e ye
ar e
nd
ed 3
1 d
ecem
ber
200
9 (a
ll am
ou
nts
in
PLN
th
ou
san
d)
118
ditional information concerning reliability of fair value measurement. Additionally, the amendments specify and extend
the existing disclosures regarding liquidity risk.
Amendments of this Standard mentioned above have no in uence on previously presented consolidated nancial results
nor on the value of equity but only on the presentation of the consolidated nancial statements.
IFRS 8 “Operating Segments” – Standard published on 30 November 2006 and adopted by the EU on 21 Novem-
ber 2007. IFRS 8 is applicable to nancial statements for the periods beginning on or after 1 January 2009. The standard
replaces IAS 14 „Segment Reporting” and requires, among other things, operating segments to be identi ed based
on the internal segment reports valuated regularly by the chief operating decision maker in deciding how to allocate
resources and in assessing performance. The Group has applied the standard retrospectively according to transitional
provisions.
The amendments of the Standard mentioned above have no effect on previously presented consolidated nancial
results and equity, but on the presentation of the consolidated nancial statements.
IAS 1 “Presentation of Financial Statements” – amendments published on 6 September 2007 and adopted by the EU
on 17 December 2008. The amendments are applicable to nancial statements for the periods beginning on or after
1 January 2009. The amendments relate to nomenclature concerning basic nancial statements and presentation of state-
ment of nancial position, statement of comprehensive income, statement of cash ows and statement of changes
in equity. The Group has applied the revised standard retrospectively in the foregoing consolidated nancial statements.
Amendments of the Standard mentioned above have no effect on previously presented consolidated nancial results
and equity but only on the presentation of the consolidated nancial statements.
IAS 23 “Borrowing Costs” – amendments published on 29 March 2007 and adopted by the EU on 10 Decem-
ber 2008. The amendments are applicable to nancial statements for the periods beginning on or after 1 January 2009.
The amendment to the standard eliminates the option to recognize borrowing costs as an expense. In its previous
consolidated nancial statements the Group immediately recognized borrowing costs as an expense.
Starting from 1 January 2009 the Group capitalizes borrowing cost according to the revised standard. Changes resulting
from implementation of the Standard are presented in Note 28. The Group has applied the revised standard prospectively.
IFRIC 13 “Customer Loyalty Programs” – Interpretation published on 28 June 2007 and adopted by the EU
on 16 December 2008. IFRIC 13 is applicable to nancial statements for the periods beginning on or after 1 Janu-
ary 2009. Interpretation provides guidance to entities granting award credits to their customers regarding measurement
of its obligations resulting from free or discounted goods or services sold when credits granted are realized by the client.
The Group applied interpretation mentioned above retrospectively according to transitional provisions. Changes result-
ing from the implementation are presented in the note 2.2.3
Other amendments to IFRSs, that came into force in the period between 1 January 2009 and 31 December 2009
do not have in uence on current and previously presented nancial results and equity.
2.2.2. Standards and Interpretations not yet effective
The Group intends to adopt amendments to IFRSs that are published but not effective as at 31 December 2009,
in accordance with their effective date.
IFRS 1 “First-time adoption of International Financial Reporting Standards” – amendments published on 23 July
2009 and are applicable to annual periods beginning on or after 1 January 2010, earlier application is permitted.
The amendment consists in issuing additional optional exemptions for rst-time adopters of IFRSs with respect to:
I) establishing of deemed cost for oil and gas assets; II) reassessment of lease determination; III) establishing of deemed
cost for operations subject to rate regulation.
118

PKN
OR
LEN
SA
CA
PITA
L G
RO
UP
Exp
lan
ato
ry n
ote
s to
co
nso
lidat
ed
nan
cial
sta
tem
ents
fo
r th
e ye
ar e
nd
ed 3
1 d
ecem
ber
200
9 (a
ll am
ou
nts
in
PLN
th
ou
san
d)
119
IFRS 2 “Share-based Payment: Vesting Conditions and Cancellations” – amendments published on 18 June 2009
are applicable to annual periods beginning on or after 1 January 2010, earlier application is permitted.
The most important consequence of the amendments to IFRS 2 is that entity receiving goods and services in the share-based
payment transaction, which is calculated by one entity in the group or by one share-holder of this entity in cash or other
assets is currently obliged to received goods and services in its nancial statements. Share-based payment transactions
concluded within the Group were not regulated by IFRS 2 yet.
Amendment explains accounting principles for share-based payments in the Capital Group.
Amendments of the Standard shall have no effect on previously presented consolidated nancial results and equity.
IFRS 9 “Financial Instruments” – Standard published on 12 November 2009 is applicable from 1 January 2013, earlier
application is permitted. Standard was published as part of the complex review of nancial instruments accounting.
New standard is less complex as compared to the current requirements and will replace IAS 39 Financial Instruments:
Recognition and Measurement. New standard will only concern the rules of classi cation and valuation of nancial assets.
IAS 17 “Leases” – amendments published on 16 April 2009 and adopted by the EU on 23 March 2010 within “Im-
provements to International Financial Reporting Standards”. Revised IAS 17 is applicable to annual periods beginning
on or after 1 January 2010, earlier application is permitted. The amendment results in lease of land to be classi ed
as nance lease or operating lease contrary to current classi cation solely as operating lease.
IAS 24 “Related Party Disclosures” – amendments published on 4 November 2009. The amended Standard is appli-
cable to annual periods beginning on or after 1 January 2011, earlier application is permitted. The changes introduced
concern mainly the exemption for government-related entities from the related party disclosure requirements de ned
in the Standard and the de nition of a related party.
IAS 32 „Financial Instruments: presentation” – amendments published on 8 October 2009. The amended Standard
is applicable to annual periods beginning on or after 1 July 2010, earlier application is permitted. The amendments
provide that rights, options and warrants meeting criteria for classi cation as equity instruments contained in IAS 32.11,
issued to acquire a xed number of entity’s own non-derivative equity instruments for a xed amount of any currency
(“ xed number for xed price”), are classi ed as equity instruments if the offer was submitted to all of existing owners
of the same class of entity’s non-derivative equity instruments in proportion to the number of possessed instruments.
IFRIC 14 “Prepayments of a Minimum Funding Requirements” – Interpretation published on 26 October 2009.
The interpretation is applicable to annual periods beginning on or after 1 January 2011, earlier application is permit-
ted. Under the amended IFRIC 14 prepayments made to the plan where there are Minimum Funding Requirements
would be recognized as an asset.
IFRIC 19 “Extinguishing Financial Liabilities with Equity Instruments” – Interpretation published on 26 Novem-
ber 2009 and applicable to annual periods beginning on or after 1 July 2010, earlier application is permitted. The In-
terpretation concerns accounting principles for entities issuing equity instruments to extinguish a nancial liability,
partially or completely.
Improvements to International Financial Reporting Standards – published on 16 April 2009 and adopted by the EU
on 23 March 2010. The improvements contain 15 amendments to 12 standards. Majority of improvements are ap-
plicable to annual periods beginning on or after 1 January 2010, earlier application is permitted.
The possible impact of amendments to IFRSs mentioned above on the Group’s future nancial statements is being
analyzed. The potential impact of amendments is not known yet.
In the current annual reporting period there were no voluntary early adoptions of IFRSs.
119
PKN
OR
LEN
AN
NU
AL
REP
OR
T 20
09 •
CO
NSO
LID
ATE
D F
INA
NC
IAL
STA
TEM
ENTS
Exp
lan
ato
ry n
ote
s to
co
nso
lidat
ed
nan
cial
sta
tem
ents
fo
r th
e ye
ar e
nd
ed 3
1 d
ecem
ber
200
9 (a
ll am
ou
nts
in
PLN
th
ou
san
d)
120
2.2.3. Presentation changes
In the explanatory note 26 “Cost by kind” the data for the year 2008 was changed due to reclassi cation of changes
in prepayments and accruals of PLN 4,552 thousand from line “Change in inventory” to respective cost by kind.
In the consolidated statement of comprehensive income for the year ended 31 December 2009 and 31 December 2008
the Group ceased to divide sales revenues. Similar presentation to the prior year was presented in the note 25.
For the year 2008 a reclassi cation adjustment of PLN 347,757 thousand has been made from excise tax and other
charges to sales of nished goods.
As a consequence of detailed analysis of operating lease agreements the Group indenti ed some non-cancellable
agreements in which the Group is as lessee. It resulted in change of comparative data in the amount of PLN 1,053,825,
(note 32) in comparison to the information presented in the annual report for 2008.
According to interpretation of IFRIC 13 – Customer Loyalty Programs the value of loyalty programs of PLN 72,845 thou-
sand was reclassi ed in the foregoing unconsolidated nancial statements as at 31 December 2008 from Short-term
provisions and trade and other liabilities to deferred income.
According to the Managements Board the above mentioned changes will ensure better presentation of effects
of the Group’s activities.
1.2.4. Functional currency and presentation currency of nancial statements and methods applied
to translation of data denominated in foreign currencies
Functional and presentation currency of the foregoing consolidated nancial statements and nancial statements
of the Parent is Polish zloty. Detailed methods applied to translation of data denominated in foreign currencies pre-
sented in Note 2.3.30.
2.3. Applied accounting principles
2.3.1. Principles of consolidation
The consolidated nancial statements of the Group include data of PKN ORLEN SA, its subsidiaries and jointly controlled
entities (joint ventures) prepared as at the end of the same reporting period as unconsolidated nancial statements
of PKN ORLEN SA and using uniform accounting principles in relation to similar transactions and other events in simi-
lar circumstances. Data of subsidiaries and jointly controlled entities (joint ventures) that together do not signi cantly
impact the nancial statements of the Capital Group may not be consolidated. In such a case shares are accounted
for using equity method.
a) Subsidiaries
Subsidiaries are entities under the Group’s control. It is assumed that the Group controls another entity if it holds
the power to govern the nancial and operating policies of the entity so as to obtain bene ts from its activities.
Particularly, the control is evidenced when the Group holds directly or indirectly more than 50% of the voting rights
in an entity that are not contractually or actually restrained and governs the nancial and operating policies of the entity.
Subsidiaries (except for subsidiaries held for sale) are consolidated using the line by line method. In the line by line
method the nancial statements of the Parent and its subsidiaries are combined line by line by adding together like
items of assets, liabilities, income and expenses and then appropriate consolidation procedures are performed.
b) Investment in jointly controlled entities
Investments in jointly controlled entities are investments where the Group exercises joint control. It is assumed that
the Group jointly controls another entity if the strategic nancial and operating decisions relating to the activity require
the unanimous consent of the parties sharing control. Investments in jointly controlled entities are accounted for us-
ing the proportionate method. In the proportionate method a proportional share in a jointly controlled entity’s assets,
120
PKN
OR
LEN
SA
CA
PITA
L G
RO
UP
Exp
lan
ato
ry n
ote
s to
co
nso
lidat
ed
nan
cial
sta
tem
ents
fo
r th
e ye
ar e
nd
ed 3
1 d
ecem
ber
200
9 (a
ll am
ou
nts
in
PLN
th
ou
san
d)
121
liabilities, income and expenses is presented line by line with particular items in the consolidated nancial statements
and appropriate consolidation procedures are performed.
c) Investment in associates
Investments in associates (entities over which the company has signi cant in uence and that are neither controlled nor
jointly controlled) are accounted for using the equity method, based on nancial statements of associates prepared
as at the end of same reporting period as unconsolidated nancial statements of the Parent Company and using
uniform accounting principles in relation to similar transactions and other events in similar circumstances. Investments
accounted for using equity method are tested for impairment.
It is assumed that the Group has signi cant in uence over another entity, if it has ability to participate in nancial
and operating decisions of the entity. Particularly, the signi cant in uence is evidenced when the Group holds directly
or indirectly more than 20%, and no more than 50% of the voting rights of an entity and participation in nancial
and operating decisions is not contractually or actually restrained and is actually executed.
d) Consolidation procedures
The consolidated nancial statements are prepared using the line by line method and the proportionate method. When
investor has signi cant in uence over another entity, equity method is used to evaluate shares in entity.
In preparing consolidated nancial statements the following consolidation procedures are followed:
• the carrying amount of the Parent’s investment in each subsidiary and the Parent’s portion of equity of each
subsidiary as at the acquisition date are eliminated,
• minority interest in the pro t or loss of consolidated subsidiaries for the reporting period are identi ed,
• minority interest in the net assets of consolidated subsidiaries are identi ed and presented separately from the Parent’s,
• intra group balances are eliminated,
• unrealized gains or losses on intra group transactions are eliminated,
• the income and expenses relating to intra group transactions are eliminated.
The consolidated nancial statements are statements comprising activities of all entities of the Capital Group prepared
as if they were nancial statements of a single economic entity.
2.3.2. Business combinations
Business combinations are accounted for using the purchase method. Application of this method requires:
• identi cation of acquirer,
• measurement of cost of the business combination,
• allocation, at the acquisition date, the cost of the business combination to the assets acquired and liabilities and con-
tingent liabilities assumed.
The fair value of assets, liabilities and contingent liabilities, for the purpose of an allocation of a cost of business
combination, is recognized in accordance with the appendix B to IFRS 3.
The excess of the cost of business combination over the net fair value of identi able assets, liabilities and contingent
liabilities is presented as goodwill.
The excess of the net fair value of identi able assets, liabilities and contingent liabilities over the cost of business
combination is recognized as other operating income of the period.
2.3.3. Property, plant and equipment
Property, plant and equipment include both xed assets (assets that are in the condition necessary for them to be
capable of operating in the manner intended by the management) as well as construction in progress (assets that are
in the course of construction or development necessary for them to be capable of operating in the manner intended
by the management).
121
PKN
OR
LEN
AN
NU
AL
REP
OR
T 20
09 •
CO
NSO
LID
ATE
D F
INA
NC
IAL
STA
TEM
ENTS
Exp
lan
ato
ry n
ote
s to
co
nso
lidat
ed
nan
cial
sta
tem
ents
fo
r th
e ye
ar e
nd
ed 3
1 d
ecem
ber
200
9 (a
ll am
ou
nts
in
PLN
th
ou
san
d)
122
Property plant and equipment are initially recognized at cost. The cost of an item of property, plant and equipment
comprises its purchase price and other costs directly attributable to bringing the item of property, plant and equip-
ment into use. The cost of an item of property, plant and equipment includes also estimated costs of dismantling
and removing the item and restoring the site/land on which it is located, the obligation for which is connected with
acquisition or construction of an item of property, plant and equipment.
Property, plant and equipment are stated in the nancial statements prepared at the end of the reporting period
at the carrying amount. The carrying amount is the amount at which an asset is initially recognized after deducting
any accumulated depreciation and accumulated impairment losses.
Borrowing costs directly attributable to the acquisition, construction or production of a qualifying asset, e.g. interest,
commissions are part of the initial cost.
Depreciation of an item of property, plant and equipment begins when it is available for use that is from the month
it is in the location and condition necessary for it to be capable of operating in the manner intended by the man-
agement, over the period re ecting its estimated economic useful life, considering the residual value. Fixed assets
are amortized with straight-line method and in justi ed cases units of production method of depreciation. Each part
of an item of property, plant and equipment with a cost that is signi cant in relation to the total cost of the item
is depreciated separately over the period re ecting its economic useful life.
Appropriateness of the applied amortization periods and rates is veri ed periodically (at least once a year) and respec-
tive adjustments are made to the subsequent periods of depreciation (prospectively).
The depreciable amount of an asset is determined after deducting its residual value.
The following standard economic useful lives are used for property, plant and equipment:
Buildings and constructions 10–70 years
Machinery and equipment 3–25 years
Vehicles and other 4–17 years
The cost of signi cant repairs and regular maintenance programs is recognized as property, plant and equipment
and depreciated in accordance with their economic useful lives. The cost of current maintenance of property, plant
and equipment is recognized as an expense when it is incurred.
2.3.4. Investment property
An investment property is initially recognized at cost. The cost of a purchased investment property comprises its pur-
chase price and any directly attributable expenditure, such as professional fees for legal services, property transfer
taxes and other transaction costs. The cost of a self-constructed investment property is its cost when the construction
or development is complete and ready to use, according to principles de ned for property, plant and equipment.
After initial recognition an investment property is presented at fair value determined on the basis of a valuation
of an independent surveyor as at the end of the reporting period. Gains and losses resulting from changes in fair value
of investment property are presented in the income statement in the period in which they arise. The Group determines
fair value without any deduction for transaction costs it may incur on sale or other disposal of investment property.
If there is clear evidence that the fair value of the investment property is not reliably determinable on a continuing
basis, the Group measures investment property using the cost model, in accordance with principles de ned for prop-
erty, plant and equipment.
An investment property is derecognized on disposal or when the investment property is permanently withdrawn
from use and no future economic bene ts are expected from its disposal.
122
PKN
OR
LEN
SA
CA
PITA
L G
RO
UP
Exp
lan
ato
ry n
ote
s to
co
nso
lidat
ed
nan
cial
sta
tem
ents
fo
r th
e ye
ar e
nd
ed 3
1 d
ecem
ber
200
9 (a
ll am
ou
nts
in
PLN
th
ou
san
d)
123
2.3.5. Intangible assets
Intangible assets include identi able non-monetary assets without physical substance.
Except for intangible assets arising from development that meet recognition criteria other internally generated intan-
gible assets are not recognized as assets but are recorded in pro t or loss in the period when the related cost has
been incurred.
Intangible assets are recognized if it is probable that the expected future economic bene ts that are attributable
to the assets will ow to the entity and the cost of the asset can be measured reliably.
Intangible assets are measured initially at cost. The intangible assets acquired in a business combination are measured
initially at a fair value at the business combination date. Granted rights to renewable energy sources, are measured
initially at fair value.
CO2 emission rights and granted rights to renewable energy sources are recognized in the accounting records at their
registration date (date of taking over the control) at fair (market) value.
Intangible assets are stated in the consolidated nancial statements prepared at the end of the reporting period
at the carrying amount. The carrying amount is the amount at which the asset is recognized after deducting any ac-
cumulated amortization and accumulated impairment losses.
Borrowing costs directly attributable to the acquisition, construction or production of a qualifying asset, e.g. interest,
commissions, are part of the initial cost.
Intangible assets with nite useful life are amortized using straight-line method when an asset is available for use
that is when it is in the location and condition necessary for it to be capable of operating in the manner intended
by management over their estimated economic useful life. Appropriateness of the applied amortization periods
and rates is veri ed periodically (at least once a year), and respective adjustments are made to the subsequent periods
of amortization (prospectively).
The depreciable amount of an asset is determined after deducting its residual value.
The following standard economic useful lives are used for intangible assets:
Acquired licenses, patents, and similar intangible assets 2–15 years
Acquired computer software 2–10 years
Intangible assets with an inde nite useful life are not amortized. Their value is decreased by impairment allowances.
a) Goodwill
Goodwill is allocated to cash-generating units (group of units) at the acquisition date.
At the acquisition date goodwill is stated at the excess of the cost of the business combination over the acquirer’s
share in the fair value of the net identi able assets, liabilities and contingent liabilities (all relevant days of acquisition
if the business combination results from a series of transactions).
As at the reporting date goodwill is measured at cost less cumulative impairment losses recognized in the previous
periods as well as decreases due to partial disposals of shares, to which goodwill was allocated. Impairment losses up
to the amount of goodwill allocated to a particular cash-generating unit (or group of units) are not reversible.
Goodwill is tested for impairment at the end of the reporting period in which the events or circumstances indicate
that goodwill might be impaired.
b) Perpetual usufruct of land
The titles to perpetual usufruct of land acquired by the Group are presented in the separate position of the statement
of nancial position.
123
PKN
OR
LEN
AN
NU
AL
REP
OR
T 20
09 •
CO
NSO
LID
ATE
D F
INA
NC
IAL
STA
TEM
ENTS
Exp
lan
ato
ry n
ote
s to
co
nso
lidat
ed
nan
cial
sta
tem
ents
fo
r th
e ye
ar e
nd
ed 3
1 d
ecem
ber
200
9 (a
ll am
ou
nts
in
PLN
th
ou
san
d)
124
The titles to perpetual usufruct of land obtained under an administrative decision are recognized as off statement
of nancial position items.
2.3.6. Excess of acquirer’s interest in the net fair value of acquiree’s identi able assets, liabilities
and contingent liabilities over cost
If the acquirer’s interest in the net fair value of the identi able assets, liabilities and contingent liabilities exceeds the cost
of the business combination, the acquirer reassess the identi cation and measurement of the acquiree’s identi able
assets, liabilities and contingent liabilities and the measurement of the cost of the combination and recognizes im-
mediately in pro t or loss any excess remaining after that reassessment.
2.3.7. Borrowing costs
Borrowing costs that are directly attributable to the acquisition, construction or production of a qualifying asset are
capitalized as part of the cost of that asset. Other borrowing costs should be recognized as an expense.
A qualifying asset is an asset that necessarily takes a substantial period of time to get ready for its intended use or sale.
Borrowing costs are capitalized based on so called net investment expenditures which means construction in progress
not funded through the use of investment commitments, but using other sources of external nancing.
Borrowing costs relate to interest and other charges connected with borrowing of funds. Borrowing costs may include:
• interest on bank overdrafts and Short-term and long-term borrowings,
• amortization of discounts or premiums relating to borrowings,
• amortization of ancillary costs incurred in connection with the arrangement of borrowings,
• nance charges in respect of nance leases recognized in accordance with IAS 17 Leases,
• exchange differences arising from foreign currency borrowings to the extent that they are regarded as an adjustment
to interest costs.
Borrowing costs that are directly attributable are those borrowing costs that would have been avoided if the expendi-
ture on the qualifying asset had not been made.
The upper limit for capitalization of the borrowing costs is the amount of incurred borrowing costs.
The commencement date for capitalization is the date when all of the following three conditions are met:
• expenditures for the asset are incurred;
• borrowing costs are incurred;
• activities necessary to prepare the asset for its intended use or sale are undertaken.
Capitalization of the borrowing costs ceases when substantially all the activities necessary to prepare the qualifying as-
set for its intended use or sale are complete. Additional administrative work, decoration, alterations to the purchaser’s
or user’s speci cation are not a basis for further capitalization of the borrowing costs.
After putting the asset into use, the capitalized borrowing costs are depreciated/ amortized over the period re ecting
economic useful life of the asset as part of the cost of the asset.
2.3.8. Lease
A lease is an agreement whereby a lessor conveys to the lessee in return for a payment or series of payments the right
to use an asset for an agreed period of time. Particularly leases are the agreements de ned in the Civil Code as well
as rent and tenancy agreements concluded for a de nite time.
Assets used under the nance lease, that is the agreement that transfers substantially all the risks and rewards incidental
to ownership of an asset to the lessee, are recognized as assets of the lessee. Assets used under the operating lease,
that is the agreement that does not transfer substantially all the risks and rewards incidental to ownership of an asset
to the lessee, are recognized as assets of the lessor.
124

PKN
OR
LEN
SA
CA
PITA
L G
RO
UP
Exp
lan
ato
ry n
ote
s to
co
nso
lidat
ed
nan
cial
sta
tem
ents
fo
r th
e ye
ar e
nd
ed 3
1 d
ecem
ber
200
9 (a
ll am
ou
nts
in
PLN
th
ou
san
d)
125
If the Group uses an asset based on the nance lease, the asset is recognized as an item of property, pant and equip-
ment or an intangible asset. The leased asset is measured at the lower of its fair value or the present value of the mini-
mum lease payments that is the present (discounted) value of payments over the lease term that the lessee is or can
be required to make.
The present value of the minimum lease payments is recognized in the statement of nancial position as nancial
liabilities with the division into Short-term part (due no more than one year after the end of the reporting period)
and long-term part (due more than one year after the end of the reporting period). The minimum lease payments are
discounted and apportioned between nance charge and the reduction of the outstanding liability using interest rate
implicit in the lease, if this is practicable to determine, if not, the lessee’s incremental borrowing rate.
Depreciation methods for assets leased under the nance lease as well as methods of determining impairment losses
in respect of assets leased under the nance lease are consistent with policies applied for the Group’s owned assets.
If the Group conveyed to another entity the right to use an asset under the nance lease, the present value of the mini-
mum lease payments and unguaranteed residual value is recognized in the statement of nancial position as receivables
with the division into Short-term part and long-term part. The minimum lease payments and unguaranteed residual
value are discounted using interest rate implicit in the lease, that is the discount rate that, at the inception of the lease,
causes the aggregate present value of the minimum lease payments, the unguaranteed residual value and the initial
direct costs to be equal to the fair value of the leased asset.
If the Group uses an asset based on the operating lease, the asset is not recognized in the statement of nancial
position and lease payments are recognized as an expense in pro t or loss.
If the Group conveyed to another entity the right to use an asset under the operating lease, the asset is recognized
based on the same policies as applied for the Group’s owned assets, that is as an item of property, plant and equip-
ment or an intangible asset.
Lease income from operating leases is recognized as revenues from sale.
2.3.9. Impairment of assets
If there is an external or internal indication that an asset may be impaired, it is tested for impairment. Impairment tests
are carried out annually also in respect of intangible assets with an inde nite useful life are performed once a year.
If the recoverable amount of an asset is less than its carrying amount, the carrying amount of the asset is reduced
to its recoverable amount by an impairment allowance recognized immediately as an expense in pro t or loss. The re-
coverable amount is higher of two: its value in use and fair value less costs to sell.
Value in use is the present value of the future cash ows expected to be derived from continuing use of the asset
and its ultimate disposal.
Fair value less costs to sell is the amount obtainable from the sale of an asset in an arm’s length transaction between
knowledgeable, willing parties, less the costs of disposal.
Assets that do not generate cash ows individually are grouped in the smallest identi able group of assets generating
cash ows that are largely independent of the cash ows from other assets (so called cash-generating units). The Group
allocates to each of its cash generating units:
• goodwill acquired in a business combination, if it may be assumed that the cash-generating unit bene ted from the syn-
ergies of the combination;
• corporate assets, if there is reasonable and consistent basis of such an allocation.
The impairment loss is allocated to reduce the carrying amount of the assets of the cash generating unit in the fol-
lowing order:
• rst, to reduce the carrying amount of any goodwill allocated to the cash generating unit;
• then, to other assets of the unit pro rata on the basis of the carrying amount of each asset in the unit.
125

PKN
OR
LEN
AN
NU
AL
REP
OR
T 20
09 •
CO
NSO
LID
ATE
D F
INA
NC
IAL
STA
TEM
ENTS
Exp
lan
ato
ry n
ote
s to
co
nso
lidat
ed
nan
cial
sta
tem
ents
fo
r th
e ye
ar e
nd
ed 3
1 d
ecem
ber
200
9 (a
ll am
ou
nts
in
PLN
th
ou
san
d)
126
The Group assesses at the end of each reporting period whether the impairment loss should be partly or completely
reversed. Indication that the impairment loss recognized in prior period no longer exists is the opposite of indication
that the impairment loss should be recognized.
An impairment loss recognized for goodwill is not reversed.
A reversal of an impairment loss is recognized in the consolidated statement of comprehensive income as revenue.
2.3.10. Financial instruments
A nancial instrument is any contract that gives rise to a nancial asset of one entity and a nancial liability or equity
instrument of another entity.
a) Recognition and derecognition in consolidated statement of nancial position
The Group recognizes a nancial asset or a nancial liability on its consolidated statement of nancial position when,
and only when, the Group becomes a party to the contractual provisions of the instrument.
A regular way purchase or sale of nancial assets is recognized as at trade date.
The Group derecognizes a nancial asset in consolidated statement form nancial position when and only when:
• the contractual rights to the cash ows from the nancial asset expire, or
• it transfers the nancial asset to another party.
The Group removes a nancial liability (or part of nancial liability) from its consolidated statement of nancial position
when, and only when it is extinguished – that is when the obligation speci ed in the contract:
• is discharged, or
• is cancelled, or
• expired.
b) Non-current nancial assets held for sale
Non-current nancial assets, the carrying amount of which will be recovered principally through a sale transaction,
are classi ed as Non-current assets held for sale and presented in the separate position of the consolidated state-
ment of nancial position. For this to be the case, the asset (or disposal group) must be available for immediate sale
and its sale must be highly probable. Such a classi cation does not result in application of measurement principles
de ned in IFRS 5 designated for Non-current assets held for sale. Non-current nancial assets held for sale are still
measured based on general principles relating to nancial assets.
c) Measurement of nancial assets
When a nancial asset or a nancial liability is recognized initially, the Group measures it at its fair value plus, in the case
of a nancial asset or a nancial liability not at fair value through pro t or loss, transaction costs that are directly at-
tributable to the acquisition or issue of the nancial asset or nancial liability.
When an option contract is recognized initially, there may be a difference between the transaction price and the instru-
ment value that would be determined with valuation techniques used by the Group. In such a case the Group recognizes
an asset initially at the transaction price and at the end of the reporting period (month) it determines the gain or loss
resulting solely from change of factors taken into account when the transaction price was set.
For the purpose of measuring a nancial asset at the end of the reporting period or any other date after initial rec-
ognition, the Group classi es nancial assets into the following four categories:
• nancial assets at fair value through pro t or loss;
• held-to-maturity investments;
• loans and receivables;
• available-for-sale nancial assets.
126
PKN
OR
LEN
SA
CA
PITA
L G
RO
UP
Exp
lan
ato
ry n
ote
s to
co
nso
lidat
ed
nan
cial
sta
tem
ents
fo
r th
e ye
ar e
nd
ed 3
1 d
ecem
ber
200
9 (a
ll am
ou
nts
in
PLN
th
ou
san
d)
127
Regardless of characteristics and purpose of a purchase transaction, the Group classi es initially selected nancial as-
sets as nancial assets at fair value through pro t or loss.
A nancial asset at fair value through pro t or loss is a nancial asset classi ed as held for trading if it is:
• acquired principally for the purpose of selling or repurchasing in the near term, or
• part of a portfolio of identi ed nancial instruments that are managed together and for which there is evidence
of a recent actual pattern of Short-term pro t taking, or
• a derivative (except for a derivative that is an effective hedging instrument);
• designated by the Group upon initial recognition as at fair value through pro t or loss, when doing so results in more
relevant information.
Held-to-maturity investments are non-derivative nancial assets with xed or determinable payments and xed maturity
that the Group has the positive intention and ability to hold to maturity.
Loans and receivables are non-derivative nancial assets with xed or determinable payments that are not quoted
on an active market.
Available-for-sale nancial assets are those non-derivative nancial assets that are designated as available for sale or are
not classi ed as loans and receivables, held-to-maturity investments or nancial assets at fair value through pro t
or loss. Results of changes in the value of available-for-sale nancial assets are charged directly to equity.
d) Fair value measurement of nancial assets
The Group measures nancial assets at fair value through pro t or loss, including derivative nancial assets and availa-
ble-for-sale nancial assets at their fair value, without any deduction for transaction costs that may be incurred on sale
or other disposal.
Fair value of nancial assets is determined in the following way:
• for instruments quoted on an active market based on current quotations available as at the end of the reporting
period;
• for debt instruments unquoted on an active market based on discounted cash ows analysis;
• for forward and swap transactions based on discounted cash ows analysis.
If the fair value of investments in equity instruments (shares) that do not have a quoted market price on an active
market is not reliably measurable, the Group measures them at cost, that is the acquisition price less any accumulated
impairment losses.
Financial assets designated as hedged items are measured in accordance with the principles of hedge accounting.
A gain or loss on a nancial asset classi ed as at fair value through pro t or loss are recognized directly in the income
statement.
A gain or loss on an available-for-sale nancial asset are recognized in other comprehensive income, except for im-
pairment losses and foreign exchange gains and losses that are recognized in pro t or loss. In case of debt nancial
instruments interest calculated using the effective interest method are recognized in pro t or loss.
e) Amortized cost measurement of nancial assets
The Group measures loans and receivables, including trade receivables, as well as held-to-maturity investments
at amortized cost using the effective interest method. The Group uses simpli ed methods in respect of measurement
of nancial assets at amortized cost if it does not distort information included in the consolidated nancial statements.
Financial assets measured at amortized cost, in relation to which the Group uses simpli cations, are measured initially
at the amounts due and after initial recognition, including the end of the reporting period, at the amounts due price
less any accumulated impairment losses.
f) Measurement of nancial liabilities
As at the end of the reporting period or other dates after the initial recognition the Group measures nancial liabilities
at fair value through pro t or loss (including particularly derivatives which are not designated as hedging instruments)
127
PKN
OR
LEN
AN
NU
AL
REP
OR
T 20
09 •
CO
NSO
LID
ATE
D F
INA
NC
IAL
STA
TEM
ENTS
Exp
lan
ato
ry n
ote
s to
co
nso
lidat
ed
nan
cial
sta
tem
ents
fo
r th
e ye
ar e
nd
ed 3
1 d
ecem
ber
200
9 (a
ll am
ou
nts
in
PLN
th
ou
san
d)
128
at fair value as the end of the reporting period. Regardless of characteristics and purpose of a purchase transaction,
the Group classi es initially selected nancial liabilities as nancial liabilities at fair value through pro t or loss, when
doing so results in more relevant information. The fair value of a nancial liability is the current price of instruments
quoted on an active market.
The Group measures other liabilities, including trade liabilities, at amortized cost using the effective interest rate method.
The Group uses simpli ed methods of measurement of nancial liabilities that are usually measured at amortized
cost, if it does not distort information included in the nancial statements. Interest-bearing loans and borrowings.
in relation to which simpli ed methods are used, are measured initially and after initial recognition (including the end
of the reporting period) at the amounts due.
If there is no active market for a nancial instrument, the fair value of the nancial liabilities is established by using
the following techniques:
• using recent arm’s length market transactions between knowledgeable, willing parties,
• reference to the current fair value of another instrument that is substantially the same,
• discounted cash ow analysis.
Loans and borrowings received and trade liabilities are non-derivative nancial liabilities with xed or determinable
payments that are not quoted on an active market.
Financial guarantee contracts that are contracts that require the Group (issuer) to make speci ed payments to reim-
burse the holder for the loss it incurs because a speci ed debtor fails to make payment when due in accordance with
the original or modi ed terms of a debt instrument, not classi ed as nancial liabilities at fair value through pro t
or loss are measured at the higher of:
• the amount determined in accordance with principles relating to valuation of provisions,
• the amount initially recognized less, when appropriate, cumulative amortization.
g) Embedded derivatives
If the Group is a party of a hybrid (combined) instrument that includes an embedded derivative, the embedded de-
rivative is separated from the host contract and accounted for as a derivative in accordance with principles de ned
for investments at fair value through pro t or loss if all of the following conditions are met:
• the economic characteristics and risks of the embedded derivative are not closely related to the economic charac-
teristics and risks of the host contract,
• a separate instrument with the same realization terms as the embedded derivative would meet the de nition
of a derivative, and
• the hybrid instrument is not measured at fair value with changes in fair value recognized in pro t or loss (i.e. a de-
rivative that is embedded in a nancial asset or nancial liability at fair value through pro t or loss is not separated).
The Group assesses the need to separate an embedded derivative from the host contract and to present it as a de-
rivative, when it becomes a party of a hybrid instrument for the rst time. Reassessment is made only in case, when
subsequent changes are introduced to the hybrid contract that substantially modify cash ows required by the contract.
A derivative is a nancial instrument with all three of the following characteristics:
• its value changes in response to the change in a speci ed interest rate, nancial instrument price, commodity price,
foreign exchange rate, index of prices or rates, credit rating or credit index, or other variable, provided in the case
of a non- nancial variable that the variable is not speci c to a party to the contract,
• it requires no initial net investment or an initial net investment that is smaller than would be required for other types
of contracts that would be expected to have a similar response to changes in market factors, and
• it is settled at a future date.
h) Hedge accounting
Derivatives designated as hedging instruments whose fair value or cash ows are expected to offset changes in the fair
value or cash ows of a hedged item are accounted for in accordance with fair value or cash ow hedge accounting,
if all of the following conditions are met:
128
PKN
OR
LEN
SA
CA
PITA
L G
RO
UP
Exp
lan
ato
ry n
ote
s to
co
nso
lidat
ed
nan
cial
sta
tem
ents
fo
r th
e ye
ar e
nd
ed 3
1 d
ecem
ber
200
9 (a
ll am
ou
nts
in
PLN
th
ou
san
d)
129
• at the inception of the hedge there is formal designation and documentation of the hedging relationship and the Group’s
risk management objective and strategy for undertaking the hedge,
• the hedge is expected to be highly effective in achieving offsetting changes in fair value or cash ows attributable
to the hedged risk, consistently with the originally documented risk management strategy for that particular hedging
relationship,
• for cash ow hedges, a forecast transaction that is the subject of the hedge must be highly probable and must
present an exposure to variations in cash ows that could ultimately affect pro t or loss,
• the effectiveness of the hedge can be reliably measured,
• the hedge is assessed on an ongoing basis and determined actually to have been highly effective throughout the -
nancial reporting periods for which the hedge was designated.
Hedge accounting is not applied to cash ows connected with embedded derivatives separated from host contracts.
Fair value hedge is a hedge of the exposure to changes in fair value of a recognized asset or liability or an unrecognized
rm commitment, or an identi ed portion of such an asset, liability or rm commitment, that is attributable to a par-
ticular risk and could affect pro t or loss. A rm commitment is a binding agreement for the exchange of a speci ed
quantity of resources at a speci ed price on a speci ed future date or dates.
If a fair value hedge is used, it is accounted for as follows:
• the gain or loss from remeasuring the hedging instrument at fair value is recognized in pro t or loss, and
• the gain or loss on the hedged item attributable to the hedged risk adjusts the carrying amount of the hedged item
and is recognized in pro t or loss (this applies also if the hedged item is an available-for-sale nancial asset, whose
changes in value are recognized directly in equity).
The Group discontinues prospectively fair value hedge accounting if:
• the hedging instrument expires, is sold, terminated or exercised (for this purpose, the replacement or rollover
of a hedging instrument into another hedging instrument is not an expiration or termination if such replacement
or rollover is part of the Group’s documented hedging strategy),
• the hedge no longer meets the criteria for hedge accounting, or
• the Group revokes the designation.
Cash ow hedge is a hedge of the exposure to variability in cash ows that is attributable to a particular risk associated
with a recognized asset or liability or a highly probable forecast transaction and could affect pro t or loss. A forecast
transaction is an uncommitted but anticipated future transaction.
If a cash ow hedge is used, it is accounted for as follows:
• the portion of the gain or loss on the hedging instrument that is determined to be an effective hedge is recognized
in equity through the statement of changes in consolidated equity, and
• the ineffective portion of the gain or loss on the hedging instrument is recognized in pro t or loss.
If a hedge of a forecast transaction subsequently results in the recognition of a nancial asset or a nancial liability,
the associated gains or losses that were recognized in other comprehensive income are reclassi ed to pro t or loss
in the same period or periods during which the asset acquired or liability assumed affects pro t or loss. However,
if the Group expects that all or a portion of a loss recognized in other comprehensive income will not be recovered
in one or more future periods, it reclassi es to pro t or loss the amount that is not expected to be recovered.
If a hedge of a forecast transaction subsequently results in the recognition of a non- nancial asset or a non- nancial
liability, or a forecast transaction for a non- nancial asset or non- nancial liability becomes a rm commitment for which
fair value hedge accounting is applied, the Group removes the associated gains and losses that were recognized
in other comprehensive income and includes them in the initial cost or other carrying amount of the asset or liability.
The Group discontinues prospectively cash ow hedge accounting if:
• the hedging instrument expires, is sold, terminated or exercised – in this case, the cumulative gain or loss on the hedg-
ing instrument recognized in equity remain separately recognized in equity until the forecast transaction occurs;
129

PKN
OR
LEN
AN
NU
AL
REP
OR
T 20
09 •
CO
NSO
LID
ATE
D F
INA
NC
IAL
STA
TEM
ENTS
Exp
lan
ato
ry n
ote
s to
co
nso
lidat
ed
nan
cial
sta
tem
ents
fo
r th
e ye
ar e
nd
ed 3
1 d
ecem
ber
200
9 (a
ll am
ou
nts
in
PLN
th
ou
san
d)
130
• the hedge no longer meets the criteria for hedge accounting – in this case, the cumulative gain or loss on the hedg-
ing instrument recognized in other comprehensive income remain separately recognized in equity until the forecast
transaction occurs;
• the forecast transaction is no longer expected to occur, in which case any related cumulative gain or loss on the hedg-
ing instrument recognized in other comprehensive income are recognized in pro t or loss.
If the Group revokes the designation, the cumulative gain or loss on the hedging instrument recognized directly
in equity remain separately recognized in equity until the forecast transaction occurs or is no longer expected to occur.
2.3.11. Impairment of nancial assets
The Group assesses at the end of each reporting period whether there is any objective indicator that a nancial asset
or group of nancial assets is impaired.
If there is an objective indicator that an impairment loss on loans and receivables or held-to-maturity investments
carried at amortized cost has been incurred, the amount of the loss is measured at the difference between the as-
set’s carrying amount and the present value of estimated future cash ows discounted at the nancial asset’s original
effective interest rate.
The Group uses simpli ed methods in respect of determining the impairment of trade receivables – particularly the im-
pairment loss equal to the asset’s carrying amount is recognized if the payment term expired at least 6 months before
the end of the reporting period. If, in a subsequent period, the amount of the impairment loss decreases and the de-
crease can be related objectively to an event occurring after the impairment was recognized, the previously recognized
impairment loss is reversed and recognized in pro t or loss.
If there is an objective indicator that an impairment loss has been incurred on an unquoted equity instrument that
is not carried at fair value because its fair value cannot be reliably measured, the amount of the impairment loss
is measured as the difference between the carrying amount of the nancial asset and the present value of estimated
future cash ows discounted at the current market rate of return for a similar nancial asset. Such impairment losses
are not reversed.
If there is an objective indicator that an impairment loss has been incurred on an available-for-sale nancial asset,
the cumulative loss that had been recognized in other comprehensive income is removed from equity and recognized
in pro r or loss. If, in a subsequent period, the fair value of a debt instrument classi ed as available for sale increases
and the increase can be objectively related to an event occurring after the impairment loss was recognized in pro t
or loss, the impairment loss is reversed, with the amount of the reversal recognized in pro t or loss. Impairment losses
for an investment in an equity instrument classi ed as available for sale are not reversed through pro t or loss.
2.3.12. Inventory
Inventories are assets:
• held for sale in the ordinary course of business,
• in the process of production for such sale, or
• in the form of materials or supplies to be consumed in the production process or in the rendering of services.
Raw materials and merchandise are measured initially at acquisition cost.
As at the end of the reporting period raw materials and merchandise are measured at the lower of cost and net
realizable value, considering any inventory allowances. Write-down to net realizable value concerns raw materials
and merchandise that are damaged or obsolete. A net realizable value is the estimated selling price in the ordinary
course of business less the estimated costs of completion and the estimated costs necessary to make the sale.
Raw materials held for use in the production of inventories are not written down below cost if the nished products
in which they will be incorporated are expected to be sold at or above cost. However, when a decline in the price
of materials indicates that the cost of the nished products exceeds net realizable value, the materials are written
down to net realizable value.
130

PKN
OR
LEN
SA
CA
PITA
L G
RO
UP
Exp
lan
ato
ry n
ote
s to
co
nso
lidat
ed
nan
cial
sta
tem
ents
fo
r th
e ye
ar e
nd
ed 3
1 d
ecem
ber
200
9 (a
ll am
ou
nts
in
PLN
th
ou
san
d)
131
The cost of usage of raw materials and merchandise is determined based on the weighted average acquisition cost
formula.
Finished goods and work in progress are measured initially at production cost. Production costs include costs of materi-
als and costs of conversion for the production period.
The production costs do not include:
• costs incurred as a consequence of low production or production losses,
• general and administrative expenses that are not directly attributable to bringing the inventories to the condition
and location at the moment of measurement,
• storage costs of nished goods and work in progress, unless these costs are necessary in the production process,
• distribution expenses.
For nished goods, the production costs comprise related xed and variable indirect costs for normal production levels.
As at the end of the reporting period nished goods and work in progress are measured at the lower of cost and net
realizable value.
The cost of usage of nished goods is determined based on the weighted average cost formula, based on production
cost in the particular reporting period.
2.3.13. Receivables
Trade and other receivables are recognized initially at the present value of the expected proceeds and are stated
in the subsequent periods at amortized cost using the effective interest method less impairment allowances.
The Group uses simpli ed methods of receivables measurement, if it does not distort information included in the -
nancial statements, particularly if the payment term of receivables is not long. Receivables, in relation to which sim-
pli ed methods are used, are measured initially at the amounts due and after initial recognition (including the end
of the reporting period) at the amounts due less allowances for doubtful receivables.
2.3.14. Cash and cash equivalents
Cash comprises cash on hand and in a bank account. Cash equivalents are Short-term highly liquid investments
(of initial maturity up to three months), that are readily convertible to known amounts of cash and which are subject
to an insigni cant risk of change in value.
The cash ows balance of cash and cash equivalents, presented in the consolidated statement of cash ows con-
sists of the above de ned monetary assets and their equivalents less bank overdrafts, if they form an integral part
of the Group’s cash management.
Valuation and out ows of cash and cash equivalents in foreign currencies are based on FIFO method (“First In, First Out”).
2.3.15. Non-current assets classi ed as held for sale
Non-current assets classi ed as held for sale are those which comply simultaneously with the following criteria:
• the sales were declared by the appropriate level of management,
• the assets are available for an immediate sale in their present condition,
• an active program to locate a buyer has been initiated,
• the sale transaction is highly probable and can be settled within 12 months following the sales decision,
• the selling price is reasonable in relation to its current fair value,
• it is unlikely that signi cant changes to the sales plan of these assets will be introduced.
The reclassi cation is re ected in the reporting period when the criteria are met. If the criteria are met after the end
of the reporting period, the asset is not reclassi ed at the end of the reporting year prior to the designation for sale.
Depreciation is discontinued for the asset when it is designated for sale.
131
PKN
OR
LEN
AN
NU
AL
REP
OR
T 20
09 •
CO
NSO
LID
ATE
D F
INA
NC
IAL
STA
TEM
ENTS
Exp
lan
ato
ry n
ote
s to
co
nso
lidat
ed
nan
cial
sta
tem
ents
fo
r th
e ye
ar e
nd
ed 3
1 d
ecem
ber
200
9 (a
ll am
ou
nts
in
PLN
th
ou
san
d)
132
Assets held for sale, excluding above all nancial assets and investment property, are measured at the lower of the car-
rying amount and the fair value less costs to sell.
In case of any subsequent increase in fair value less costs to sell of an asset, the Group recognizes a gain, but not
in excess of the cumulative impairment loss that has been recognized.
2.3.16. Equity
Equity is recorded by type, in accordance with legal regulations and the Company’s Articles of Association.
a) Share capital
The share capital is stated at nominal value in accordance with the Company’s Articles of Association and the entry
in the Commercial Register, except for shares issued before 1996. Those shares were adjusted using a general price
index in line with IAS 29.
Declared but not paid share capital is presented as outstanding share capital contributions. The Company’s own shares
and outstanding share capital contributions decrease the equity.
b) Share premium
Share premium is created by the surplus of the issuance value in excess of the nominal value of shares decreased
by issuance costs.
Issuance costs incurred by setting up a joint stock company or increasing the share capital decrease the share premium
to the amount of the surplus of the issuance value in excess of the nominal value of shares, and the remaining por-
tion is presented as retained earnings.
c) Changes in the fair value of cash ow hedges related to the portion regarded as an effective hedge
Such changes are recognized as hedging reserve.
d) Retained earnings
Retained earnings include:
• the amounts arising from pro t distribution,
• transfers from revaluation reserve (the difference between the fair value and the acquisition cost, net of deferred
tax, of assets available for sale is transferred to the revaluation reserve, if their price is determined on the regulated
active market or if their fair value may be reliably estimated by alternative methods),
• the undistributed result for prior periods,
• the current period net result,
• advance dividends paid,
• the effects of prior period errors.
2.3.17. Interest-bearing loans and borrowings
Interest-bearing loans and borrowings are initially stated at the fair value of proceeds received, net of transaction costs.
They are subsequently measured at amortized cost using the effective interest method. The difference between the net
proceeds and the buyout amount is recognized as nancial expenses or revenues over the term of the loan or borrowing.
The Group uses simpli ed methods of interest-bearing loans and borrowings measurement that are usually measured
at amortized cost, if it does not distort information included in the consolidated nancial statements, particularly
if the payment term of the loan or borrowing is not long. Interest-bearing loans and borrowings, in relation to which
simpli ed methods are used, are measured initially and after initial recognition (including the end of the reporting
period) at the amounts due.
132
PKN
OR
LEN
SA
CA
PITA
L G
RO
UP
Exp
lan
ato
ry n
ote
s to
co
nso
lidat
ed
nan
cial
sta
tem
ents
fo
r th
e ye
ar e
nd
ed 3
1 d
ecem
ber
200
9 (a
ll am
ou
nts
in
PLN
th
ou
san
d)
133
2.3.18. Provisions
A provision is a liability of uncertain timing or amount.
The Group recognizes a provision when it has a present obligation (legal or constructive) as a result of a past event
and it is probable that an out ow of resources embodying economic bene ts will be required to settle the obligation
and a reliable estimate can be made of the amount of the obligation.
The amount recognized as a provision is the best estimate of the expenditure required to settle the present obligation
at the end of the reporting period.
The provisions are reviewed at the end of each reporting period and adjusted to re ect the current best estimate.
The provision is reversed, if it is no longer probable that an out ow of resources embodying economic bene ts will
be required to settle the obligation. The provision is used only for expenditures for which the provision was originally
recognized.
When the effect of the time value of money is material, the amount of the provision is the present value of the ex-
penditure expected to be required to settle the obligation. If the discounting method is applied, the increase of provi-
sions with time is recognized as nancial expenses.
The provisions are created for the following titles (if recognition criteria mentioned above are met):
• environmental risk,
• jubilee bonuses, retirement and pension bene ts
• restructuring,
• legal proceedings.
Provisions are not recognized for the future operating losses.
a) Environmental provision
The Group creates provisions for future liabilities due to reclamation of contaminated land or water or elimination
of harmful substances if there is such a legal or constructive obligation. Environmental provision for reclamation
is periodically reviewed based on reports prepared by independent experts. The Group conducts regular reclamation
of contaminated land that decreases the provision by its utilization.
b) Provisions for jubilee bonuses, retirement and pension bene ts
Under the Group’s remuneration plans its employees are entitled to jubilee bonuses as well as retirement and pension
bene ts.
The jubilee bonuses are paid to employees after elapse of a de ned number of years in service. The retirement (pen-
sion) bene ts are paid once at retirement (pension). The amount of retirement and pension bene ts as well as jubilee
bonuses depends on the number of years of service and an employee’s average remuneration.
The jubilee bonuses are other long-term employee bene ts, whereas retirement and pension bene ts are classi ed
as post-employment bene t plans.
The provision for jubilee bonuses, retirement and pension bene ts is created in order to allocate costs to relevant periods.
The provisions equal to the present value of these liabilities are estimated at the end of each reporting year by an in-
dependent actuary and adjusted if there are any material indications impacting the value of the liabilities.
The accumulated liabilities equal discounted future payments, considering employee rotation, planned increase of re-
muneration and relate to the period ended at the last day of the reporting year.
Actuarial gains and losses are recognized in pro t or loss.
c) Restructuring provision
Provision for restructuring is created when the Company has a detailed formal plan for the restructuring and the re-
structuring process has been started or has been announced in public. A restructuring provision includes only the di-
133
PKN
OR
LEN
AN
NU
AL
REP
OR
T 20
09 •
CO
NSO
LID
ATE
D F
INA
NC
IAL
STA
TEM
ENTS
Exp
lan
ato
ry n
ote
s to
co
nso
lidat
ed
nan
cial
sta
tem
ents
fo
r th
e ye
ar e
nd
ed 3
1 d
ecem
ber
200
9 (a
ll am
ou
nts
in
PLN
th
ou
san
d)
134
rect expenditures arising from the restructuring, such as costs of redundancy of employees (redundancy payments
and compensations paid), termination of tenancy and lease agreements, dismantling of assets.
d) Legal proceedings provision
Legal proceedings provision is recognized after consideration of all available evidence, including legal opinions.
If, on the basis of this evidence:
• it is more likely than not that a present obligation exists at the end of the reporting period, the provision should be
recognized (only when other recognition criteria are met),
• it is unlikely that a present obligation exists at the end of the reporting period, the information about contingent
liability should disclosed, unless the probability of an out ow of resources embodying economic bene ts is remote.
Provisions are not recognized for the future operating losses.
2.3.19. Liabilities
Trade and other liabilities are stated at amortized cost using the effective interest method. The Group uses simpli ed
methods of liabilities measurement, including nancial liabilities that are usually measured at amortized cost, if it does
not distort information included in the consolidated nancial statements, particularly if the payment term of liabilities
is not long. Liabilities, including nancial liabilities, in relation to which simpli ed methods are used, are measured
initially and after initial recognition (including the end of the reporting period) at the amounts due.
2.3.20. Government grants
The government grants are recognized at fair value if there is reasonable assurance that the grant will be obtained
and the entity will comply with the conditions attached to it.
If the grant relates to a given income, it is recognized as income over the period necessary to match it with the related
costs which the grant is intended to compensate.
If the grant concerns particular asset, its fair value is recognized as deferred income and on a systematic basis recorded
as revenue over the estimated useful life of the underlying asset.
2.3.21. Operating segments
An operating segment is a component of an entity:
• that engages in business activities from which it may earn revenues and incur expenses (including revenues and ex-
penses relating to transactions with other components of the same entity);
• whose operating results are regularly reviewed by the entity’s chief operating decision maker to make decisions
about resources to be allocated to the segment and assess its performance, and
• for which discrete nancial information is available.
The operations of the Group are divided into:
• the Re ning Segment which includes re nery products processing and wholesale, oil production and sale as well
as supporting production,
• the Retail Segment which includes sales at petrol stations,
• the Petrochemical Segment which includes the production and wholesale of petrochemicals and production and sale
of chemicals, and
• Corporate functions which is a reconciling item including activities related to management and administration
and other support functions as well as the remaining activities not allocated to separate segments.
Segment revenues are revenues reported in the consolidated statement of comprehensive income that are directly at-
tributable to a segment and the relevant portion of revenues that can be allocated on a reasonable basis to a segment,
including revenues from sales to external customers and revenues from transactions with other segments.
134
PKN
OR
LEN
SA
CA
PITA
L G
RO
UP
Exp
lan
ato
ry n
ote
s to
co
nso
lidat
ed
nan
cial
sta
tem
ents
fo
r th
e ye
ar e
nd
ed 3
1 d
ecem
ber
200
9 (a
ll am
ou
nts
in
PLN
th
ou
san
d)
135
Segment expenses are expenses resulting from the operating activities of a segment that are directly attributable
to the segment and the relevant portion of expenses that can be allocated on a reasonable basis to the segment,
including expenses relating to sales to external customers and expenses relating to transactions with other segments.
Segment expenses do not include:
• income tax expense,
• interest, including interest incurred on advances or loans from other segments, unless the segment’s operations are
primarily of a nancial nature,
• losses on sales of investments or losses on extinguishment of debt unless the segment’s operations are primarily
of a nancial nature,
• general and administrative expenses and other expenses arising at the level of the Group as a whole, unless they
are directly attributable to the segment and can be allocated to the segment on a reasonable basis.
Segment assets are those operating assets that are employed by that segment in operating activity and that are either
directly attributable to the segment or can be allocated to the segment on a reasonable basis. Particularly segment
assets and liabilities do not include assets connected with income tax.
The revenues, result, assets of a given segment are de ned before inter-segment adjustments are made, after adjust-
ments within a given segment.
Sales prices used in transactions between segments are close to market prices.
2.3.22. Contingent liabilities and contingent assets
Contingent liabilities are not recognized in the consolidated statement of nancial position however the information
on contingent liabilities is disclosed in the consolidated nancial statements unless the probability of out ow of re-
sources embodying to economic bene ts is remote.
A contingent asset is a possible asset that arises from past events and whose existence will be con rmed only by the oc-
currence or non-occurrence of one or more uncertain future events not wholly within the control of the Group.
Contingent assets are not recognized in the consolidated statement of nancial position, however the respective infor-
mation on the contingent asset is disclosed in the nancial statements if the in ow of economic bene ts is probable.
2.3.23. Revenues
a) Revenues from sales
Revenues from sale are recognized when the amount of revenue can be measured reliably, it is probable that
the economic bene ts associated with the sale transaction will ow to the Group and the costs incurred or to be
incurred in respect of the transaction can be measured reliably. Revenues from sale of nished goods, merchandise,
and raw materials are recognized when the Group has transferred to the buyer the signi cant risks and rewards
of ownership of the goods. Revenues include received or due payments for delivered goods or merchandise decreased
by the amount of any trade discounts, value added tax (VAT), excise tax and fuel charges. Revenues are measured
at fair value of the received or due payments. Revenues realized on settlement of nancial instruments hedging cash
ows adjust revenues from sale.
Revenues and costs concerning rendering of services, whose beginning and end fall within different reporting peri-
ods, are recognized by reference to the stage of completion of the contract, when the outcome of a contract can
be estimated reliably, it is probable that the economic bene ts will ow to the Group and the stage of contract
completion can be measured reliably. When these conditions are not met, revenue is recognized only to the extent
of the expenses recognized that are recoverable.
b) Revenues from licenses, royalties and trade mark – recognized on an accrual basis in accordance with the sub-
stance of the relevant agreements. Prepayments, referring to agreements concluded in the current period by the Group
are recognized as deferred income and settled in the periods when economic bene ts are realized according
to the agreements.
135

PKN
OR
LEN
AN
NU
AL
REP
OR
T 20
09 •
CO
NSO
LID
ATE
D F
INA
NC
IAL
STA
TEM
ENTS
Exp
lan
ato
ry n
ote
s to
co
nso
lidat
ed
nan
cial
sta
tem
ents
fo
r th
e ye
ar e
nd
ed 3
1 d
ecem
ber
200
9 (a
ll am
ou
nts
in
PLN
th
ou
san
d)
136
c) Franchise revenues – recognized in accordance with the substance of the relevant agreement, in a way re ecting
the reason of charging with franchise fees.
2.3.24. Costs
The Group recognizes costs in accordance with accrual basis and prudence.
a) Cost of sales – it comprises costs of nished goods sold and costs of services sold, including services of support
functions and cost of merchandise and raw materials sold.
b) Distribution expenses – they include selling brokerage expenses, trading expenses, advertising and promotion ex-
penses as well as distribution expenses.
c) General and administrative expenses – they include expenses relating to management and administration of the Group
as a whole.
2.3.25. Other operating revenues and expenses
Other operating revenues refer to operating revenues, in particular relating to revenues from liquidation and sale
of non- nancial Non-current assets, surplus of assets, return of court fees, penalties earned, grants other than those
for construction in progress, acquisition of xed assets and the execution of development work, property assets received
free of charge, reversal of receivable impairment allowances and provisions, compensations earned, revaluation gains
and revenues on disposal of investment property.
Other operating costs refer to operating costs, in particular relating to costs of liquidation and sale of non- nancial
Non-current assets, shortages of assets, court fees, contractual penalties and nes, penalties for non-compliance with
environmental protection regulations, cash and property assets granted free of charge, impairment allowances (except
those that are recognized as nancial expenses), compensations paid, write-off of construction in progress which have
not produced the desired economic effect, research costs, cost of recovery of receivables and liabilities, revaluation
losses and cost of investment property sold.
2.3.26. Financial revenues and expenses
Financial revenues include, in particular, revenues from the sale of shares and other securities, dividends received,
interest earned on cash in bank accounts, term deposits and loans granted, increase in the value of nancial assets
and foreign exchange gains.
Financial costs include, in particular, cost of shares and securities sold and costs associated with such sale, impairment
losses relating to nancial assets such as shares, securities and interest receivables, foreign exchange losses, interest
on bonds and other securities issued, interest on nance lease, commissions on bank loans, borrowings, guarantees,
interest costs.
2.3.27. Income tax expense
Income tax comprises current tax and deferred tax.
Current tax is determined in accordance with the relevant tax law based on the taxable pro t for a given period.
Current tax liabilities represent the amounts payable at the reporting date. If the amount of the current income tax
paid exceeds the amount due the excess is recognized as a receivable.
Deferred tax assets are recognized for deductible temporary differences, unrealized tax losses and unrealized tax relieves.
Deferred tax liabilities are recognized for taxable temporary differences.
Deductible temporary differences are temporary differences that will result in reducing taxable amounts of future periods
when the carrying amount of the asset or liability is recovered or settled. Deductible temporary differences arise when
the carrying amount of an asset is lower than its tax base or when the carrying amount of a liability is higher than
its tax base. Deductible temporary differences may also arise in connection with items not recognized in the accounting
records as assets or liabilities. Tax base is determined in relation to expected recovery of assets or settlement of liabilities.
136

PKN
OR
LEN
SA
CA
PITA
L G
RO
UP
Exp
lan
ato
ry n
ote
s to
co
nso
lidat
ed
nan
cial
sta
tem
ents
fo
r th
e ye
ar e
nd
ed 3
1 d
ecem
ber
200
9 (a
ll am
ou
nts
in
PLN
th
ou
san
d)
137
Taxable temporary differences are temporary differences that will result in increasing taxable amounts of future periods
when the carrying amount of the asset or liability is recovered or settled. Taxable temporary differences arise when
the carrying amount of an asset is higher than its tax base or when the carrying amount of a liability is lower than
its tax base. Taxable temporary differences may also arise in connection with items not recognized in the accounting
records as assets or liabilities. Tax base is determined in relation to expected recovery of assets or settlement of liabilities.
The Company does not recognize deferred tax assets and deferred tax liabilities for temporary differences resulting
from the initial recognition of an asset or liability in a transaction which is not a business combination, and, at the time
of the transaction, affects neither accounting pro t nor taxable pro t (tax loss). A deferred tax liability is not recognized
for goodwill, whose amortization is not a tax deductible cost.
The deferred tax assets and liabilities are measured at the end of each reporting period using enacted tax rates binding
for the year in which the tax obligation arises, based on tax rates published in tax law.
Deferred tax assets are recognized to the extent that it is probable that taxable pro t will be available against which
the deductible temporary difference can be utilized (impairment analysis of deferred tax assets at the end of each
reporting period).
Deferred tax assets and liabilities are not discounted.
Deferred tax assets and liabilities relating to transactions recognized in other comprehensive income are recognized
in other comprehensive income.
Deferred tax assets and liabilities are accounted for as Non-current assets or long-term liabilities in the statement
of nancial position.
Deferred tax assets and liabilities are offset in the consolidated statement of nancial position, if the Group has a legally
enforceable right to set off the recognized amounts. It is assumed that a legally enforceable right exists if the amounts
concern the same tax payer (including capital tax group), except for amounts taxed based on lump sum method
or in a similar way, if tax law does not allow to offset them with tax determined according to general rules.
2.3.28. Earnings per share
Basic earnings per share are calculated by dividing the net pro t for a given period attributable to ordinary equity
holders by the weighted average number of ordinary shares outstanding during the period.
Diluted earnings per share for each period are calculated by dividing the net pro t for a given period adjusted by changes
of the net pro t resulting from conversion of the dilutive potential ordinary shares by the adjusted weighted average
number of ordinary shares.
2.3.29. Exploration and extraction of hydrocarbons
For exploration and extraction of hydrocarbons activity the Group applies accounting principles based on Successful
Efforts Method.
The stages of exploration and extraction of hydrocarbons activity are classi ed in the following way:
• preliminary stage of assessment;
• acquisition of rights to explore and extract;
• exploration of resources;
• recognition of resources;
• resource site planning;
• exploitation of resources.
All expenditures related to the preliminary stage of assessment are recognized in pro t or loss when incurred.
Cost incurred for acquisition of rights to explore and extract are recognized as intangible assets. General and admin-
istrative expenses that may be directly attributed to the purchase transaction of exploration/extraction rights should
137

PKN
OR
LEN
AN
NU
AL
REP
OR
T 20
09 •
CO
NSO
LID
ATE
D F
INA
NC
IAL
STA
TEM
ENTS
Exp
lan
ato
ry n
ote
s to
co
nso
lidat
ed
nan
cial
sta
tem
ents
fo
r th
e ye
ar e
nd
ed 3
1 d
ecem
ber
200
9 (a
ll am
ou
nts
in
PLN
th
ou
san
d)
138
increase the purchase price of an asset. If direct allocation of costs to the purchase transaction of exploration/extraction
rights is not possible, indirect expenses are recognized in pro t or loss when incurred.
Cost of exploration and recognition
• Cost incurred for each exploratory drilling is initially recognized as construction in progress. If the exploratory drilling
is unsuccessful, the cost previously recognized as an asset is included in pro t or loss;
• Cost incurred for each appraisal drilling is initially recognized as construction in progress. If the appraisal is unsuc-
cessful, the cost previously recognized as an asset (including cost incurred in exploration stage) is included in pro t
or loss. If the appraisal is successful, the cost incurred for all appraisal drillings (including unsuccessful drillings in hy-
drocarbons resource, that was recognized as an asset) is transferred to property, plant and equipment at the date
of put into use;
• Other cost incurred at the exploration and recognition stage is initially recognized as intangible assets under develop-
ment or construction in progress, depending on the type of cost incurred. If the exploration and recognition stage
ends without success other cost incurred previously recognized as an asset is included in pro t or loss;
• When the commercial viability and technical feasibility of a resource is con rmed, the Group de nes cash generating
unit. It is assumed that cash generating unit will be de ned as hydrocarbons resource;
• General and administrative expenses that can be directly attributed to the exploration and recognition stage should
be recognized as an asset and included in previously de ned cash generating unit. If cost cannot be allocated,
it is included in pro t or loss when incurred.
Cost incurred for resource site planning are recognized as an asset and included in previously de ned cost generating
unit. General and administrative expenses that can be directly attributed to the resource site planning stage should
be recognized as an asset and included in previously de ned cost generating unit. If cost cannot be allocated, it is in-
cluded in pro t or loss when incurred.
Cost directly attributed to hydrocarbons resource exploitation is included in the consolidated statement of comprehen-
sive income as the cost of the current period.
Depreciation of Non-current assets used for exploration and exploitation activity is calculated proportionally to the amount
of extracted hydrocarbons, using unit of production method. If the unit of production method is not possible to apply
(e.g. because of lack of information regarding total amount of hydrocarbons or using of assets on multiple stages of ex-
ploration or exploitation) other depreciation method, that most reliably re ects the economical usage, can be applied.
The Group creates provisions for the cost of removal of drillings and supporting infrastructure. The amount of the pro-
vision for future dismantling and land reclamation is initially recognized as a provision and as a part of initial value
of an asset at the date of put into use.
The amount of created provisions is veri ed at the end of each reporting period and adjusted to re ect the current knowl-
edge as at that date. The increase in the provision due to the passage of time (due to discounting) is recognized as a -
nancial expense in the statement of comprehensive income. Changes in the provision due to assessment of cost, change
of discount rate, change of date of removal/ reclamation adjust the book value of a provision and book value of an asset.
The Group performs impairment tests of assets used in exploration and exploitation activity, both for proved and un-
proved assets/resources.
The impairment assessment is performed by the Group for assets/resources proved and unproved on the level of cash
generating unit de ned as hydrocarbons resource.
2.3.30. Foreign currency transactions
A foreign currency transaction is recorded, on initial recognition in the functional currency, by applying to the for-
eign currency amount the spot exchange rate between the functional currency and the foreign currency at the date
of the transaction.
The functional currency of the Group is Polish Zloty.
138

PKN
OR
LEN
SA
CA
PITA
L G
RO
UP
Exp
lan
ato
ry n
ote
s to
co
nso
lidat
ed
nan
cial
sta
tem
ents
fo
r th
e ye
ar e
nd
ed 3
1 d
ecem
ber
200
9 (a
ll am
ou
nts
in
PLN
th
ou
san
d)
139
At the end of the reporting period:
• foreign currency monetary items including units of currency held by the Group as well as receivables and liabilities due
in de ned or de nable units of currency are translated using the closing rate, i.e. spot exchange rate as at the end
of the reporting period,
• non-monetary items that are measured at historical cost in a foreign currency are translated using the exchange rate
at the date of the transaction; and
• non-monetary items that are measured at fair value in a foreign currency are translated using the exchange rates
at the date when the fair value was determined.
Exchange differences arising on the settlement of monetary items or on translating monetary items at rates different
from those at which they were translated on initial recognition during the period or in previous nancial statements
are recognized in pro t or loss in the period in which they arise in the net amount, except for monetary items hedging
currency risk, that are accounted for in accordance with cash ows hedge accounting.
Methods applied to translation of data denominated in foreign currencies:
The consolidated nancial statements of foreign entities, for consolidation purposes, are translated into PLN using
the following methods:
The nancial data denominated in EUR was translated in line with the following methods:
• particular assets and liabilities – at the closing rate for 31 December 2009 – 4.1082 PLN/EUR and for 31 Decem-
ber 2008 – 4.1724 PLN/EUR,
• particular items of statement of statement of comprehensive income and statement of cash ows are translated
on the quarterly basis. The average exchange rate for the period from 1 January 2009 to 31 December 2009 –
4.3406 PLN/EUR. For the period from 1 January 2008 to 31 December 2008 the rate was 3.5321 PLN/EUR.
The nancial data denominated in CZK was translated in line with the following methods:
• particular assets and liabilities – at the closing rate for 31 December 2009 – 0.1554 PLN/CZK and for 31 Decem-
ber 2008 – 0.1566 PLN/CZK,
• particular items of statement of statement of comprehensive income and statement of cash ows are translated
on the quarterly basis. The average of exchange rates for the period from 1 January 2009 to 31 December 2009 –
0.1639 PLN/CZK. For the period from 1 January 2008 to 31 December 2008 the rate was 0.1411 PLN/CZK.
The nancial data denominated in USD was translated in line with the following methods:
• particular assets and liabilities – at the closing rate for 31 December 2009 – 2.8503 PLN/USD and for 31 Decem-
ber 2008 – 2.9618 PLN/USD,
• particular items of statement of statement of comprehensive income and statement of cash ows are translated
on the quarterly basis. The average of exchange rates for the period from 1 January 2009 to 31 December 2009 –
3.1236 PLN/USD. For the period from 1 January 2008 to 31 December 2008 the rate was 2.4115 PLN/USD.
2.3.31. The Consolidated Statement of Cash ows
The consolidated statement of cash ows is prepared using indirect method.
Cash and cash equivalents presented in the consolidated statement of cash ows include cash and cash equivalents
less bank overdrafts, if they form an integral part of the Group’s cash management.
Dividends received are presented in cash ows from investing activities. Dividends paid are presented in cash ows
from nancing activities.
Interest paid on bank loans and borrowings received, debt securities issued, nance leases are presented in cash ows
from nancing activities. Other interest paid is presented in cash ows from operating activities.
Interest received from nance leases, loans granted and Short-term securities are presented in cash ows from invest-
ing activities. Other interest received is presented in cash ows from operating activities.
Cash ows from corporate income tax are presented in cash ows from operating activities.
139
PKN
OR
LEN
AN
NU
AL
REP
OR
T 20
09 •
CO
NSO
LID
ATE
D F
INA
NC
IAL
STA
TEM
ENTS
Exp
lan
ato
ry n
ote
s to
co
nso
lidat
ed
nan
cial
sta
tem
ents
fo
r th
e ye
ar e
nd
ed 3
1 d
ecem
ber
200
9 (a
ll am
ou
nts
in
PLN
th
ou
san
d)
140
2.3.32. Changes in accounting policies, estimates, prior periods’ errors
The Group changes an accounting policy only if the change:
• is required by change in the accounting law;
• results in the consolidated nancial statements providing reliable and more relevant information about the effects
of transactions, other events or conditions on the Group’s nancial position, nancial performance or cash ows.
Changes in accounting policies are applied retrospectively. The related adjustments are presented in equity – in retained
earnings. To ensure that data are comparable the Group adjusts appropriately the nancial statements for the previous
years (comparative data) as if the new accounting policy had always been applied.
Estimates are revised if changes occur in the circumstances on which an estimate was based or as a result of new
information, development of a situation or gaining more experience.
The prior period errors are corrected by the equity – retained earnings. When preparing the consolidated nancial
statements, the assumption is made that the error was corrected in the period, in which it was made. It means that
the amount of the correction relating to the prior period should be included in the consolidated statement of com-
prehensive income of that period.
3. THE MANAGEMENT BOARD ESTIMATES AND ASSUMPTIONS
The preparation of nancial statements in accordance with IFRSs requires that the Management Board makes expert
estimates and assumptions that affect the adopted methods and presented amounts of assets, liabilities, revenues
and expenses. The estimates and related assumptions are based on historical expertise and other factors regarded
as reliable in given circumstances and their effects provide grounds for expert assessment of the carrying amount
of assets and liabilities which is not based directly on any other factors.
In the matters of considerable weight, the Management Board bases its estimates on opinions of independent experts.
Actual results may differ from the estimated values.
The estimates and related assumptions are veri ed on a regular basis. Changes in accounting estimates are recognized
in the period when they are made only if they refer to that period or in the present and future periods if they concern
both the present and future periods.
Judgments, which have a signi cant impact on carrying amounts recognized in the consolidated nancial statements
were disclosed in the following notes:
• Investment property classi cation (note 7),
• Non-current assets classi ed as held for sale (note 17),
• Financial instruments classi cation, the use of hedge accounting, methods of fair value measurement concerning
nancial instruments, nature and extent of risks related to nancial instruments (note 31),
• Leases classi cation (note 32).
Estimates and assumptions, which have a signi cant impact on carrying amounts recognized in the consolidated
nancial statements were disclosed in the following notes:
• Impairment of property, plant and equipment, intangible assets, goodwill, inventory, trade and other receivables
(notes 6, 8, 9, 11, 13,14),
• Provisions and post-employment bene ts (note 20),
• Contingent assets, liabilities and risks (note 38).
140

PKN
OR
LEN
SA
CA
PITA
L G
RO
UP
Exp
lan
ato
ry n
ote
s to
co
nso
lidat
ed
nan
cial
sta
tem
ents
fo
r th
e ye
ar e
nd
ed 3
1 d
ecem
ber
200
9 (a
ll am
ou
nts
in
PLN
th
ou
san
d)
141
4. ENTITIES CONSOLIDATED USING FULL AND PROPORTIONATE METHOD
These consolidated nancial statements for the years 2009 and 2008 include the following Group entities located
mainly in Poland, Germany, Lithuania and the Czech Republic:
Name of the Capital Group
Share in total voting rights1)
Parent company 31.12.2009 31.12.2008consolidation
methodoperating segment
PKN ORLEN Parent company multisegment
ORLEN Deutschland GmbH PKN ORLEN 100% 100% full retail
ORLEN Gaz Sp. z o.o. PKN ORLEN 100% 100% full re ning
ORLEN PetroCentrum Sp. z o.o. PKN ORLEN 100% 100% full re ning
ORLEN Medica Sp. z o.o. PKN ORLEN 100% 100% full CF
ORLEN Budonaft Sp. z o.o. PKN ORLEN 100% 100% full retail
ORLEN Powiernik Sp. z o.o.2) PKN ORLEN – 100% full CF
ORLEN Koltrans Sp. z o.o. PKN ORLEN 100% 100% full re ning
ORLEN Transport SA PKN ORLEN 100% 100% full re ning
ORLEN Asfalt Sp. z o.o.(dawniej Bitrex Sp. z o.o.) PKN ORLEN
100% / (95.99%)6)
100% / (95.99%)6) full re ning
ORLEN Laboratorium Sp. z o.o. PKN ORLEN 95% 95% full CF
Grupa Kapita³owa ORLEN Oil Sp. z o.o.PKN ORLEN
100% / (88.87%)6)
100% / (88.87%)6) full re ning
ORLEN Oil Cesko s.r.o. ORLEN Oil 100% 100% full re ning
Platinum Oil Sp. z o.o. (dawniej Petro-Oil Lubelskie Centrum Sprzeda¿y Sp. z o.o.) ORLEN Oil 100% 100% full re ning
Petro-Oil PomorskieCentrum Sprzeda¿y Sp. z o.o. PLATINIUM Oil 100% 100% full re ning
Petro-Oil Śl¹skieCentrum Sprzeda¿y Sp. z o.o.3) PLATINIUM Oil 100% – full re ning
ORLEN Petrotank Sp. z o.o. PKN ORLEN 100% 100% full re ning
Grupa Kapita³owa Anwil SA PKN ORLEN 85% 85% full petrochemical
Przedsiebiorstwo Inwestycyjno--Remontowe Remwil Sp. z o.o. ANWIL SA 100% 100% full petrochemical
Przedsiebiorstwo Produkcyjno-Handlowo--Us³ugowe Pro-Lab Sp. z o.o. ANWIL SA 99% 99% full petrochemical
Przedsiêbiorstwo Us³ug Specjalistycznych i Projektowych Chemeko Sp. z o.o. ANWIL SA 56% 56% full petrochemical
Spolana a.s. ANWIL SA 100% 100% full petrochemical
Grupa Kapita³owa Ra neria Trzebinia SA PKN ORLEN 77% 77% full re ning
Energomedia Sp. z o.o. Ra neria Trzebinia SA 100% 100% full re ning
Euronaft Trzebinia Sp. z o.o. Ra neria Trzebinia SA 100% 100% full re ning
Fabryka Para n Naftowax Sp. z o.o. Ra neria Trzebinia SA 100% 100% full re ning
EkoNaft Sp. z o.o. Ra neria Trzebinia SA 99% 99% full re ning
Grupa Kapita³owa Ra neria Nafty Jedlicze SA PKN ORLEN 75% 75% full re ning
RAF-KOLTRANS Sp. z o.o. Ra neria Nafty Jedlicze SA 100% 100% full re ning
Konsorcjum Olejów Przepracowanych – Organizacja Odzysku SA
Ra neria Nafty Jedlicze SA 81% 81% full re ning
Inowroc³awskie Kopalnie Soli „Solino” SA PKN ORLEN 71% 71% full re ning
Grupa Kapita³owa Unipetrol a.s. PKN ORLEN 63% 63% full multisegment
141
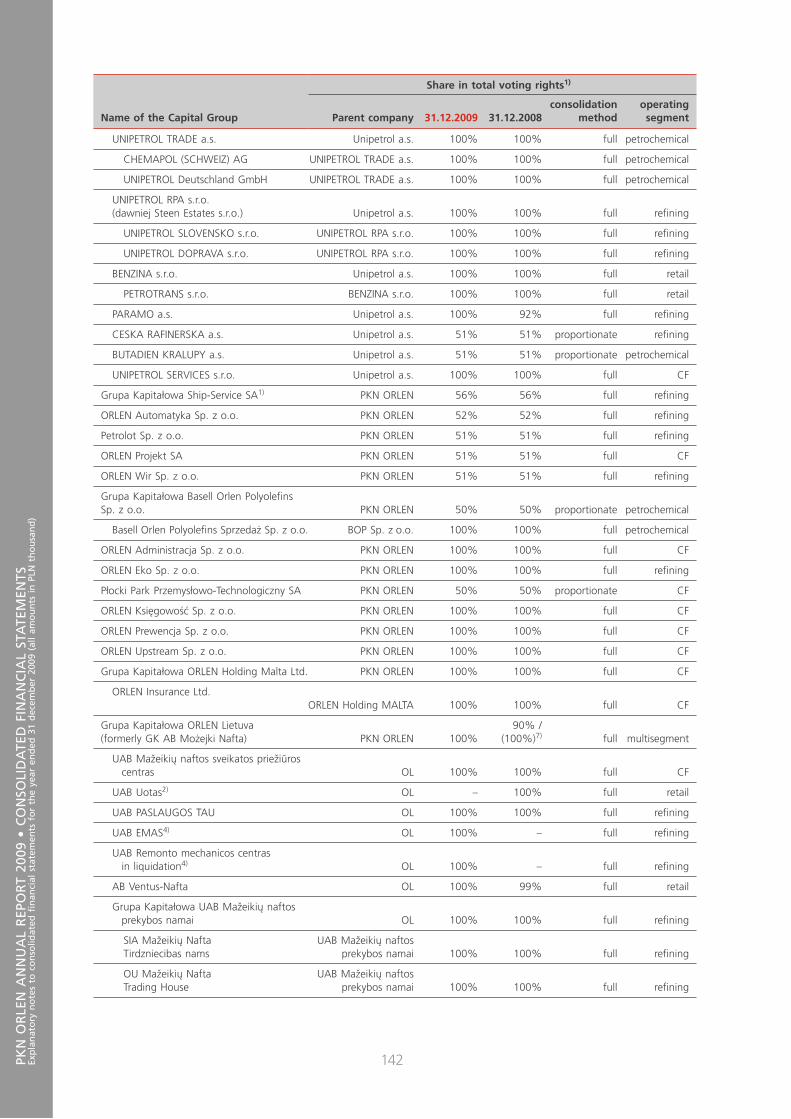
PKN
OR
LEN
AN
NU
AL
REP
OR
T 20
09 •
CO
NSO
LID
ATE
D F
INA
NC
IAL
STA
TEM
ENTS
Exp
lan
ato
ry n
ote
s to
co
nso
lidat
ed
nan
cial
sta
tem
ents
fo
r th
e ye
ar e
nd
ed 3
1 d
ecem
ber
200
9 (a
ll am
ou
nts
in
PLN
th
ou
san
d)
142
Name of the Capital Group
Share in total voting rights1)
Parent company 31.12.2009 31.12.2008consolidation
methodoperating segment
UNIPETROL TRADE a.s. Unipetrol a.s. 100% 100% full petrochemical
CHEMAPOL (SCHWEIZ) AG UNIPETROL TRADE a.s. 100% 100% full petrochemical
UNIPETROL Deutschland GmbH UNIPETROL TRADE a.s. 100% 100% full petrochemical
UNIPETROL RPA s.r.o.(dawniej Steen Estates s.r.o.) Unipetrol a.s. 100% 100% full re ning
UNIPETROL SLOVENSKO s.r.o. UNIPETROL RPA s.r.o. 100% 100% full re ning
UNIPETROL DOPRAVA s.r.o. UNIPETROL RPA s.r.o. 100% 100% full re ning
BENZINA s.r.o. Unipetrol a.s. 100% 100% full retail
PETROTRANS s.r.o. BENZINA s.r.o. 100% 100% full retail
PARAMO a.s. Unipetrol a.s. 100% 92% full re ning
CESKA RAFINERSKA a.s. Unipetrol a.s. 51% 51% proportionate re ning
BUTADIEN KRALUPY a.s. Unipetrol a.s. 51% 51% proportionate petrochemical
UNIPETROL SERVICES s.r.o. Unipetrol a.s. 100% 100% full CF
Grupa Kapita³owa Ship-Service SA1) PKN ORLEN 56% 56% full re ning
ORLEN Automatyka Sp. z o.o. PKN ORLEN 52% 52% full re ning
Petrolot Sp. z o.o. PKN ORLEN 51% 51% full re ning
ORLEN Projekt SA PKN ORLEN 51% 51% full CF
ORLEN Wir Sp. z o.o. PKN ORLEN 51% 51% full re ning
Grupa Kapita³owa Basell Orlen Polyole ns Sp. z o.o. PKN ORLEN 50% 50% proportionate petrochemical
Basell Orlen Polyole ns Sprzeda¿ Sp. z o.o. BOP Sp. z.o.o. 100% 100% full petrochemical
ORLEN Administracja Sp. z o.o. PKN ORLEN 100% 100% full CF
ORLEN Eko Sp. z o.o. PKN ORLEN 100% 100% full re ning
P³ocki Park Przemys³owo-Technologiczny SA PKN ORLEN 50% 50% proportionate CF
ORLEN Ksiêgowośæ Sp. z o.o. PKN ORLEN 100% 100% full CF
ORLEN Prewencja Sp. z o.o. PKN ORLEN 100% 100% full CF
ORLEN Upstream Sp. z o.o. PKN ORLEN 100% 100% full CF
Grupa Kapita³owa ORLEN Holding Malta Ltd. PKN ORLEN 100% 100% full CF
ORLEN Insurance Ltd.ORLEN Holding MALTA 100% 100% full CF
Grupa Kapita³owa ORLEN Lietuva(formerly GK AB Mo¿ejki Nafta) PKN ORLEN 100%
90% / (100%)7) full multisegment
UAB Mažeikių naftos sveikatos priežiūros centras OL 100% 100% full CF
UAB Uotas2) OL – 100% full retail
UAB PASLAUGOS TAU OL 100% 100% full re ning
UAB EMAS4) OL 100% – full re ning
UAB Remonto mechanicos centras in liquidation4) OL 100% – full re ning
AB Ventus-Nafta OL 100% 99% full retail
Grupa Kapita³owa UAB Mažeikių naftos prekybos namai OL 100% 100% full re ning
SIA Mažeikių NaftaTirdzniecibas nams
UAB Mažeikių naftos prekybos namai 100% 100% full re ning
OU Mažeikių NaftaTrading House
UAB Mažeikių naftos prekybos namai 100% 100% full re ning
142

PKN
OR
LEN
SA
CA
PITA
L G
RO
UP
Exp
lan
ato
ry n
ote
s to
co
nso
lidat
ed
nan
cial
sta
tem
ents
fo
r th
e ye
ar e
nd
ed 3
1 d
ecem
ber
200
9 (a
ll am
ou
nts
in
PLN
th
ou
san
d)
143
Name of the Capital Group
Share in total voting rights1)
Parent company 31.12.2009 31.12.2008consolidation
methodoperating segment
Mažeikių Nafta Trading House Sp. z o.o.
UAB Mažeikių naftos prekybos namai 100% 100% full re ning
ORLEN Finance AB (formerly Aktiebolaget Grundstenen 108770) PKN ORLEN 100% 100% full CF
ORLEN InternationalExploration & Production Company BV PKN ORLEN 100% 100% full CF
ORLEN Ochrona Sp. z o.o.5) PKN ORLEN 100% – full CF
ORLEN Centrum Serw isowe Sp. z o.o.5) PKN ORLEN 99% – full CF
1) Share in total voting rights is equal to share in equity, except for share in equity of Capital Group of Ship-Service SA, where it accounts
for to 61%.2) Entities liquidated in the IV quarter 2009.3) Entity consolidated using full method from IV quarter 2009.4) Entities founded in the I quarter 2009.5) Entities consolidated using full method from II quarter 2009.6) (%) share in consolidated nancial data.7) (%) share used for the purpose of preparation of the consolidated nancial statements of PKN ORLEN Group taking into account purchase
option of Mažeikių shares in the amount of PLN 842,485 thousand increasing the Parent’s share in equity.* CF – Corporate Functions.
5. OPERATING SEGMENTS
In accordance with new requirements concerning segment reporting implemented on 1 January 2009 by IFRS 8 –
Operating Segments, the Capital Group PKN ORLEN presents a new segment division.
The Group’s activities are allocated to:
• the Re ning Segment – re nery products processing and wholesale, oil production and sale as well as supporting
production
• the Retail Segment – sale at petrol stations
• the Petrochemical Segment – production and sale of petrochemicals and chemicals,
• Corporate Functions.
Corporate Functions are a reconciling position (note 2.3.21).
The allocation of companies of the Capital Group PKN ORLEN to operating segments is presented in the note 4.
The most signi cant changes in comparison to previously presented segment division:
• wholesale and logistics, previously presented in the Re ning Segment, were divided in adequate values into the Re-
ning and Petrochemical Segment,
• sale at petrol stations, previously presented in the Re ning Segment, is presented as one separate segment,
• support functions, previously presented in other operations, was allocated to adequate segments (regarding the kind
of provided services),
• Corporate Functions include all activities related to management, administration and other support functions, as well
as other activities unallocated to other segments.
Accounting principles used in reportable segments are in line with the Group accounting principles, described in the
note 2.3. The segment’s pro t is the pro t generated by respective segments without the allocation of central admin-
istration costs and remuneration of the Management Board, share in pro t of associates, nancial revenues and ex-
penses, as well as income tax expenses. This information is passed on to chief operating decision makers responsible
for allocation of resources and evaluation of segment results.
143

PKN
OR
LEN
AN
NU
AL
REP
OR
T 20
09 •
CO
NSO
LID
ATE
D F
INA
NC
IAL
STA
TEM
ENTS
Exp
lan
ato
ry n
ote
s to
co
nso
lidat
ed
nan
cial
sta
tem
ents
fo
r th
e ye
ar e
nd
ed 3
1 d
ecem
ber
200
9 (a
ll am
ou
nts
in
PLN
th
ou
san
d)
144
Transactions between segments are arm’s length transactions. Revenues from transactions with external parties
presented to the Management Board are measured coherently to the method used in the consolidated statement
of comprehensive income.
The Management Board evaluates the results of segment activities based on the segment EBIT.
5.1. Revenues and nancial result by segment
Data concerning revenues and nancial result by segment for the year ended 31 December 2009
Re ning Segment
for the year ended
31.12.2009
RetailSegment
for the year ended
31.12.2009
PetrochemicalSegment
for the year ended
31.12.2009
Corporate Functions
for the year ended
31.12.2009
Adjustmentsfor the year
ended31.12.2009
Totalfor the year
ended31.12.2009
Sales to external customers 36,569,602 22,383,703 8,877,040 97,645 67,927,990
Transactions with other segments 13,525,606 92,372 4,178,774 181,375 (17,978,127) –
Total sales revenues 50,095,208 22,476,075 13,055,814 279,020 (17,978,127) 67,927,990
Total operating expenses* (49,084,705) (21,558,413) (13,321,873) (874,269) 17,978,152 (66,861,108)
Other operating revenues 686,034 102,181 328,781 147,023 (260) 1,263,759
Other operating expenses (572,432) (139,821) (259,073) (262,499) 260 (1,233,565)
Segment result 1,124,105 880,022 (196,351) (710,725) 25 1,097,076
Financial revenues 1,094,275
Financial expenses (1,023,074)
Share in pro t from investment accounted for under equity method 1,696 – 958 269,721 272,375
Pro t before tax 1,440,652
Income tax expense (140,485)
Net pro t 1,300,167
* including depreciation and amortisation 1,289,258 354,444 807,676 116,268 2,567,646
Additions to non-current assets 991,779 304,196 2,356,255 124,095 3,776,325
Data concerning revenues and nancial result by segment for the year ended 31 December 2008
Re ning Segment
for the year ended
31.12.2008
RetailSegment
for the year ended
31.12.2008
PetrochemicalSegment
for the year ended
31.12.2008
Corporate Functions
for the year ended
31.12.2008
Adjustmentsfor the year
ended31.12.2008
Totalfor the year
ended31.12.2008
Sales to external customers 46,033,371 22,479,537 10,934,614 85,703 79,533,225
Transactions with other segments 15,498,017 48,326 3,958,198 119,528 (19,624,069) –
Total sales revenues 61,531,388 22,527,863 14,892,812 205,231 (19,624,069) 79,533,225
Total operating expenses* (61,330,028) (21,910,109) (14,309,676) (859,776) 19,624,069 (78,785,520)
Other operating revenues 166,732 159,681 88,489 333,028 747930
Other operating expenses (2,525,751) (137,182) (109,148) (326,876) (3,098,957)
144

PKN
OR
LEN
SA
CA
PITA
L G
RO
UP
Exp
lan
ato
ry n
ote
s to
co
nso
lidat
ed
nan
cial
sta
tem
ents
fo
r th
e ye
ar e
nd
ed 3
1 d
ecem
ber
200
9 (a
ll am
ou
nts
in
PLN
th
ou
san
d)
145
Re ning Segment
for the year ended
31.12.2008
RetailSegment
for the year ended
31.12.2008
PetrochemicalSegment
for the year ended
31.12.2008
Corporate Functions
for the year ended
31.12.2008
Adjustmentsfor the year
ended31.12.2008
Totalfor the year
ended31.12.2008
Segment result (2,157,659) 640,253 562,477 (648,393) (1,603,322)
Financial revenues 702,800
Financial expenses (2,281,414)
Share in pro t from investment accounted for under equity method (1,025) – 1,040 266,518 266,533
Pro t before tax (2,915,403)
Income tax expense 388,777
Net pro t (2,526,626)
* including depreciation and amortisation 1,268,975 355,848 765,283 101,277 2,491,383
Additions to non-current assets 1,846,195 557,287 1,510,093 104,719 4,018,294
Data concerning revenues and nancial result by segment for the year ended 31 December 2008 in accordance
with IAS 14 – Operating segments
Re ning Segment
for the year ended
31.12.2008
Petrochemical Segment
for the year ended
31.12.2008
ChemicalSegment
for the year ended
31.12.2008
Otheroperations
for the year ended
31.12.2008
Adjustmentsfor the year
ended31.12.2008
Totalfor the year
ended31.12.2008
Sales to external customers 68,072,961 8,393,542 2,575,855 492,847 79,535,205
Transactions with other segments 8,815,180 3,904,535 195,042 1,377,813 (14,292,570) –
Total sales revenues 76,888,141 12,298,077 2,770,897 1,870,660 (14,292,570) 79,535,205
Total operating expenses* (76,120,236) (12,053,583) (2,504,646) (1,810,798) 14,288,665 (78,200,598)
Other operating revenues 380,911 68,278 28,145 150,162 (391) 627,105
Other operating expenses (2,775,564) (37,813) (80,806) (69,163) – (2,963,346)
Segment result (1,626,748) 274,959 213,590 140,861 – (1,001,634)
Unallocated revenues of the Group 120,825
Unallocated expenses of the Group (722,513)
Pro t/(Loss ) from operations (1,603,322)
Financial revenues 702,800
Financial expenses (2,281,414)
Share in pro t from investment accounted for under equity method (1,025) – 1,040 266,518 266,533
Pro t before tax (2,915,403)
Income tax expense 388,777
145

PKN
OR
LEN
AN
NU
AL
REP
OR
T 20
09 •
CO
NSO
LID
ATE
D F
INA
NC
IAL
STA
TEM
ENTS
Exp
lan
ato
ry n
ote
s to
co
nso
lidat
ed
nan
cial
sta
tem
ents
fo
r th
e ye
ar e
nd
ed 3
1 d
ecem
ber
200
9 (a
ll am
ou
nts
in
PLN
th
ou
san
d)
146
Re ning Segment
for the year ended
31.12.2008
Petrochemical Segment
for the year ended
31.12.2008
ChemicalSegment
for the year ended
31.12.2008
Otheroperations
for the year ended
31.12.2008
Adjustmentsfor the year
ended31.12.2008
Totalfor the year
ended31.12.2008
Net pro t (2,526,626)
* including depreciation and amortisation 1,411,221 629,643 147,657 255,128 2,443,649
Unallocated 47,734
2,491,383
Capital expenditures 2,088,810 1,235,821 255,563 311,259 3,891,453
Unallocated 56,301
3,947,754
Consolidated segment revenues do not include Customer Loyalty Program adjustment (IFRIC 13).
In 2008 capital expenditures comprised only the amounts concerning direct purchases of property, plant and equipment
and intangible assets. According to IFRS 8 par 23b) the scope of disclosers was extended to all additions to non-current
assets other than nancial instruments, deferred tax assets, assets from post-employment bene ts and rights resulting
from insurance contracts.
5.2. Other segment data
a) Assets by operating segments
Segment Assets
as at31.12.2009
as at31.12.2008
Re ning Segment 26,447,353 26,681,137
Retail Segment 5,416,802 5,348,138
Petrochemical Segment 12,265,878 11,021,204
Total segment assets 44,130,033 43,050,479
Corporate Functions 5,492,775 4,889,199
Adjustments (462,433) (963,928)
49,160,375 46,975,750
including:
Assets classi ed as held for sale Investments in associates
as at31.12.2009
as at31.12.2008
as at31.12.2009
as at31.12.2008
Re ning Segment 4,589 28,127 13,986 11,532
Retail Segment – – – –
Petrochemical Segment 16,787 12,096 30,755 38,805
Total segment assets 21,376 40,223 44,741 50,337
Corporate Functions 10,802 11,265 1,356,845 1,510,795
32,178 51,487 1,401,586 1,561,132
Reportable segments include all assets except for nancial assets and tax assets. Goodwill was allocated to reportable
segments. Assets used jointly by different segments are allocated based on revenues generated by particular segments.
146
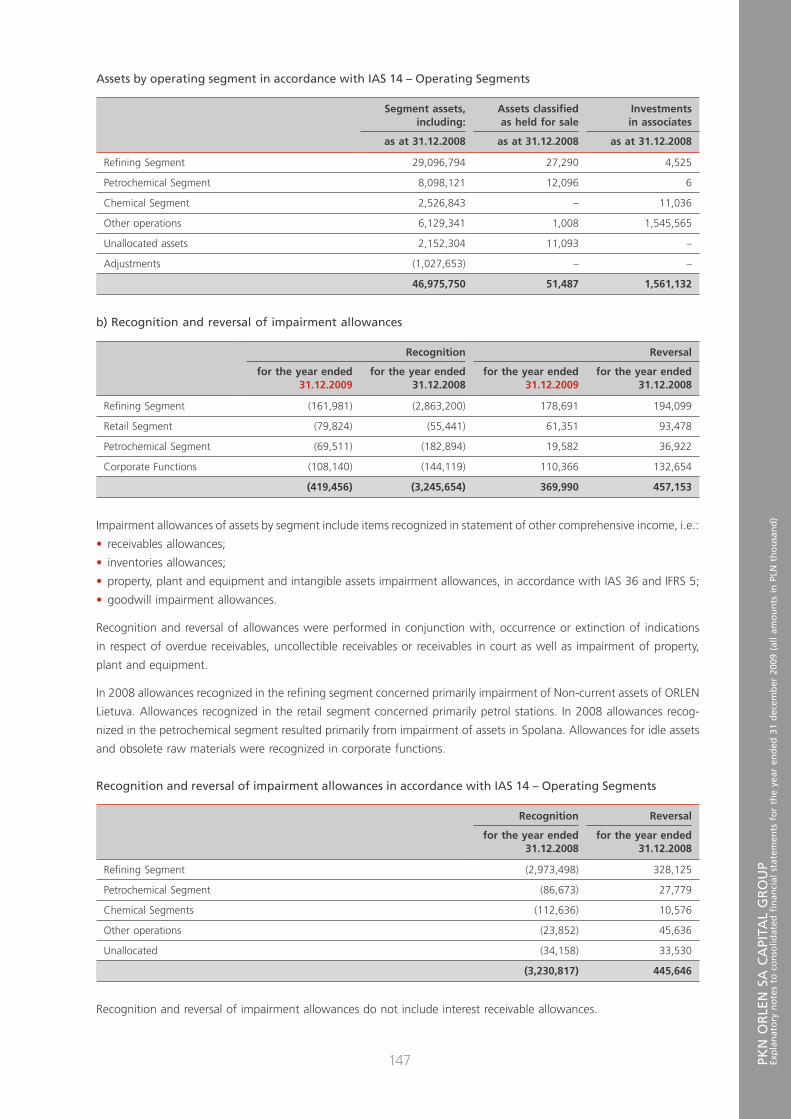
PKN
OR
LEN
SA
CA
PITA
L G
RO
UP
Exp
lan
ato
ry n
ote
s to
co
nso
lidat
ed
nan
cial
sta
tem
ents
fo
r th
e ye
ar e
nd
ed 3
1 d
ecem
ber
200
9 (a
ll am
ou
nts
in
PLN
th
ou
san
d)
147
Assets by operating segment in accordance with IAS 14 – Operating Segments
Segment assets,including:
Assets classi edas held for sale
Investmentsin associates
as at 31.12.2008 as at 31.12.2008 as at 31.12.2008
Re ning Segment 29,096,794 27,290 4,525
Petrochemical Segment 8,098,121 12,096 6
Chemical Segment 2,526,843 – 11,036
Other operations 6,129,341 1,008 1,545,565
Unallocated assets 2,152,304 11,093 –
Adjustments (1,027,653) – –
46,975,750 51,487 1,561,132
b) Recognition and reversal of impairment allowances
Recognition Reversal
for the year ended31.12.2009
for the year ended31.12.2008
for the year ended31.12.2009
for the year ended31.12.2008
Re ning Segment (161,981) (2,863,200) 178,691 194,099
Retail Segment (79,824) (55,441) 61,351 93,478
Petrochemical Segment (69,511) (182,894) 19,582 36,922
Corporate Functions (108,140) (144,119) 110,366 132,654
(419,456) (3,245,654) 369,990 457,153
Impairment allowances of assets by segment include items recognized in statement of other comprehensive income, i.e.:
• receivables allowances;
• inventories allowances;
• property, plant and equipment and intangible assets impairment allowances, in accordance with IAS 36 and IFRS 5;
• goodwill impairment allowances.
Recognition and reversal of allowances were performed in conjunction with, occurrence or extinction of indications
in respect of overdue receivables, uncollectible receivables or receivables in court as well as impairment of property,
plant and equipment.
In 2008 allowances recognized in the re ning segment concerned primarily impairment of Non-current assets of ORLEN
Lietuva. Allowances recognized in the retail segment concerned primarily petrol stations. In 2008 allowances recog-
nized in the petrochemical segment resulted primarily from impairment of assets in Spolana. Allowances for idle assets
and obsolete raw materials were recognized in corporate functions.
Recognition and reversal of impairment allowances in accordance with IAS 14 – Operating Segments
Recognition Reversal
for the year ended31.12.2008
for the year ended31.12.2008
Re ning Segment (2,973,498) 328,125
Petrochemical Segment (86,673) 27,779
Chemical Segments (112,636) 10,576
Other operations (23,852) 45,636
Unallocated (34,158) 33,530
(3,230,817) 445,646
Recognition and reversal of impairment allowances do not include interest receivable allowances.
147
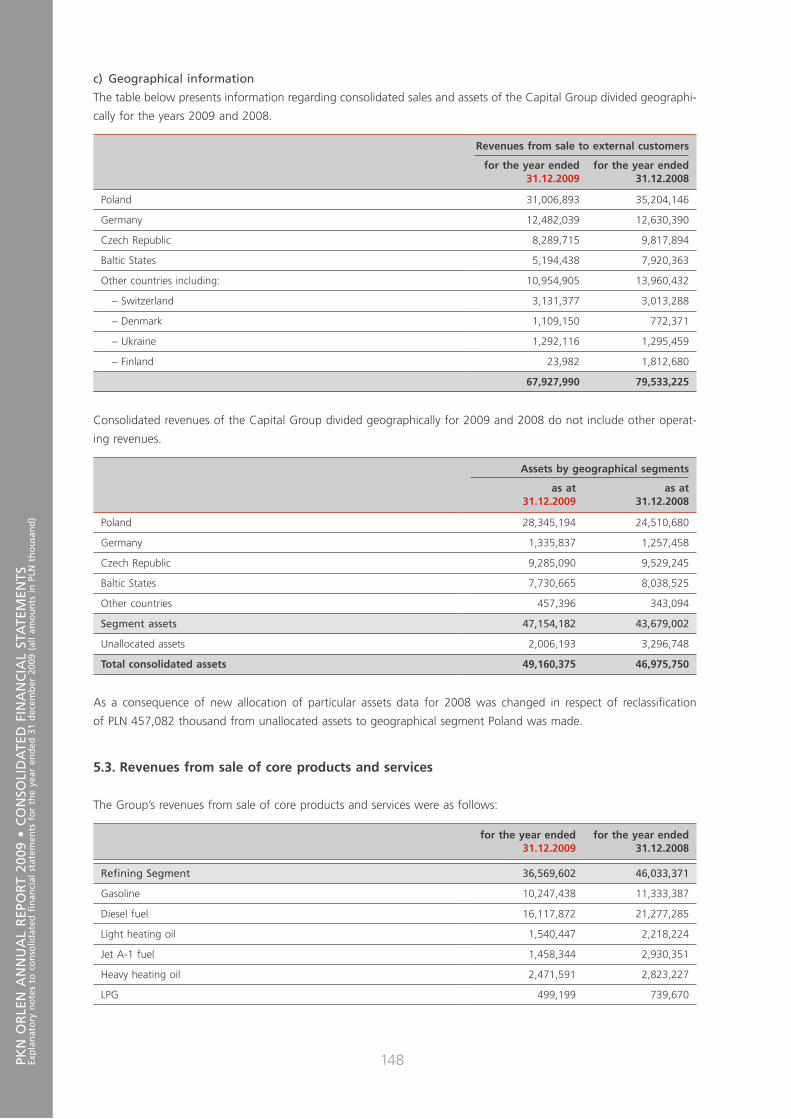
PKN
OR
LEN
AN
NU
AL
REP
OR
T 20
09 •
CO
NSO
LID
ATE
D F
INA
NC
IAL
STA
TEM
ENTS
Exp
lan
ato
ry n
ote
s to
co
nso
lidat
ed
nan
cial
sta
tem
ents
fo
r th
e ye
ar e
nd
ed 3
1 d
ecem
ber
200
9 (a
ll am
ou
nts
in
PLN
th
ou
san
d)
148
c) Geographical information
The table below presents information regarding consolidated sales and assets of the Capital Group divided geographi-
cally for the years 2009 and 2008.
Revenues from sale to external customers
for the year ended31.12.2009
for the year ended31.12.2008
Poland 31,006,893 35,204,146
Germany 12,482,039 12,630,390
Czech Republic 8,289,715 9,817,894
Baltic States 5,194,438 7,920,363
Other countries including: 10,954,905 13,960,432
– Switzerland 3,131,377 3,013,288
– Denmark 1,109,150 772,371
– Ukraine 1,292,116 1,295,459
– Finland 23,982 1,812,680
67,927,990 79,533,225
Consolidated revenues of the Capital Group divided geographically for 2009 and 2008 do not include other operat-
ing revenues.
Assets by geographical segments
as at31.12.2009
as at31.12.2008
Poland 28,345,194 24,510,680
Germany 1,335,837 1,257,458
Czech Republic 9,285,090 9,529,245
Baltic States 7,730,665 8,038,525
Other countries 457,396 343,094
Segment assets 47,154,182 43,679,002
Unallocated assets 2,006,193 3,296,748
Total consolidated assets 49,160,375 46,975,750
As a consequence of new allocation of particular assets data for 2008 was changed in respect of reclassi cation
of PLN 457,082 thousand from unallocated assets to geographical segment Poland was made.
5.3. Revenues from sale of core products and services
The Group’s revenues from sale of core products and services were as follows:
for the year ended31.12.2009
for the year ended31.12.2008
Re ning Segment 36,569,602 46,033,371
Gasoline 10,247,438 11,333,387
Diesel fuel 16,117,872 21,277,285
Light heating oil 1,540,447 2,218,224
Jet A-1 fuel 1,458,344 2,930,351
Heavy heating oil 2,471,591 2,823,227
LPG 499,199 739,670
148
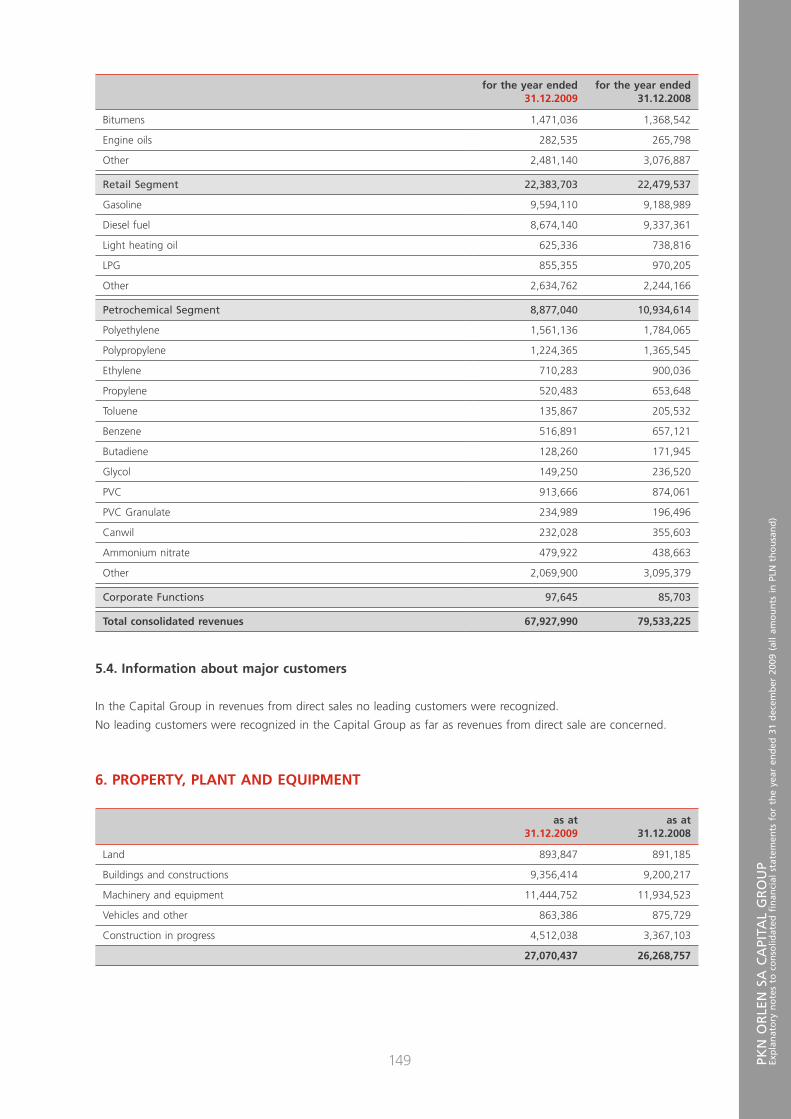
PKN
OR
LEN
SA
CA
PITA
L G
RO
UP
Exp
lan
ato
ry n
ote
s to
co
nso
lidat
ed
nan
cial
sta
tem
ents
fo
r th
e ye
ar e
nd
ed 3
1 d
ecem
ber
200
9 (a
ll am
ou
nts
in
PLN
th
ou
san
d)
149
for the year ended31.12.2009
for the year ended31.12.2008
Bitumens 1,471,036 1,368,542
Engine oils 282,535 265,798
Other 2,481,140 3,076,887
Retail Segment 22,383,703 22,479,537
Gasoline 9,594,110 9,188,989
Diesel fuel 8,674,140 9,337,361
Light heating oil 625,336 738,816
LPG 855,355 970,205
Other 2,634,762 2,244,166
Petrochemical Segment 8,877,040 10,934,614
Polyethylene 1,561,136 1,784,065
Polypropylene 1,224,365 1,365,545
Ethylene 710,283 900,036
Propylene 520,483 653,648
Toluene 135,867 205,532
Benzene 516,891 657,121
Butadiene 128,260 171,945
Glycol 149,250 236,520
PVC 913,666 874,061
PVC Granulate 234,989 196,496
Canwil 232,028 355,603
Ammonium nitrate 479,922 438,663
Other 2,069,900 3,095,379
Corporate Functions 97,645 85,703
Total consolidated revenues 67,927,990 79,533,225
5.4. Information about major customers
In the Capital Group in revenues from direct sales no leading customers were recognized.
No leading customers were recognized in the Capital Group as far as revenues from direct sale are concerned.
6. PROPERTY, PLANT AND EQUIPMENT
as at31.12.2009
as at31.12.2008
Land 893,847 891,185
Buildings and constructions 9,356,414 9,200,217
Machinery and equipment 11,444,752 11,934,523
Vehicles and other 863,386 875,729
Construction in progress 4,512,038 3,367,103
27,070,437 26,268,757
149

PKN
OR
LEN
AN
NU
AL
REP
OR
T 20
09 •
CO
NSO
LID
ATE
D F
INA
NC
IAL
STA
TEM
ENTS
Exp
lan
ato
ry n
ote
s to
co
nso
lidat
ed
nan
cial
sta
tem
ents
fo
r th
e ye
ar e
nd
ed 3
1 d
ecem
ber
200
9 (a
ll am
ou
nts
in
PLN
th
ou
san
d)
150
Changes in property, plant and equipment by class:
Land
Buildings and con-
structions
Machineryand equip-
mentVehicles
and otherConstruction
in progress Total
Gross book value
1 January 2009 927,151 14,186,253 25,310,048 1,935,661 3,411,193 45,770,306
Acquisition 1,524 35,926 180,674 100,709 3,386,602 3,705,435
Reclassi cation 9,006 987,131 1,081,494 154,695 (2,169,356) 62,970
Decrease (5,945) (93,993) (410,160) (171,655) (33,826) (715,579)
Foreign exchange differences (6,786) (87,711) (345,790) (13,432) (33,187) (486,906)
31 December 2009 924,950 15,027,606 25,816,266 2,005,978 4,561,426 48,336,226
Accumulated depreciation and impairment allowances
1 January 2009 35,966 4,986,036 13,375,525 1,059,932 44,090 19,501,549
Depreciation – 611,562 1,634,707 214,204 – 2,460,473
Other increases 773 5,206 63,077 17,055 – 86,111
Impairment allowances (2,953) (58,767) (22,347) 3,143 5,411 (75,513)
recognition 3,442 60,335 30,817 5,437 9,976 110,007
reversal (6,395) (119,102) (53,164) (2,294) (4,565) (185,520)
Reclassi cation – 225,861 (218,624) (82) – 7,155
Decrease (14) (54,854) (314,077) (101,471) – (470,416)
Foreign exchange differences (2,669) (43,852) (146,747) (50,189) (113) (243,570)
31 December 2009 31,103 5,671,192 14,371,514 1,142,592 49,388 21,265,789
Gross book value
1 January 2008 821,923 12,924,187 21,108,183 1,665,764 2,525,125 39,045,182
Acquisition 1,062 26,202 69,286 163,641 3,714,927 3,975,118
Reclassi cation 21,787 799,325 2,020,748 89,078 (3,008,168) (77,230)
Decrease (6,326) (163,231) (309,156) (113,329) (29,890) (621,932)
Foreign exchange differences 88,705 599,770 2,420,987 130,507 209,199 3,449,168
31 December 2008 927,151 14,186,253 25,310,048 1,935,661 3,411,193 45,770,306
Accumulated depreciation and impairment allowances
1 January 2008 63,599 4,018,804 9,278,459 808,091 42,304 14,211,257
Depreciation – 584,060 1,603,836 207,313 – 2,395,209
Other increases 2,179 3,459 17,101 5,648 – 28,387
Impairment allowances (33,511) 309,212 2,002,361 67,995 1,221 2,347,278
recognition 6,396 380,267 2,019,213 69,190 9,428 2,484,494
reversal (39,907) (71,055) (16,852) (1,195) (8,207) (137,216)
Decrease (372) (97,336) (263,873) (83,481) – (445,062)
Foreign exchange differences 4,071 167,837 737,641 54,366 565 964,480
31 December 2008 35,966 4,986,036 13,375,525 1,059,932 44,090 19,501,549
Net book value
1 January 2009 891,185 9,200,217 11,934,523 875,729 3,367,103 26,268,757
31 December 2009 893,847 9,356,414 11,444,752 863,386 4,512,038 27,070,437
1 January 2008 758,324 8,905,383 11,829,724 857,673 2,482,821 24,833,925
31 December 2008 891,185 9,200,217 11,934,523 875,729 3,367,103 26,268,757
150
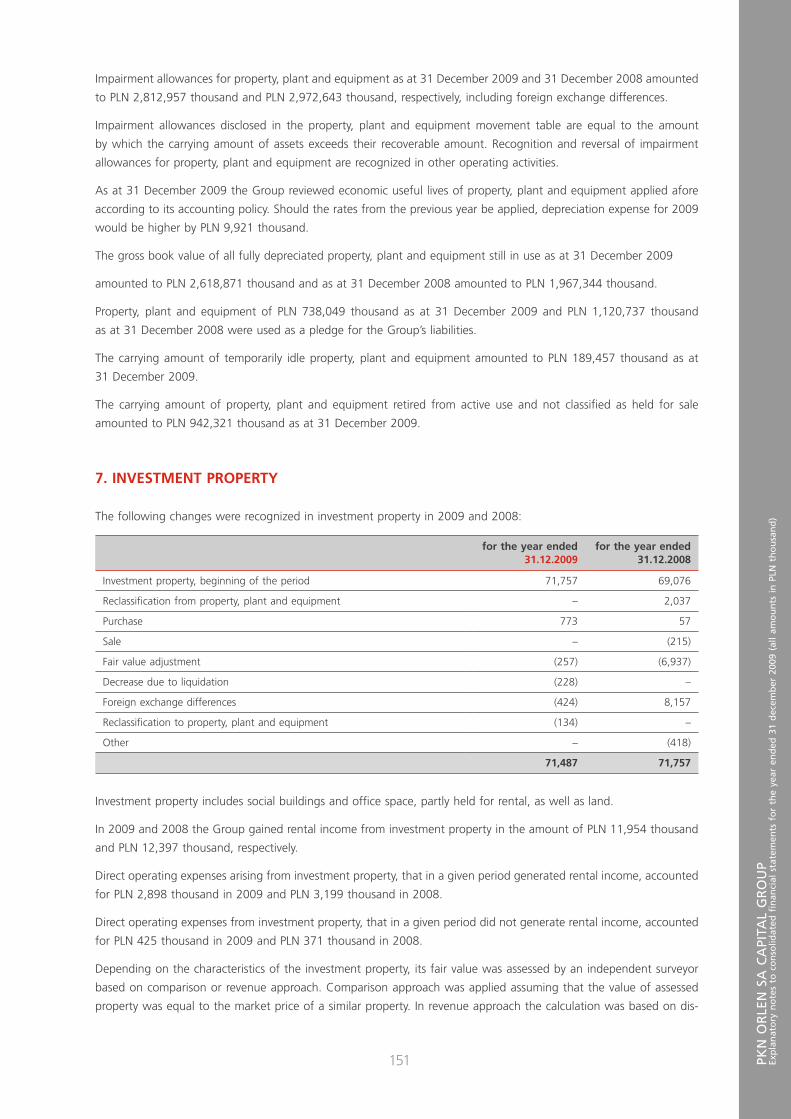
PKN
OR
LEN
SA
CA
PITA
L G
RO
UP
Exp
lan
ato
ry n
ote
s to
co
nso
lidat
ed
nan
cial
sta
tem
ents
fo
r th
e ye
ar e
nd
ed 3
1 d
ecem
ber
200
9 (a
ll am
ou
nts
in
PLN
th
ou
san
d)
151
Impairment allowances for property, plant and equipment as at 31 December 2009 and 31 December 2008 amounted
to PLN 2,812,957 thousand and PLN 2,972,643 thousand, respectively, including foreign exchange differences.
Impairment allowances disclosed in the property, plant and equipment movement table are equal to the amount
by which the carrying amount of assets exceeds their recoverable amount. Recognition and reversal of impairment
allowances for property, plant and equipment are recognized in other operating activities.
As at 31 December 2009 the Group reviewed economic useful lives of property, plant and equipment applied afore
according to its accounting policy. Should the rates from the previous year be applied, depreciation expense for 2009
would be higher by PLN 9,921 thousand.
The gross book value of all fully depreciated property, plant and equipment still in use as at 31 December 2009
amounted to PLN 2,618,871 thousand and as at 31 December 2008 amounted to PLN 1,967,344 thousand.
Property, plant and equipment of PLN 738,049 thousand as at 31 December 2009 and PLN 1,120,737 thousand
as at 31 December 2008 were used as a pledge for the Group’s liabilities.
The carrying amount of temporarily idle property, plant and equipment amounted to PLN 189,457 thousand as at
31 December 2009.
The carrying amount of property, plant and equipment retired from active use and not classi ed as held for sale
amounted to PLN 942,321 thousand as at 31 December 2009.
7. INVESTMENT PROPERTY
The following changes were recognized in investment property in 2009 and 2008:
for the year ended31.12.2009
for the year ended31.12.2008
Investment property, beginning of the period 71,757 69,076
Reclassi cation from property, plant and equipment – 2,037
Purchase 773 57
Sale – (215)
Fair value adjustment (257) (6,937)
Decrease due to liquidation (228) –
Foreign exchange differences (424) 8,157
Reclassi cation to property, plant and equipment (134) –
Other – (418)
71,487 71,757
Investment property includes social buildings and of ce space, partly held for rental, as well as land.
In 2009 and 2008 the Group gained rental income from investment property in the amount of PLN 11,954 thousand
and PLN 12,397 thousand, respectively.
Direct operating expenses arising from investment property, that in a given period generated rental income, accounted
for PLN 2,898 thousand in 2009 and PLN 3,199 thousand in 2008.
Direct operating expenses from investment property, that in a given period did not generate rental income, accounted
for PLN 425 thousand in 2009 and PLN 371 thousand in 2008.
Depending on the characteristics of the investment property, its fair value was assessed by an independent surveyor
based on comparison or revenue approach. Comparison approach was applied assuming that the value of assessed
property was equal to the market price of a similar property. In revenue approach the calculation was based on dis-
151

PKN
OR
LEN
AN
NU
AL
REP
OR
T 20
09 •
CO
NSO
LID
ATE
D F
INA
NC
IAL
STA
TEM
ENTS
Exp
lan
ato
ry n
ote
s to
co
nso
lidat
ed
nan
cial
sta
tem
ents
fo
r th
e ye
ar e
nd
ed 3
1 d
ecem
ber
200
9 (a
ll am
ou
nts
in
PLN
th
ou
san
d)
152
counted cash ows method, due to variability of revenues in foreseeable future. 5-year period forecasts were ap-
plied in the analysis. The discount rate used re ects the relation, as expected by the buyer, between yearly revenue
from an investment property and expenditures required to purchase investment property. Forecasts of discounted
cash ows relating to the valued objects consider provisions included in all rent agreements as well as external data,
e.g. current market rent charges for similar objects, same located and in the same technical condition and standard
and designated for similar purposes.
8. INTANGIBLE ASSETS
as at31.12.2009
as at31.12.2008
Acquired computer software 40,950 42,808
Acquired patents, trade marks and licenses 494,383 484,102
Goodwill 89,811 87,633
Other 65,232 30,138
690,376 644,681
The changes of intangible assets were as follows:
Acquiredcomputersoftware
Acquired patents,trade marksand licenses Goodwill Other Total
Gross book value
1 January 2009 197,990 919,297 110,710 93,422 1,321,419
Acquisition 9,624 4,704 (40,531) 86,435 60,232
Other increases 6,530 5,436 22,639 87,429 122,034
Reclassi cation 4,629 76,037 – 89 80,755
Decrease (5,153) (35,655) 14,151 (141,840) (168,497)
Foreign exchange differences (2,947) (3,086) 230 (2,360) (8,163)
31 December 2009 210,673 966,733 107,199 123,175 1,407,780
Accumulated amortisation and impairment allowances
1 January 2009 155,182 435,195 23,077 63,284 676,738
Amortisation 13,415 67,965 – 13,101 94,481
Other increases 418 1,609 1,985 1,818 5,830
Impairment allowances 1,698 4,059 (7,380) (7,171) (8,794)
recognition 3,266 4,059 – – 7,325
reversal (1,568) – (7,380) (7,171) (16,119)
Decrease (1,831) (34,983) (8) (12,294) (49,116)
Foreign exchange differences 841 (1,495) (286) (795) (1,735)
31 December 2009 169,723 472,350 17,388 57,943 717,404
Gross book value
1 January 2008 156,108 838,262 108,468 61,101 1,163,939
Acquisition 10,413 4,421 (2,295) 20,915 33,454
Other increases 4,267 247 – 11,560 16,074
Reclassi cation 6,270 57,027 – 4,767 68,064
Decrease (3,731) (26,151) (2,833) (13,738) (46,453)
Foreign exchange differences 24,663 45,491 7,370 8,817 86,341
31 December 2008 197,990 919,297 110,710 93,422 1,321,419
152
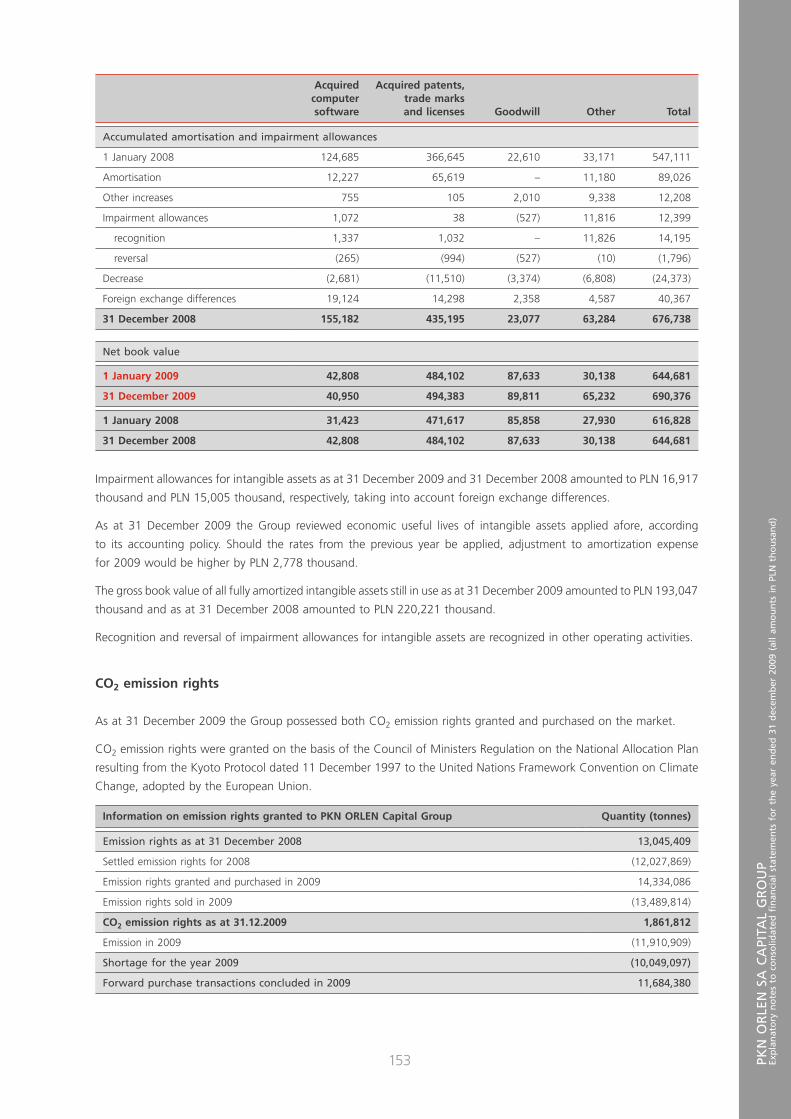
PKN
OR
LEN
SA
CA
PITA
L G
RO
UP
Exp
lan
ato
ry n
ote
s to
co
nso
lidat
ed
nan
cial
sta
tem
ents
fo
r th
e ye
ar e
nd
ed 3
1 d
ecem
ber
200
9 (a
ll am
ou
nts
in
PLN
th
ou
san
d)
153
Acquiredcomputersoftware
Acquired patents,trade marksand licenses Goodwill Other Total
Accumulated amortisation and impairment allowances
1 January 2008 124,685 366,645 22,610 33,171 547,111
Amortisation 12,227 65,619 – 11,180 89,026
Other increases 755 105 2,010 9,338 12,208
Impairment allowances 1,072 38 (527) 11,816 12,399
recognition 1,337 1,032 – 11,826 14,195
reversal (265) (994) (527) (10) (1,796)
Decrease (2,681) (11,510) (3,374) (6,808) (24,373)
Foreign exchange differences 19,124 14,298 2,358 4,587 40,367
31 December 2008 155,182 435,195 23,077 63,284 676,738
Net book value
1 January 2009 42,808 484,102 87,633 30,138 644,681
31 December 2009 40,950 494,383 89,811 65,232 690,376
1 January 2008 31,423 471,617 85,858 27,930 616,828
31 December 2008 42,808 484,102 87,633 30,138 644,681
Impairment allowances for intangible assets as at 31 December 2009 and 31 December 2008 amounted to PLN 16,917
thousand and PLN 15,005 thousand, respectively, taking into account foreign exchange differences.
As at 31 December 2009 the Group reviewed economic useful lives of intangible assets applied afore, according
to its accounting policy. Should the rates from the previous year be applied, adjustment to amortization expense
for 2009 would be higher by PLN 2,778 thousand.
The gross book value of all fully amortized intangible assets still in use as at 31 December 2009 amounted to PLN 193,047
thousand and as at 31 December 2008 amounted to PLN 220,221 thousand.
Recognition and reversal of impairment allowances for intangible assets are recognized in other operating activities.
CO2 emission rights
As at 31 December 2009 the Group possessed both CO2 emission rights granted and purchased on the market.
CO2 emission rights were granted on the basis of the Council of Ministers Regulation on the National Allocation Plan
resulting from the Kyoto Protocol dated 11 December 1997 to the United Nations Framework Convention on Climate
Change, adopted by the European Union.
Information on emission rights granted to PKN ORLEN Capital Group Quantity (tonnes)
Emission rights as at 31 December 2008 13,045,409
Settled emission rights for 2008 (12,027,869)
Emission rights granted and purchased in 2009 14,334,086
Emission rights sold in 2009 (13,489,814)
CO2 emission rights as at 31.12.2009 1,861,812
Emission in 2009 (11,910,909)
Shortage for the year 2009 (10,049,097)
Forward purchase transactions concluded in 2009 11,684,380
153
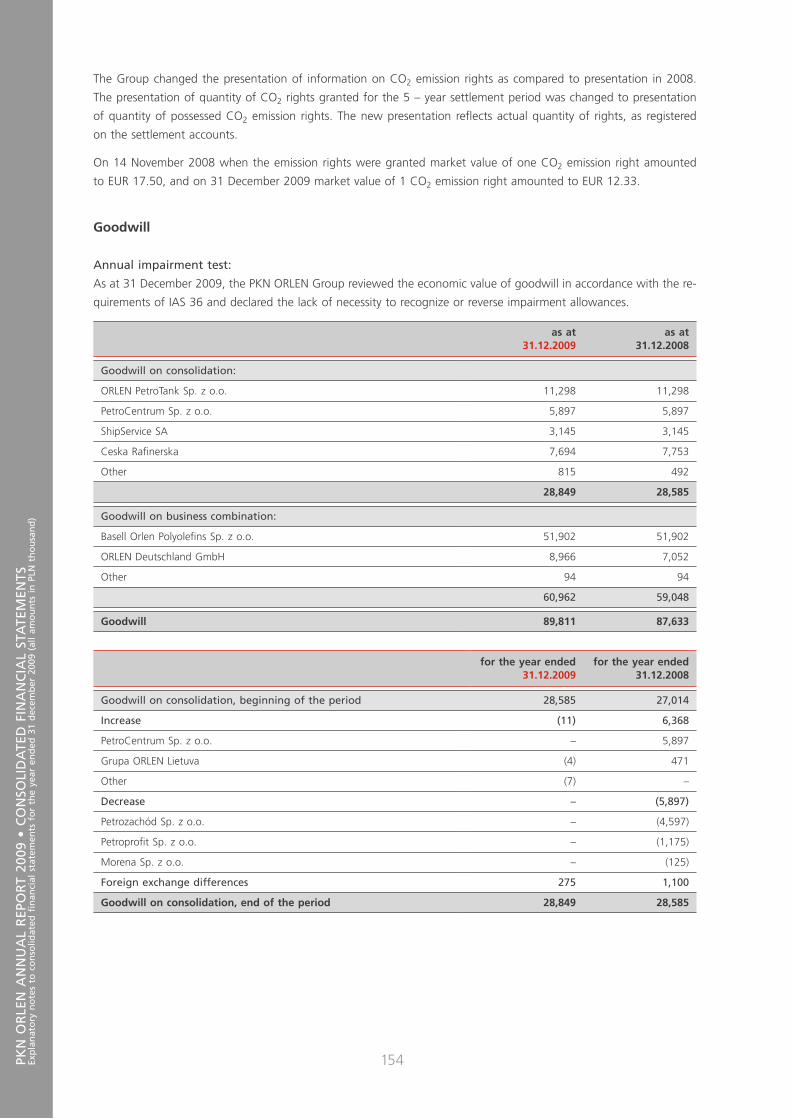
PKN
OR
LEN
AN
NU
AL
REP
OR
T 20
09 •
CO
NSO
LID
ATE
D F
INA
NC
IAL
STA
TEM
ENTS
Exp
lan
ato
ry n
ote
s to
co
nso
lidat
ed
nan
cial
sta
tem
ents
fo
r th
e ye
ar e
nd
ed 3
1 d
ecem
ber
200
9 (a
ll am
ou
nts
in
PLN
th
ou
san
d)
154
The Group changed the presentation of information on CO2 emission rights as compared to presentation in 2008.
The presentation of quantity of CO2 rights granted for the 5 – year settlement period was changed to presentation
of quantity of possessed CO2 emission rights. The new presentation re ects actual quantity of rights, as registered
on the settlement accounts.
On 14 November 2008 when the emission rights were granted market value of one CO2 emission right amounted
to EUR 17.50, and on 31 December 2009 market value of 1 CO2 emission right amounted to EUR 12.33.
Goodwill
Annual impairment test:
As at 31 December 2009, the PKN ORLEN Group reviewed the economic value of goodwill in accordance with the re-
quirements of IAS 36 and declared the lack of necessity to recognize or reverse impairment allowances.
as at31.12.2009
as at31.12.2008
Goodwill on consolidation:
ORLEN PetroTank Sp. z o.o. 11,298 11,298
PetroCentrum Sp. z o.o. 5,897 5,897
ShipService SA 3,145 3,145
Ceska Ra nerska 7,694 7,753
Other 815 492
28,849 28,585
Goodwill on business combination:
Basell Orlen Polyole ns Sp. z o.o. 51,902 51,902
ORLEN Deutschland GmbH 8,966 7,052
Other 94 94
60,962 59,048
Goodwill 89,811 87,633
for the year ended31.12.2009
for the year ended31.12.2008
Goodwill on consolidation, beginning of the period 28,585 27,014
Increase (11) 6,368
PetroCentrum Sp. z o.o. – 5,897
Grupa ORLEN Lietuva (4) 471
Other (7) –
Decrease – (5,897)
Petrozachód Sp. z o.o. – (4,597)
Petropro t Sp. z o.o. – (1,175)
Morena Sp. z o.o. – (125)
Foreign exchange differences 275 1,100
Goodwill on consolidation, end of the period 28,849 28,585
154
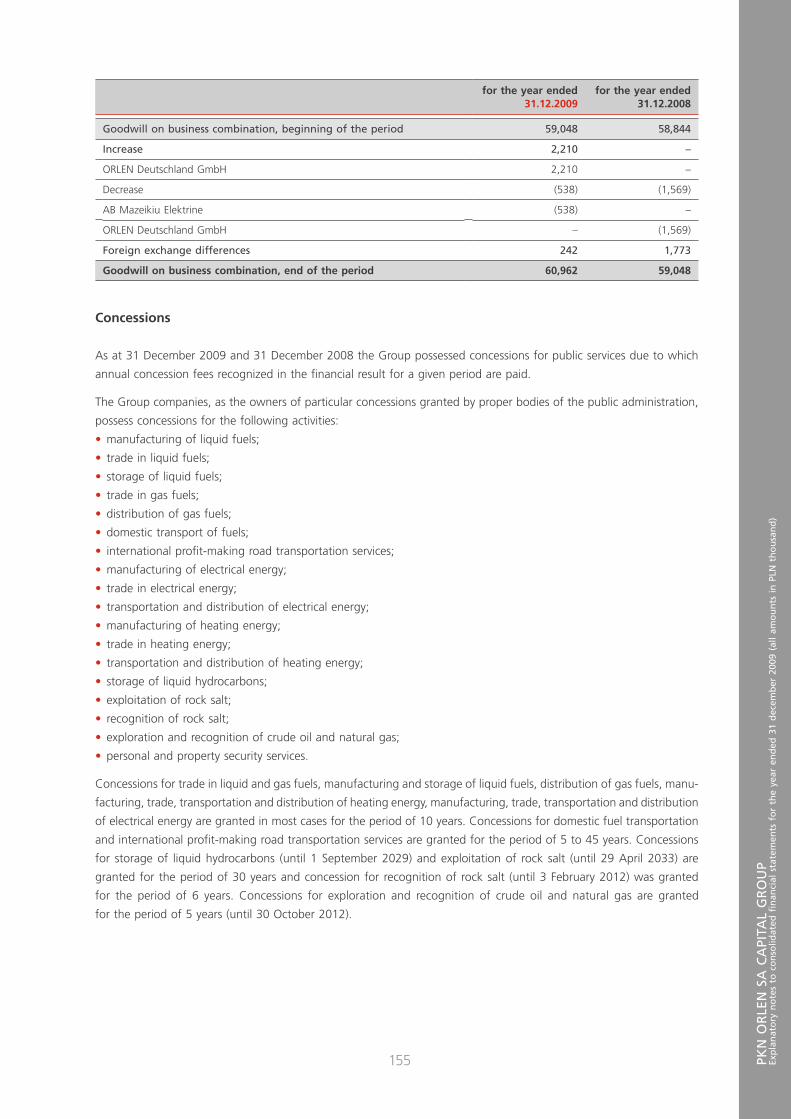
PKN
OR
LEN
SA
CA
PITA
L G
RO
UP
Exp
lan
ato
ry n
ote
s to
co
nso
lidat
ed
nan
cial
sta
tem
ents
fo
r th
e ye
ar e
nd
ed 3
1 d
ecem
ber
200
9 (a
ll am
ou
nts
in
PLN
th
ou
san
d)
155
for the year ended31.12.2009
for the year ended31.12.2008
Goodwill on business combination, beginning of the period 59,048 58,844
Increase 2,210 –
ORLEN Deutschland GmbH 2,210 –
Decrease (538) (1,569)
AB Mazeikiu Elektrine (538) –
ORLEN Deutschland GmbH – (1,569)
Foreign exchange differences 242 1,773
Goodwill on business combination, end of the period 60,962 59,048
Concessions
As at 31 December 2009 and 31 December 2008 the Group possessed concessions for public services due to which
annual concession fees recognized in the nancial result for a given period are paid.
The Group companies, as the owners of particular concessions granted by proper bodies of the public administration,
possess concessions for the following activities:
• manufacturing of liquid fuels;
• trade in liquid fuels;
• storage of liquid fuels;
• trade in gas fuels;
• distribution of gas fuels;
• domestic transport of fuels;
• international pro t-making road transportation services;
• manufacturing of electrical energy;
• trade in electrical energy;
• transportation and distribution of electrical energy;
• manufacturing of heating energy;
• trade in heating energy;
• transportation and distribution of heating energy;
• storage of liquid hydrocarbons;
• exploitation of rock salt;
• recognition of rock salt;
• exploration and recognition of crude oil and natural gas;
• personal and property security services.
Concessions for trade in liquid and gas fuels, manufacturing and storage of liquid fuels, distribution of gas fuels, manu-
facturing, trade, transportation and distribution of heating energy, manufacturing, trade, transportation and distribution
of electrical energy are granted in most cases for the period of 10 years. Concessions for domestic fuel transportation
and international pro t-making road transportation services are granted for the period of 5 to 45 years. Concessions
for storage of liquid hydrocarbons (until 1 September 2029) and exploitation of rock salt (until 29 April 2033) are
granted for the period of 30 years and concession for recognition of rock salt (until 3 February 2012) was granted
for the period of 6 years. Concessions for exploration and recognition of crude oil and natural gas are granted
for the period of 5 years (until 30 October 2012).
155

PKN
OR
LEN
AN
NU
AL
REP
OR
T 20
09 •
CO
NSO
LID
ATE
D F
INA
NC
IAL
STA
TEM
ENTS
Exp
lan
ato
ry n
ote
s to
co
nso
lidat
ed
nan
cial
sta
tem
ents
fo
r th
e ye
ar e
nd
ed 3
1 d
ecem
ber
200
9 (a
ll am
ou
nts
in
PLN
th
ou
san
d)
156
9. PERPETUAL USUFRUCT OF LAND
The titles to perpetual usufruct of land obtained under an administrative decision were recognized as off balance sheet
items in the amount of PLN 981,672 thousand as at 31 December 2009 and of PLN 993,711 thousand as at 31 De-
cember 2008. These rights were revalued to fair value as at 1 January 2004.
10. NON-CURRENT FINANCIAL ASSETS
a) Financial assets available for sale
Seatas at
31.12.2009as at
31.12.2008
Group’s sharein capital/ voting rights
Principal activity31.12.2009 31.12.2008
SK EurochemSp. z o.o.
Poland – W³oc³awek 21,490 21,490 17.37% 17.37% production of chemicals
Naftoport Sp. z o.o.
Poland – Gdañsk 31,026 31,026 14.10% 14.10% construction and maintenance of loading
station for liquid fuels
Wodkan SA Poland – Ostrów Wielkopolski
869 1,142 2.69% 2.84% water supplyand savage services
Other 6,248 8,516
Net value 59,633 62,174
As at 31 December 2009 and 31 December 2008 impairment allowances of assets available for sale amounted
to PLN 78,570 thousand and PLN 81,059 thousand, respectively.
b) Investments in associates accounted for using equity method
As at 31 December 2009 and 31 December 2008 the Group’s investments in associates accounted for using equity
method were as follows:
Carrying amount as atGroup’s share
in capital/voting rights as at
Principal activity31.12.2009 31.12.2008 31.12.2009 31.12.2008
Polkomtel SA 809,483 961,151 24.39% 24.39% rendering mobile telecommunication
services Wartośæ rmy powsta³a na nabyciu Polkomtel SA
537,920 537,920 – –
Other 54,183 62,061 – –
1,401,586 1,561,132 24.39% 24.39%
In accordance with IAS 28 “Investments in associates”, condensed nancial data comprising total assets and liabili-
ties as at 31 December 2009 and 31 December 2008, revenues, nancial expenses and pro t for 2009 and 2008
in Polkomtel SA are described below:
Polkomtel SA (Selected nancial data)
as at31.12.2009
as at31.12.2008
Current assets 1,345,004 1,577,911
Non-current assets 7,065,775 7,097,736
Short-term liabilities 4,112,669 3,697,124
Long-term liabilities 969,861 1,042,891
156
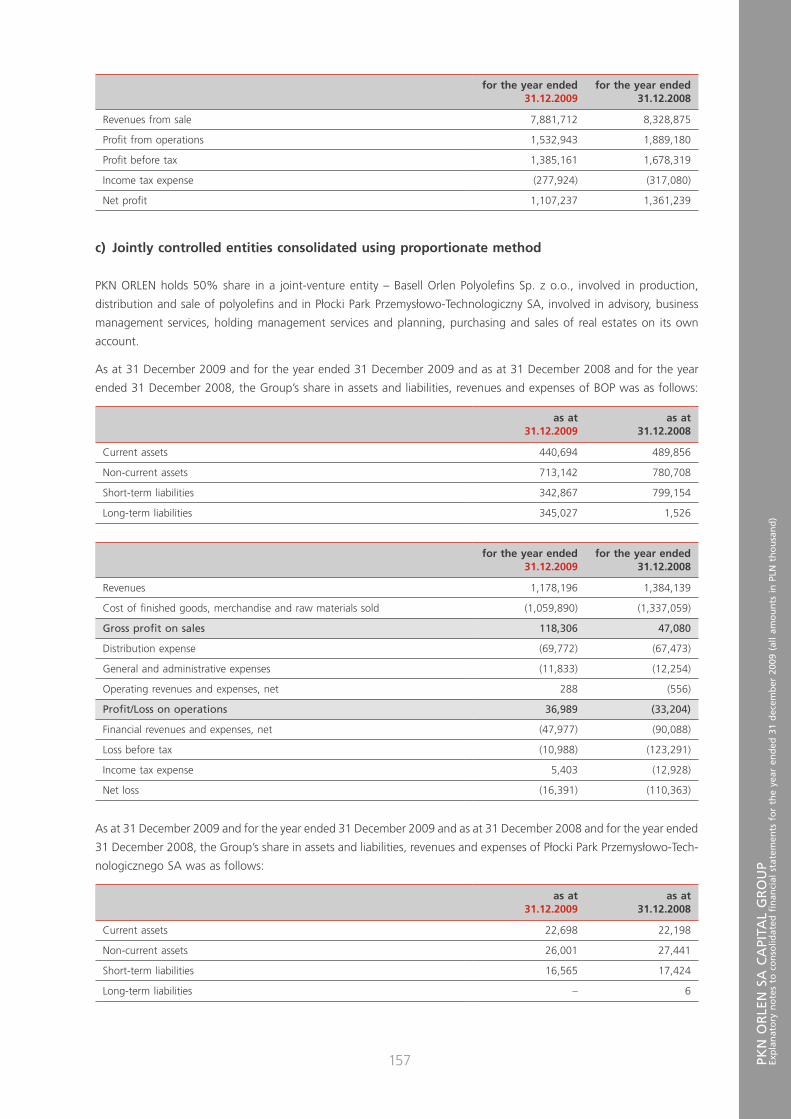
PKN
OR
LEN
SA
CA
PITA
L G
RO
UP
Exp
lan
ato
ry n
ote
s to
co
nso
lidat
ed
nan
cial
sta
tem
ents
fo
r th
e ye
ar e
nd
ed 3
1 d
ecem
ber
200
9 (a
ll am
ou
nts
in
PLN
th
ou
san
d)
157
for the year ended31.12.2009
for the year ended31.12.2008
Revenues from sale 7,881,712 8,328,875
Pro t from operations 1,532,943 1,889,180
Pro t before tax 1,385,161 1,678,319
Income tax expense (277,924) (317,080)
Net pro t 1,107,237 1,361,239
c) Jointly controlled entities consolidated using proportionate method
PKN ORLEN holds 50% share in a joint-venture entity – Basell Orlen Polyole ns Sp. z o.o., involved in production,
distribution and sale of polyole ns and in P³ocki Park Przemys³owo-Technologiczny SA, involved in advisory, business
management services, holding management services and planning, purchasing and sales of real estates on its own
account.
As at 31 December 2009 and for the year ended 31 December 2009 and as at 31 December 2008 and for the year
ended 31 December 2008, the Group’s share in assets and liabilities, revenues and expenses of BOP was as follows:
as at31.12.2009
as at31.12.2008
Current assets 440,694 489,856
Non-current assets 713,142 780,708
Short-term liabilities 342,867 799,154
Long-term liabilities 345,027 1,526
for the year ended31.12.2009
for the year ended31.12.2008
Revenues 1,178,196 1,384,139
Cost of nished goods, merchandise and raw materials sold (1,059,890) (1,337,059)
Gross pro t on sales 118,306 47,080
Distribution expense (69,772) (67,473)
General and administrative expenses (11,833) (12,254)
Operating revenues and expenses, net 288 (556)
Pro t/Loss on operations 36,989 (33,204)
Financial revenues and expenses, net (47,977) (90,088)
Loss before tax (10,988) (123,291)
Income tax expense 5,403 (12,928)
Net loss (16,391) (110,363)
As at 31 December 2009 and for the year ended 31 December 2009 and as at 31 December 2008 and for the year ended
31 December 2008, the Group’s share in assets and liabilities, revenues and expenses of P³ocki Park Przemys³owo-Tech-
nologicznego SA was as follows:
as at31.12.2009
as at31.12.2008
Current assets 22,698 22,198
Non-current assets 26,001 27,441
Short-term liabilities 16,565 17,424
Long-term liabilities – 6
157

PKN
OR
LEN
AN
NU
AL
REP
OR
T 20
09 •
CO
NSO
LID
ATE
D F
INA
NC
IAL
STA
TEM
ENTS
Exp
lan
ato
ry n
ote
s to
co
nso
lidat
ed
nan
cial
sta
tem
ents
fo
r th
e ye
ar e
nd
ed 3
1 d
ecem
ber
200
9 (a
ll am
ou
nts
in
PLN
th
ou
san
d)
158
for the year ended31.12.2009
for the year ended31.12.2008
Revenues 852 1,018
Cost of nished goods, merchandise and raw materials sold (672) (698)
Gross pro t on sales 180 320
General and administrative expenses (2,063) (2,126)
Operating revenues and expenses, net 706 1,083
Financial revenues and expenses, net 1,082 1,330
Pro t before tax (95) 607
Income tax expense (21) 114
Net pro t (75) 493
11. IMPAIRMENT OF ASSETS
As at 31 December 2009 the PKN ORLEN Group carried out an impairment test for particular Cash Generating Units
(CGUs) where indicators for impairment as according to IAS 36 were identi ed. Test results showed the lack of neces-
sity to recognize or reverse impairment allowances.
As at 31 December 2008 the most signi cant impairment allowance of assets concerned CGU ORLEN Lietuva presented
in the re ning segment (note 8) and amounted to PLN (2,177,549) thousand. Recognition and reversal of impairment
allowances concerned machinery and equipment in the amount of PLN (1,921,240) thousand, buildings and construc-
tions in the amount of PLN (189,556) thousand and other in the amount of PLN (66,753) thousand. The pre – tax
discount rate for ORLEN Lietuva amounted to 10.80%. Since USD is the functional currency for ORLEN Lietuva, the risk
free rate was calculated on the basis of interest rates of US treasury bonds.
Information about the circumstances for impairment test for 2008 was presented in consolidated nancial statements
of the PKN ORKEN Group for the year 2008 (note 7.8).
The analysis were performed based on nancial projections of PKN ORLEN included in the approved Midterm Plan
for the years 2009–2013 adjusted by approved budgets for 2010 and 2009, as per nancial model for the year 2009
and 2008, respectively. The projections for the following years were estimated on the basis of prior year data with
adjustments changing the cash ows to the adequate level. The period of CGU analysis was established on the basis
on planned useful life of assets for the particular CGU’s.
The Group’s future nancial performance is based on number of variables and assumptions, that are in respect of mac-
roeconomic factors, such as foreign exchange rates, commodity prices, interest rates, partially out of the Company’s
control. The change of these variables and assumptions might in uence the Company’s nancial position, including
the results of the impairment tests of Non-current assets, and consequently might lead to changes in nancial position
and performance of the Company.
Information about recognitions and reversals of allowances by category is included in property, plant and equipment
movement table (note 6), intangible assets movement table (note 8).
Should the prior year’s assumptions be used, the value of the impairment allowance would be similar.
158

PKN
OR
LEN
SA
CA
PITA
L G
RO
UP
Exp
lan
ato
ry n
ote
s to
co
nso
lidat
ed
nan
cial
sta
tem
ents
fo
r th
e ye
ar e
nd
ed 3
1 d
ecem
ber
200
9 (a
ll am
ou
nts
in
PLN
th
ou
san
d)
159
12. NON-CURRENT LOANS AND RECEIVABLES
as at31.12.2009
as at31.12.2008
Prepayments for construction in progress Financial assetsat fair value through pro t and loss 698 39,937
Loans granted 34,967 18,009
Financial assets at fair value through pro t and loss – 12,057
Other receivables 11,282 17,743
46,947 87,746
13. INVENTORY
as at31.12.2009
as at31.12.2008
Raw materials 5,816,392 4,920,803
Work in progress 763,586 753,667
Finished goods 3,544,367 3,033,643
Merchandise 495,514 380,934
10,619,859 9,089,047
Entrepreneurs operating on the Polish market were obliged to create by the end of 2009 mandatory reserves of crude
oil and fuels (excluding LPG) at the level of minimum 76-day average of daily production or import, realized by a pro-
ducer or a trading entity in previous year. For LPG, the obligatory quantity corresponds to at least 13 day period.
The detailed methods of calculation and formation of the mandatory reserves of liquid fuels in Poland are contained
in the Minister of Economy Regulation of 28 August 2009 (Of cial Journal no. 150 item 1211).
The detailed methods of calculation and formation of the mandatory reserves of liquid fuels in the Republic of Lithua-
nia is contained in Regulation no. 1901 of 5 December 2002 regarding approval of construction procedure, collection
and maintenance of crude oil-derivatives and oil products and minimal amounts of crude-oil derivative products.
The above-mentioned regulation was changed on 28 December 2008 with an amendment to the Act no X-115, effec-
tive from 1 January 2009. According to this amendment, 90-day mandatory reserves should be accumulated by the end
of 2009. The amendment changed also the proportion of mandatory reserves. Instead of previous 50%/50% relation
between entrepreneurs and State Agency, the former should maintain mandatory reserves at the level of 60-days
and the latter at the level of 30-days of the daily sale of fuels.
In the Czech Republic methods of calculation and formation of the mandatory reserves of liquid fuels are contained
in Act no 189/1999 “Mandatory reserves of crude oil” published by the Parliament of Czech Republic at 29 July 1999
and amended by Regulation no. 560/2004 of 24 September 2004. Mandatory reserves are maintained by State Agency
for 90 days of net crude oil import and are nanced from the budget.
As at 31 December 2009 and 31 December 2008 the gross value of mandatory reserves in the Group amounted
to PLN 6,050,447 thousand and PLN 5,261,019 thousand, respectively.
The inventory allowances amounted to PLN 142,097 thousand as at 31 December 2009 and PLN 511,930 thousand
as at 31 December 2008. The inventory allowances are presented in cost of sales.
As at 31 December 2009 and 31 December 2008 inventories of PLN 161,460 thousand and PLN 180,558 thousand,
respectively, were used as a pledge for the Group’s bank loan liabilities.
159
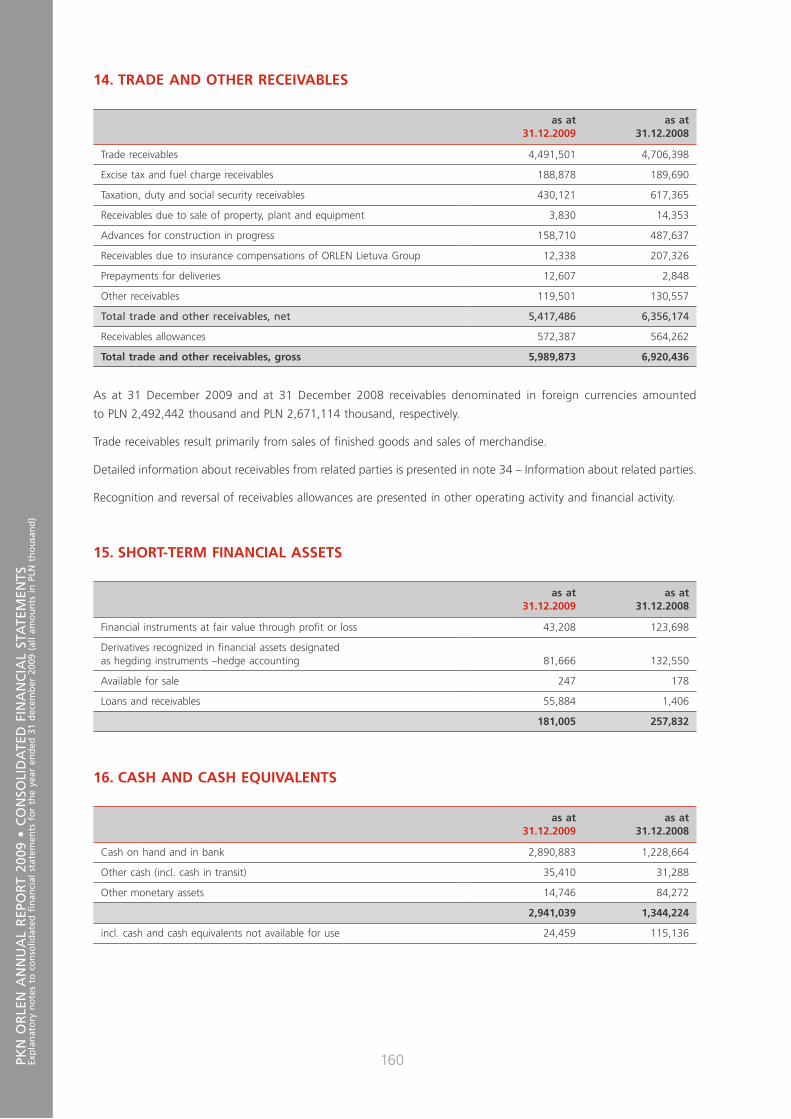
PKN
OR
LEN
AN
NU
AL
REP
OR
T 20
09 •
CO
NSO
LID
ATE
D F
INA
NC
IAL
STA
TEM
ENTS
Exp
lan
ato
ry n
ote
s to
co
nso
lidat
ed
nan
cial
sta
tem
ents
fo
r th
e ye
ar e
nd
ed 3
1 d
ecem
ber
200
9 (a
ll am
ou
nts
in
PLN
th
ou
san
d)
160
14. TRADE AND OTHER RECEIVABLES
as at31.12.2009
as at31.12.2008
Trade receivables 4,491,501 4,706,398
Excise tax and fuel charge receivables 188,878 189,690
Taxation, duty and social security receivables 430,121 617,365
Receivables due to sale of property, plant and equipment 3,830 14,353
Advances for construction in progress 158,710 487,637
Receivables due to insurance compensations of ORLEN Lietuva Group 12,338 207,326
Prepayments for deliveries 12,607 2,848
Other receivables 119,501 130,557
Total trade and other receivables, net 5,417,486 6,356,174
Receivables allowances 572,387 564,262
Total trade and other receivables, gross 5,989,873 6,920,436
As at 31 December 2009 and at 31 December 2008 receivables denominated in foreign currencies amounted
to PLN 2,492,442 thousand and PLN 2,671,114 thousand, respectively.
Trade receivables result primarily from sales of nished goods and sales of merchandise.
Detailed information about receivables from related parties is presented in note 34 – Information about related parties.
Recognition and reversal of receivables allowances are presented in other operating activity and nancial activity.
15. SHORT-TERM FINANCIAL ASSETS
as at31.12.2009
as at31.12.2008
Financial instruments at fair value through pro t or loss 43,208 123,698
Derivatives recognized in nancial assets designatedas hegding instruments –hedge accounting 81,666 132,550
Available for sale 247 178
Loans and receivables 55,884 1,406
181,005 257,832
16. CASH AND CASH EQUIVALENTS
as at31.12.2009
as at31.12.2008
Cash on hand and in bank 2,890,883 1,228,664
Other cash (incl. cash in transit) 35,410 31,288
Other monetary assets 14,746 84,272
2,941,039 1,344,224
incl. cash and cash equivalents not available for use 24,459 115,136
160

PKN
OR
LEN
SA
CA
PITA
L G
RO
UP
Exp
lan
ato
ry n
ote
s to
co
nso
lidat
ed
nan
cial
sta
tem
ents
fo
r th
e ye
ar e
nd
ed 3
1 d
ecem
ber
200
9 (a
ll am
ou
nts
in
PLN
th
ou
san
d)
161
17. NON-CURRENT ASSETS CLASSIFIED AS HELD FOR SALE
In PKN ORLEN Group the following assets were classi ed as held for sale:
as at31.12.2009
as at31.12.2008
Shares in Celio 12,173 12,267
Shares in Konsorcjum Olejów Przepracowanych 84 84
Shares in Apex-Elzar and Arbud 4,784 –
Other non-current assets 15,137 39,136
32,178 51,487
As at 31 December 2009 UNIPETROL Group had 97 shares in CELIO a.s. of nominal value CZK 1 million. The share
of Unipetrol Group in CELIO a.s., has been classi ed as assets held for sale. The Management Board and Supervisory
Board of UNIPETROL has approved the sale plan of the investment in CELIO a.s. Total value of the investment amounts
to CZK 78,333 thousand. Transaction of sale is expected to be realized in April 2010.
Other Non-current assets comprise warehouse bases, buildings and constructions, land, machinery and equipment
and vehicles.
In 2009 the impairment of Non-current assets classi ed as held for sale amounted to PLN 4,404 thousand.
18. SHAREHOLDERS’ EQUITY
In accordance with the Commercial Register, the share capital of Polski Koncern Naftowy ORLEN SA as at 31 Decem-
ber 2009 amounted to PLN 534,636 thousand. It is divided into 427,709,061 ordinary shares with nominal value
of PLN 1.25 each.
The share capital as at 31 December 2009 and 31 December 2008 consisted of the following series of shares:
Numberof shares issuedas at 31.12.2009
Numberof shares issuedas at 31.12.2008
Number of shares authorized
as at 31.12.2009
Number of shares authorized
as at 31.12.2008
A Series 336,000,000 336,000,000 336,000,000 336,000,000
B Series 6,971,496 6,971,496 6,971,496 6,971,496
C Series 77,205,641 77,205,641 77,205,641 77,205,641
D Series 7,531,924 7,531,924 7,531,924 7,531,924
427,709,061 427,709,061 427,709,061 427,709,061
In Poland, each new issuance of shares is labeled as a new series of shares. All of the above series have the exact
same rights.
Capital management
The purpose of the Group regarding capital management is to protect the Group’s ability to continue its operations
as a going concern while maximizing returns for shareholders.
The Management Board monitors return on equity ratio (ROE), which is de ned as a ratio of result from operations
to equity. As at 31 December 2009 and 31 December 2008 ROE amounted to 5% and (8%), respectively.
The Management Board monitors the level of dividend attributable to ordinary shares as well. Additionally, the Group
monitors debt ratio.
161

PKN
OR
LEN
AN
NU
AL
REP
OR
T 20
09 •
CO
NSO
LID
ATE
D F
INA
NC
IAL
STA
TEM
ENTS
Exp
lan
ato
ry n
ote
s to
co
nso
lidat
ed
nan
cial
sta
tem
ents
fo
r th
e ye
ar e
nd
ed 3
1 d
ecem
ber
200
9 (a
ll am
ou
nts
in
PLN
th
ou
san
d)
162
as at31.12.2009
as at31.12.2008
Indebtedness 13,204,227 13,892,765
Cash and cash equivalents 2,941,039 1,344,224
Net debt 10,263,188 12,548,541
Share capital 21,707,211 20,531,647
Net debt to equity 47% 61%
18.1. Selected data in respect of shareholder’s equity (attributable to equity holders of the Parent)
As at the date of change in the accounting principles, i.e. rst-time adoption of the IFRSs, the share capital in accord-
ance with IAS 29.24 and 29.25, was revalued on a basis of monthly general price indices by PLN 522,999 thousand
and presented as share capital revaluation adjustment in the balance sheet.
Share premium is the surplus of the issuance value over the nominal value of shares belonging to series B, C and D.
As at the date of change in the accounting principles, i.e. rst-time adoption of the IFRSs, the share premium in ac-
cordance with IAS 29.24 and 29.25, was revalued on a basis of monthly general price indices by PLN 168,803 thousand
and presented as share premium revaluation adjustment in the balance sheet.
The amount of the hedging reserve results from valuation of derivatives meeting the requirements of cash ows hedge
accounting.
The amount of foreign exchange differences on subsidiaries from consolidation is adjusted by foreign exchange differ-
ences resulting from translation of the nancial statements of ORLEN Deutschland from EUR into PLN, Unipetrol Group
from CZK into PLN and ORLEN Lietuva Group from USD into PLN. Foreign exchange differences resulting from trans-
lation of bank loans liabilities denominated in USD, that are designated as net as net investment hedge in a foreign
operation, are also recognized in this position.
18.2. Share capital
as at31.12.2009
as at31.12.2008
Share capital 534,636 534,636
Share capital revaluation adjustment 522,999 522,999
1,057,635 1,057,635
18.3. Share premium
as at31.12.2009
as at31.12.2008
Nominal share premium 1,058,450 1,058,450
Share premium revaluation adjustment 168,803 168,803
1,227,253 1,227,253
18.4. Suggested distribution of the pro t for 2009
a) Suggested distribution of the pro t for 2009
The Dividend Policy of PKN ORLEN SA assumes setting recommended dividend in relation to free cash ows for share-
holders after realization of investment budget and optimization of capital structure („Free Cash Flow to Equity” – FCFE).
According to the applied methodology, the Management Board considers dividend payment (taking into account result
162
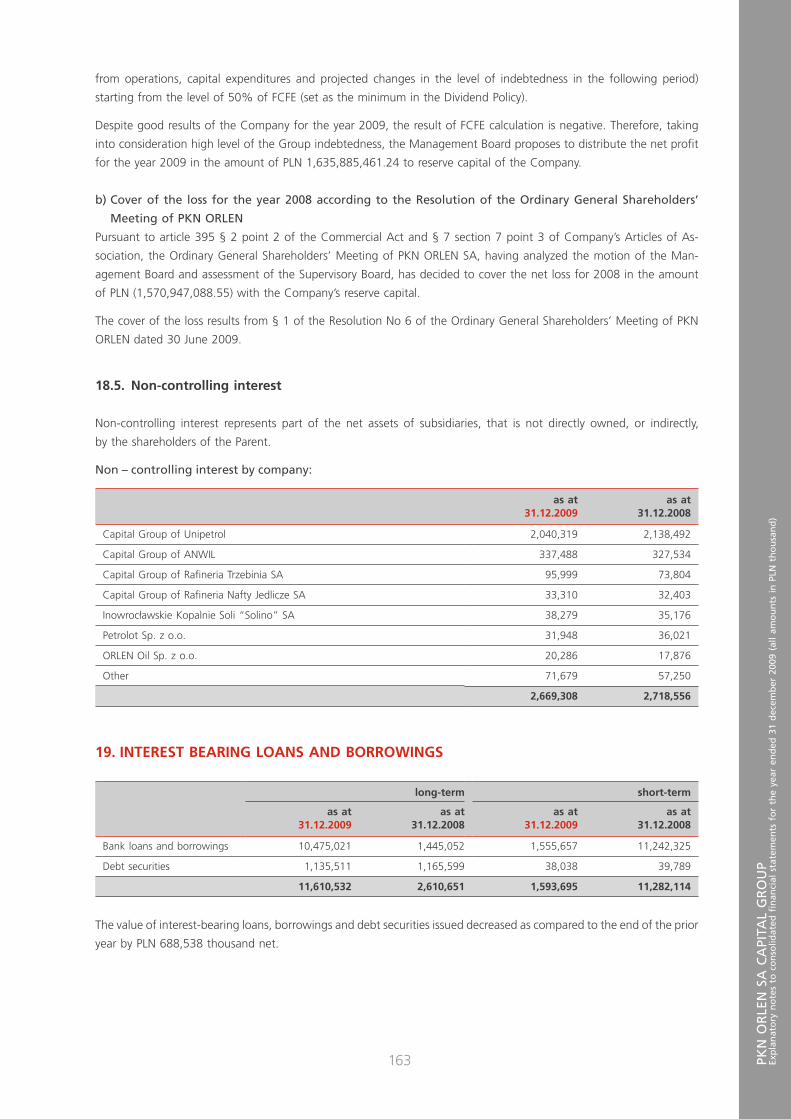
PKN
OR
LEN
SA
CA
PITA
L G
RO
UP
Exp
lan
ato
ry n
ote
s to
co
nso
lidat
ed
nan
cial
sta
tem
ents
fo
r th
e ye
ar e
nd
ed 3
1 d
ecem
ber
200
9 (a
ll am
ou
nts
in
PLN
th
ou
san
d)
163
from operations, capital expenditures and projected changes in the level of indebtedness in the following period)
starting from the level of 50% of FCFE (set as the minimum in the Dividend Policy).
Despite good results of the Company for the year 2009, the result of FCFE calculation is negative. Therefore, taking
into consideration high level of the Group indebtedness, the Management Board proposes to distribute the net pro t
for the year 2009 in the amount of PLN 1,635,885,461.24 to reserve capital of the Company.
b) Cover of the loss for the year 2008 according to the Resolution of the Ordinary General Shareholders’
Meeting of PKN ORLEN
Pursuant to article 395 § 2 point 2 of the Commercial Act and § 7 section 7 point 3 of Company’s Articles of As-
sociation, the Ordinary General Shareholders’ Meeting of PKN ORLEN SA, having analyzed the motion of the Man-
agement Board and assessment of the Supervisory Board, has decided to cover the net loss for 2008 in the amount
of PLN (1,570,947,088.55) with the Company’s reserve capital.
The cover of the loss results from § 1 of the Resolution No 6 of the Ordinary General Shareholders’ Meeting of PKN
ORLEN dated 30 June 2009.
18.5. Non-controlling interest
Non-controlling interest represents part of the net assets of subsidiaries, that is not directly owned, or indirectly,
by the shareholders of the Parent.
Non – controlling interest by company:
as at31.12.2009
as at31.12.2008
Capital Group of Unipetrol 2,040,319 2,138,492
Capital Group of ANWIL 337,488 327,534
Capital Group of Ra neria Trzebinia SA 95,999 73,804
Capital Group of Ra neria Nafty Jedlicze SA 33,310 32,403
Inowroc³awskie Kopalnie Soli “Solino” SA 38,279 35,176
Petrolot Sp. z o.o. 31,948 36,021
ORLEN Oil Sp. z o.o. 20,286 17,876
Other 71,679 57,250
2,669,308 2,718,556
19. INTEREST BEARING LOANS AND BORROWINGS
long-term short-term
as at31.12.2009
as at31.12.2008
as at31.12.2009
as at31.12.2008
Bank loans and borrowings 10,475,021 1,445,052 1,555,657 11,242,325
Debt securities 1,135,511 1,165,599 38,038 39,789
11,610,532 2,610,651 1,593,695 11,282,114
The value of interest-bearing loans, borrowings and debt securities issued decreased as compared to the end of the prior
year by PLN 688,538 thousand net.
163
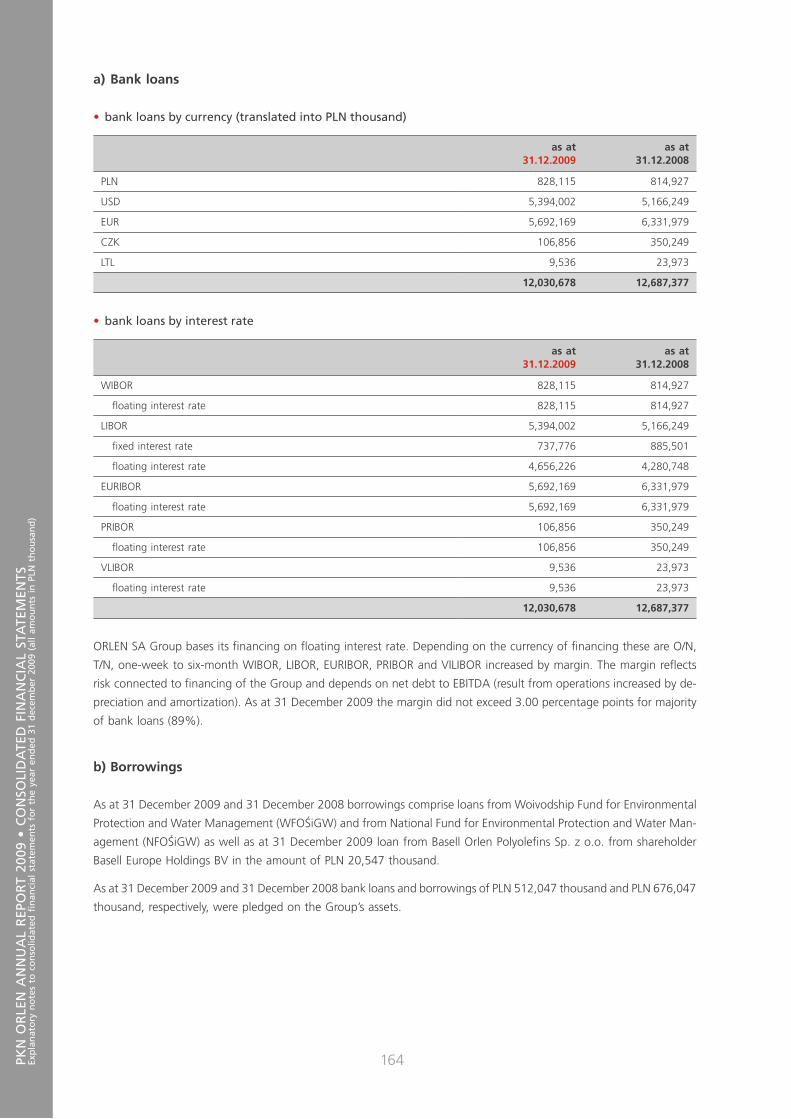
PKN
OR
LEN
AN
NU
AL
REP
OR
T 20
09 •
CO
NSO
LID
ATE
D F
INA
NC
IAL
STA
TEM
ENTS
Exp
lan
ato
ry n
ote
s to
co
nso
lidat
ed
nan
cial
sta
tem
ents
fo
r th
e ye
ar e
nd
ed 3
1 d
ecem
ber
200
9 (a
ll am
ou
nts
in
PLN
th
ou
san
d)
164
a) Bank loans
• bank loans by currency (translated into PLN thousand)
as at31.12.2009
as at31.12.2008
PLN 828,115 814,927
USD 5,394,002 5,166,249
EUR 5,692,169 6,331,979
CZK 106,856 350,249
LTL 9,536 23,973
12,030,678 12,687,377
• bank loans by interest rate
as at31.12.2009
as at31.12.2008
WIBOR 828,115 814,927
oating interest rate 828,115 814,927
LIBOR 5,394,002 5,166,249
xed interest rate 737,776 885,501
oating interest rate 4,656,226 4,280,748
EURIBOR 5,692,169 6,331,979
oating interest rate 5,692,169 6,331,979
PRIBOR 106,856 350,249
oating interest rate 106,856 350,249
VLIBOR 9,536 23,973
oating interest rate 9,536 23,973
12,030,678 12,687,377
ORLEN SA Group bases its nancing on oating interest rate. Depending on the currency of nancing these are O/N,
T/N, one-week to six-month WIBOR, LIBOR, EURIBOR, PRIBOR and VILIBOR increased by margin. The margin re ects
risk connected to nancing of the Group and depends on net debt to EBITDA (result from operations increased by de-
preciation and amortization). As at 31 December 2009 the margin did not exceed 3.00 percentage points for majority
of bank loans (89%).
b) Borrowings
As at 31 December 2009 and 31 December 2008 borrowings comprise loans from Woivodship Fund for Environmental
Protection and Water Management (WFOŚiGW) and from National Fund for Environmental Protection and Water Man-
agement (NFOŚiGW) as well as at 31 December 2009 loan from Basell Orlen Polyole ns Sp. z o.o. from shareholder
Basell Europe Holdings BV in the amount of PLN 20,547 thousand.
As at 31 December 2009 and 31 December 2008 bank loans and borrowings of PLN 512,047 thousand and PLN 676,047
thousand, respectively, were pledged on the Group’s assets.
164

PKN
OR
LEN
SA
CA
PITA
L G
RO
UP
Exp
lan
ato
ry n
ote
s to
co
nso
lidat
ed
nan
cial
sta
tem
ents
fo
r th
e ye
ar e
nd
ed 3
1 d
ecem
ber
200
9 (a
ll am
ou
nts
in
PLN
th
ou
san
d)
165
c) Debt securities
• debt securities by maturity date
The balance of debt securities as at 31 December 2009 was as follows:
Long-term xed rate bonds Long-term oating rate bonds
Nominal value 310,800 750,000
Carrying amount 411,462 762,087
Expiration date 2013–12–28 2012–02–27
Type of surety no surety no surety
• debt securities by currency (translated into PLN thousand)
as at31.12.2009
as at31.12.2008
PLN 762,087 767,723
CZK 411,462 437,665
1,173,549 1,205,388
The Group utilizes loans and borrowings both in PLN and foreign currencies, subject mainly to oating interest rates.
In the foregoing nancial statements as at 31 December 2008 bank loans of PLN 9,475,449 thousand were reclassi ed
from long-term liabilities to Short-term liabilities. The amount relates to liabilities resulting from bank loan agreements
containing provisions specifying the required level of net debt to EBITDA (result from operations increased by depre-
ciation) which was exceeded as at 31 December 2008. Detailed description is included in the consolidated nancial
statements for 2008 (note 7.16).
In April 2009 negotiations between the Parent Company and lenders being the parties of the agreements mentioned
above had been nalized. The consent to a temporary breach of the maximum debt ratio and the continuation
of cooperation within previously set bank loan limits and maturity dates had been received. In December 2009 other
entity belonging to the Capital Group received consent from the lenders to breach the maximum debt ratio as at
31 December 2008 and restructured its bank loan agreement which resulted in extension of the period of nancing.
Neither during the period covered by the foregoing nancial statements nor after the reporting date, there were no
cases of violations of loans and borrowings repayments in respect of both principle and interest.
20. PROVISIONS
long-term short-term
as at31.12.2009
as at31.12.2008
as at31.12.2009
as at31.12.2008
Environmental 335,263 341,378 37,365 50,331
Jubilee and retirement bene ts provision 229,831 246,229 31,700 37,759
Business risk provision 63,917 83,400 78,256 555,512
Shield programs provision – 49,266 51,369 40,762
Other 32,910 27,014 648,427 68,696
661,921 747,287 847,117 753,060
The following changes in provisions occurred in 2009:
165
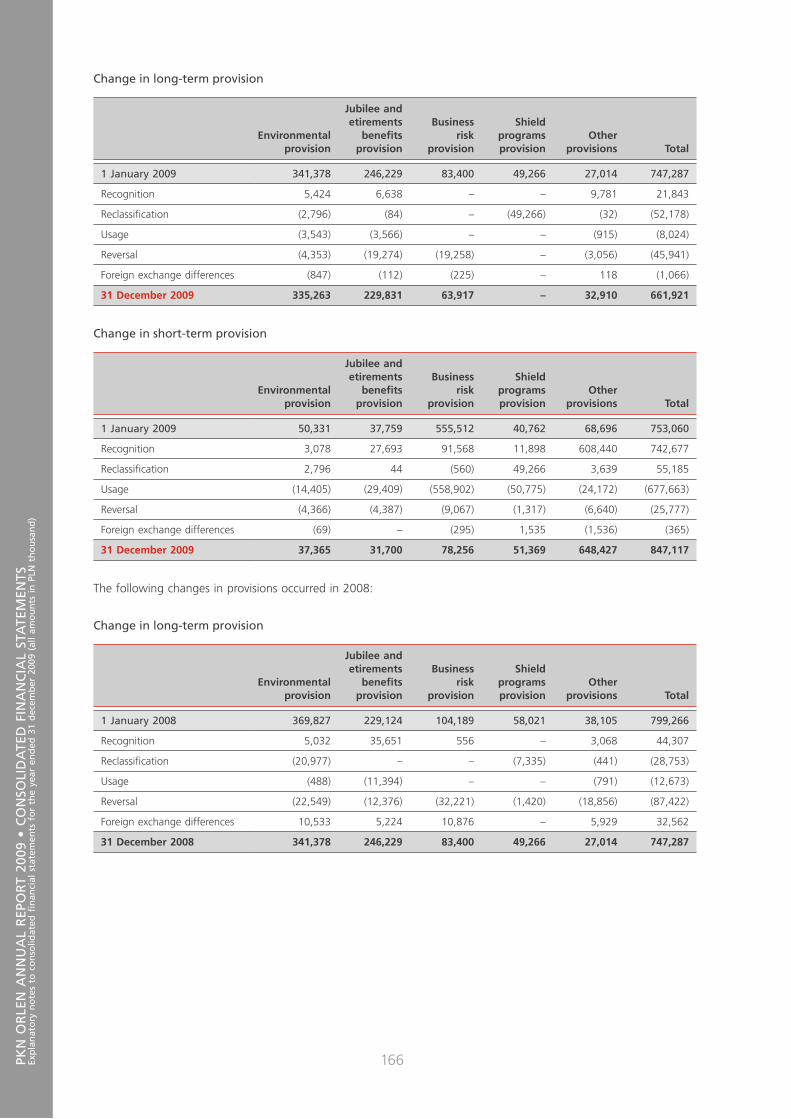
PKN
OR
LEN
AN
NU
AL
REP
OR
T 20
09 •
CO
NSO
LID
ATE
D F
INA
NC
IAL
STA
TEM
ENTS
Exp
lan
ato
ry n
ote
s to
co
nso
lidat
ed
nan
cial
sta
tem
ents
fo
r th
e ye
ar e
nd
ed 3
1 d
ecem
ber
200
9 (a
ll am
ou
nts
in
PLN
th
ou
san
d)
166
Change in long-term provision
Environmentalprovision
Jubilee andetirements
bene tsprovision
Businessrisk
provision
Shield programsprovision
Other provisions Total
1 January 2009 341,378 246,229 83,400 49,266 27,014 747,287
Recognition 5,424 6,638 – – 9,781 21,843
Reclassi cation (2,796) (84) – (49,266) (32) (52,178)
Usage (3,543) (3,566) – – (915) (8,024)
Reversal (4,353) (19,274) (19,258) – (3,056) (45,941)
Foreign exchange differences (847) (112) (225) – 118 (1,066)
31 December 2009 335,263 229,831 63,917 – 32,910 661,921
Change in short-term provision
Environmentalprovision
Jubilee andetirements
bene tsprovision
Businessrisk
provision
Shield programsprovision
Other provisions Total
1 January 2009 50,331 37,759 555,512 40,762 68,696 753,060
Recognition 3,078 27,693 91,568 11,898 608,440 742,677
Reclassi cation 2,796 44 (560) 49,266 3,639 55,185
Usage (14,405) (29,409) (558,902) (50,775) (24,172) (677,663)
Reversal (4,366) (4,387) (9,067) (1,317) (6,640) (25,777)
Foreign exchange differences (69) – (295) 1,535 (1,536) (365)
31 December 2009 37,365 31,700 78,256 51,369 648,427 847,117
The following changes in provisions occurred in 2008:
Change in long-term provision
Environmentalprovision
Jubilee andetirements
bene tsprovision
Businessrisk
provision
Shield programsprovision
Other provisions Total
1 January 2008 369,827 229,124 104,189 58,021 38,105 799,266
Recognition 5,032 35,651 556 – 3,068 44,307
Reclassi cation (20,977) – – (7,335) (441) (28,753)
Usage (488) (11,394) – – (791) (12,673)
Reversal (22,549) (12,376) (32,221) (1,420) (18,856) (87,422)
Foreign exchange differences 10,533 5,224 10,876 – 5,929 32,562
31 December 2008 341,378 246,229 83,400 49,266 27,014 747,287
166
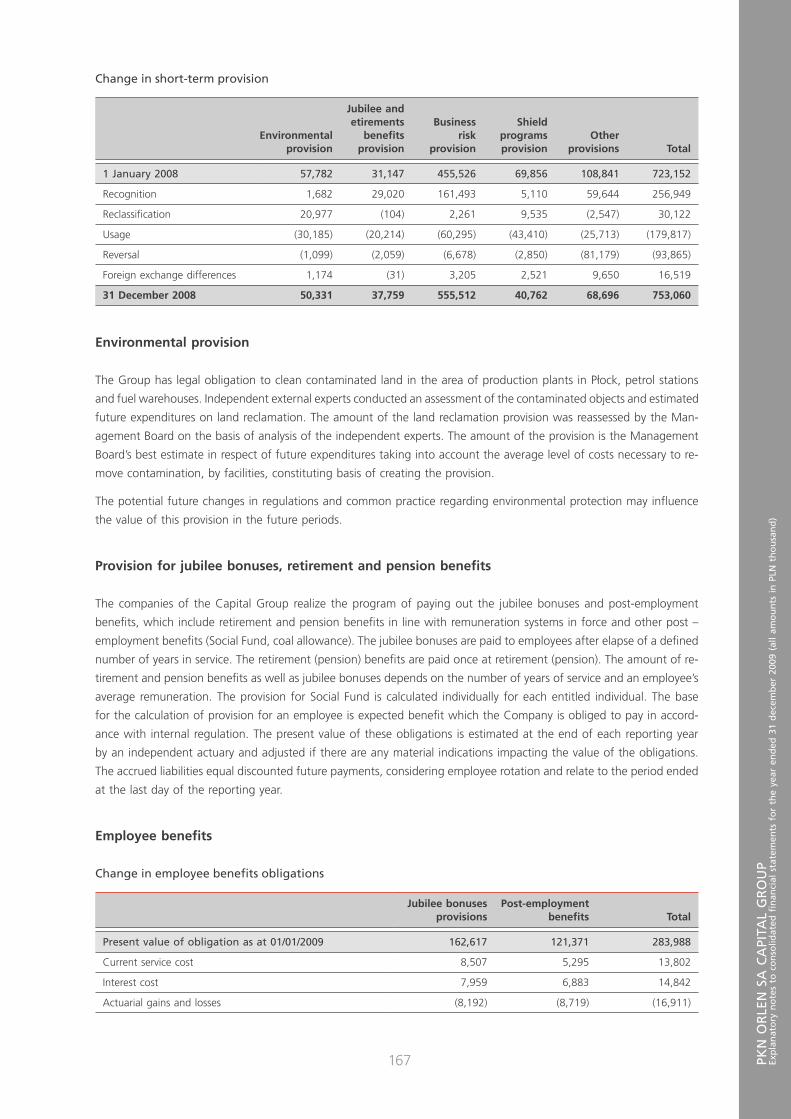
PKN
OR
LEN
SA
CA
PITA
L G
RO
UP
Exp
lan
ato
ry n
ote
s to
co
nso
lidat
ed
nan
cial
sta
tem
ents
fo
r th
e ye
ar e
nd
ed 3
1 d
ecem
ber
200
9 (a
ll am
ou
nts
in
PLN
th
ou
san
d)
167
Change in short-term provision
Environmentalprovision
Jubilee andetirements
bene tsprovision
Businessrisk
provision
Shield programsprovision
Other provisions Total
1 January 2008 57,782 31,147 455,526 69,856 108,841 723,152
Recognition 1,682 29,020 161,493 5,110 59,644 256,949
Reclassi cation 20,977 (104) 2,261 9,535 (2,547) 30,122
Usage (30,185) (20,214) (60,295) (43,410) (25,713) (179,817)
Reversal (1,099) (2,059) (6,678) (2,850) (81,179) (93,865)
Foreign exchange differences 1,174 (31) 3,205 2,521 9,650 16,519
31 December 2008 50,331 37,759 555,512 40,762 68,696 753,060
Environmental provision
The Group has legal obligation to clean contaminated land in the area of production plants in P³ock, petrol stations
and fuel warehouses. Independent external experts conducted an assessment of the contaminated objects and estimated
future expenditures on land reclamation. The amount of the land reclamation provision was reassessed by the Man-
agement Board on the basis of analysis of the independent experts. The amount of the provision is the Management
Board’s best estimate in respect of future expenditures taking into account the average level of costs necessary to re-
move contamination, by facilities, constituting basis of creating the provision.
The potential future changes in regulations and common practice regarding environmental protection may in uence
the value of this provision in the future periods.
Provision for jubilee bo nuses, retirement and pension bene ts
The companies of the Capital Group realize the program of paying out the jubilee bonuses and post-employment
bene ts, which include retirement and pension bene ts in line with remuneration systems in force and other post –
employment bene ts (Social Fund, coal allowance). The jubilee bonuses are paid to employees after elapse of a de ned
number of years in service. The retirement (pension) bene ts are paid once at retirement (pension). The amount of re-
tirement and pension bene ts as well as jubilee bonuses depends on the number of years of service and an employee’s
average remuneration. The provision for Social Fund is calculated individually for each entitled individual. The base
for the calculation of provision for an employee is expected bene t which the Company is obliged to pay in accord-
ance with internal regulation. The present value of these obligations is estimated at the end of each reporting year
by an independent actuary and adjusted if there are any material indications impacting the value of the obligations.
The accrued liabilities equal discounted future payments, considering employee rotation and relate to the period ended
at the last day of the reporting year.
Employee bene ts
Change in employee bene ts obligations
Jubilee bonusesprovisions
Post-employmentbene ts Total
Present value of obligation as at 01/01/2009 162,617 121,371 283,988
Current service cost 8,507 5,295 13,802
Interest cost 7,959 6,883 14,842
Actuarial gains and losses (8,192) (8,719) (16,911)
167
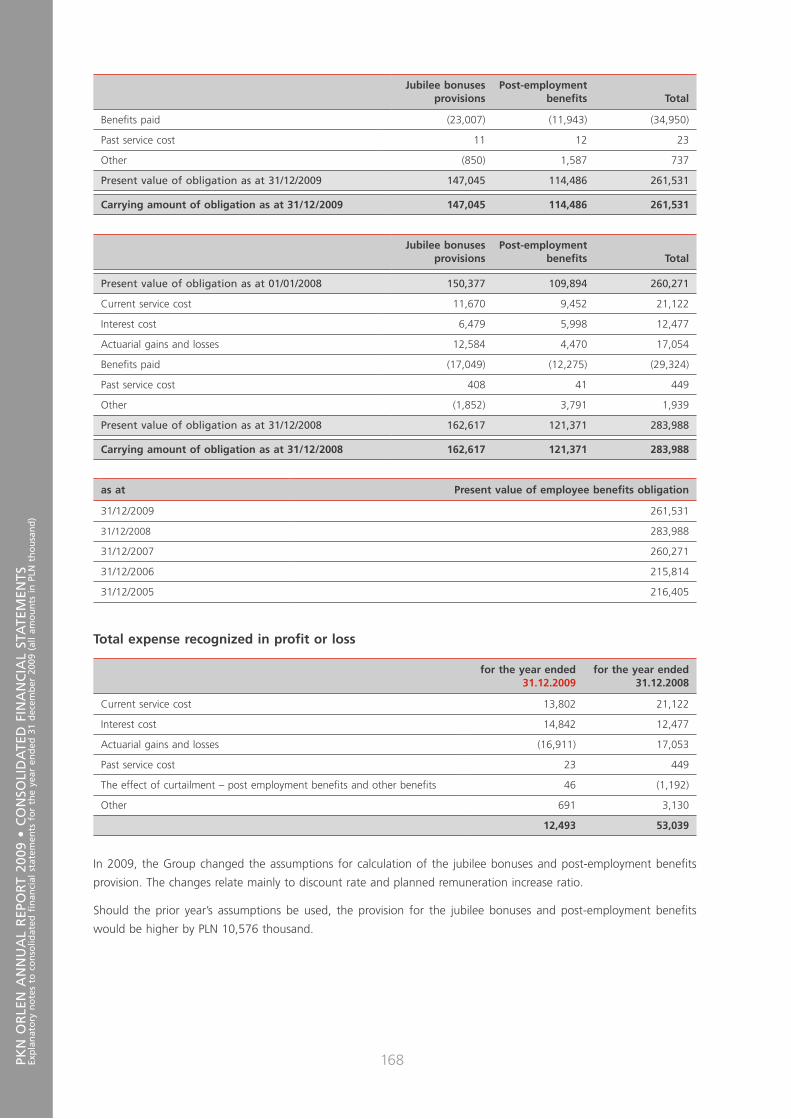
PKN
OR
LEN
AN
NU
AL
REP
OR
T 20
09 •
CO
NSO
LID
ATE
D F
INA
NC
IAL
STA
TEM
ENTS
Exp
lan
ato
ry n
ote
s to
co
nso
lidat
ed
nan
cial
sta
tem
ents
fo
r th
e ye
ar e
nd
ed 3
1 d
ecem
ber
200
9 (a
ll am
ou
nts
in
PLN
th
ou
san
d)
168
Jubilee bonusesprovisions
Post-employmentbene ts Total
Bene ts paid (23,007) (11,943) (34,950)
Past service cost 11 12 23
Other (850) 1,587 737
Present value of obligation as at 31/12/2009 147,045 114,486 261,531
Carrying amount of obligation as at 31/12/2009 147,045 114,486 261,531
Jubilee bonusesprovisions
Post-employmentbene ts Total
Present value of obligation as at 01/01/2008 150,377 109,894 260,271
Current service cost 11,670 9,452 21,122
Interest cost 6,479 5,998 12,477
Actuarial gains and losses 12,584 4,470 17,054
Bene ts paid (17,049) (12,275) (29,324)
Past service cost 408 41 449
Other (1,852) 3,791 1,939
Present value of obligation as at 31/12/2008 162,617 121,371 283,988
Carrying amount of obligation as at 31/12/2008 162,617 121,371 283,988
as at Present value of employee bene ts obligation
31/12/2009 261,531
31/12/2008 283,988
31/12/2007 260,271
31/12/2006 215,814
31/12/2005 216,405
Total expense recognized in pro t or loss
for the year ended31.12.2009
for the year ended31.12.2008
Current service cost 13,802 21,122
Interest cost 14,842 12,477
Actuarial gains and losses (16,911) 17,053
Past service cost 23 449
The effect of curtailment – post employment bene ts and other bene ts 46 (1,192)
Other 691 3,130
12,493 53,039
In 2009, the Group changed the assumptions for calculation of the jubilee bonuses and post-employment bene ts
provision. The changes relate mainly to discount rate and planned remuneration increase ratio.
Should the prior year’s assumptions be used, the provision for the jubilee bonuses and post-employment bene ts
would be higher by PLN 10,576 thousand.
168
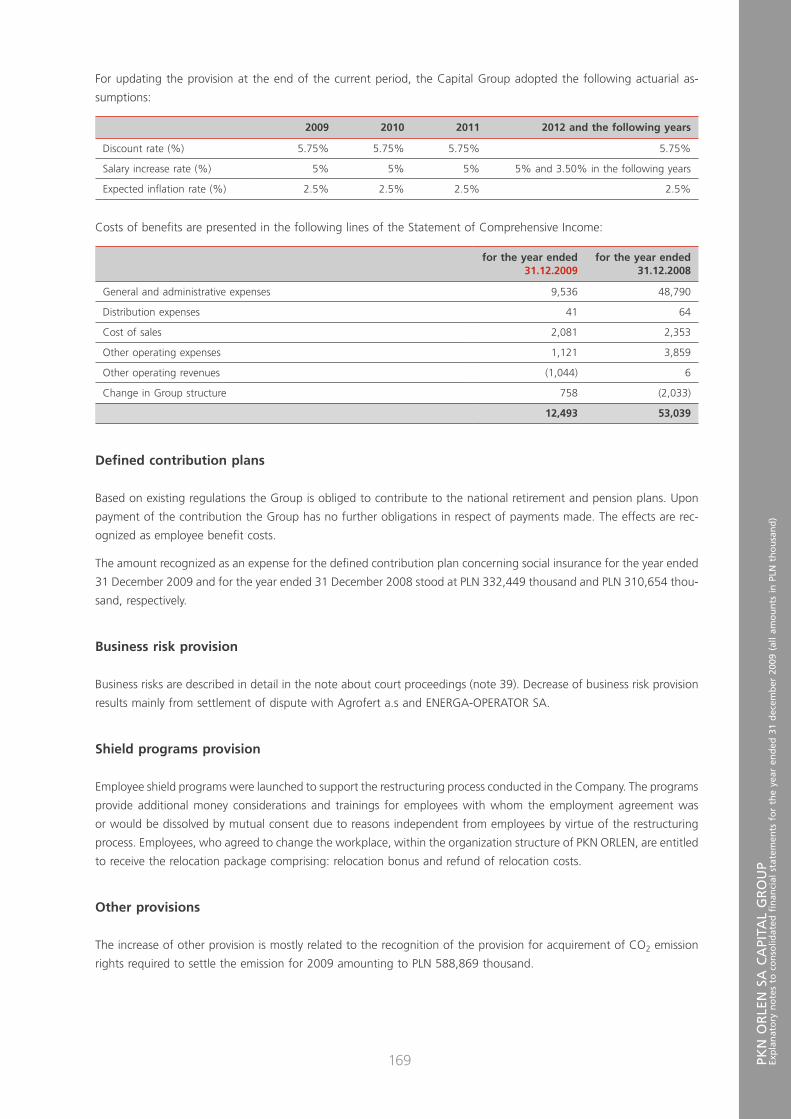
PKN
OR
LEN
SA
CA
PITA
L G
RO
UP
Exp
lan
ato
ry n
ote
s to
co
nso
lidat
ed
nan
cial
sta
tem
ents
fo
r th
e ye
ar e
nd
ed 3
1 d
ecem
ber
200
9 (a
ll am
ou
nts
in
PLN
th
ou
san
d)
169
For updating the provision at the end of the current period, the Capital Group adopted the following actuarial as-
sumptions:
2009 2010 2011 2012 and the following years
Discount rate (%) 5.75% 5.75% 5.75% 5.75%
Salary increase rate (%) 5% 5% 5% 5% and 3.50% in the following years
Expected in ation rate (%) 2.5% 2.5% 2.5% 2.5%
Costs of bene ts are presented in the following lines of the Statement of Comprehensive Income:
for the year ended31.12.2009
for the year ended31.12.2008
General and administrative expenses 9,536 48,790
Distribution expenses 41 64
Cost of sales 2,081 2,353
Other operating expenses 1,121 3,859
Other operating revenues (1,044) 6
Change in Group structure 758 (2,033)
12,493 53,039
De ned contribution plans
Based on existing regulations the Group is obliged to contribute to the national retirement and pension plans. Upon
payment of the contribution the Group has no further obligations in respect of payments made. The effects are rec-
ognized as employee bene t costs.
The amount recognized as an expense for the de ned contribution plan concerning social insurance for the year ended
31 December 2009 and for the year ended 31 December 2008 stood at PLN 332,449 thousand and PLN 310,654 thou-
sand, respectively.
Business risk provision
Business risks are described in detail in the note about court proceedings (note 39). Decrease of business risk provision
results mainly from settlement of dispute with Agrofert a.s and ENERGA-OPERATOR SA.
Shield programs provision
Employee shield programs were launched to support the restructuring process conducted in the Company. The programs
provide additional money considerations and trainings for employees with whom the employment agreement was
or would be dissolved by mutual consent due to reasons independent from employees by virtue of the restructuring
process. Employees, who agreed to change the workplace, within the organization structure of PKN ORLEN, are entitled
to receive the relocation package comprising: relocation bonus and refund of relocation costs.
Other provisions
The increase of other provision is mostly related to the recognition of the provision for acquirement of CO2 emission
rights required to settle the emission for 2009 amounting to PLN 588,869 thousand.
169
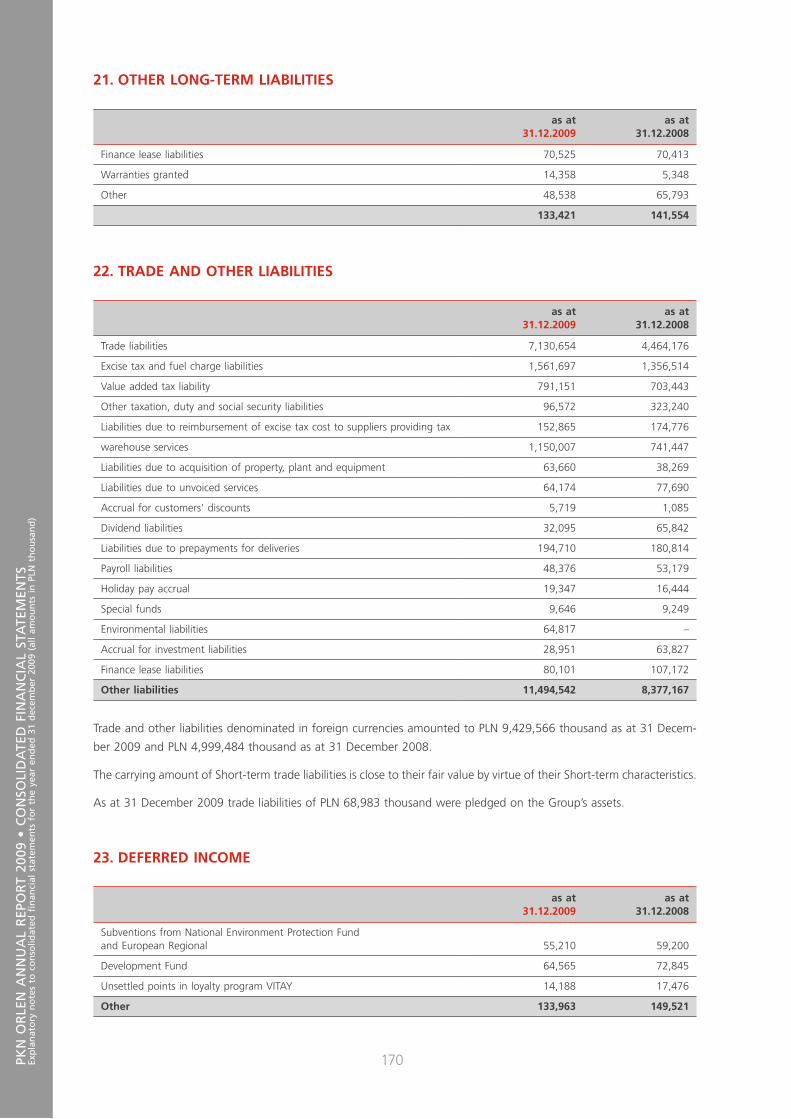
PKN
OR
LEN
AN
NU
AL
REP
OR
T 20
09 •
CO
NSO
LID
ATE
D F
INA
NC
IAL
STA
TEM
ENTS
Exp
lan
ato
ry n
ote
s to
co
nso
lidat
ed
nan
cial
sta
tem
ents
fo
r th
e ye
ar e
nd
ed 3
1 d
ecem
ber
200
9 (a
ll am
ou
nts
in
PLN
th
ou
san
d)
170
21. OTHER LONG-TERM LIABILITIES
as at31.12.2009
as at31.12.2008
Finance lease liabilities 70,525 70,413
Warranties granted 14,358 5,348
Other 48,538 65,793
133,421 141,554
22. TRADE AND OTHER LIABILITIES
as at31.12.2009
as at31.12.2008
Trade liabilities 7,130,654 4,464,176
Excise tax and fuel charge liabilities 1,561,697 1,356,514
Value added tax liability 791,151 703,443
Other taxation, duty and social security liabilities 96,572 323,240
Liabilities due to reimbursement of excise tax cost to suppliers providing tax 152,865 174,776
warehouse services 1,150,007 741,447
Liabilities due to acquisition of property, plant and equipment 63,660 38,269
Liabilities due to unvoiced services 64,174 77,690
Accrual for customers' discounts 5,719 1,085
Dividend liabilities 32,095 65,842
Liabilities due to prepayments for deliveries 194,710 180,814
Payroll liabilities 48,376 53,179
Holiday pay accrual 19,347 16,444
Special funds 9,646 9,249
Environmental liabilities 64,817 –
Accrual for investment liabilities 28,951 63,827
Finance lease liabilities 80,101 107,172
Other liabilities 11,494,542 8,377,167
Trade and other liabilities denominated in foreign currencies amounted to PLN 9,429,566 thousand as at 31 Decem-
ber 2009 and PLN 4,999,484 thousand as at 31 December 2008.
The carrying amount of Short-term trade liabilities is close to their fair value by virtue of their Short-term characteristics.
As at 31 December 2009 trade liabilities of PLN 68,983 thousand were pledged on the Group’s assets.
23. DEFERRED INCOME
as at31.12.2009
as at31.12.2008
Subventions from National Environment Protection Fundand European Regional 55,210 59,200
Development Fund 64,565 72,845
Unsettled points in loyalty program VITAY 14,188 17,476
Other 133,963 149,521
170
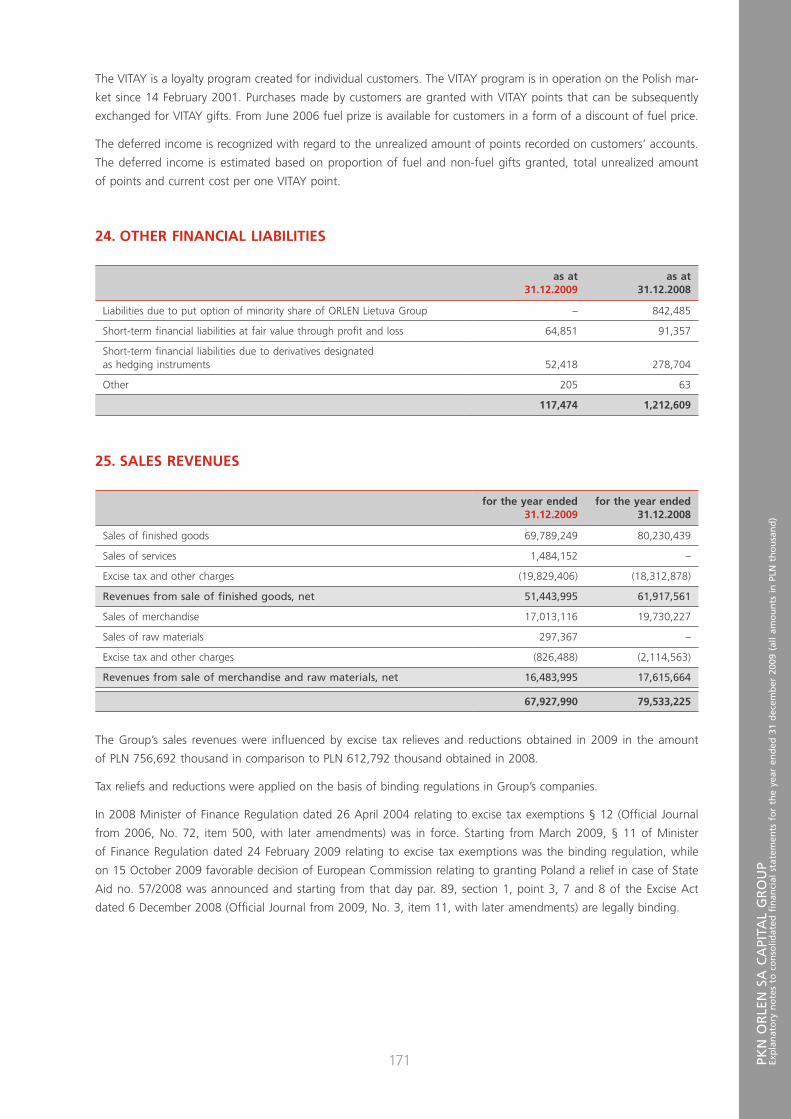
PKN
OR
LEN
SA
CA
PITA
L G
RO
UP
Exp
lan
ato
ry n
ote
s to
co
nso
lidat
ed
nan
cial
sta
tem
ents
fo
r th
e ye
ar e
nd
ed 3
1 d
ecem
ber
200
9 (a
ll am
ou
nts
in
PLN
th
ou
san
d)
171
The VITAY is a loyalty program created for individual customers. The VITAY program is in operation on the Polish mar-
ket since 14 February 2001. Purchases made by customers are granted with VITAY points that can be subsequently
exchanged for VITAY gifts. From June 2006 fuel prize is available for customers in a form of a discount of fuel price.
The deferred income is recognized with regard to the unrealized amount of points recorded on customers’ accounts.
The deferred income is estimated based on proportion of fuel and non-fuel gifts granted, total unrealized amount
of points and current cost per one VITAY point.
24. OTHER FINANCIAL LIABILITIES
as at31.12.2009
as at31.12.2008
Liabilities due to put option of minority share of ORLEN Lietuva Group – 842,485
Short-term nancial liabilities at fair value through pro t and loss 64,851 91,357
Short-term nancial liabilities due to derivatives designatedas hedging instruments 52,418 278,704
Other 205 63
117,474 1,212,609
25. SALES REVENUES
for the year ended31.12.2009
for the year ended31.12.2008
Sales of nished goods 69,789,249 80,230,439
Sales of services 1,484,152 –
Excise tax and other charges (19,829,406) (18,312,878)
Revenues from sale of nished goods, net 51,443,995 61,917,561
Sales of merchandise 17,013,116 19,730,227
Sales of raw materials 297,367 –
Excise tax and other charges (826,488) (2,114,563)
Revenues from sale of merchandise and raw materials, net 16,483,995 17,615,664
67,927,990 79,533,225
The Group’s sales revenues were in uenced by excise tax relieves and reductions obtained in 2009 in the amount
of PLN 756,692 thousand in comparison to PLN 612,792 thousand obtained in 2008.
Tax reliefs and reductions were applied on the basis of binding regulations in Group’s companies.
In 2008 Minister of Finance Regulation dated 26 April 2004 relating to excise tax exemptions § 12 (Of cial Journal
from 2006, No. 72, item 500, with later amendments) was in force. Starting from March 2009, § 11 of Minister
of Finance Regulation dated 24 February 2009 relating to excise tax exemptions was the binding regulation, while
on 15 October 2009 favorable decision of European Commission relating to granting Poland a relief in case of State
Aid no. 57/2008 was announced and starting from that day par. 89, section 1, point 3, 7 and 8 of the Excise Act
dated 6 December 2008 (Of cial Journal from 2009, No. 3, item 11, with later amendments) are legally binding.
171

PKN
OR
LEN
AN
NU
AL
REP
OR
T 20
09 •
CO
NSO
LID
ATE
D F
INA
NC
IAL
STA
TEM
ENTS
Exp
lan
ato
ry n
ote
s to
co
nso
lidat
ed
nan
cial
sta
tem
ents
fo
r th
e ye
ar e
nd
ed 3
1 d
ecem
ber
200
9 (a
ll am
ou
nts
in
PLN
th
ou
san
d)
172
26. OPERATING EXPENSES
Cost of sales
for the year ended31.12.2009
for the year ended31.12.2008
Cost of nished goods sold (46,825,709) (56,685,848)
Cost of merchandise and raw materials sold (15,022,992) (17,313,474)
(61,848,701) (73,999,322)
Cost by kind
for the year ended31.12.2009
for the year ended31.12.2008
Materials and energy (43,380,026) (52,235,477)
Cost of merchandise and materials sold (15,022,992) (17,313,474)
External services (3,699,892) (3,952,554)
Payroll, social security and other employee bene ts (2,003,670) (1,959,754)
Depreciation and amortisation (2,567,646) (2,491,383)
Taxes and charges (421,907) (437,282)
Other (1,634,767) (3,457,125)
Operating expenses (68,730,900) (81,847,048)
Change in inventory 480,187 (101,990)
Cost of products and services for own use 156,040 64,561
(68,094,673) (81,884,477)
Distribution expenses 3,507,700 3,323,721
General and administrative expenses 1,504,707 1,462,477
Other operating expenses 1,233,565 3,098,957
Cost of nished goods, merchandise and raw materials sold (61,848,701) (73,999,322)
External services include research expenditures of PLN 12,047 thousand in 2009 and PLN 20,394 thousand in 2008.
27. OTHER OPERATING REVENUES AND EXPENSES
Other operating revenues
for the year ended31.12.2009
for the year ended31.12.2008
Pro t on sale of non- nancial non-current assets 773,714 95,997
Reversal of provisions 46,714 125,562
Reversal of receivable impairment allowances 99,140 149,027
Reversal of impairment allowances of property,plant and equipment and intangible 184,153 136,833
assets 55,870 150,200
Penalties and compensations earned 6,526 7,004
Grants 12,845 12,458
Inventory count surpluses 84,797 70,849
Other 1,263,759 747,930
172
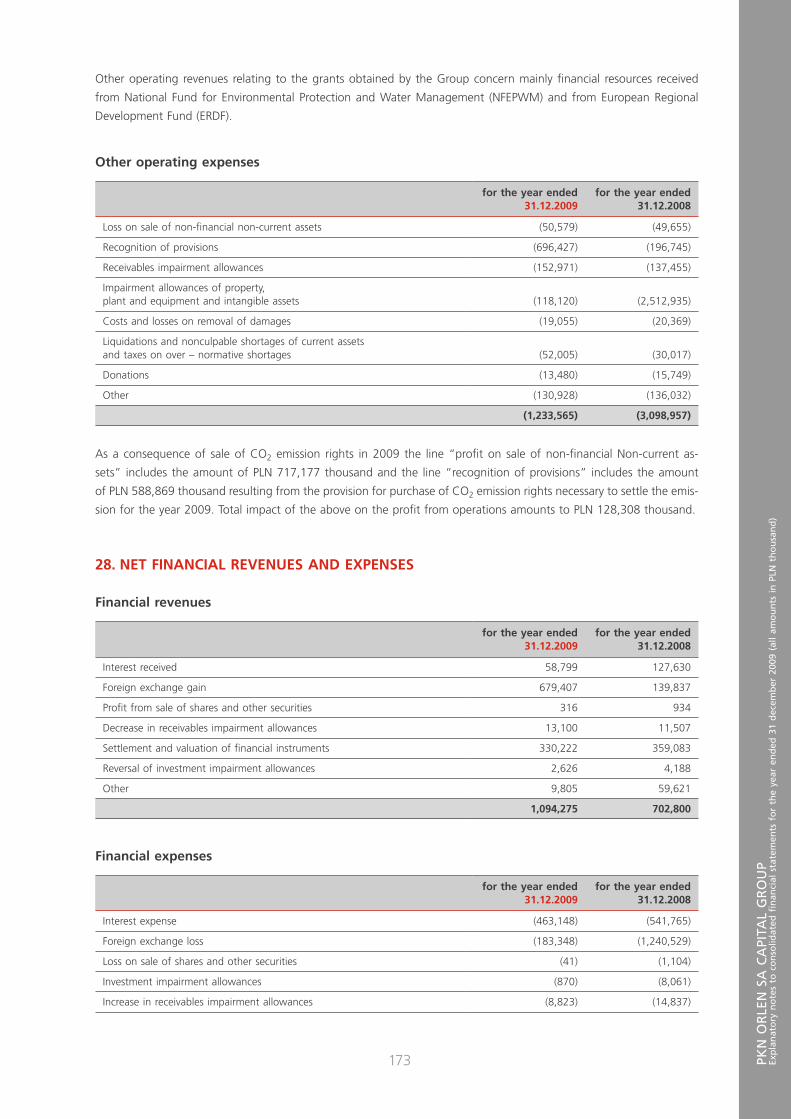
PKN
OR
LEN
SA
CA
PITA
L G
RO
UP
Exp
lan
ato
ry n
ote
s to
co
nso
lidat
ed
nan
cial
sta
tem
ents
fo
r th
e ye
ar e
nd
ed 3
1 d
ecem
ber
200
9 (a
ll am
ou
nts
in
PLN
th
ou
san
d)
173
Other operating revenues relating to the grants obtained by the Group concern mainly nancial resources received
from National Fund for Environmental Protection and Water Management (NFEPWM) and from European Regional
Development Fund (ERDF).
Other operating expenses
for the year ended31.12.2009
for the year ended31.12.2008
Loss on sale of non- nancial non-current assets (50,579) (49,655)
Recognition of provisions (696,427) (196,745)
Receivables impairment allowances (152,971) (137,455)
Impairment allowances of property,plant and equipment and intangible assets (118,120) (2,512,935)
Costs and losses on removal of damages (19,055) (20,369)
Liquidations and nonculpable shortages of current assetsand taxes on over – normative shortages (52,005) (30,017)
Donations (13,480) (15,749)
Other (130,928) (136,032)
(1,233,565) (3,098,957)
As a consequence of sale of CO2 emission rights in 2009 the line “pro t on sale of non- nancial Non-current as-
sets” includes the amount of PLN 717,177 thousand and the line “recognition of provisions” includes the amount
of PLN 588,869 thousand resulting from the provision for purchase of CO2 emission rights necessary to settle the emis-
sion for the year 2009. Total impact of the above on the pro t from operations amounts to PLN 128,308 thousand.
28. NET FINANCIAL REVENUES AND EXPENSES
Financial revenues
for the year ended31.12.2009
for the year ended31.12.2008
Interest received 58,799 127,630
Foreign exchange gain 679,407 139,837
Pro t from sale of shares and other securities 316 934
Decrease in receivables impairment allowances 13,100 11,507
Settlement and valuation of nancial instruments 330,222 359,083
Reversal of investment impairment allowances 2,626 4,188
Other 9,805 59,621
1,094,275 702,800
Financial expenses
for the year ended31.12.2009
for the year ended31.12.2008
Interest expense (463,148) (541,765)
Foreign exchange loss (183,348) (1,240,529)
Loss on sale of shares and other securities (41) (1,104)
Investment impairment allowances (870) (8,061)
Increase in receivables impairment allowances (8,823) (14,837)
173
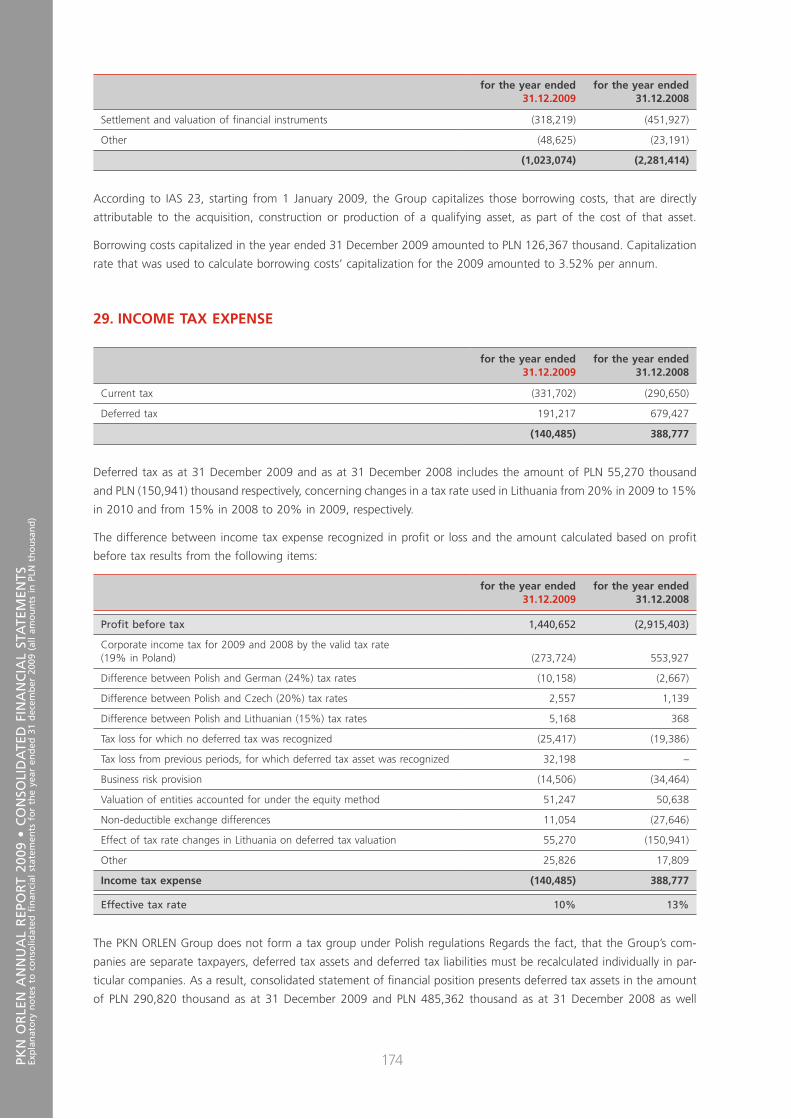
PKN
OR
LEN
AN
NU
AL
REP
OR
T 20
09 •
CO
NSO
LID
ATE
D F
INA
NC
IAL
STA
TEM
ENTS
Exp
lan
ato
ry n
ote
s to
co
nso
lidat
ed
nan
cial
sta
tem
ents
fo
r th
e ye
ar e
nd
ed 3
1 d
ecem
ber
200
9 (a
ll am
ou
nts
in
PLN
th
ou
san
d)
174
for the year ended31.12.2009
for the year ended31.12.2008
Settlement and valuation of nancial instruments (318,219) (451,927)
Other (48,625) (23,191)
(1,023,074) (2,281,414)
According to IAS 23, starting from 1 January 2009, the Group capitalizes those borrowing costs, that are directly
attributable to the acquisition, construction or production of a qualifying asset, as part of the cost of that asset.
Borrowing costs capitalized in the year ended 31 December 2009 amounted to PLN 126,367 thousand. Capitalization
rate that was used to calculate borrowing costs’ capitalization for the 2009 amounted to 3.52% per annum.
29. INCOME TAX EXPENSE
for the year ended31.12.2009
for the year ended31.12.2008
Current tax (331,702) (290,650)
Deferred tax 191,217 679,427
(140,485) 388,777
Deferred tax as at 31 December 2009 and as at 31 December 2008 includes the amount of PLN 55,270 thousand
and PLN (150,941) thousand respectively, concerning changes in a tax rate used in Lithuania from 20% in 2009 to 15%
in 2010 and from 15% in 2008 to 20% in 2009, respectively.
The difference between income tax expense recognized in pro t or loss and the amount calculated based on pro t
before tax results from the following items:
for the year ended31.12.2009
for the year ended31.12.2008
Pro t before tax 1,440,652 (2,915,403)
Corporate income tax for 2009 and 2008 by the valid tax rate(19% in Poland) (273,724) 553,927
Difference between Polish and German (24%) tax rates (10,158) (2,667)
Difference between Polish and Czech (20%) tax rates 2,557 1,139
Difference between Polish and Lithuanian (15%) tax rates 5,168 368
Tax loss for which no deferred tax was recognized (25,417) (19,386)
Tax loss from previous periods, for which deferred tax asset was recognized 32,198 –
Business risk provision (14,506) (34,464)
Valuation of entities accounted for under the equity method 51,247 50,638
Non-deductible exchange differences 11,054 (27,646)
Effect of tax rate changes in Lithuania on deferred tax valuation 55,270 (150,941)
Other 25,826 17,809
Income tax expense (140,485) 388,777
Effective tax rate 10% 13%
The PKN ORLEN Group does not form a tax group under Polish regulations Regards the fact, that the Group’s com-
panies are separate taxpayers, deferred tax assets and deferred tax liabilities must be recalculated individually in par-
ticular companies. As a result, consolidated statement of nancial position presents deferred tax assets in the amount
of PLN 290,820 thousand as at 31 December 2009 and PLN 485,362 thousand as at 31 December 2008 as well
174
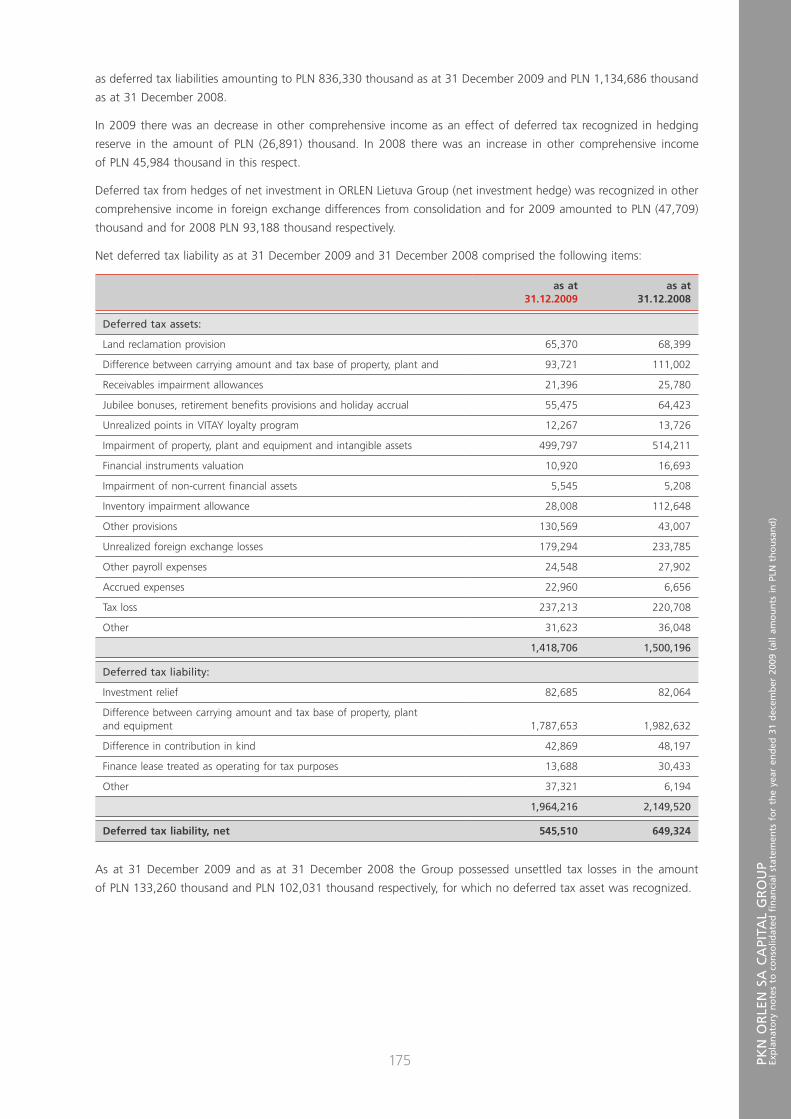
PKN
OR
LEN
SA
CA
PITA
L G
RO
UP
Exp
lan
ato
ry n
ote
s to
co
nso
lidat
ed
nan
cial
sta
tem
ents
fo
r th
e ye
ar e
nd
ed 3
1 d
ecem
ber
200
9 (a
ll am
ou
nts
in
PLN
th
ou
san
d)
175
as deferred tax liabilities amounting to PLN 836,330 thousand as at 31 December 2009 and PLN 1,134,686 thousand
as at 31 December 2008.
In 2009 there was an decrease in other comprehensive income as an effect of deferred tax recognized in hedging
reserve in the amount of PLN (26,891) thousand. In 2008 there was an increase in other comprehensive income
of PLN 45,984 thousand in this respect.
Deferred tax from hedges of net investment in ORLEN Lietuva Group (net investment hedge) was recognized in other
comprehensive income in foreign exchange differences from consolidation and for 2009 amounted to PLN (47,709)
thousand and for 2008 PLN 93,188 thousand respectively.
Net deferred tax liability as at 31 December 2009 and 31 December 2008 comprised the following items:
as at31.12.2009
as at31.12.2008
Deferred tax assets:
Land reclamation provision 65,370 68,399
Difference between carrying amount and tax base of property, plant and 93,721 111,002
Receivables impairment allowances 21,396 25,780
Jubilee bonuses, retirement bene ts provisions and holiday accrual 55,475 64,423
Unrealized points in VITAY loyalty program 12,267 13,726
Impairment of property, plant and equipment and intangible assets 499,797 514,211
Financial instruments valuation 10,920 16,693
Impairment of non-current nancial assets 5,545 5,208
Inventory impairment allowance 28,008 112,648
Other provisions 130,569 43,007
Unrealized foreign exchange losses 179,294 233,785
Other payroll expenses 24,548 27,902
Accrued expenses 22,960 6,656
Tax loss 237,213 220,708
Other 31,623 36,048
1,418,706 1,500,196
Deferred tax liability:
Investment relief 82,685 82,064
Difference between carrying amount and tax base of property, plant and equipment 1,787,653 1,982,632
Difference in contribution in kind 42,869 48,197
Finance lease treated as operating for tax purposes 13,688 30,433
Other 37,321 6,194
1,964,216 2,149,520
Deferred tax liability, net 545,510 649,324
As at 31 December 2009 and as at 31 December 2008 the Group possessed unsettled tax losses in the amount
of PLN 133,260 thousand and PLN 102,031 thousand respectively, for which no deferred tax asset was recognized.
175

PKN
OR
LEN
AN
NU
AL
REP
OR
T 20
09 •
CO
NSO
LID
ATE
D F
INA
NC
IAL
STA
TEM
ENTS
Exp
lan
ato
ry n
ote
s to
co
nso
lidat
ed
nan
cial
sta
tem
ents
fo
r th
e ye
ar e
nd
ed 3
1 d
ecem
ber
200
9 (a
ll am
ou
nts
in
PLN
th
ou
san
d)
176
30. EXPLANATORY NOTES TO THE STATEMENT OF CASH FLOWS
a) Explanation of differences between changes in the statement of nancial position captions and changes presented in the statement of cash ows
as at31.12.2009
as at31.12.2008
Change in trade receivables and other receivables presentedin the Statement of Financial Position 984,388 564,816
difference:
Transfer from operating activities to investing activities: (378,689) 7,944
Change in advances for property, plant and equipment (368,166) (4,738)
Change in investment receivables (10,523) 12,682
Change in the Group structure 3,478 (1,841)
Change in receivables transferred to non-current assets classi edas held for sale (14,969) –
Foreign exchange differences 20,295 393,076
Other 41,828 22,787
Change in receivables in the statement of cash ows 656,332 986,782
as at31.12.2009
as at31.12.2008
Change in inventories presented in the Statement of Financial Position (1,530,812) 1,276,362
Change in the Group structure – (6)
Foreign exchange differences (79,066) 500,049
Reclassi cations (53,027) –
Other 226 2,427
Change in inventories in the statement of cash ows (1,662,679) 1,778,832
as at31.12.2009
as at31.12.2008
Change in other long-term liabilities, trade liabilitiesand other liabilities presented in the Statement of Financial Position 3,109,242 (766,122)
difference:
Transfer from operating activities to investing activities: (408,560) 62,051
Change in investment liabilities (408,560) 62,051
Transfer from operating activities to nancing activities: 30,130 (30,120)
Change in dividend liabilities (4,634) 364
Change in nance lease liabilities 34,764 (30,484)
Change in the Group structure (7,508) (9,985)
Foreign exchange differences 93,054 (593,050)
Other 4,598 (72,171)
Change in liabilities in the statement of cash ows 2,820,956 (1,409,397)
176
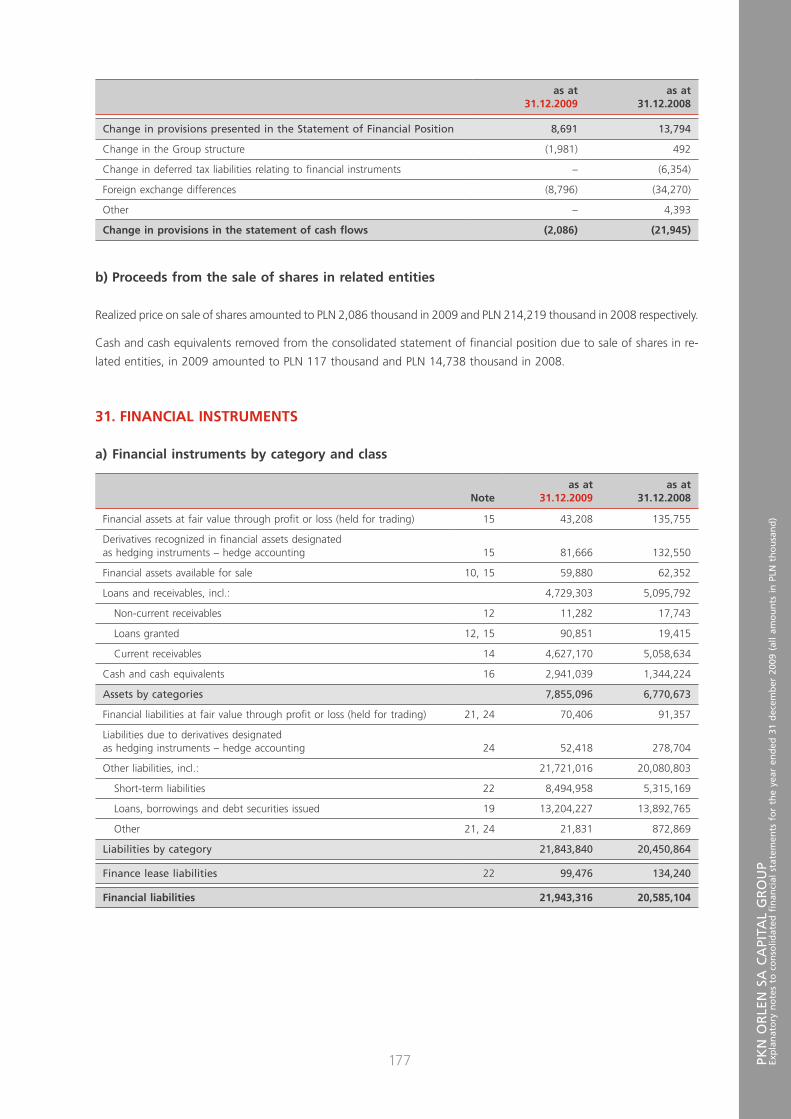
PKN
OR
LEN
SA
CA
PITA
L G
RO
UP
Exp
lan
ato
ry n
ote
s to
co
nso
lidat
ed
nan
cial
sta
tem
ents
fo
r th
e ye
ar e
nd
ed 3
1 d
ecem
ber
200
9 (a
ll am
ou
nts
in
PLN
th
ou
san
d)
177
as at31.12.2009
as at31.12.2008
Change in provisions presented in the Statement of Financial Position 8,691 13,794
Change in the Group structure (1,981) 492
Change in deferred tax liabilities relating to nancial instruments – (6,354)
Foreign exchange differences (8,796) (34,270)
Other – 4,393
Change in provisions in the statement of cash ows (2,086) (21,945)
b) Proceeds from the sale of shares in related entities
Realized price on sale of shares amounted to PLN 2,086 thousand in 2009 and PLN 214,219 thousand in 2008 respectively.
Cash and cash equivalents removed from the consolidated statement of nancial position due to sale of shares in re-
lated entities, in 2009 amounted to PLN 117 thousand and PLN 14,738 thousand in 2008.
31. FINANCIAL INSTRUMENTS
a) Financial instruments by category and class
Noteas at
31.12.2009as at
31.12.2008
Financial assets at fair value through pro t or loss (held for trading) 15 43,208 135,755
Derivatives recognized in nancial assets designatedas hedging instruments – hedge accounting 15 81,666 132,550
Financial assets available for sale 10, 15 59,880 62,352
Loans and receivables, incl.: 4,729,303 5,095,792
Non-current receivables 12 11,282 17,743
Loans granted 12, 15 90,851 19,415
Current receivables 14 4,627,170 5,058,634
Cash and cash equivalents 16 2,941,039 1,344,224
Assets by categories 7,855,096 6,770,673
Financial liabilities at fair value through pro t or loss (held for trading) 21, 24 70,406 91,357
Liabilities due to derivatives designatedas hedging instruments – hedge accounting 24 52,418 278,704
Other liabilities, incl.: 21,721,016 20,080,803
Short-term liabilities 22 8,494,958 5,315,169
Loans, borrowings and debt securities issued 19 13,204,227 13,892,765
Other 21, 24 21,831 872,869
Liabilities by category 21,843,840 20,450,864
Finance lease liabilities 22 99,476 134,240
Financial liabilities 21,943,316 20,585,104
177
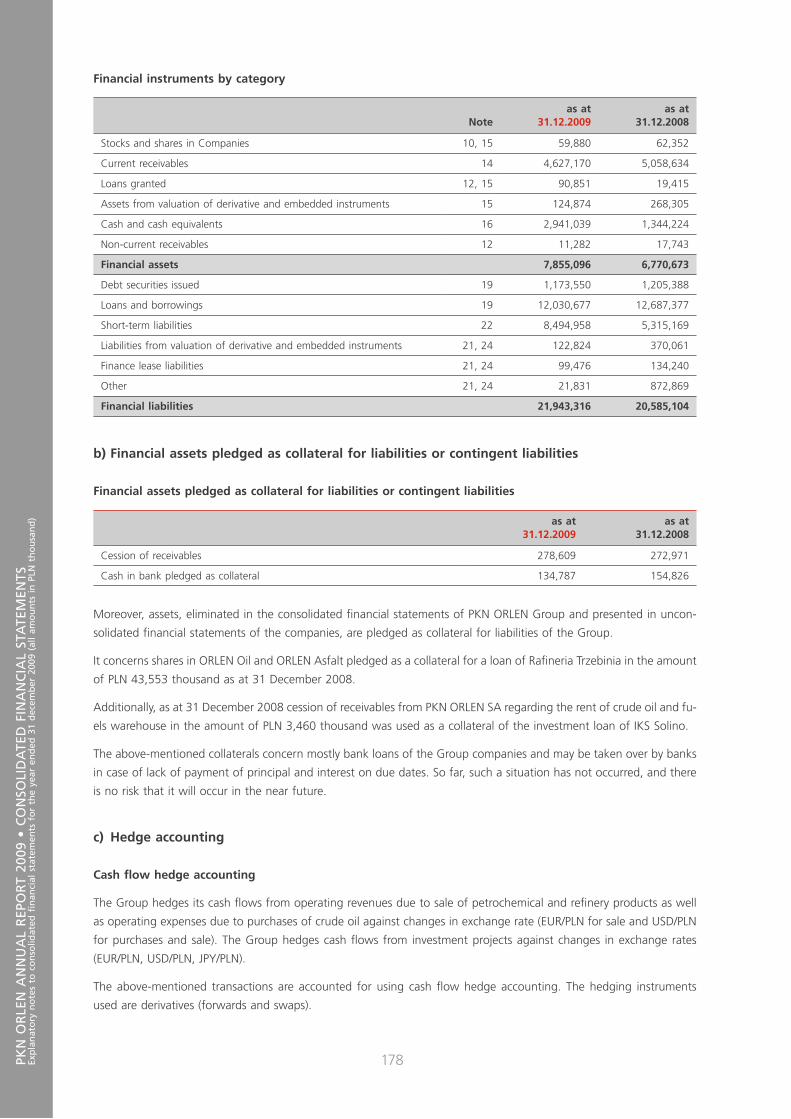
PKN
OR
LEN
AN
NU
AL
REP
OR
T 20
09 •
CO
NSO
LID
ATE
D F
INA
NC
IAL
STA
TEM
ENTS
Exp
lan
ato
ry n
ote
s to
co
nso
lidat
ed
nan
cial
sta
tem
ents
fo
r th
e ye
ar e
nd
ed 3
1 d
ecem
ber
200
9 (a
ll am
ou
nts
in
PLN
th
ou
san
d)
178
Financial instruments by category
Noteas at
31.12.2009as at
31.12.2008
Stocks and shares in Companies 10, 15 59,880 62,352
Current receivables 14 4,627,170 5,058,634
Loans granted 12, 15 90,851 19,415
Assets from valuation of derivative and embedded instruments 15 124,874 268,305
Cash and cash equivalents 16 2,941,039 1,344,224
Non-current receivables 12 11,282 17,743
Financial assets 7,855,096 6,770,673
Debt securities issued 19 1,173,550 1,205,388
Loans and borrowings 19 12,030,677 12,687,377
Short-term liabilities 22 8,494,958 5,315,169
Liabilities from valuation of derivative and embedded instruments 21, 24 122,824 370,061
Finance lease liabilities 21, 24 99,476 134,240
Other 21, 24 21,831 872,869
Financial liabilities 21,943,316 20,585,104
b) Financial assets pledged as collateral for liabilities or contingent liabilities
Financial assets pledged as collateral for liabilities or contingent liabilities
as at31.12.2009
as at31.12.2008
Cession of receivables 278,609 272,971
Cash in bank pledged as collateral 134,787 154,826
Moreover, assets, eliminated in the consolidated nancial statements of PKN ORLEN Group and presented in uncon-
solidated nancial statements of the companies, are pledged as collateral for liabilities of the Group.
It concerns shares in ORLEN Oil and ORLEN Asfalt pledged as a collateral for a loan of Ra neria Trzebinia in the amount
of PLN 43,553 thousand as at 31 December 2008.
Additionally, as at 31 December 2008 cession of receivables from PKN ORLEN SA regarding the rent of crude oil and fu-
els warehouse in the amount of PLN 3,460 thousand was used as a collateral of the investment loan of IKS Solino.
The above-mentioned collaterals concern mostly bank loans of the Group companies and may be taken over by banks
in case of lack of payment of principal and interest on due dates. So far, such a situation has not occurred, and there
is no risk that it will occur in the near future.
c) Hedge accounting
Cash ow hedge accounting
The Group hedges its cash ows from operating revenues due to sale of petrochemical and re nery products as well
as operating expenses due to purchases of crude oil against changes in exchange rate (EUR/PLN for sale and USD/PLN
for purchases and sale). The Group hedges cash ows from investment projects against changes in exchange rates
(EUR/PLN, USD/PLN, JPY/PLN).
The above-mentioned transactions are accounted for using cash ow hedge accounting. The hedging instruments
used are derivatives (forwards and swaps).
178

PKN
OR
LEN
SA
CA
PITA
L G
RO
UP
Exp
lan
ato
ry n
ote
s to
co
nso
lidat
ed
nan
cial
sta
tem
ents
fo
r th
e ye
ar e
nd
ed 3
1 d
ecem
ber
200
9 (a
ll am
ou
nts
in
PLN
th
ou
san
d)
179
Additionally, the Group hedges cash ows from interest payments connected with issuance of bonds in PLN and cash
ows from interest payments concerning external nancing using interest rate swaps (IRS).
Hedging transactions, settlement and fair value measurement of which in uence the foregoing nancial statements
were concluded in the years 2007–2009.
The fair value of derivative instruments designated as hedging instruments according to cash ow hedge accounting,
planned realization date and planned date of the in uence on the result of the hedged cash ow:
• fair value which will be recognized in pro t or loss at the realization date:
as at31.12.2009
as at31.12.2008
Planned realization date of hedged cash ows
Currency operating exposure
2009 – (242,545)
2010 40,246 –
Interest rate exposure
2009–2012 – (29,919)
1Q 2010 – 1Q 2012 (5,154) –
1Q 2010 – 1Q 2014 (12,284) –
22,808 (272,464)
• fair value which will be included in the cost of property, plant and equipment at the realization date
and recognized in pro t or loss through depreciation charges in the following periods:
as at31.12.2009
as at31.12.2008
Planned realization date of hedged cash ows
2009 (currency investment exposure) – 105,494
2010 and following years (currency investment exposure) 6,441 20,816
6,441 126,310
In 2009 the amount of PLN (214,031) thousand was derecognized from equity and recognized:
• in pro t or loss as sales of nished goods – PLN (313,143) thousand, in the foreign exchange differences surplus –
PLN 9,776 thousand, in interest expense – PLN 261 thousand and in nancial expenses from the settlement of in-
struments – PLN (15,364) thousand, and
• in construction in progress – PLN 104,444 thousand.
In 2008 the amount of PLN 62,645 thousand was derecognized from equity and recognized:
• in pro t or loss as sales of nished goods – PLN 72,438 thousand, foreign exchange differences surplus – PLN
(6,557) thousand, interest expenses – PLN 48 thousand and nancial expenses from the settlement of instruments –
PLN (3,131) thousand and
• in the carrying amount of property, plant and equipment – PLN (156) thousand.
As the Group owns contracts concerning both purchase and sale of currency, market changes are signi cantly com-
pensated in the economic sense.
Transactions for which hedge accounting is not applied
For the transactions concluded and settled in the same quarter the Group does not apply hedge accounting. The set-
tlement result is recognized in the current period pro t or loss.
179

PKN
OR
LEN
AN
NU
AL
REP
OR
T 20
09 •
CO
NSO
LID
ATE
D F
INA
NC
IAL
STA
TEM
ENTS
Exp
lan
ato
ry n
ote
s to
co
nso
lidat
ed
nan
cial
sta
tem
ents
fo
r th
e ye
ar e
nd
ed 3
1 d
ecem
ber
200
9 (a
ll am
ou
nts
in
PLN
th
ou
san
d)
180
The fair value of transactions hedging cash ows connected with realization of investment projects against changes
in exchange rates (USD/PLN, EUR/PLN), for which hedge accounting is not appliad due to separation of embedded
derivatives for these contracts, amounted to PLN 17,886 thousand as at 31 December 2009 and PLN 111,553 thou-
sand as at 31 December 2008.
Net investment hedge in a foreign operation
Starting from the second quarter of 2008 the Group uses net investment hedges in a foreign operation (net invest-
ment hedge). Net investment hedge hedges currency risk of the portion of net investment in a foreign operation that
uses USD as its functional currency.
Financial liabilities denominated in USD were designated as an instrument hedging share in net assets of ORLEN Lietuva
Group. Negative foreign exchange differences resulting from translation of these liabilities into PLN in the amount
of PLN 381,944 thousand (net of deferred tax) were recognized in other comprehensive income in the line “Foreign
exchange differences on subsidiaries from consolidation”.
d) Fair value of nancial instruments
Comparison of fair values and carrying amounts of nancial instruments measured at amortized cost:
Financial assets
as at 31.12.2009 as at 31.12.2008
Fair value Carrying amount Fair value Carrying amount
Loans granted 90,739 90,851 19,220 19,415
Other 8,804 11,282 17,794 17,743
99,543 102,133 37,014 37,158
Financial liabilities
Debt securities is sued 1,206,947 1,173,550 1,197,112 1,205,388
Loans and borrowings 12,054,959 12,030,677 12,814,463 12,687,377
Finance lease liabilities 91,364 99,476 126,823 134,240
Other 21,460 21,831 853,404 872,806
13,374,730 13,325,534 14,991,802 14,899,811
The above comparison of carrying amounts and fair values of nancial instruments does not include current receivables
and Short-term liabilities for which carrying amount is similar to fair value.
Methods and assumptions applied in determining fair values of nancial instruments recognized in the state-
ment of nancial position at amortized cost
Purchased bonds, loans granted, nancial liabilities due to debt securities issued as well as loans liabilities are measured
at fair value using discounted cash ows method. Future cash ows are discounted using discount factors calculated
based on market interest rates (according to quotations of 3-month interest rates available in Reuters as at the end
of the reporting periods) increased by margins proper for particular nancial instruments.
as at31.12.2009
as at31.12.2008
WIBOR 3M 4.270% 5.880%
EURIBOR 3M 0.700% 2.892%
LIBOR 3M 0.251% 1.425%
PRIBOR 3M 1.540% 3.630%
VILIBOR 3M 3.900% 9.890%
180
PKN
OR
LEN
SA
CA
PITA
L G
RO
UP
Exp
lan
ato
ry n
ote
s to
co
nso
lidat
ed
nan
cial
sta
tem
ents
fo
r th
e ye
ar e
nd
ed 3
1 d
ecem
ber
200
9 (a
ll am
ou
nts
in
PLN
th
ou
san
d)
181
Methods applied in determining fair values of nancial instruments recognized in the statement of nancial
position at fair value
According to the International Financial Reporting Standards all derivate instruments presented in the consolidated
nancial statements are measured at fair value.
The Group measures derivative instruments at fair value using valuation models for nancial instruments based on gen-
erally available exchange rates, interest rates, forward and volatility curves, for currencies and commodities quoted
on active markets. As compared to the previous reporting period the Group has not changed valuation methods
concerning derivative instruments.
Derivative instruments are presented as assets, when their value is positive and as liabilities, when their value is nega-
tive. Gains and losses resulting from changes in fair value of derivative instruments, for which hedge accounting is not
applicable, are recognized in the current year pro t or loss.
Fair value of shares quoted on active markets is determined based on market quotations (level 1). In other cases, fair
value is determined based on input data, apart from market quotations classi ed at level 1, which are directly or in-
directly possible to observe (level 2).
Financial instruments for which fair value cannot be measured reliably
As at 31 December 2009 and 31 December 2008 the Group held shares in entities, whose fair value cannot be meas-
ured reliably. There are no active markets for these entities and no comparable transactions in the same instruments.
Shares were recognized in the Group’s statement of nancial position at acquisition cost less impairment allowances
in total amount of PLN 58,764 thousand and PLN 61,032 thousand as at 31 December 2009 and 31 December 2008
respectively. As at the end of the reporting period there are no binding decisions regarding method and date of the dis-
posal of these assets.
e) Nature and extent of risks arising from nancial instruments
The Group is exposed to the following nancial risks:
• credit risk;
• liquidity risk;
• market risks (including currency risk, interest rate risk).
Credit risk
The Group is signi cantly exposed to credit risk connected above all with trade receivables. Within its trading activity
the Group sells products and services with deferred payment term, which may result in the risk that customers will not
pay for the Group’s receivables from sales of products and services. In order to minimize credit risk and working capital
the Group manages the risk by credit limit policies governing granting of credit limits to customers and establishment
of pledges of appropriate types.
The established payment term of receivables connected with the ordinary course of sales amounts to 14–30 days.
Each non-cash customer is individually assessed with regard to credit risk. A part of trade receivables is insured within
an organized trade credit insurance program. In addition, trade receivables are monitored by nance departments
on a regular basis. In the event of occurrence of overdue receivables, sale is withheld and debt recovery procedures
implemented as described by the obliging procedures.
Based on the analysis of receivables the customers were divided into two groups:
• I group – customers with good or very goods history of cooperation in the current year;
• II group – other customers.
181
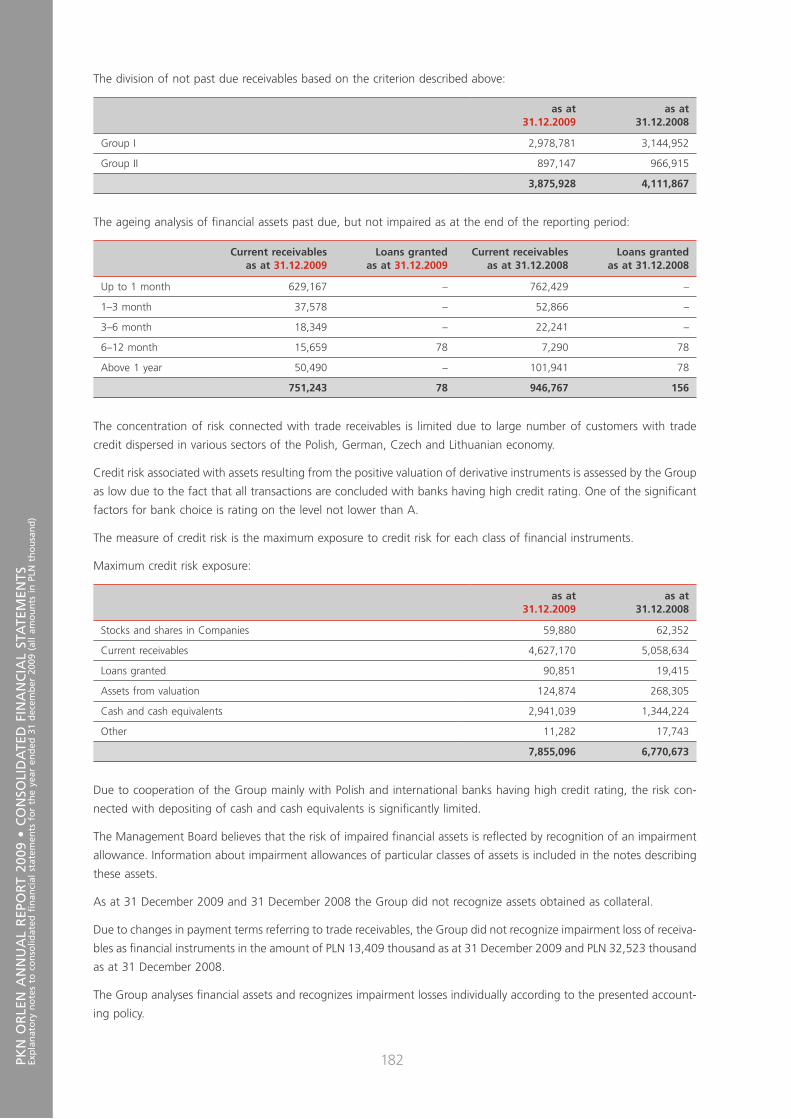
PKN
OR
LEN
AN
NU
AL
REP
OR
T 20
09 •
CO
NSO
LID
ATE
D F
INA
NC
IAL
STA
TEM
ENTS
Exp
lan
ato
ry n
ote
s to
co
nso
lidat
ed
nan
cial
sta
tem
ents
fo
r th
e ye
ar e
nd
ed 3
1 d
ecem
ber
200
9 (a
ll am
ou
nts
in
PLN
th
ou
san
d)
182
The division of not past due receivables based on the criterion described above:
as at31.12.2009
as at31.12.2008
Group I 2,978,781 3,144,952
Group II 897,147 966,915
3,875,928 4,111,867
The ageing analysis of nancial assets past due, but not impaired as at the end of the reporting period:
Current receivablesas at 31.12.2009
Loans grantedas at 31.12.2009
Current receivablesas at 31.12.2008
Loans grantedas at 31.12.2008
Up to 1 month 629,167 – 762,429 –
1–3 month 37,578 – 52,866 –
3–6 month 18,349 – 22,241 –
6–12 month 15,659 78 7,290 78
Above 1 year 50,490 – 101,941 78
751,243 78 946,767 156
The concentration of risk connected with trade receivables is limited due to large number of customers with trade
credit dispersed in various sectors of the Polish, German, Czech and Lithuanian economy.
Credit risk associated with assets resulting from the positive valuation of derivative instruments is assessed by the Group
as low due to the fact that all transactions are concluded with banks having high credit rating. One of the signi cant
factors for bank choice is rating on the level not lower than A.
The measure of credit risk is the maximum exposure to credit risk for each class of nancial instruments.
Maximum credit risk exposure:
as at31.12.2009
as at31.12.2008
Stocks and shares in Companies 59,880 62,352
Current receivables 4,627,170 5,058,634
Loans granted 90,851 19,415
Assets from valuation 124,874 268,305
Cash and cash equivalents 2,941,039 1,344,224
Other 11,282 17,743
7,855,096 6,770,673
Due to cooperation of the Group mainly with Polish and international banks having high credit rating, the risk con-
nected with depositing of cash and cash equivalents is signi cantly limited.
The Management Board believes that the risk of impaired nancial assets is re ected by recognition of an impairment
allowance. Information about impairment allowances of particular classes of assets is included in the notes describing
these assets.
As at 31 December 2009 and 31 December 2008 the Group did not recognize assets obtained as collateral.
Due to changes in payment terms referring to trade receivables, the Group did not recognize impairment loss of receiva-
bles as nancial instruments in the amount of PLN 13,409 thousand as at 31 December 2009 and PLN 32,523 thousand
as at 31 December 2008.
The Group analyses nancial assets and recognizes impairment losses individually according to the presented account-
ing policy.
182
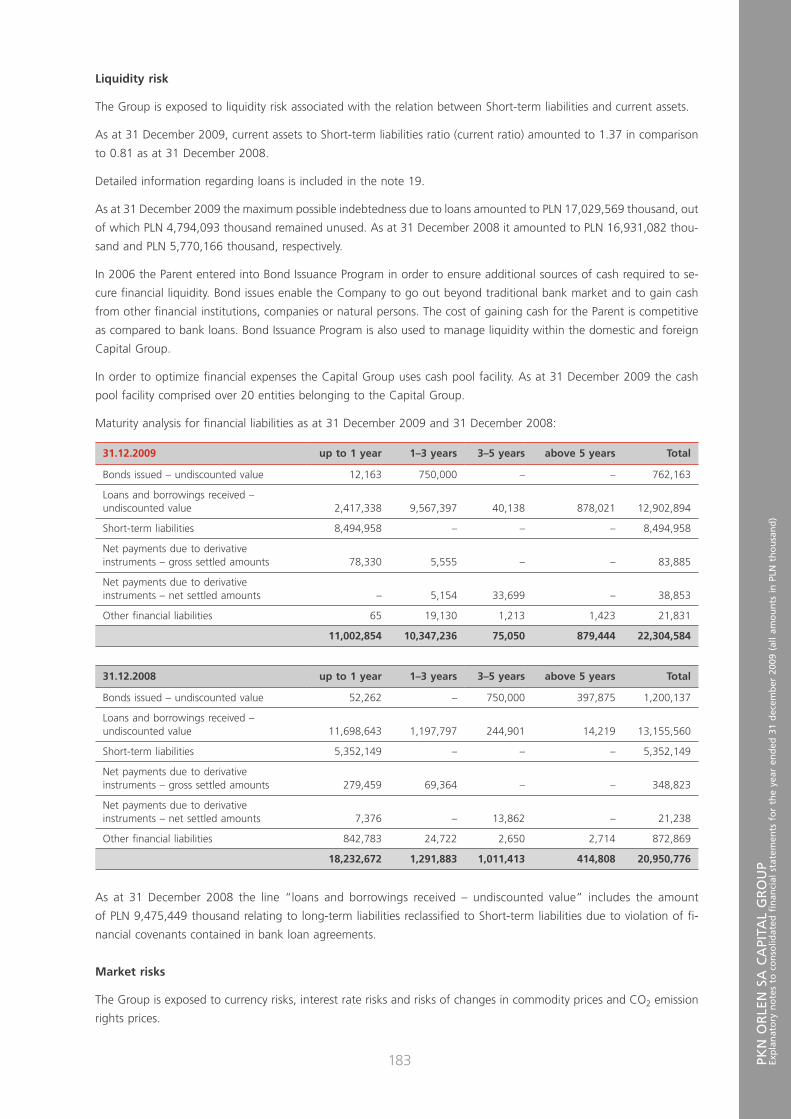
PKN
OR
LEN
SA
CA
PITA
L G
RO
UP
Exp
lan
ato
ry n
ote
s to
co
nso
lidat
ed
nan
cial
sta
tem
ents
fo
r th
e ye
ar e
nd
ed 3
1 d
ecem
ber
200
9 (a
ll am
ou
nts
in
PLN
th
ou
san
d)
183
Liquidity risk
The Group is exposed to liquidity risk associated with the relation between Short-term liabilities and current assets.
As at 31 December 2009, current assets to Short-term liabilities ratio (current ratio) amounted to 1.37 in comparison
to 0.81 as at 31 December 2008.
Detailed information regarding loans is included in the note 19.
As at 31 December 2009 the maximum possible indebtedness due to loans amounted to PLN 17,029,569 thousand, out
of which PLN 4,794,093 thousand remained unused. As at 31 December 2008 it amounted to PLN 16,931,082 thou-
sand and PLN 5,770,166 thousand, respectively.
In 2006 the Parent entered into Bond Issuance Program in order to ensure additional sources of cash required to se-
cure nancial liquidity. Bond issues enable the Company to go out beyond traditional bank market and to gain cash
from other nancial institutions, companies or natural persons. The cost of gaining cash for the Parent is competitive
as compared to bank loans. Bond Issuance Program is also used to manage liquidity within the domestic and foreign
Capital Group.
In order to optimize nancial expenses the Capital Group uses cash pool facility. As at 31 December 2009 the cash
pool facility comprised over 20 entities belonging to the Capital Group.
Maturity analysis for nancial liabilities as at 31 December 2009 and 31 December 2008:
31.12.2009 up to 1 year 1–3 years 3–5 years above 5 years Total
Bonds issued – undiscounted value 12,163 750,000 – – 762,163
Loans and borrowings received – undiscounted value 2,417,338 9,567,397 40,138 878,021 12,902,894
Short-term liabilities 8,494,958 – – – 8,494,958
Net payments due to derivative instruments – gross settled amounts 78,330 5,555 – – 83,885
Net payments due to derivative instruments – net settled amounts – 5,154 33,699 – 38,853
Other nancial liabilities 65 19,130 1,213 1,423 21,831
11,002,854 10,347,236 75,050 879,444 22,304,584
31.12.2008 up to 1 year 1–3 years 3–5 years above 5 years Total
Bonds issued – undiscounted value 52,262 – 750,000 397,875 1,200,137
Loans and borrowings received –undiscounted value 11,698,643 1,197,797 244,901 14,219 13,155,560
Short-term liabilities 5,352,149 – – – 5,352,149
Net payments due to derivative instruments – gross settled amounts 279,459 69,364 – – 348,823
Net payments due to derivative instruments – net settled amounts 7,376 – 13,862 – 21,238
Other nancial liabilities 842,783 24,722 2,650 2,714 872,869
18,232,672 1,291,883 1,011,413 414,808 20,950,776
As at 31 December 2008 the line “loans and borrowings received – undiscounted value” includes the amount
of PLN 9,475,449 thousand relating to long-term liabilities reclassi ed to Short-term liabilities due to violation of -
nancial covenants contained in bank loan agreements.
Market risks
The Group is exposed to currency risks, interest rate risks and risks of changes in commodity prices and CO2 emission
rights prices.
183
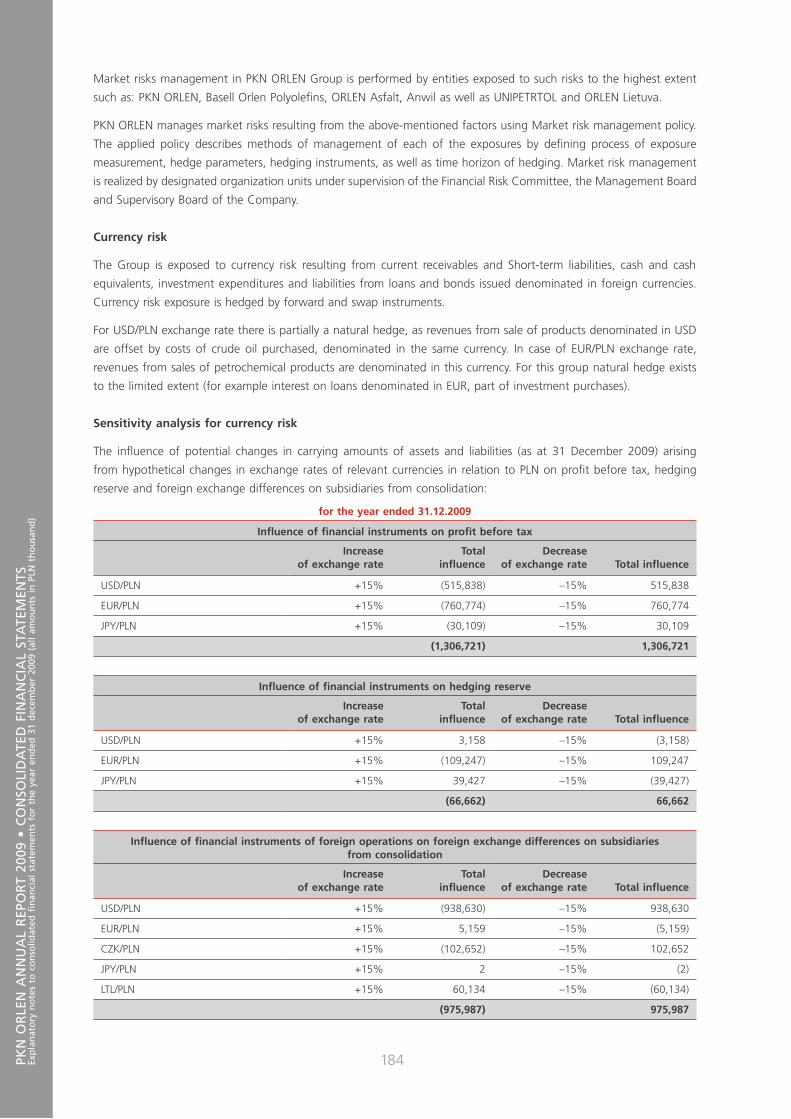
PKN
OR
LEN
AN
NU
AL
REP
OR
T 20
09 •
CO
NSO
LID
ATE
D F
INA
NC
IAL
STA
TEM
ENTS
Exp
lan
ato
ry n
ote
s to
co
nso
lidat
ed
nan
cial
sta
tem
ents
fo
r th
e ye
ar e
nd
ed 3
1 d
ecem
ber
200
9 (a
ll am
ou
nts
in
PLN
th
ou
san
d)
184
Market risks management in PKN ORLEN Group is performed by entities exposed to such risks to the highest extent
such as: PKN ORLEN, Basell Orlen Polyole ns, ORLEN Asfalt, Anwil as well as UNIPETRTOL and ORLEN Lietuva.
PKN ORLEN manages market risks resulting from the above-mentioned factors using Market risk management policy.
The applied policy describes methods of management of each of the exposures by de ning process of exposure
measurement, hedge parameters, hedging instruments, as well as time horizon of hedging. Market risk management
is realized by designated organization units under supervision of the Financial Risk Committee, the Management Board
and Supervisory Board of the Company.
Currency risk
The Group is exposed to currency risk resulting from current receivables and Short-term liabilities, cash and cash
equivalents, investment expenditures and liabilities from loans and bonds issued denominated in foreign currencies.
Currency risk exposure is hedged by forward and swap instruments.
For USD/PLN exchange rate there is partially a natural hedge, as revenues from sale of products denominated in USD
are offset by costs of crude oil purchased, denominated in the same currency. In case of EUR/PLN exchange rate,
revenues from sales of petrochemical products are denominated in this currency. For this group natural hedge exists
to the limited extent (for example interest on loans denominated in EUR, part of investment purchases).
Sensitivity analysis for currency risk
The in uence of potential changes in carrying amounts of assets and liabilities (as at 31 December 2009) arising
from hypothetical changes in exchange rates of relevant currencies in relation to PLN on pro t before tax, hedging
reserve and foreign exchange differences on subsidiaries from consolidation:
for the year ended 31.12.2009
In uence of nancial instruments on pro t before tax
Increase of exchange rate
Totalin uence
Decrease of exchange rate Total in uence
USD/PLN +15% (515,838) –15% 515,838
EUR/PLN +15% (760,774) –15% 760,774
JPY/PLN +15% (30,109) –15% 30,109
(1,306,721) 1,306,721
In uence of nancial instruments on hedging reserve
Increase of exchange rate
Totalin uence
Decrease of exchange rate Total in uence
USD/PLN +15% 3,158 –15% (3,158)
EUR/PLN +15% (109,247) –15% 109,247
JPY/PLN +15% 39,427 –15% (39,427)
(66,662) 66,662
In uence of nancial instruments of foreign operations on foreign exchange differences on subsidiaries from consolidation
Increase of exchange rate
Totalin uence
Decrease of exchange rate Total in uence
USD/PLN +15% (938,630) –15% 938,630
EUR/PLN +15% 5,159 –15% (5,159)
CZK/PLN +15% (102,652) –15% 102,652
JPY/PLN +15% 2 –15% (2)
LTL/PLN +15% 60,134 –15% (60,134)
(975,987) 975,987
184
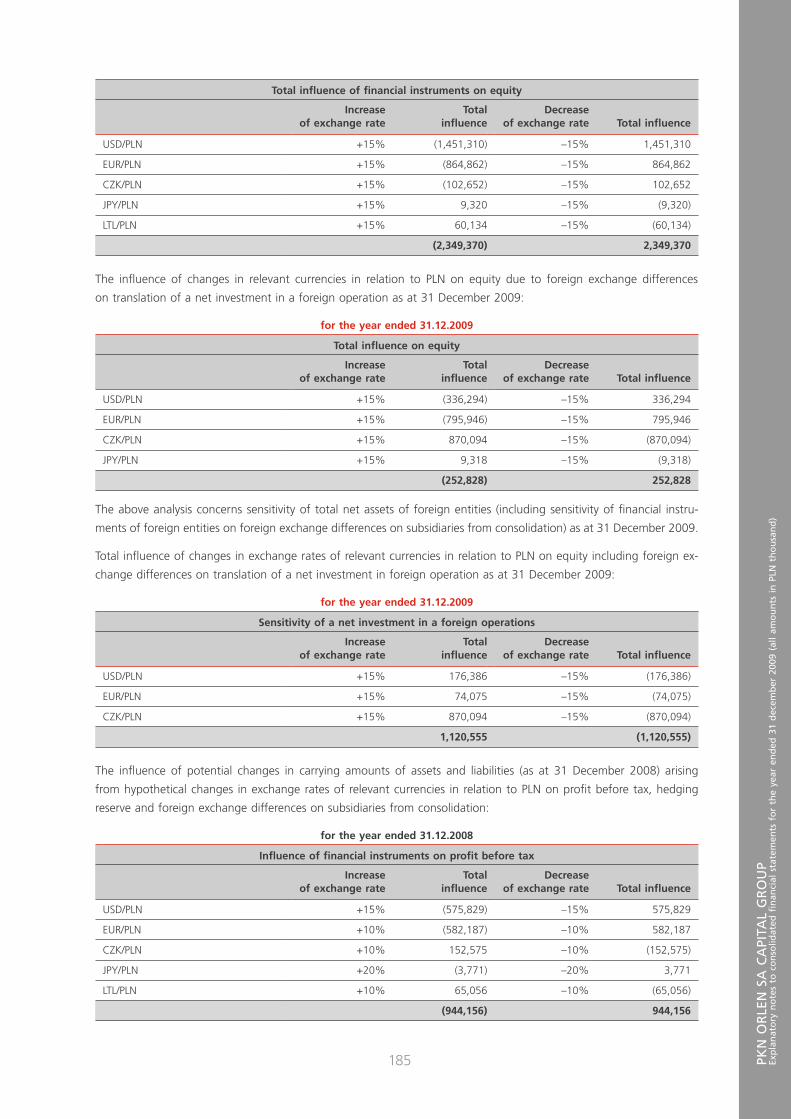
PKN
OR
LEN
SA
CA
PITA
L G
RO
UP
Exp
lan
ato
ry n
ote
s to
co
nso
lidat
ed
nan
cial
sta
tem
ents
fo
r th
e ye
ar e
nd
ed 3
1 d
ecem
ber
200
9 (a
ll am
ou
nts
in
PLN
th
ou
san
d)
185
Total in uence of nancial instruments on equity
Increase of exchange rate
Totalin uence
Decrease of exchange rate Total in uence
USD/PLN +15% (1,451,310) –15% 1,451,310
EUR/PLN +15% (864,862) –15% 864,862
CZK/PLN +15% (102,652) –15% 102,652
JPY/PLN +15% 9,320 –15% (9,320)
LTL/PLN +15% 60,134 –15% (60,134)
(2,349,370) 2,349,370
The in uence of changes in relevant currencies in relation to PLN on equity due to foreign exchange differences
on translation of a net investment in a foreign operation as at 31 December 2009:
for the year ended 31.12.2009
Total in uence on equity
Increase of exchange rate
Totalin uence
Decrease of exchange rate Total in uence
USD/PLN +15% (336,294) –15% 336,294
EUR/PLN +15% (795,946) –15% 795,946
CZK/PLN +15% 870,094 –15% (870,094)
JPY/PLN +15% 9,318 –15% (9,318)
(252,828) 252,828
The above analysis concerns sensitivity of total net assets of foreign entities (including sensitivity of nancial instru-
ments of foreign entities on foreign exchange differences on subsidiaries from consolidation) as at 31 December 2009.
Total in uence of changes in exchange rates of relevant currencies in relation to PLN on equity including foreign ex-
change differences on translation of a net investment in foreign operation as at 31 December 2009:
for the year ended 31.12.2009
Sensitivity of a net investment in a foreign operations
Increase of exchange rate
Totalin uence
Decrease of exchange rate Total in uence
USD/PLN +15% 176,386 –15% (176,386)
EUR/PLN +15% 74,075 –15% (74,075)
CZK/PLN +15% 870,094 –15% (870,094)
1,120,555 (1,120,555)
The in uence of potential changes in carrying amounts of assets and liabilities (as at 31 December 2008) arising
from hypothetical changes in exchange rates of relevant currencies in relation to PLN on pro t before tax, hedging
reserve and foreign exchange differences on subsidiaries from consolidation:
for the year ended 31.12.2008
In uence of nancial instruments on pro t before tax
Increase of exchange rate
Totalin uence
Decrease of exchange rate Total in uence
USD/PLN +15% (575,829) –15% 575,829
EUR/PLN +10% (582,187) –10% 582,187
CZK/PLN +10% 152,575 –10% (152,575)
JPY/PLN +20% (3,771) –20% 3,771
LTL/PLN +10% 65,056 –10% (65,056)
(944,156) 944,156
185

PKN
OR
LEN
AN
NU
AL
REP
OR
T 20
09 •
CO
NSO
LID
ATE
D F
INA
NC
IAL
STA
TEM
ENTS
Exp
lan
ato
ry n
ote
s to
co
nso
lidat
ed
nan
cial
sta
tem
ents
fo
r th
e ye
ar e
nd
ed 3
1 d
ecem
ber
200
9 (a
ll am
ou
nts
in
PLN
th
ou
san
d)
186
In uence of nancial instruments on hedging reserve
Increase of exchange rate
Totalin uence
Decrease of exchange rate Total in uence
USD/PLN +15% (29,669) –15% 29,669
EUR/PLN +10% (114,619) –10% 114,619
JPY/PLN +20% 75,405 –20% (75,405)
(68,883) 68,883
In uence of nancial instruments of foreign operations on foreign exchange differences on subsidiaries from consolidation
Increase of exchange rate
Totalin uence
Decrease of exchange rate Total in uence
USD/PLN +15% 66,337 –15% (66,337)
EUR/PLN +10% 108,527 –10% (108,527)
CZK/PLN +10% 308,781 –10% (308,781)
JPY/PLN +20% 1 –20% (1)
LTL/PLN +10% 4,136 –10% (4,136)
487,782 (487,782)
Total in uence of nancial instruments on equity
Increase of exchange rate
Totalin uence
Decrease of exchange rate Total in uence
USD/PLN +15% (539,161) –15% 539,161
EUR/PLN +10% (588,279) –10% 588,279
CZK/PLN +10% 461,356 –10% (461,356)
JPY/PLN +20% 71,635 –20% (71,635)
LTL/PLN +10% 69,192 –10% (69,192)
(525,257) 525,257
In uence of changes in relevant currencies in relation to PLN on equity due to foreign exchange differences on transla-
tion of a net investment in a foreign operation as at 31 December 2008:
for the year ended 31.12.2008
Sensitivity of a net investment in a foreign operations
Increase of exchange rate
Totalin uence
Decrease of exchange rate Total in uence
USD/PLN +15% 987,322 –15% (987,322)
EUR/PLN +10% 44,703 –10% (44,703)
CZK/PLN +10% 604,430 –10% (604,430)
1,636,455 (1,636,455)
The above analysis concerns sensitivity of total net assets of foreign entities (including sensitivity of nancial instruments
of foreign subsidiaries on foreign exchange differences on subsidiaries from consolidation) as at 31 December 2009.
Total in uence of changes in exchange rates of relevant currencies in relation to PLN on equity including foreign ex-
change differences on translation of a net investment in a foreign operation as at 31 December 2008.
186

PKN
OR
LEN
SA
CA
PITA
L G
RO
UP
Exp
lan
ato
ry n
ote
s to
co
nso
lidat
ed
nan
cial
sta
tem
ents
fo
r th
e ye
ar e
nd
ed 3
1 d
ecem
ber
200
9 (a
ll am
ou
nts
in
PLN
th
ou
san
d)
187
for the year ended 31.12.2008
Total in uence on equity
Increase of exchange rate
Totalin uence
Decrease of exchange rate Total in uence
USD/PLN +15% 381,824 –15% (381,824)
EUR/PLN +10% (652,103) –10% 652,103
CZK/PLN +10% 757,005 –10% (757,005)
JPY/PLN +20% 71,634 –20% (71,634)
LTL/PLN +10% 65,056 –10% (65,056)
623,416 (623,416)
Variations of currency rates described above were calculated based on historical volatility of particular currency rates
and analysts forecasts.
Sensitivity of nancial instruments for currency risk was calculated as a difference between the initial carrying amount
of nancial instruments (excluding derivative instruments) and their potential carrying amount calculated using assumed
increase or decrease in currency rates. In case of derivative instruments, the in uence of currency rate variations on fair
value was examined at constant level of interest rates.
For other currencies the sensitivity of nancial instruments is not material from the Group’s point of view.
Interest rate risk
The Group is exposed to risk of volatility of cash ows due to interest rates resulting from granted loans, owned bank
deposits as well as loan liabilities based on oating interest rates. The Group owns derivative transactions hedging part
of risk of cash ows due to interest rates (interest rate swaps – IRS), for which cash ows hedge accounting is applied.
In 2009 according to updated risk management policy the Group hedged additionally interest rate risk connected with
risk foreign currency loans in EUR and USD.
Sensitivity analysis for interest rate risk
The in uence of nancial instruments on pro t before tax and hedging reserve due to changes in signi cant interest rates:
Interest rate
Assumedvariation
In uenceon nancial result
In uenceon hedging reserve
In uenceon equity
2009 2008 31.12.2009 31.12.2008 31.12.2009 31.12.2008 31.12.2009 31.12.2008
WIBOR +50 +100 (8,448) (16,723) 3,938 10,271 (4,510) (6,452)
LIBOR +50 +25 (23,289) (10,700) 23,810 – 521 (10,700)
EURIBOR +50 +150 (41,986) (94,999) 28,890 (9,473) (13,096) (104,472)
PRIBOR +50 +100 (12,665) 10,870 – – (12,665) 10,870
VILIBOR +100 +100 (95) (237) – – (95) (237)
(86,483) (111,789) 56,638 798 (29,845) (110,991)
WIBOR –50 –100 8,448 16,723 (3,895) (10,589) 4,553 6,134
LIBOR – –25 – 10,700 – – – 10,700
EURIBOR – –150 – 94,999 – 9,990 – 104,989
PRIBOR –50 –100 12,665 (10,870) – – 12,665 (10,870)
VILIBOR –100 –100 95 237 – – 95 237
21,208 111,789 (3,895) (599) 17,313 111,190
Variations of interest rates described above were calculated based on volatility of interest rates as at 31 December 2009
in comparison to 31 December 2008.
187

PKN
OR
LEN
AN
NU
AL
REP
OR
T 20
09 •
CO
NSO
LID
ATE
D F
INA
NC
IAL
STA
TEM
ENTS
Exp
lan
ato
ry n
ote
s to
co
nso
lidat
ed
nan
cial
sta
tem
ents
fo
r th
e ye
ar e
nd
ed 3
1 d
ecem
ber
200
9 (a
ll am
ou
nts
in
PLN
th
ou
san
d)
188
The above interest rates variations were calculated on the basis of interest rates variations in the period and analysts’
forecasts.
The Group does not own nancial instruments with xed interest rates, measured at fair value in the statement of -
nancial position. The Group measures derivative instruments at fair value.
The sensitivity analysis was performed on the basis of instruments held as at 31 December 2009 and 31 December 2008.
The in uence of interest rates changes was presented on annual basis.
The sensitivity of nancial instruments for interest rate risk was calculated as arithmetic product of the balance
of the statement of nancial position items, sensitive to interest rates (excluding derivative instruments) multiplied
by adequate variation of interest rate. In case of derivative instruments, the in uence of interest rate variations on fair
value was examined at constant level of currency rates.
Risk of changes in commodity prices
The Group is exposed to changes in commodity prices due to:
• expenditures concerning purchases of crude oil for processing, which depend on the volume of processing, the level
of inventory as well as the level of crude oil price on the global market and differential;
• revenues from sales of re nery and petrochemical products, which depend on the volume of sales, the level of prices
on the global market.
As at 31 December 2009 and 31 December 2008 there were no nancial instruments hedging the risk of changes
in commodity prices.
Risk of CO2 emission rights prices
On the basis of the binding legal regulations resulting from the Kyoto Protocol to the United Nations Framework
Convention on Climate Change, adopted by the European Union, followed by the decision of the Council of Ministers
PKN ORLEN was granted CO2 emission rights. Detailed information is included in note 8.
Every year the Group perform veri cation of the number of rights and de nes methods of systematic balancing
of identi ed shortages/surpluses either in the way of intercompany transactions or through market term and spot
transactions depending on the situation.
In 2009 the Group sold surpluses of CO2 emission rights. The Group concluded forward purchase transactions for similar
amount of rights.
As at 31 December 2009 and as at 31 December 2008 the Group possessed nancial instruments in the amount
of PLN 14,845 thousand and PLN 23,359 thousand respectively, which valuation depends on changes in prices for CO2.
emission rights.
188

PKN
OR
LEN
SA
CA
PITA
L G
RO
UP
Exp
lan
ato
ry n
ote
s to
co
nso
lidat
ed
nan
cial
sta
tem
ents
fo
r th
e ye
ar e
nd
ed 3
1 d
ecem
ber
200
9 (a
ll am
ou
nts
in
PLN
th
ou
san
d)
189
Net gains/losses due to nancial instruments recognized in nancial revenues and expenses by category
for the year ended31.12.2009
for the year ended31.12.2008
Financial assets and liabilities at fair value through pro t or loss(held for trading) (2,852) (65,708)
Financial assets available for sale(recognized in the statement of comprehensive income) (11,406) 31,317
Financial assets held to maturity – 22,467
Loans (granted) 2,477 18,501
Financial liabilities measured at amortized cost (291,813) (1,339,858)
Current receivables (34,172) 358,957
Short-term liabilities 329,135 (631,892)
Cash and cash equivalents 76,003 56,043
Ineffectiveness recognized in pro t or loss during the period 14,819 (25,395)
Other hedge instruments (10,990) (3,046)
71,201 (1,578,614)
Interest revenues and expenses were calculated using the effective interest method.
Financial expenses due to impairment of nancial assets by class of nancial instruments
for the year ended31.12.2009
for the year ended31.12.2008
Impairment allowances of shares in Companies (870) (8,061)
Impairment allowances of interest on receivables(classi ed as nancial instruments) (8,823) (14,837)
(9,693) (22,898)
The impairment of receivables was disclosed in the note 27.
32. LEASES
a) Capital Group as a lessee
Operating lease
As at 31 December 2009 and 31 December 2008, the Group possessed non-cancellable operating lease agreements
as a lessee. Operating lease agreements (tenancy, rent) regard mainly the lease of tanks, petrol stations, means
of transportation and computer equipment. The lease contracts do not contain any clauses concerning conditional
liabilities from lease fees. In the most cases there is the possibility to prolong the agreement. The lease payments,
resulting mainly from tenancy and rent agreements, recognized as cost amounted to PLN 228,939 thousand in 2009
and PLN 203,531 thousand in 2008.
189
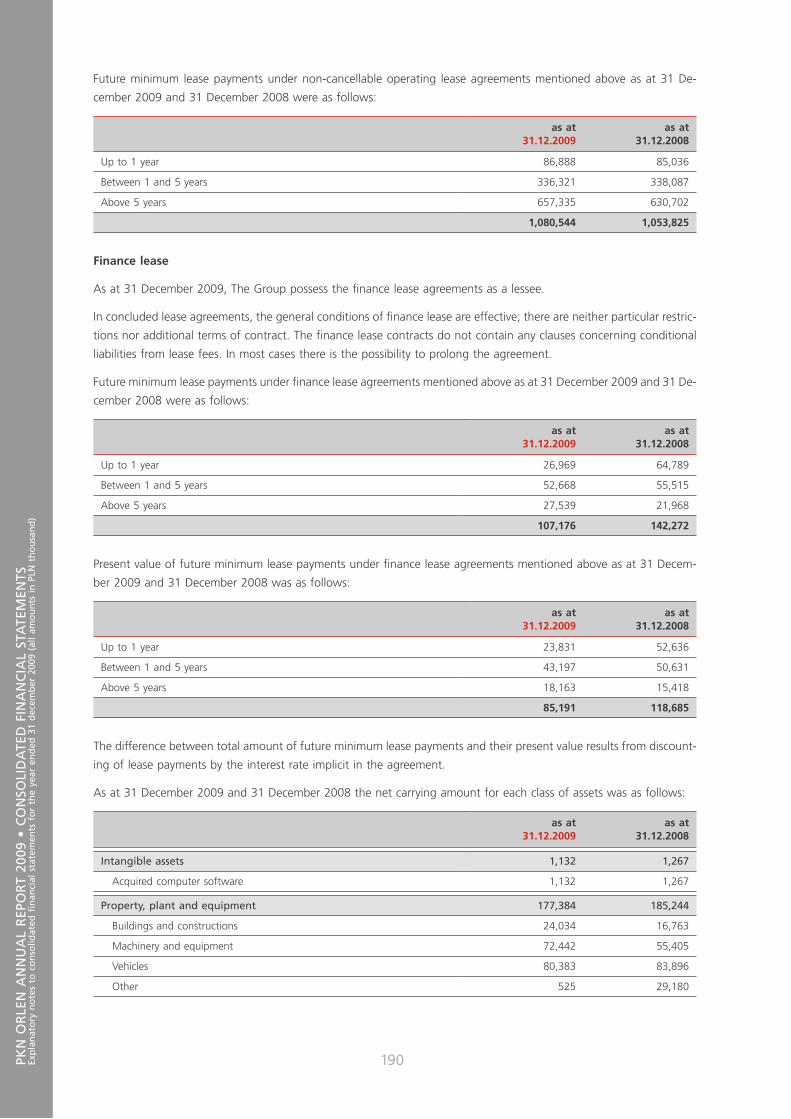
PKN
OR
LEN
AN
NU
AL
REP
OR
T 20
09 •
CO
NSO
LID
ATE
D F
INA
NC
IAL
STA
TEM
ENTS
Exp
lan
ato
ry n
ote
s to
co
nso
lidat
ed
nan
cial
sta
tem
ents
fo
r th
e ye
ar e
nd
ed 3
1 d
ecem
ber
200
9 (a
ll am
ou
nts
in
PLN
th
ou
san
d)
190
Future minimum lease payments under non-cancellable operating lease agreements mentioned above as at 31 De-
cember 2009 and 31 December 2008 were as follows:
as at31.12.2009
as at31.12.2008
Up to 1 year 86,888 85,036
Between 1 and 5 years 336,321 338,087
Above 5 years 657,335 630,702
1,080,544 1,053,825
Finance lease
As at 31 December 2009, The Group possess the nance lease agreements as a lessee.
In concluded lease agreements, the general conditions of nance lease are effective; there are neither particular restric-
tions nor additional terms of contract. The nance lease contracts do not contain any clauses concerning conditional
liabilities from lease fees. In most cases there is the possibility to prolong the agreement.
Future minimum lease payments under nance lease agreements mentioned above as at 31 December 2009 and 31 De-
cember 2008 were as follows:
as at31.12.2009
as at31.12.2008
Up to 1 year 26,969 64,789
Between 1 and 5 years 52,668 55,515
Above 5 years 27,539 21,968
107,176 142,272
Present value of future minimum lease payments under nance lease agreements mentioned above as at 31 Decem-
ber 2009 and 31 December 2008 was as follows:
as at31.12.2009
as at31.12.2008
Up to 1 year 23,831 52,636
Between 1 and 5 years 43,197 50,631
Above 5 years 18,163 15,418
85,191 118,685
The difference between total amount of future minimum lease payments and their present value results from discount-
ing of lease payments by the interest rate implicit in the agreement.
As at 31 December 2009 and 31 December 2008 the net carrying amount for each class of assets was as follows:
as at31.12.2009
as at31.12.2008
Intangible assets 1,132 1,267
Acquired computer software 1,132 1,267
Property, plant and equipment 177,384 185,244
Buildings and constructions 24,034 16,763
Machinery and equipment 72,442 55,405
Vehicles 80,383 83,896
Other 525 29,180
190
PKN
OR
LEN
SA
CA
PITA
L G
RO
UP
Exp
lan
ato
ry n
ote
s to
co
nso
lidat
ed
nan
cial
sta
tem
ents
fo
r th
e ye
ar e
nd
ed 3
1 d
ecem
ber
200
9 (a
ll am
ou
nts
in
PLN
th
ou
san
d)
191
b) The Group as a lessor
Operating lease
As at 31 December 2009 and 31 December 2008 the Group did not posses non-cancellable operating lease agreements
as a lessor. Operating lease agreements possessed by the Group regard the lease of machinery, equipment, buildings
and land. Most of the agreements were concluded for an inde nite period.
Finance lease
As at 31 December 2009 the Group as a lessor did not possess the nance lease agreements. As at 31 December 2008
the Group as a lessor possessed the nance lease agreements regarding the lease of distributors. Due gross lease
investments for the tease agreements mentioned above amounted to PLN 17 thousand.
As at 31 December 2009 the Group did not posses present due minimum lease payments under nance lease agree-
ments mentioned above. As at 31 December 2008 present value of minimum lease payments under one-year nance
lease agreements amounted to PLN 17 thousand.
Disclosers resulting from IFRS 7 concerning nancial lease are included in note 31 and are presented together with -
nancials instruments.
33. INVESTMENT EXPENDITURES INCURRED AND PLANNED AND COMMITMENTS RESULTING FROM SIGNED INVESTMENT CONTRACTS
Investment expenditures incurred in 2009 and 2008 accounted for PLN 3,776,325 thousand and PLN 4,018,294 thou-
sand adequately, including PLN 254,375 thousand and PLN 515,062 thousand of environmental protection related
investments. As at 31 December 2009 and 31 December 2008 future liabilities resulting from contracts signed until
this date amounted to PLN 969,908 thousand and PLN 1,969,908 thousand adequately.
34. RELATED PARTY TRANSACTIONS
Information on material related party transactions
a) Information on material transactions concluded by the Group Companies with related parties on other
than market terms
In 2009 there were no material related transactions in the Group concluded on other than market terms.
b) Transactions with members of the Management Board, Supervisory Board, their spouses, siblings, de-
scendants and ascendants and their other relatives
In 2009 the Group companies did not grant to managing and supervising persons and their relatives any advances, loans,
guarantees and commitments, or other agreements obliging, to render services to the Company and related parties.
In 2009 there were no signi cant transactions concluded with members of the Management Board, Supervisory Board,
their spouses, siblings, descendants, ascendants or their other relatives.
c) Transactions with related parties concluded through the key management personnel of the Capital Group
companies
In 2009 members of the key executive personnel of the Parent Company and the Capital Group companies basing
on the submitted statements on transactions concluded with related parties disclosed the following transactions:
191

PKN
OR
LEN
AN
NU
AL
REP
OR
T 20
09 •
CO
NSO
LID
ATE
D F
INA
NC
IAL
STA
TEM
ENTS
Exp
lan
ato
ry n
ote
s to
co
nso
lidat
ed
nan
cial
sta
tem
ents
fo
r th
e ye
ar e
nd
ed 3
1 d
ecem
ber
200
9 (a
ll am
ou
nts
in
PLN
th
ou
san
d)
192
Type of relation through key executive personnel of the Company and the Group companies Sales Purchase Receivables Liabilities
Supervising persons 442,266 244,639 18,072 2,414
Managing persons 68 16 – –
Other key executive personnel 16 – – –
442,350 244,655 18,072 2,414
d) Transactions of the Parent Company with related parties in the period ended 31 December 2009 and
the balance of settlements as at 31 December 2009
Subsidiaries
Jointlycontrolled
entities Associates Adjustments
Totalrelatedparties
Sales 22,263,291 1,835,038 18,155 (23,180,810) 935,674
Purchases 3,101,129 15,636 121,564 (3,108,947) 129,382
Interest income 6,622 1,344 8 (7,294) 680
Dividends received 199,106 – 418,222 (617,328) –
Interest expense 9,331 – 3 (9,331) 3
Current receivables (net) 2,323,570 426,025 2,665 (2,536,583) 215,677
Receivables impairment allowances 477 3 18 (479) 19
Short-term liabilities 630,545 1,837 10,738 (631,464) 11,656
Non-current receivables 14,721 41,082 – (35,262) 20,541
Long-term liabilities 24,617 – – (24,617) –
The above transactions with related parties include sale and purchase of re nery and petrochemical products, crude
oil and purchases of repair, transportation and other services.
Settlements with related parties include trade and nancial receivables and liabilities.
The Group granted guarantees on the behalf of related parties in the amount of PLN 777,923 thousand.
192
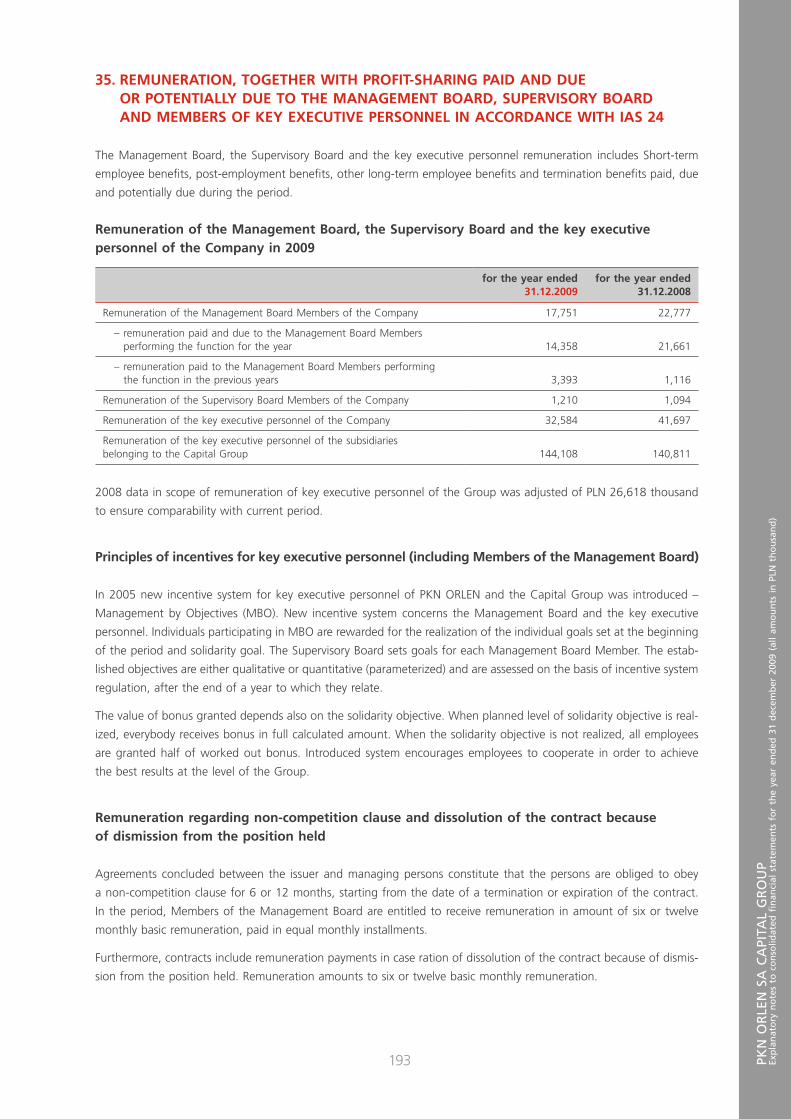
PKN
OR
LEN
SA
CA
PITA
L G
RO
UP
Exp
lan
ato
ry n
ote
s to
co
nso
lidat
ed
nan
cial
sta
tem
ents
fo
r th
e ye
ar e
nd
ed 3
1 d
ecem
ber
200
9 (a
ll am
ou
nts
in
PLN
th
ou
san
d)
193
35. REMUNERATION, TOGETHER WITH PROFIT-SHARING PAID AND DUE OR POTENTIALLY DUE TO THE MANAGEMENT BOARD, SUPERVISORY BOARD AND MEMBERS OF KEY EXECUTIVE PERSONNEL IN ACCORDANCE WITH IAS 24
The Management Board, the Supervisory Board and the key executive personnel remuneration includes Short-term
employee bene ts, post-employment bene ts, other long-term employee bene ts and termination bene ts paid, due
and potentially due during the period.
Remuneration of the Management Board, the Supervisory Board and the key executive personnel of the Company in 2009
for the year ended31.12.2009
for the year ended31.12.2008
Remuneration of the Management Board Members of the Company 17,751 22,777
– remuneration paid and due to the Management Board Members performing the function for the year 14,358 21,661
– remuneration paid to the Management Board Members performing the function in the previous years 3,393 1,116
Remuneration of the Supervisory Board Members of the Company 1,210 1,094
Remuneration of the key executive personnel of the Company 32,584 41,697
Remuneration of the key executive personnel of the subsidiariesbelonging to the Capital Group 144,108 140,811
2008 data in scope of remuneration of key executive personnel of the Group was adjusted of PLN 26,618 thousand
to ensure comparability with current period.
Principles of incentives for key executive personnel (including Members of the Management Board)
In 2005 new incentive system for key executive personnel of PKN ORLEN and the Capital Group was introduced –
Management by Objectives (MBO). New incentive system concerns the Management Board and the key executive
personnel. Individuals participating in MBO are rewarded for the realization of the individual goals set at the beginning
of the period and solidarity goal. The Supervisory Board sets goals for each Management Board Member. The estab-
lished objectives are either qualitative or quantitative (parameterized) and are assessed on the basis of incentive system
regulation, after the end of a year to which they relate.
The value of bonus granted depends also on the solidarity objective. When planned level of solidarity objective is real-
ized, everybody receives bonus in full calculated amount. When the solidarity objective is not realized, all employees
are granted half of worked out bonus. Introduced system encourages employees to cooperate in order to achieve
the best results at the level of the Group.
Remuneration regarding non-competition clause and dissolution of the contract because of dismission from the position held
Agreements concluded between the issuer and managing persons constitute that the persons are obliged to obey
a non-competition clause for 6 or 12 months, starting from the date of a termination or expiration of the contract.
In the period, Members of the Management Board are entitled to receive remuneration in amount of six or twelve
monthly basic remuneration, paid in equal monthly installments.
Furthermore, contracts include remuneration payments in case ration of dissolution of the contract because of dismis-
sion from the position held. Remuneration amounts to six or twelve basic monthly remuneration.
193

PKN
OR
LEN
AN
NU
AL
REP
OR
T 20
09 •
CO
NSO
LID
ATE
D F
INA
NC
IAL
STA
TEM
ENTS
Exp
lan
ato
ry n
ote
s to
co
nso
lidat
ed
nan
cial
sta
tem
ents
fo
r th
e ye
ar e
nd
ed 3
1 d
ecem
ber
200
9 (a
ll am
ou
nts
in
PLN
th
ou
san
d)
194
36. REMUNERATION ARISING FROM THE AGREEMENT WITH THE ENTITY AUTHORIZED TO CONDUCT AUDIT OF THE FINANCIAL STATEMENTS, DUE OR PAID FOR THE AUDIT AND REVIEW OF THE FINANCIAL STATEMENTS
In the period covered by these nancial statements the Parent’s auditor is KPMG Audyt Sp. z o.o., according to the agree-
ment concluded on 30 May 2005 for the period of 2005–2009 KPMG Audyt Sp. z o.o. executes the reviews of interim
and audits of unconsolidated and consolidated nancial statements starting from the second quarter of 2005.
for the year ended31.12.2009
for the year ended31.12.2008
Fees payable for the audit by KPMG Audyt Sp. z.o.o.*
in respect of the Parent Company, incl: 1,340 1,460
– fees payable for the audit of the annual nancial statements 615 730
– fees payable for other attestation services, incl. the reviews of the nancialstatements 725 730
Fees payable for related services provided by KPMG Audyt Sp. z o.o.** in respect of Parent Company, incl.: 503 770
Fees payable to the KPMG companies for the audit in respect of subsidiaries, incl: 5,189 6,801
– fees payable for the audit of the annual nancial statements 2,752 3,213
– fees payable for other attestation services, incl. the reviews of the nancial statements 2,437 3,588
Fees payable to KPMG companies for related services in respect of subsidiaries, incl: 715 625
– fees payable for tax advisory services 715 128
7,747 9,656
* Fees payable for the audit include gross amounts payable to the entity authorized to audit nancial statements for audit of unconsolidated
and consolidated nancial statements of the Parent as well as reviews of interim quarterly and half-yearly unconsolidated and consolidated
nancial statements.** Fees for remuneration for the related services comprise other gross amounts payable to the entity authorized to audit nancial statements.
They include services connected with audit and review of the unconsolidated and consolidated nancial statements, other than those
covered by the line ”Fees payable for the audit “.
In 2005 a procedure on soliciting additional services with the auditor and entities related with auditor was introduced
in the Parent. The Audit Committee of the Supervisory Board makes decision on awarding contracts to the auditor
for additional services.
In the foregoing consolidated nancial statements presentation of remuneration amounts resulted from the contract
with the entity authorized to conduct audit and review of consolidated nancial statements, was changed from gross
amounts to net amounts.
194
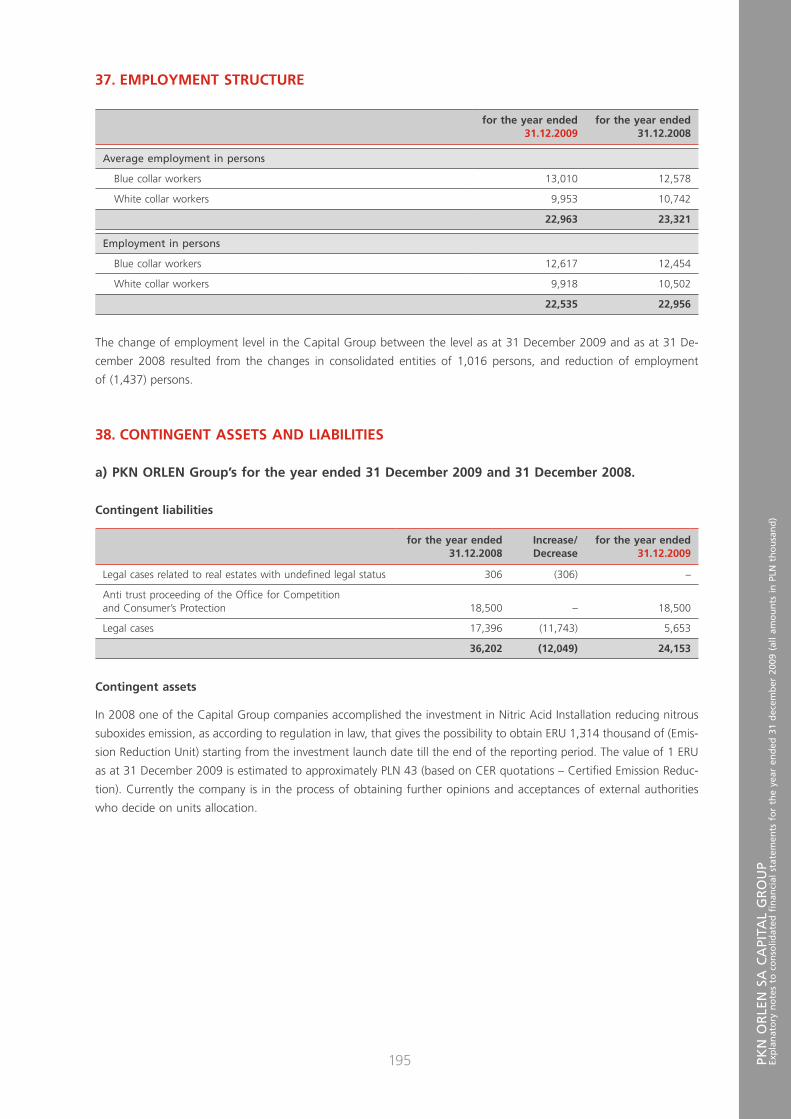
PKN
OR
LEN
SA
CA
PITA
L G
RO
UP
Exp
lan
ato
ry n
ote
s to
co
nso
lidat
ed
nan
cial
sta
tem
ents
fo
r th
e ye
ar e
nd
ed 3
1 d
ecem
ber
200
9 (a
ll am
ou
nts
in
PLN
th
ou
san
d)
195
37. EMPLOYMENT STRUCTURE
for the year ended31.12.2009
for the year ended31.12.2008
Average employment in persons
Blue collar workers 13,010 12,578
White collar workers 9,953 10,742
22,963 23,321
Employment in persons
Blue collar workers 12,617 12,454
White collar workers 9,918 10,502
22,535 22,956
The change of employment level in the Capital Group between the level as at 31 December 2009 and as at 31 De-
cember 2008 resulted from the changes in consolidated entities of 1,016 persons, and reduction of employment
of (1,437) persons.
38. CONTINGENT ASSETS AND LIABILITIES
a) PKN ORLEN Group’s for the year ended 31 December 2009 and 31 December 2008.
Contingent liabilities
for the year ended31.12.2008
Increase/Decrease
for the year ended31.12.2009
Legal cases related to real estates with unde ned legal status 306 (306) –
Anti trust proceeding of the Of ce for Competition and Consumer’s Protection 18,500 – 18,500
Legal cases 17,396 (11,743) 5,653
36,202 (12,049) 24,153
Contingent assets
In 2008 one of the Capital Group companies accomplished the investment in Nitric Acid Installation reducing nitrous
suboxides emission, as according to regulation in law, that gives the possibility to obtain ERU 1,314 thousand of (Emis-
sion Reduction Unit) starting from the investment launch date till the end of the reporting period. The value of 1 ERU
as at 31 December 2009 is estimated to approximately PLN 43 (based on CER quotations – Certi ed Emission Reduc-
tion). Currently the company is in the process of obtaining further opinions and acceptances of external authorities
who decide on units allocation.
195
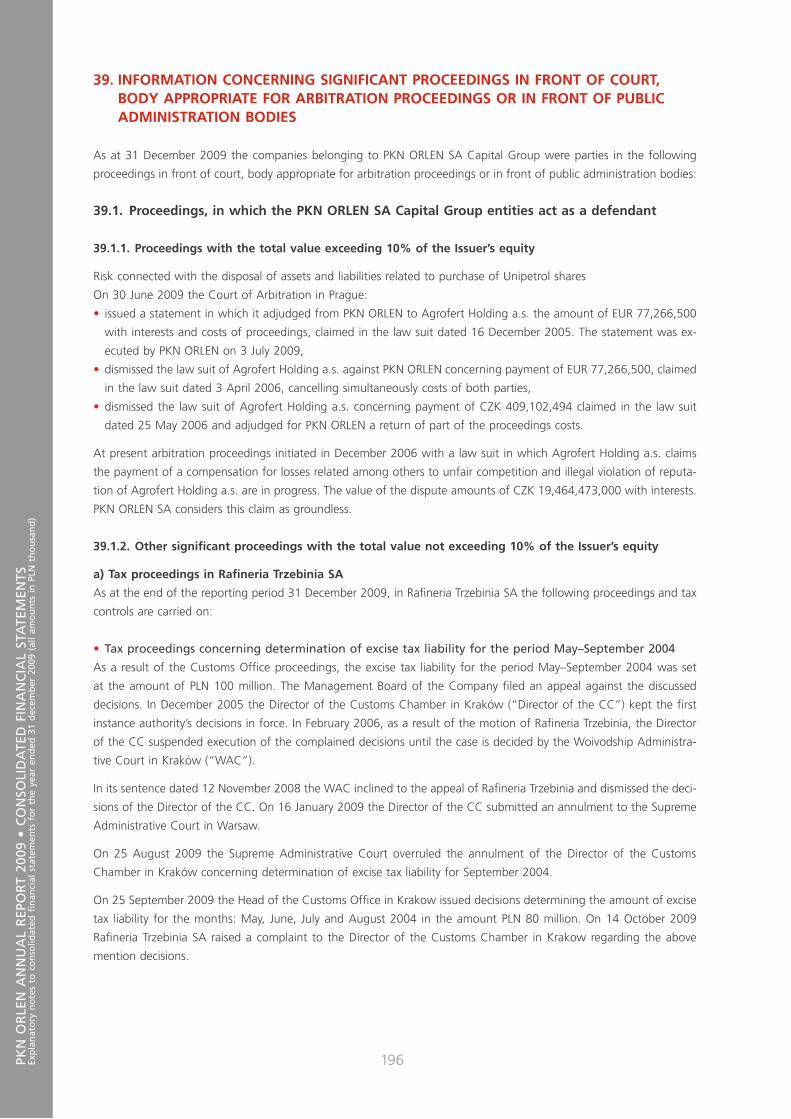
PKN
OR
LEN
AN
NU
AL
REP
OR
T 20
09 •
CO
NSO
LID
ATE
D F
INA
NC
IAL
STA
TEM
ENTS
Exp
lan
ato
ry n
ote
s to
co
nso
lidat
ed
nan
cial
sta
tem
ents
fo
r th
e ye
ar e
nd
ed 3
1 d
ecem
ber
200
9 (a
ll am
ou
nts
in
PLN
th
ou
san
d)
196
39. INFORMATION CONCERNING SIGNIFICANT PROCEEDINGS IN FRONT OF COURT, BODY APPROPRIATE FOR ARBITRATION PROCEEDINGS OR IN FRONT OF PUBLIC ADMINISTRATION BODIES
As at 31 December 2009 the companies belonging to PKN ORLEN SA Capital Group were parties in the following
proceedings in front of court, body appropriate for arbitration proceedings or in front of public administration bodies:
39.1. Proceedings, in which the PKN ORLEN SA Capital Group entities act as a defendant
39.1.1. Proceedings with the total value exceeding 10% of the Issuer’s equity
Risk connected with the disposal of assets and liabilities related to purchase of Unipetrol shares
On 30 June 2009 the Court of Arbitration in Prague:
• issued a statement in which it adjudged from PKN ORLEN to Agrofert Holding a.s. the amount of EUR 77,266,500
with interests and costs of proceedings, claimed in the law suit dated 16 December 2005. The statement was ex-
ecuted by PKN ORLEN on 3 July 2009,
• dismissed the law suit of Agrofert Holding a.s. against PKN ORLEN concerning payment of EUR 77,266,500, claimed
in the law suit dated 3 April 2006, cancelling simultaneously costs of both parties,
• dismissed the law suit of Agrofert Holding a.s. concerning payment of CZK 409,102,494 claimed in the law suit
dated 25 May 2006 and adjudged for PKN ORLEN a return of part of the proceedings costs.
At present arbitration proceedings initiated in December 2006 with a law suit in which Agrofert Holding a.s. claims
the payment of a compensation for losses related among others to unfair competition and illegal violation of reputa-
tion of Agrofert Holding a.s. are in progress. The value of the dispute amounts of CZK 19,464,473,000 with interests.
PKN ORLEN SA considers this claim as groundless.
39.1.2. Other signi cant proceedings with the total value not exceeding 10% of the Issuer’s equity
a) Tax proceedings in Ra neria Trzebinia SA
As at the end of the reporting period 31 December 2009, in Ra neria Trzebinia SA the following proceedings and tax
controls are carried on:
• Tax proceedings concerning determination of excise tax liability for the period May–September 2004
As a result of the Customs Of ce proceedings, the excise tax liability for the period May–September 2004 was set
at the amount of PLN 100 million. The Management Board of the Company led an appeal against the discussed
decisions. In December 2005 the Director of the Customs Chamber in Kraków (“Director of the CC”) kept the rst
instance authority’s decisions in force. In February 2006, as a result of the motion of Ra neria Trzebinia, the Director
of the CC suspended execution of the complained decisions until the case is decided by the Woivodship Administra-
tive Court in Kraków (“WAC”).
In its sentence dated 12 November 2008 the WAC inclined to the appeal of Ra neria Trzebinia and dismissed the deci-
sions of the Director of the CC. On 16 January 2009 the Director of the CC submitted an annulment to the Supreme
Administrative Court in Warsaw.
On 25 August 2009 the Supreme Administrative Court overruled the annulment of the Director of the Customs
Chamber in Kraków concerning determination of excise tax liability for September 2004.
On 25 September 2009 the Head of the Customs Of ce in Krakow issued decisions determining the amount of excise
tax liability for the months: May, June, July and August 2004 in the amount PLN 80 million. On 14 October 2009
Ra neria Trzebinia SA raised a complaint to the Director of the Customs Chamber in Krakow regarding the above
mention decisions.
196
PKN
OR
LEN
SA
CA
PITA
L G
RO
UP
Exp
lan
ato
ry n
ote
s to
co
nso
lidat
ed
nan
cial
sta
tem
ents
fo
r th
e ye
ar e
nd
ed 3
1 d
ecem
ber
200
9 (a
ll am
ou
nts
in
PLN
th
ou
san
d)
197
On 22 January 2010 the Director of the Customs Chamber in Krakow issued decisions for the months May, June, July
and August 2004 dismissing entirely the rst instance authority’s decisions and decided to revoke it to reexamination
by the rst instance authority.
• Control proceedings in respect of reliability of calculation and settlement of excise tax and value added
tax for 2002, 2003 and the period January–April 2004
In January 2005, the Director of the Tax Control Of ce in Kraków (“TCO”) instituted control proceedings against Ra n-
eria Trzebinia in respect of reliability of the stated tax bases and accuracy of the calculation and settlement of excise
tax and value added tax for 2002 and 2003. Additionally, in May 2006, tax control proceedings relating to the period
January–April 2004 were instituted.
On 5 December 2007 the Director of the Tax Control Of ce in Kraków issued a result of tax control proceedings
in respect of excise tax for 2002, acknowledging settlements made by Ra neria Trzebinia as correct.
In July 2008 Ra neria Trzebinia received a protocol prepared by the TCO concerning audit of the Company’s accounting
books for the tax year 2003 determining potential additional excise tax liability in the amount of PLN 73,408 thousand
and protocol from audit of the accounting books for the period January–April 2004 determining potential additional
excise tax liability in the amount of PLN 126,150 thousand. The company raised reservations and additional explana-
tions to these protocols.
On 27 November 2008 a result of the scal control proceedings was issued in respect of reliability of declaration of tax
bases and accuracy of the calculation and settlement of excise tax and value added tax for 2003. On 5 December 2008
the adequate result was issued for the period January–April 2004.
In the issued results it was stated, that tax books are unreliable in the part concerning deductible excise tax of PLN
1,585 thousand included in the excise tax return August 2003.
Ra neria Trzebinia SA appealed against the decision and settled the amount of contentious liability together with
interest. On 30 January 2009 the Director of the Tax Chamber in Kraków repealed the decision sued by Ra neria
Trzebinia SA and decided to revoke it to reexamination by the rst instance authority.
On 9 March 2009 Ra neria Trzebinia SA raised a complaint to the Woivodship Administrative Court in Krakow against
the above mentioned decision of the Director of the Customs Chamber in Kraków in respect of faulty formulation
of legal justi cation.
• Tax proceedings in respect of determination of value added tax amount for the period January–August 2005
In October 2006 the Head of the Tax Of ce for Ma³opolska (“TOM”) instituted tax control proceedings in respect
of determination of value added tax liability for the period January, February and April–August 2005. Additionally,
in February 2007 the Head of the TOM in Kraków instituted tax control proceedings relating to March 2005.
On 12 January 2009 the Head of the Tax Of ce for Ma³opolska in Kraków issued a decision on cancellation of tax
proceedings regarding value added tax liability for the above mentioned period.
The amounts included in this note relate to the principal tax liabilities. As at the date of preparation of these consolidated
nancial statements, the nal outcome of the above control proceedings as well as potential impact of the proceedings
extended to other periods are not known yet.
The Management Board, based on opinions of recognized tax advisors, believes that there is a high probability that
the outcome of the proceedings mentioned above will be favorable for Ra neria Trzebinia SA. As a result, no provision
for potential liabilities has been created in these consolidated nancial statements for 2008 and 2009.
As at the date of the preparation of these consolidated nancial statements, the legal status has not changed.
b) The proceedings of the Energy Regulatory Of ce (“ERO”) in Ra neria Trzebinia SA
In March 2006 the Chairman of the Energy Regulatory Of ce instituted proceedings in respect of imposing a ne
in connection with violating of concession terms regarding production of liquid fuels. The essence of the proceedings
197
PKN
OR
LEN
AN
NU
AL
REP
OR
T 20
09 •
CO
NSO
LID
ATE
D F
INA
NC
IAL
STA
TEM
ENTS
Exp
lan
ato
ry n
ote
s to
co
nso
lidat
ed
nan
cial
sta
tem
ents
fo
r th
e ye
ar e
nd
ed 3
1 d
ecem
ber
200
9 (a
ll am
ou
nts
in
PLN
th
ou
san
d)
198
regards potential direct application of the provisions of the European Union directives while on the one hand effective
1 May 2004 Poland became a member of the European Union whereas on the other hand no regulations of the Min-
ister of Economy in respect of quality requirements for biofuels were available.
In September 2006 the Chairman of the ERO imposed a ne of PLN 1 million to Ra neria Trzebinia. The decision
of the Chairman of the ERO was repealed in April 2007 by the sentence of the Court of Competition and Consumers
Protection in Warsaw (“CCCP”). In November 2007 the Court of Appeals in Warsaw dismissed the appeal of the Chair-
man of the ERO and sentenced the reimbursement of court proceedings costs in favor of Ra neria Trzebinia. The sen-
tence is legally binding.
In March 2008 the Representative of the Chairman of the ERO submitted an annulment, which on 4 September 2008
was accepted for recognition by the Supreme Court. In its sentence dated 5 November 2008 the Supreme Court
repealed the sentence of the Court of Appeals in Warsaw and revoked it to reexamination by this Court. In the as-
sessment of the Supreme Court it is necessary to carry out evidence proceedings in respect of quality norms speci c
for biofuels produced in the contentious period. At the same time the Supreme Court stated that concession possessed
by Ra neria Trzebinia SA entitled to production and trade in biofuels. As at 25 March 2009 the Court of Appeals,
following the decision of the Supreme Court concerning necessity of evidence proceedings, repealed the sentence
of CCCP District Court and revoked the case to its reexamination.
As at the date of the preparation of these consolidated nancial statements, the legal status has not changed.
c) Power transfer fee in settlements with ENERGA-OPERATOR SA (legal successor of Zak³ad Energetyczny
P³ock SA)
As at the date of preparation of these consolidated nancial statements PKN ORLEN participates in two court proceedings
concerning the settlement of system fee with ENERGA-OPERATOR SA. The subject of the court proceedings is regulated
by the Regulation of the Minister of Economy dated 14 December 2000 relating to detailed methods of determina-
tion and computation of tariffs and electricity settlement regulations. According to the paragraph 36 of the above
regulation, the method of settlement of system fee, constituting an element of a power transfer fee, was changed.
According to the paragraph 37 of the above regulation, a different method of system fee calculation was introduced.
• Court proceedings in which PKN ORLEN acts as a defendant
The subject of the court proceedings concerns settlement of the contentious system fee for the period from 5 July
2001 to 30 June 2002. The obligation to settle power transfer fee results from the electricity sale agreement between
ENERGA-OPERATOR SA and PKN ORLEN which was signed without determining contentious issues concerning system
fee. The case was regarded as a civil case so contentious system fee should be judged by an appropriate Court.
In 2003 ENERGA-OPERATOR SA called on PKN ORLEN to compromise agreement and then led a lawsuit against PKN
ORLEN. In 2004, the Court issued a decision obliging PKN ORLEN to pay a liability connected with the so-called system
fee to ENERGA-OPERATOR SA in the amount of PLN 46,232 thousand. In its objection to the precept, PKN ORLEN
led for entire dismissal of the suit.
On 25 June 2008 the District Court pronounced its verdict and dismissed the suit of ENERGA-OPERATOR SA entirely
as well as sentenced the reimbursement of Court proceeding costs of PLN 31 thousand in favor of PKN ORLEN. In Sep-
tember 2008 ENERGA-OPERATOR SA appealed against the above sentence.
On 10 September 2009 after analysis of ENERGA-OPERATOR SA appeal, the Court of Appeals in Warsaw announced
a change in the sentence of the District Court in Warsaw dated 25 June 2008. Payment of PLN 46,232 thousand
increased by interest and refund of proceedings’ costs was adjudged to the bene t of ENERGA-OPERATOR SA.
On 30 September 2009 PKN ORLEN made the payment. The Company also issued a legal request for justi cation,
since an annulment to the Supreme Court against a sentence is possible within the 2-month period since delivery
of a sentence with justi cation.
The Supreme Court sentence with justi cation was delivered to PKN ORLEN’s attorney on 4 December 2009. On 4 Feb-
ruary 2010 the Company submitted an annulment.
198
PKN
OR
LEN
SA
CA
PITA
L G
RO
UP
Exp
lan
ato
ry n
ote
s to
co
nso
lidat
ed
nan
cial
sta
tem
ents
fo
r th
e ye
ar e
nd
ed 3
1 d
ecem
ber
200
9 (a
ll am
ou
nts
in
PLN
th
ou
san
d)
199
• Court proceedings in which PKN ORLEN acts as an outside intervener
In 2004 the District Court in Warsaw summoned PKN ORLEN as a co-defendant in a court case PSE-Operator SA (legal
successor of PGE Polska Grupa Energetyczna SA, former Polskie Sieci Elektroenergetyczne) against ENERGA- -OPERA-
TOR SA.
In March 2008 the District Court in Warsaw pronounced its verdict according to which ENERGA-OPERATOR SA is to pay
PSE the amount of PLN 62,514 thousand with interest and the amount of PLN 143 thousand as a refund of proceed-
ings costs. ENERGA-OPERATOR SA appealed against the above verdict. Based on the legal opinion of an independent
expert PKN ORLEN did not appeal. In its sentence dated 19 March 2009, the Court of Appeals declined the appeal
of ENERGA-OPERATOR SA against the verdict of the rst instance Court that sentenced the speci ed amount. The ver-
dict in this case is already legally binding. The defendant submitted an annulment, which on 5 February 2010 was
accepted for recognition by the Supreme Court.
In its sentence dated 26 March 2010 the Supreme Court repealed the sentence and revoked it to reexamination
by the Court of Appeals in Warsaw.
Eventual court ruling will not result in liabilities directly on the side of PKN ORLEN, as PKN ORLEN acts only as an out-
side intervener in the case.
d) Anti-trust proceedings
As at the date of preparation of these consolidated nancial statements, the Group is a party in the following anti-trust
proceedings:
• Proceedings in connection with an allegation that PKN ORLEN concluded an agreement with LOTOS SA Group, which
limited competition on the domestic market of trading in universal petrol U95 instituted in March 2005. In Decem-
ber 2007, the Chairman of OCCP penalized PKN ORLEN and LOTOS Group for the participation in the above-de-
scribed agreement. The ne imposed on PKN ORLEN amounted to PLN 4,500 thousand. PKN ORLEN appealed
to the Court of Competition and Consumer Protection against that decision. The date of a court seating was been
set on 27 April 2010.
• Proceedings in connection with an allegation that in the years 2000–2004 PKN ORLEN was using practice limiting
competition on the domestic market of trading in glycol by setting prices for “Petrygo” liquid to radiators, which
were inadequate compared to increase in price of glycol, instituted in March 2005. In December 2006 the Chairman
of OCCP imposed a ne on PKN ORLEN in the amount of PLN 14,000 thousand. PKN ORLEN appealed against this
decision. According to independent legal opinions, there is low probability that the Company is charged with a ne.
However due to the status of proceedings these consolidated nancial statements include the respective contingent
liability. The proceedings in front of the Court of Competition and Consumer Protection in Warsaw are in progress.
• Proceedings instituted in July 2008 in connection with an allegation that PKN ORLEN, Petrol Station Kogut Sp.j.
and MAGPOL B. Ku³akowski i Wspólnicy Sp.j. were using practice limiting competition on the domestic market
of trading in engine liquid fuels. PKN ORLEN responded to allegations raised by the Chairman of the OCCP and led
a motion to issue a decision establishing a liability based on par. 12 of a competition and consumer protection act.
Once the motion is adopted, the Chairman of the OCCP will not be able to impose a ne.
e) Claim of Tankpol Sp. z o.o.
The court proceedings were instituted by Tankpol Sp. z o.o. (presently Tankpol – R. Mosio i Wspólnicy Sp.j.) against PKN
ORLEN. The claim concerns the return of 253 out of 470 shares in ORLEN PetroTank Sp. z o.o. that were transferred
by Tankpol to PKN ORLEN as a security, based on the agreement dated 20 December 2002. The Court of Appeals
in Warsaw pronounced that PKN ORLEN is obliged to transfer ownership of 26 shares in ORLEN PetroTank Sp. z o.o.
to Tankpol R. Mosio i Wspólnicy Sp.j. In this scope the sentence is legally binding. As a result of an annulment sub-
mitted by Tankpol R. Mosio i Wspólnicy Sp.j. the case was revoked to reexamination in front of the District Court
in Warsaw. In its sentence dated 8 January 2010 the District Court dismissed the suit of Tankpol related to the return
of 227 shares in ORLEN PetroTank. The sentence is not yet binding. Return of other 26 shares is already legally binding.
199
PKN
OR
LEN
AN
NU
AL
REP
OR
T 20
09 •
CO
NSO
LID
ATE
D F
INA
NC
IAL
STA
TEM
ENTS
Exp
lan
ato
ry n
ote
s to
co
nso
lidat
ed
nan
cial
sta
tem
ents
fo
r th
e ye
ar e
nd
ed 3
1 d
ecem
ber
200
9 (a
ll am
ou
nts
in
PLN
th
ou
san
d)
200
f) Penalty imposed by the European Commission on Unipetrol a.s.
In November 2006, the European Commission imposed nes on Shell, Dow, Eni, Unipetrol and Kaucuk for an alleged cartel
in the area of production of ESBR (Emulsion of Polymerized Styrene Butadiene Rubber). Unipetrol a.s. and Kaucuk a.s.,
its subsidiary at that time, were jointly imposed a ne of EUR 17.5 million. Unipetrol a.s. and Kaucuk a.s. paid the ne
to the European Commission. At the same time, both entities appealed to the First Instance Court in Luxembourg.
The court proceedings are currently in progress.
Following the above decision of the European Commission, Unipetrol a.s. received a claim for damages, which tire
producers brought against all members of the ESBR cartel to the Supreme Court of England and Wales. The claimants
request a compensation for damages, together with interest, relating to losses suffered because of an alleged cartel.
The amount claimed is still to be assessed. Unipetrol a.s. challenged the jurisdiction of the British Courts to deal with
the claim. The challenge of Unipetrol a.s. is pending.
At the same time, the Italian group Eni, one of the entities ned by the European Commission, initiated proceedings
in front of a Court in Milan in which it seeks a judgment that the ESBR cartel did not exist and no damage occurred
to tire producers as a result thereof. Eni’s action has been presented to Unipetrol a.s., which decided to be a party
of the proceedings.
The Court proceedings regarding Unipetrol’s appeal against the European Commission decision took place on 20 October
2009 in front of the European Union First Instance Court. The sentence is to be announced within few months.
39.2. Court proceedings in which PKN ORLEN acts as plaintiff
Arbitration proceedings against Yukos International UK B.V.
On 15 July 2009 PKN ORLEN submitted in the Court of Arbitration by the International Chamber of Commerce
in London the request for arbitration proceedings against Yukos International UK B.V., seated in the Netherlands,
in connection with transaction of purchase of AB Mažeikių Nafta shares. Claims of PKN ORLEN concern inconsistency
of Yukos International’s statements with the actual state of AB Mažeikių Nafta at the closing date of the purchase
of AB Mažeikių Nafta shares by PKN ORLEN, i.e. on 14 December 2006.
On current stage of the case, demands of PKN ORLEN concern reimbursement of the amount of USD 250 million de-
posited in the escrow account as a part of the payment for AB Mažeikių Nafta shares in order to secure the potential
claims of PKN ORLEN towards Yukos International. PKN ORLEN reserved a right to increase its demands or to make
additional claims on further stage of the case.
On 14 September 2009 Yukos International submitted to the Court of Arbitration by the International Chamber
of Commerce a response to PKN ORLEN’s request for arbitration proceedings. In its response Yukos International ap-
pealed to dismiss all PKN ORLEN’s claims and adjudge it with proceeding costs refund.
The arbitration proceedings are carried on in front of the Court of Arbitration in London, based on Rules of Arbitration
Proceedings of the International Chamber of Commerce.
On 4 December 2009 rst seating took place in front of the Court of Arbitration in London. On the seating PKN ORLEN
and Yukos International agreed above all proceedings schedule and extent of competence of the Court of Arbitration.
According to the schedule PKN ORLEN’s deadline for submitting a suit passes on 3 May 2010.
200

PKN
OR
LEN
SA
CA
PITA
L G
RO
UP
Exp
lan
ato
ry n
ote
s to
co
nso
lidat
ed
nan
cial
sta
tem
ents
fo
r th
e ye
ar e
nd
ed 3
1 d
ecem
ber
200
9 (a
ll am
ou
nts
in
PLN
th
ou
san
d)
201
40. ADDITIONAL INFORMATION
a) Events and conditions that may in uence future results
The Parent Company is in the process of collection and analyze of binding offers from potential purchasers of its shares
in “Anwil” SA Capital Group covered with consolidated nancial statements, authorized to the next faze of the sale
process As at 31 December 2009 total assets of “Anwil” SA Capital Group amounted to PLN 2,699,293 thousand,
net assets PLN 1,942,963 thousand, net income for the year-ended 31 December 2009 PLN 66,679 thousand.
The Parent Company is in the process of preparation of sale of shares in Polkomtel SA valued in consolidated nancial
statements of the PKN ORLEN Capital Group with equity method in the amount of PLN 1,347,403 thousand.
On current stage of the case nal effects of these processes can not be determined.
b) Other information
Excise tax guarantees and excise tax on goods and merchandise under the excise tax suspension procedure amounted
to PLN 1,289,169 thousand as at 31 December 2009.
Guarantees and sureties amounted to PLN 224,765 thousand as at 31 December 2009.
41. SIGNIFICANT EVENTS AFTER THE DATE OF THE REPORTING PERIOD
After the reporting period no signi cant events that may have an impact on future nancial results took place.
42. OTHER
The foregoing consolidated nancial statements were authorized by the Management Board of the Parent in Warsaw
on 29 March 2010.
Dariusz Krawiec S³awomir Jêdrzejczyk
President of the Board Vice-President of the Board
Wojciech Kotlarek Krystian Pater Marek Sera n
Member of the Board Member of the Board Member of the Board
201
pkn
oR
len
An
nU
Al
Rep
oR
T 20
09 •
Co
nTA
CT
dA
TA
Contact data
polski koncern naftowy oRlen Spółka AkcyjnaChemików 7, 09–411 Płock, Poland
Headquarters:
phone: +48 24 / 365 00 00, fax: +48 24 / 365 40 40
www.orlen.pl
Warsaw office
Warsaw Trade Tower, Chłodna 51, 00–867 Warszawa, Poland
Headquarters:
phone: +48 22 / 695 35 50, fax: +48 22 / 695 35 17
investor Relations office
phone: +48 24 / 365 33 90
fax: +48 24 / 365 56 88
e-mail: [email protected]
press office
phone: +48 24 / 365 41 50, 365 59 29
fax: +48 24 / 365 50 15
e-mail: [email protected]
oRlen deutschland Gmbh
Ramskamp 71–75
25337 Elmshorn
phone: +49 (4121) 47 50 – 0
fax: +49 (4121) 47 50 – 4 3000
e-mail: [email protected]
www.orlen-deutschland.de
Unipetrol a.s.
Na Pankráci 127
140 00 Praha 4
phone: +42 225 001 444
fax: +42 225 001 447
e-mail: [email protected]
www.unipetrol.cz
AB oRlen lietuva
Juodeikiai
LT – 89467 Mazeikiai Distric
Lithuania
phone: +370 443 9 21 21
fax: +370 443 9 25 25
e-mail: [email protected]
www.orlenlietuva.lt
203