Pivot Optimiser – an automated irrigation management ... · control of your irrigation system via...
8
Pivot Optimiser™ – an automated irrigation management system with a money back guarantee.
Transcript of Pivot Optimiser – an automated irrigation management ... · control of your irrigation system via...

Pivot Optimiser™ – an automated irrigation management system with
a money back guarantee.

01
02
03
By automating your pivot irrigation system you:use less energy which equals reduced electricity bills and a reduced carbon footprint;conserve water which reduces energy use and saves a scarce resource; andsave time through real time monitoring and control of your irrigation system via your mobile.
Reducing energy, Conserving water, Saving you time
Bigger farms require more management and if irrigation is not automated it’s hard to keep on top of it.
01
02
03
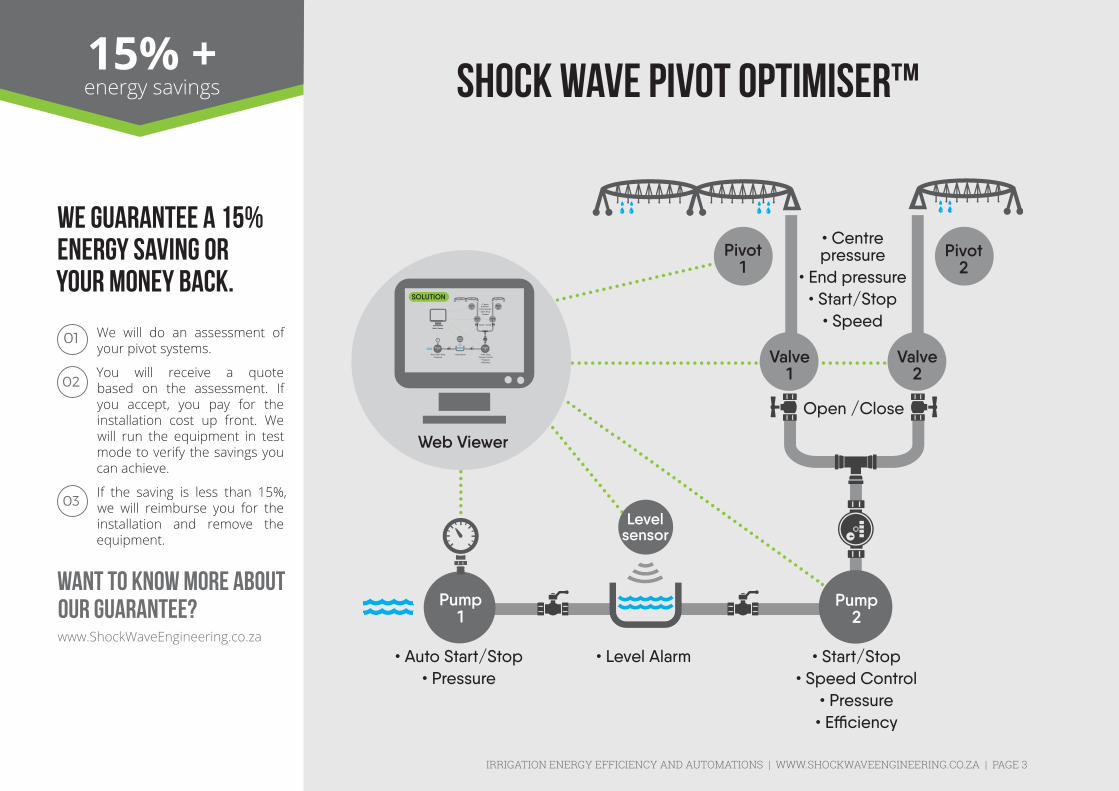
WE GUARANTEE A 15% ENERGY SAVING OR YOUR MONEY BACK.
SHOCK WAVE PIVOT OPTIMISER™
We will do an assessment of your pivot systems.
You will receive a quote based on the assessment. If you accept, you pay for the installation cost up front. We will run the equipment in test mode to verify the savings you can achieve.
If the saving is less than 15%, we will reimburse you for the installation and remove the equipment.
www.ShockWaveEngineering.co.za
WANT TO KNOW MORE ABOUT OUR GUARANTEE?
IRRIGATION ENERGY EFFICIENCY AND AUTOMATIONS | WWW.SHOCKWAVEENGINEERING.CO.ZA | PAGE 3
15% +energy savings
In a report compiled by Food and Agricultural Policy (BFAP) at the University of Pretoria, Eskom tariff hikes put significant pressure on your Net Farm Income.
Worn pumps, incorrect pump sizes, small or blocked pipelines and excess pivot pressure, all increase your power consumption and Eskom bill.
Even worse is when a pivot is working under pressure and you do not get even water distribution.
Add the maintenance and repair bill, due to stresses on the components, to those costs and you are literally watering down your profitability.
Stresses in your pivot system cause increased wear and tear on components. If you don’t have a mechanism to warn you of problems developing in your pivot systems, it’s only when something breaks that you become aware of the problem.
A broken pump or pipe at a critical time in the growing phase, could mean a failed crop and all that, that implies.
If you are over-watering one part of your crops and under-watering another, there will be crop loss.
A reduced yield-per-hectare means your tonnage is less. If you are growing your own feed, it may mean you’ll need to buy in feed. These can have dire consequences on your Net Farm Income (NPI).
Conversely, if better pivot irrigation realizes a higher yield, your NPI improves exponentially.
A typical centre pivot increases wheat yield from 8,36 tons to 10 tons. That is a 16.5% increase in yield. For example, on a 60 hectare centre pivot an additional R373,920 would be generated at a net wheat price of R3,800.
Any improvement to your pivot irrigation system will both improve your bottom line and reduce expenses.
Manual Pivot Management…
… reducing your farm profitability … suffering crop losses
When your pivot is running sub-optimally, you are not only paying Eskom and your irrigation part suppliers more than you need to, you are also ...
PAGE 4
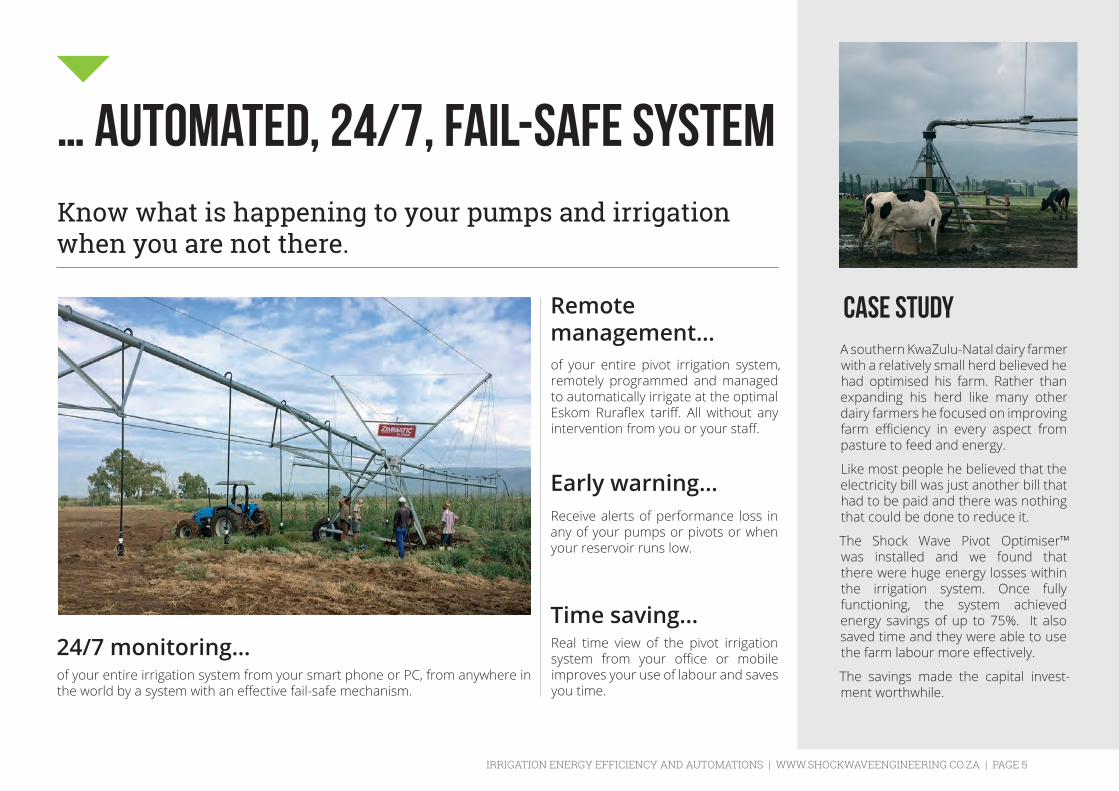
of your entire irrigation system from your smart phone or PC, from anywhere in the world by a system with an effective fail-safe mechanism.
Receive alerts of performance loss in any of your pumps or pivots or when your reservoir runs low.
of your entire pivot irrigation system, remotely programmed and managed to automatically irrigate at the optimal Eskom Ruraflex tariff. All without any intervention from you or your staff.
Real time view of the pivot irrigation system from your office or mobile improves your use of labour and saves you time.
… Automated, 24/7, fail-safe system
24/7 monitoring…
Early warning…
Remote management…
Time saving…
Know what is happening to your pumps and irrigation when you are not there.
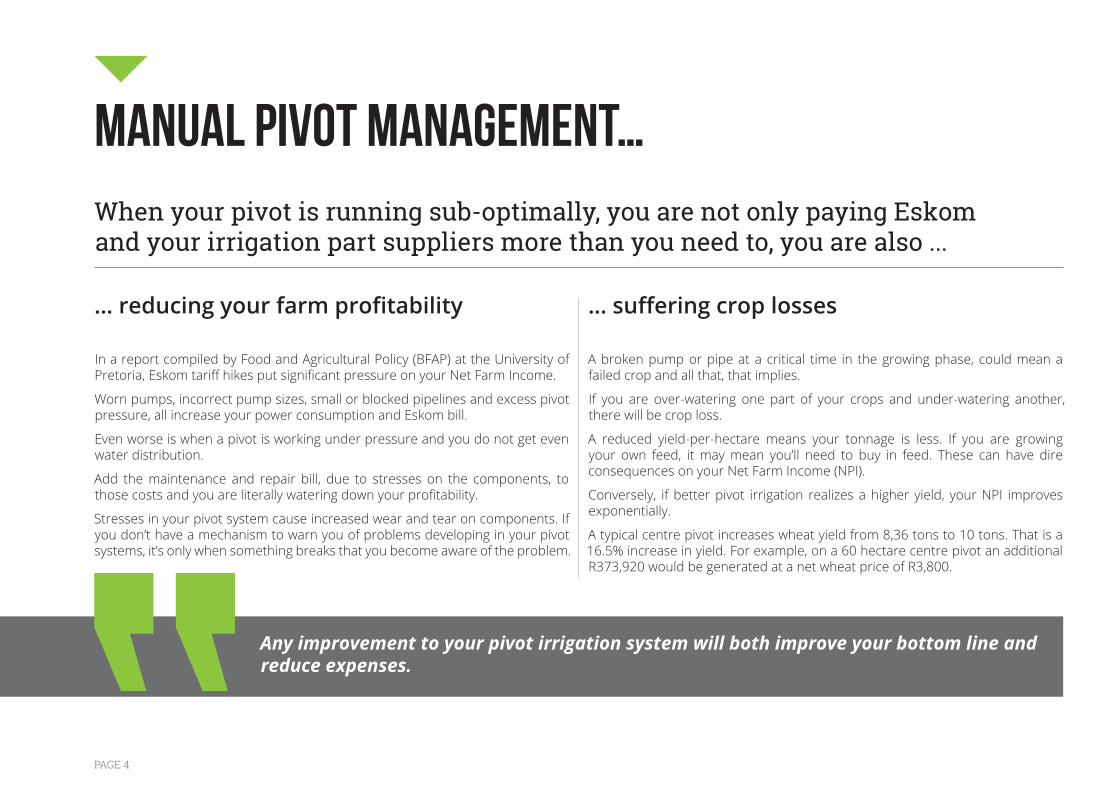
CASE STUDYA southern KwaZulu-Natal dairy farmer with a relatively small herd believed he had optimised his farm. Rather than expanding his herd like many other dairy farmers he focused on improving farm efficiency in every aspect from pasture to feed and energy.
Like most people he believed that the electricity bill was just another bill that had to be paid and there was nothing that could be done to reduce it.
The Shock Wave Pivot Optimiser™ was installed and we found that there were huge energy losses within the irrigation system. Once fully functioning, the system achieved energy savings of up to 75%. It also saved time and they were able to use the farm labour more effectively.
The savings made the capital invest-ment worthwhile.
IRRIGATION ENERGY EFFICIENCY AND AUTOMATIONS | WWW.SHOCKWAVEENGINEERING.CO.ZA | PAGE 5
0
100
200
300
400
500
600
700
0 1 2 3 4 5 6 7 8
Pres
sure
(kPa
)
Time (h)
0
100
200
300
400
500
600
0 1 2 3 4 5 6 7 8
Pres
sure
(kPa
)
Time (h)
0
100
200
300
400
500
600
700
0 1 2 3 4 5 6 7 8
Pres
sure
(kPa
)
Time (h)
TECHNOLOGY
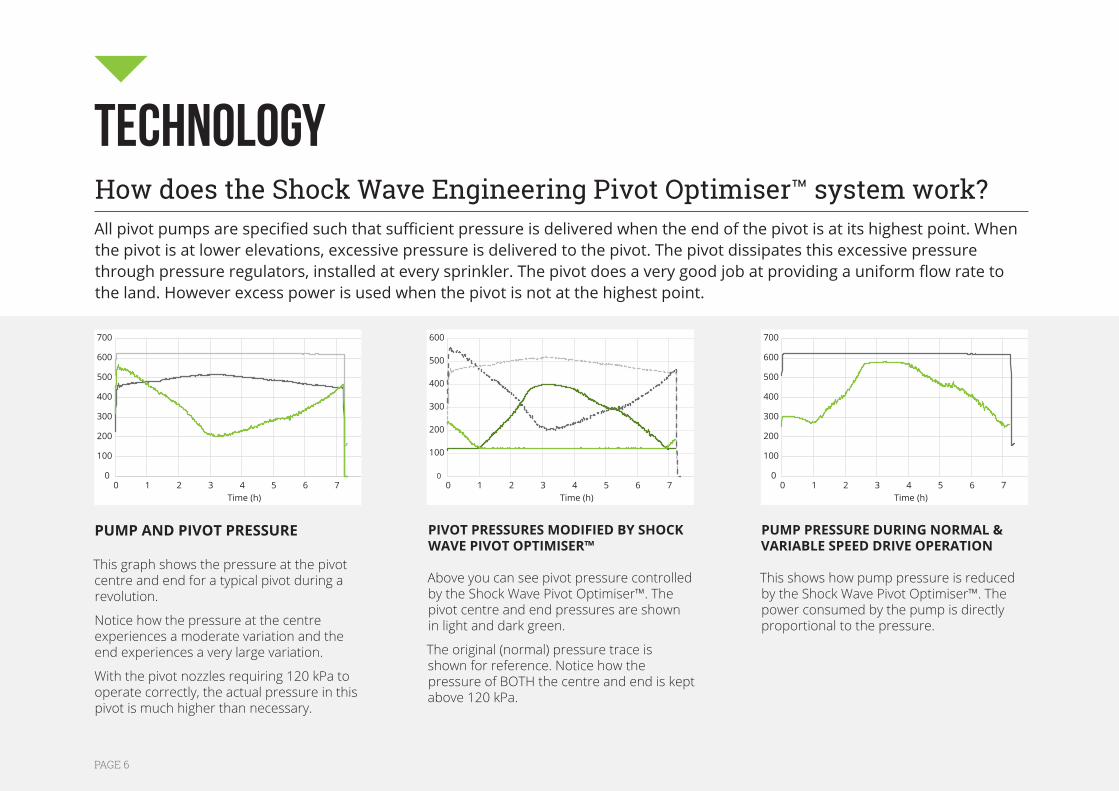
PUMP AND PIVOT PRESSURE
This graph shows the pressure at the pivot centre and end for a typical pivot during a revolution.
Notice how the pressure at the centre experiences a moderate variation and the end experiences a very large variation.
With the pivot nozzles requiring 120 kPa to operate correctly, the actual pressure in this pivot is much higher than necessary.
PIVOT PRESSURES MODIFIED BY SHOCK WAVE PIVOT OPTIMISER™
Above you can see pivot pressure controlled by the Shock Wave Pivot Optimiser™. The pivot centre and end pressures are shown in light and dark green.
The original (normal) pressure trace is shown for reference. Notice how the pressure of BOTH the centre and end is kept above 120 kPa.
PUMP PRESSURE DURING NORMAL & VARIABLE SPEED DRIVE OPERATION
This shows how pump pressure is reduced by the Shock Wave Pivot Optimiser™. The power consumed by the pump is directly proportional to the pressure.
How does the Shock Wave Engineering Pivot Optimiser™ system work?All pivot pumps are specified such that sufficient pressure is delivered when the end of the pivot is at its highest point. When the pivot is at lower elevations, excessive pressure is delivered to the pivot. The pivot dissipates this excessive pressure through pressure regulators, installed at every sprinkler. The pivot does a very good job at providing a uniform flow rate to the land. However excess power is used when the pivot is not at the highest point.
PAGE 6
-5
0
5
10
15
20
0 1 2 3 4 5 6 7 8
Pow
er (k
W)
Time (h)
0
20
40
60
80
100
120
140
0 1 2 3 4 5 6 7 8
Ener
gy (k
Wh)
Time (h)
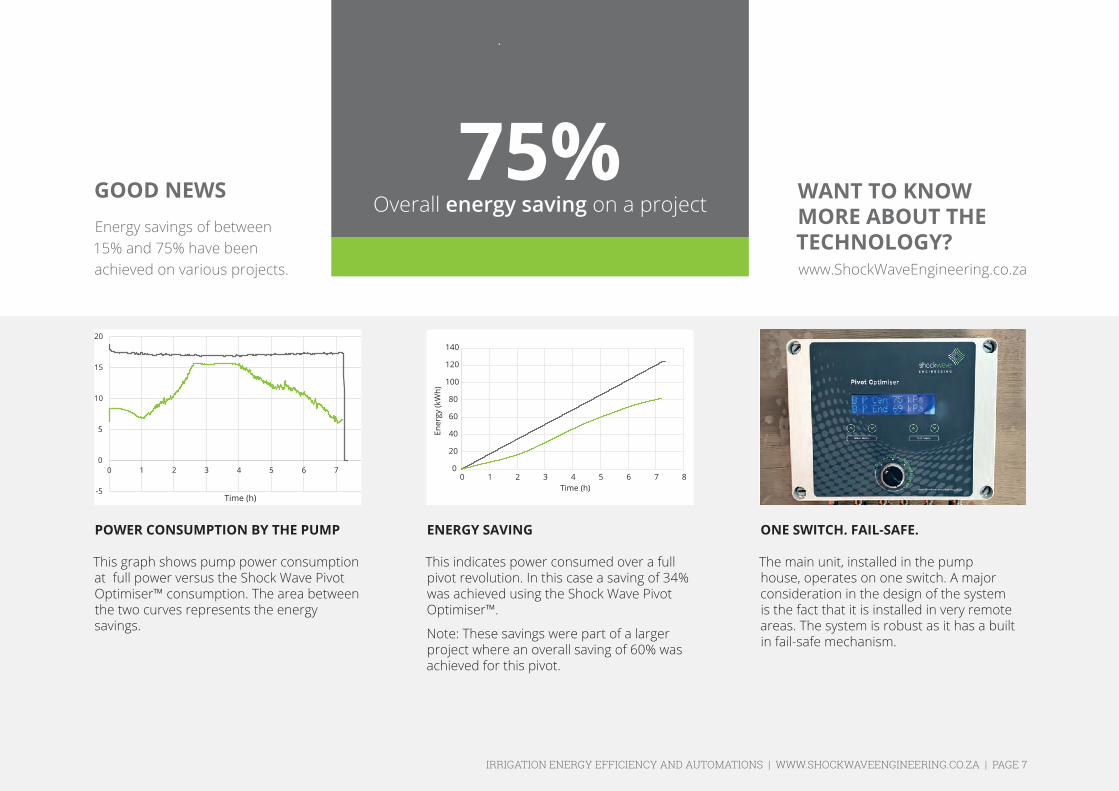
POWER CONSUMPTION BY THE PUMP
This graph shows pump power consumption at full power versus the Shock Wave Pivot Optimiser™ consumption. The area between the two curves represents the energy savings.
ENERGY SAVING
This indicates power consumed over a full pivot revolution. In this case a saving of 34% was achieved using the Shock Wave Pivot Optimiser™.
Note: These savings were part of a larger project where an overall saving of 60% was achieved for this pivot.
ONE SWITCH. FAIL-SAFE.
The main unit, installed in the pump house, operates on one switch. A major consideration in the design of the system is the fact that it is installed in very remote areas. The system is robust as it has a built in fail-safe mechanism.
75%Overall energy saving on a project
Energy savings of between 15% and 75% have been achieved on various projects. www.ShockWaveEngineering.co.za
GOOD NEWS WANT TO KNOW MORE ABOUT THE TECHNOLOGY?
IRRIGATION ENERGY EFFICIENCY AND AUTOMATIONS | WWW.SHOCKWAVEENGINEERING.CO.ZA | PAGE 7

www.ShockWaveEngineering.co.za
Wanting to find out more? You’re welcome to pop us an email.–
[email protected] [email protected] [email protected]
Feel free to contact us the old fashioned way. Sometimes it’s nice to talk to a real person.–
Murray Bredin: 084 568 7729 Rowan Saunders: 078 616 7325 Wesley van Niekerk: 084 504 3405
You’ll find our office in the heart of Strydom Park, Gauteng, South Africa.–
Unit 9, Rodium Industrial Park, Fabriek Street, Strydom Park, Johannesburg, 2194
Contact us to have your systems evaluated
GET IN TOUCH
PAGE 8