Pit Bulls 2015 Presentation
9
OLAM PITBULLS - Building future generation traders IIM CALCUTTA 16 September 2015
description
again
Transcript of Pit Bulls 2015 Presentation

OLAM PITBULLS- Building future generation traders
IIM CALCUTTA16 September 2015

Competition for the premier B-schools
1st Prize : INR 2,00,000
2nd Prize : INR 1,00,000
OLAM PITBULLS
Pit Bulls – a competition to introduce young individuals to the trading environment & provide opportunity to solve real life trading challenges
OLAM PITBULLS
A golden ticket for aspiring traders to get a sneak peek into trading

• Teams will be provided time series data of 3
related commodities
• Trading strategy may either be on any
individual commodity or on a combination
• Strategy may be time based (daily/weekly) or
technical indicator based
• Trading logic should be robust
• Teams of maximum 4 (PGP2 and/or PGP1)
• Maximum of 2 strategies per team accepted
COMPETITION GUIDELINES
Objective - To Develop a Successful Systematic Trading Strategy
Each team will be assigned an Olam trader as Mentor for guidance
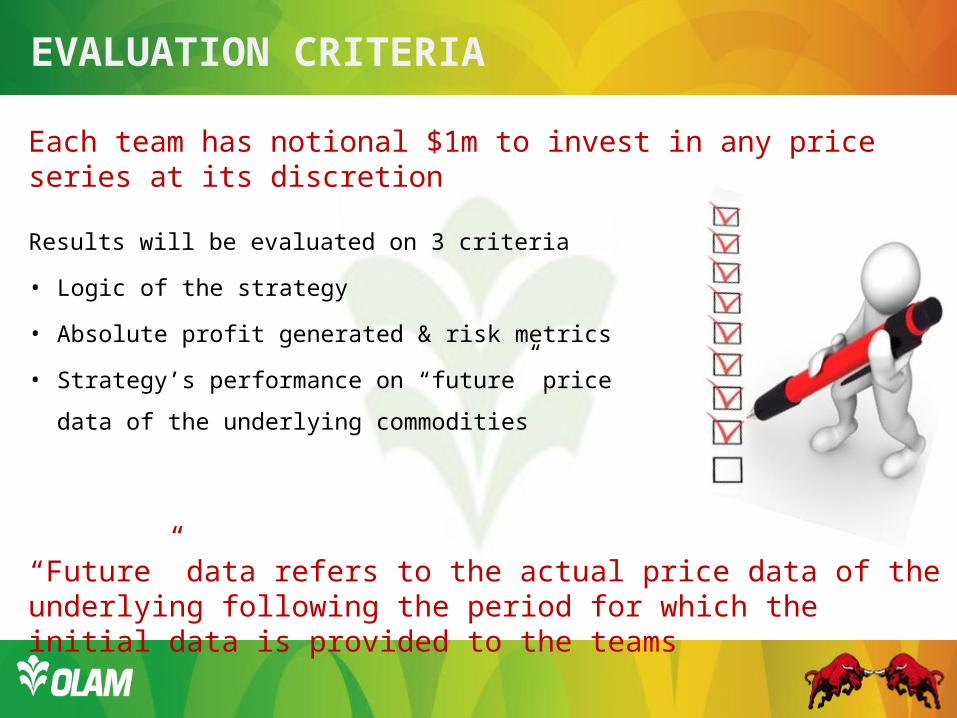
Results will be evaluated on 3 criteria
• Logic of the strategy
• Absolute profit generated & risk metrics
• Strategy’s performance on “future” price
data of the underlying commodities
EVALUATION CRITERIA
Each team has notional $1m to invest in any price series at its discretion
“Future” data refers to the actual price data of the underlying following the period for which the initial data is provided to the teams
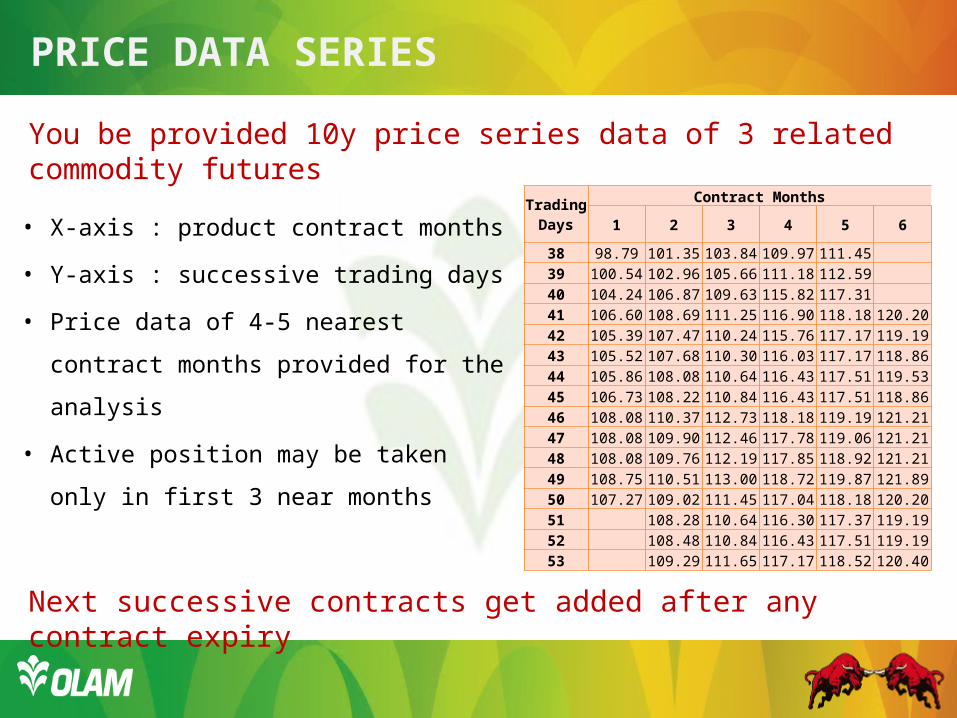
• X-axis : product contract months
• Y-axis : successive trading days
• Price data of 4-5 nearest contract
months provided for the analysis
• Active position may be taken only
in first 3 near months
PRICE DATA SERIES
You be provided 10y price series data of 3 related commodity futures
Next successive contracts get added after any contract expiry
Trading Days
Contract Months
1 2 3 4 5 6
38 98.79 101.35 103.84 109.97 111.45 39 100.54 102.96 105.66 111.18 112.59 40 104.24 106.87 109.63 115.82 117.31 41 106.60 108.69 111.25 116.90 118.18 120.2042 105.39 107.47 110.24 115.76 117.17 119.1943 105.52 107.68 110.30 116.03 117.17 118.8644 105.86 108.08 110.64 116.43 117.51 119.5345 106.73 108.22 110.84 116.43 117.51 118.8646 108.08 110.37 112.73 118.18 119.19 121.2147 108.08 109.90 112.46 117.78 119.06 121.2148 108.08 109.76 112.19 117.85 118.92 121.2149 108.75 110.51 113.00 118.72 119.87 121.8950 107.27 109.02 111.45 117.04 118.18 120.2051 108.28 110.64 116.30 117.37 119.1952 108.48 110.84 116.43 117.51 119.1953 109.29 111.65 117.17 118.52 120.40

• Trading algorithm can only use
past trading days’ data to
generate buy / sell / hold signals
• Positions may be taken on price,
inter- and intra-product spreads
TRADING AND ENTERING POSITIONS
Positions can only be entered / closed on the “current” prices
At contract expiry, positions have to be unwound
Trading Days
Contract Months
1 2 3 4 5 6
38 98.79 101.35 103.84 109.97 111.45 39 100.54 102.96 105.66 111.18 112.59 40 104.24 106.87 109.63 115.82 117.31 41 106.60 108.69 111.25 116.90 118.18 120.2042 105.39 107.47 110.24 115.76 117.17 119.1943 105.52 107.68 110.30 116.03 117.17 118.8644 105.86 108.08 110.64 116.43 117.51 119.5345 106.73 108.22 110.84 116.43 117.51 118.8646 108.08 110.37 112.73 118.18 119.19 121.2147 108.08 109.90 112.46 117.78 119.06 121.2148 108.08 109.76 112.19 117.85 118.92 121.2149 108.75 110.51 113.00 118.72 119.87 121.8950 107.27 109.02 111.45 117.04 118.18 120.2051 108.28 110.64 116.30 117.37 119.1952 108.48 110.84 116.43 117.51 119.1953 109.29 111.65 117.17 118.52 120.40
• Working excel template / algorithm code
– May develop strategies using excel template
or any coding language
– Results have to be computable upon changing
the input data series
• Executive Summary about the strategy
logic and its performance on given data
FINAL RESULTS SUBMISSION
Final submission to include the algorithm and executive summary

Registrations open 16th Sep’15
Last date of team registration 21st Sep’15
Distribution of Price Series Data 22nd Sep’15
Last date for submitting strategy 9th Nov’15
Final Presentation & Results 24th Nov’15
COMPETITION TIMELINE
To register, send an email to [email protected] with the team name, members’ names and email addresses

QUESTIONS