PIPELINES, PATHWAYS, INSTITUTIONAL LEADERSHIP...PIPELINES, PATHWAYS, and INSTITUTIONAL LEADERSHIP An...
28
PIPELINES, PATHWAYS, and INSTITUTIONAL LEADERSHIP An Update on the Status of Women in Higher Education Higher Ed Spotlight Infographic Brief 100 Years of Leadership and Advocacy Prepared by Heather L. Johnson
Transcript of PIPELINES, PATHWAYS, INSTITUTIONAL LEADERSHIP...PIPELINES, PATHWAYS, and INSTITUTIONAL LEADERSHIP An...
PIPELINES, PATHWAYS, and INSTITUTIONAL LEADERSHIPAn Update on the Status of Women in Higher Education
Higher Ed SpotlightInfographic Brief100 Years of Leadership and Advocacy
Prepared by Heather L. Johnson
ACE and the American Council on Education are registered marks of the American Council on Education and may not be used or reproduced without the express written permission of ACE.
American Council on EducationOne Dupont Circle NWWashington, DC 20036
© 2017. All rights reserved. No part of this publication may be reproduced or transmitted in any form or by any means electronic or mechanical, including photocopying, recording, or by any information storage and retrieval system, with-out permission in writing from the publisher.
100 Years of Leadership and Advocacy
Center for Policy Research and Strategy
ACE’s Center for Policy Research and Strategy (CPRS) provides thought leadership at the intersection of public policy and institutional strategy. The center produces papers, briefs, infographics, and convenings that shed light on diverse student populations and explore emergent practices in higher education with an emphasis on long-term and systemic solutions for an evolving higher education landscape and changing American demographic.
ACE Leadership
Fulfilling higher education’s twenty-first-century mission depends upon a visionary, bold, and diverse global community of institutional leaders. ACE Leadership serves individuals and institutions that are eager to seize opportunity and embrace the challenge of serving and leading complex institutions. Through a distinctive suite of programs and services, ACE Leadership shares knowledge and insights with participants from all sectors, empowering higher education leaders, institutions, and stakeholders to anticipate critical leadership issues and imperatives.
Heather L. Johnson is a research assistant professor at the Newcomb College Institute of Tulane University (LA).
Suggested citation: Johnson, Heather L. 2017. Pipelines, Pathways, and Institutional Leadership: An Update on the Status of Women in Higher Education. Washington, DC: American Council on Education.

1
In 2009, The White House Project: Benchmarking Women’s Leadership was released. This groundbreaking report examined the leadership roles of women across 10 sectors of the workforce in the United States. Key findings illustrated that women in academia make up more than half of all college students, but only slightly more than a quarter of all full professors and less than 15 percent of the presidents at doctoral degree-granting intuitions. It also documented that female faculty members have not made progress in closing the salary gap—women made 83 percent of what male faculty made in 1972 and only 82 percent of what male faculty made in 2009. In 2013, the Colorado Women’s College at the University of Denver released the follow-up report Benchmarking Women’s Leadership in the United States, expanding the depth and breadth of the original report.
The information presented in this infographic brief includes updated data on women in higher education leadership to a previously published version. It seeks to continue the conversation and offers updated key descriptive statistics on women in higher education in an effort to promote dialogue on how to move the needle and increase the number of women leaders.
BACKGROUND

2
THE
PIPE
LINE
MYT
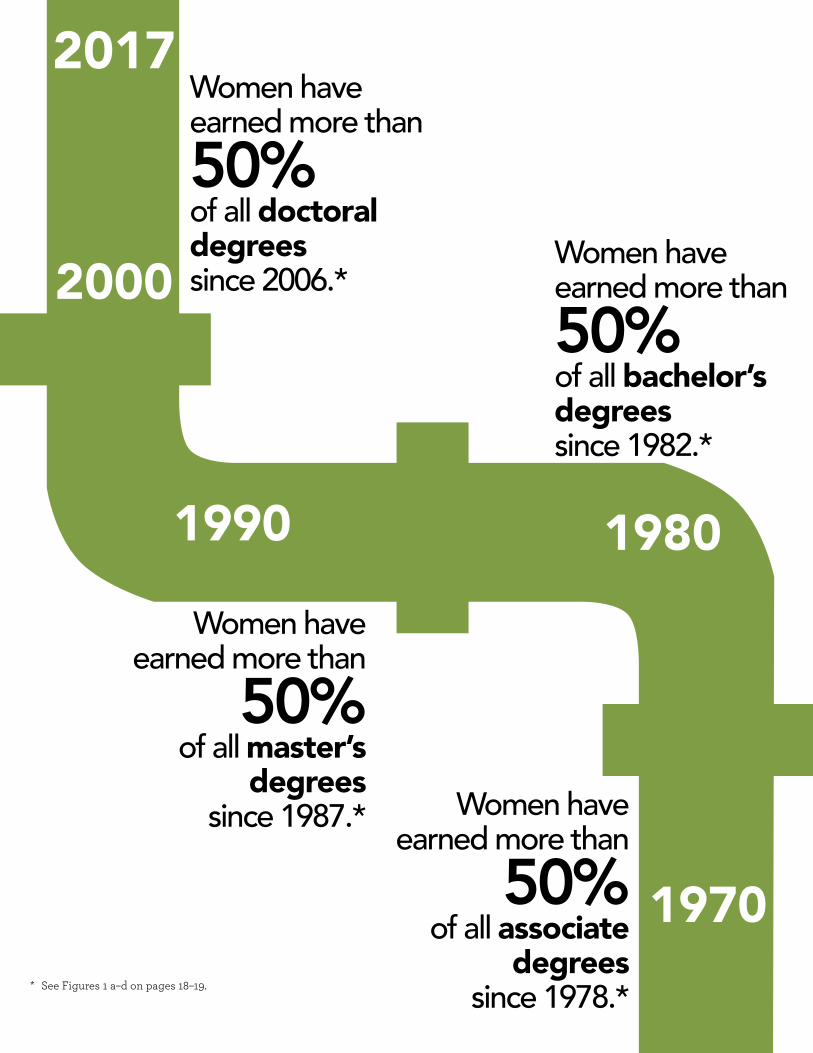
H The pipeline myth is the persistent idea that there are too few women qualified (e.g., degree holding) for leadership positions. However, the data indicate that there are more than enough qualified women to fill available leadership positions. In fact, the pipeline is preparing women at a greater rate than it does men. For example, female students have earned half or more of all baccalaureate degrees for the past three decades and of all doctoral degrees for almost a decade.
2017
2000
* See Figures 1 a–d on pages 18–19.
3
Women have earned more than 50% of all doctoral degrees since 2006.*
Women have earned more than
50% of all associate
degrees since 1978.*
Women have earned more than 50% of all bachelor’s degrees since 1982.*
Women have earned more than
50% of all master’s
degrees since 1987.*
2017
2000
1990 1980
1970 * See Figures 1 a–d on pages 18–19.

4
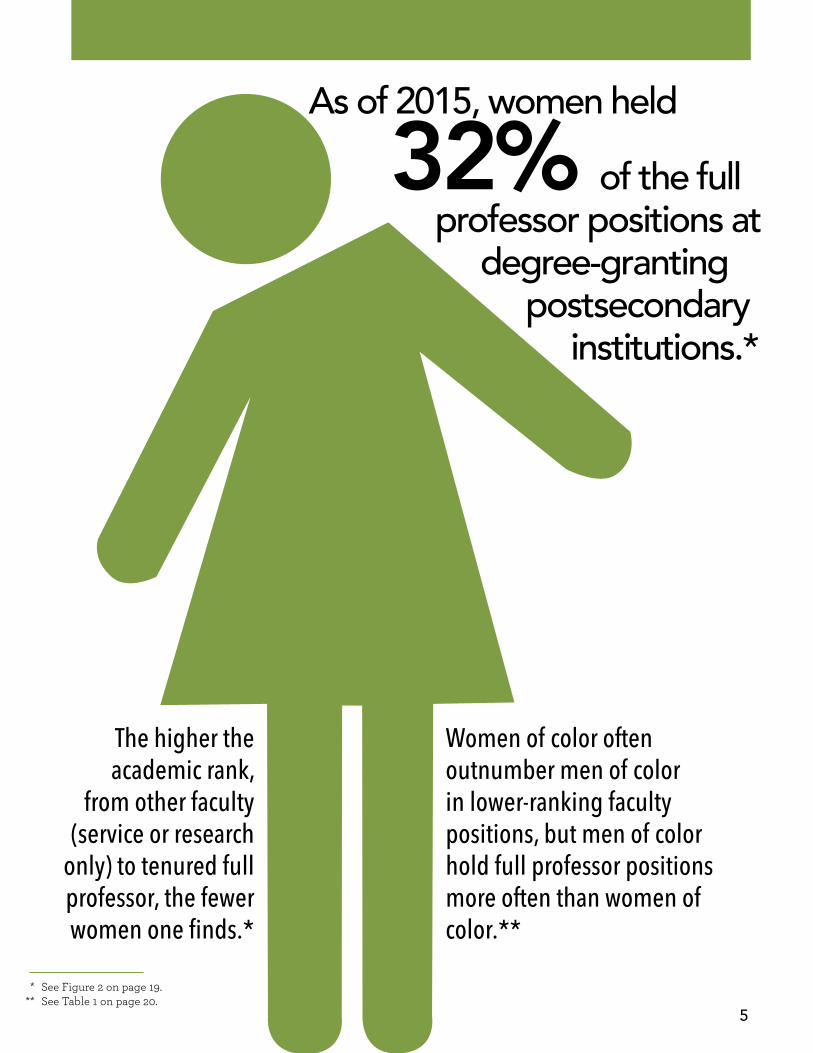
The glass ceiling is a long-standing metaphor for the intangible systemic barriers that prevent women from obtaining senior-level positions. Despite the number of female graduates available for leadership positions, women do not hold associate professor or full professor positions at the same rate as their male peers. The data show that women are not ascending to leadership roles, given that they hold a greater share of the entry-level, service, and teaching-only positions than their male counterparts. This is true for all women when looking across degree-granting postsecondary institutions; the trend is exacerbated for women of color.*
GLAS
S CE
ILIN
GS
* See Table 1 on page 20.
5
As of 2015, women held
32% of the full professor positions at
degree-granting postsecondary
institutions.*
The higher the academic rank,
from other faculty (service or research
only) to tenured full professor, the fewer women one finds.*
Women of color often outnumber men of color in lower-ranking faculty positions, but men of color hold full professor positions more often than women of color.**
* See Figure 2 on page 19. ** See Table 1 on page 20.

6
THE
HIGH
ERThe phrase “the higher the fewer” is used to recognize the fact that even though women have higher education attainment levels than men, this is not reflected in the number of women holding positions with high faculty rank, salary, or prestige. This characterization is apt when it comes to the percentage of full-time instructional faculty with tenure. Women of all races and ethnicities are more likely to hold lower ranking faculty positions.
THE F
EWER
* See Table 2 on page 20.

7
In 2015, male faculty
members held a higher %
of tenure positions at every type of
institution even though they did not hold the
highest number of faculty positions at every rank.* * See Table 2 on page 20.

8
One of the clearest indicators of the glass ceiling is the persistent pay gap between men and women at the same faculty rank. Overall, during the 2015–16 academic year, male faculty members made an average of $89,190, and female faculty members made an average of $73,782.* No matter the academic rank, men make more than women and are more likely to hold a tenure track position.
PAY
GAP
* See Figure 3 on page 20.

9
Men outearn women by:
$13,874 at public institutions
$18,201 at private institutions*
Men make more than women at every rank and in every institution type except two-year private
institutions. At two-year private institutions, women make slightly more than their male peers, earning
$32,495 compared to $30,050.*
* See Figure 4 on page 21.
* See Figure 3 on page 20.

10
Setting aside the many myths and metaphors that address the paucity of women in postsecondary leadership positions, data on college and university presidents, chief academic officers, and governing boards provide the field an understanding of the pathways that women have taken to achieve such positions in the academy. The following pages present these important data.
Data on college and university presidents—powerful and visible leaders in American society—come from ACE’s seminal survey study on this population. Also presented are ACE data on chief academic officers or CAOs—an important position of study given their role in setting the academic direction of an institution and the fact that many CAOs aspire to the college presidency. Association of Governing Boards of Universities and Colleges data benchmark the important role of these bodies, which determine the strategic direction of higher education institutions and have oversight in selecting, hiring, and appointing key academic leaders.
PRES
IDEN
TS, C
AOs,
and
GOVE
RNIN
G BO
ARDS

11
Women presidents are less likely to be married, less likely to have children, and more likely to have altered their career to care for dependent, spouse/partner, or parent.**
Currently married
90% vs. 75%
Have children
89% vs. 74% 16% vs. 32%
Altered career for dependent, spouse/partner, or parent
Women presidents are
more likely to have a PhD or EdD than their
male peers.
Education, humanities, and the social sciences were the top three fields of study among all presidents.***
Women presidents are more likely to have served as a CAO/provost or other senior executive in aca-demic affairs. Male presi-dents are more likely to come from outside higher education or have had a different senior campus executive role than women presidents.****
* See Table 3 on page 21.** See Figure 5 on page 22.
*** See Figure 6 on page 22.**** See Figure 7 on page 22.
While the number of women presidents has increased since 1986, as of 2016, women only hold 30 percent of presidencies across all institutions of higher education.*
30%70%
RESUME
PRESIDENTS

12
The percentage of women serving in a CAO position has declined from 2008 to 2013 in public doctoral degree-granting institutions.*
* See Table 4 on page 23. ** See Figure 8 on page 23. *** See Figure 9 on page 24. **** See Figure 10 on page 24.
CHIEF ACADEMIC OFFICERS
Women CAOs are less likely to be married or to have children than their male counterparts.**
Currently married
89% vs. 71% Have children 87% vs. 73%
A woman CAO is more likely to have previous CAO experience and to have served as a senior academic offi-cer or other senior executive outside of academic affairs. Male CAOs are more likely to have previously served as an academic dean or other campus executive in academic affairs.****
Unlike presidencies, where more women
possess a PhD or EdD, male CAOs slightly lead
women CAOs on possessing a doctorate.****
Similar to college presidents, the top three fields of study for CAOs are education, humanities, and social sciences.***
RESUME

13 * See Table 4 on page 23. ** See Figure 8 on page 23. *** See Figure 9 on page 24. **** See Figure 10 on page 24.
But, previous steady progress on governing boards has slowed with the number of female boardmembers standing at roughly 30 percent for
what has been nearly two decades.***
* See Table 5 on page 24. ** See Table 6 on page 24. *** Association of Governing Boards 2010.
Data show that men outnumbered women
on both public and independent governing
boards by more than 2 to 1.*
The number of women holding the position of board chair has increased from 2010 and is slightly higher at public institutions when compared to private institutions.**
GOVERNING BOARDS

14
Collecting and reporting on data that reveal patterns of bias is imperative to increasing the number of women in higher education leadership positions including tenured professors, deans, chief academic officers, presidents, board members, and chairs. The types of data in this infographic brief need to be tracked and reviewed regularly to help individuals, organizations, and policies from perpetuating bias. Further, search, promotion, and tenure committees and governing boards can use this information and related research to inform the hiring and promotion of faculty and administrators in an effort to chip away at the glass ceiling and engage the brains, talents, and resources of half of our population—women—in leading our nation’s colleges and universities.
SUMMARY

15
MOVING FORWARDMoving the Needle: Advancing Women in Higher Education Leadership
ACE’s Leadership division is committed to increasing the number of women in higher education senior leadership positions through programs, research, and resources. Its Moving the Needle initiative is centered on the vision of having half of the chief executives at higher education institutions be women by 2030. For more information about the goals of the initiative please visit www.acenet.edu/mtn.
American College President Study 2017
ACE’s Center for Policy Research and Strategy recently released the American College President Study 2017, the latest edition of the oldest and most comprehensive national survey of college and university presidents. These data contribute to a better understanding of the personal and professional characteristics, experiences, and trajectories of women leaders in higher education. For more information about ACPS please visit www.acenet.edu/acps2017.
16
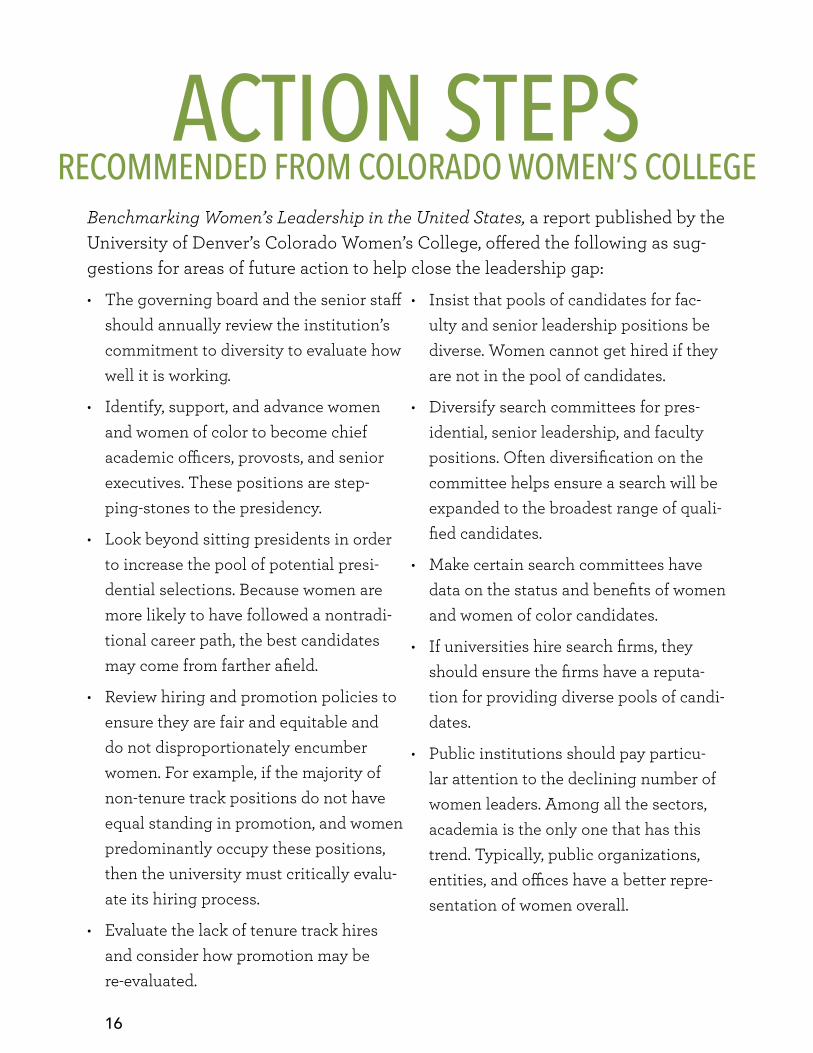
ACTION STEPSRECOMMENDED FROM COLORADO WOMEN’S COLLEGE
Benchmarking Women’s Leadership in the United States, a report published by the University of Denver’s Colorado Women’s College, offered the following as sug-gestions for areas of future action to help close the leadership gap:
• The governing board and the senior staff should annually review the institution’s commitment to diversity to evaluate how well it is working.
• Identify, support, and advance women and women of color to become chief academic officers, provosts, and senior executives. These positions are step-ping-stones to the presidency.
• Look beyond sitting presidents in order to increase the pool of potential presi-dential selections. Because women are more likely to have followed a nontradi-tional career path, the best candidates may come from farther afield.
• Review hiring and promotion policies to ensure they are fair and equitable and do not disproportionately encumber women. For example, if the majority of non-tenure track positions do not have equal standing in promotion, and women predominantly occupy these positions, then the university must critically evalu-ate its hiring process.
• Evaluate the lack of tenure track hires and consider how promotion may be re-evaluated.
• Insist that pools of candidates for fac-ulty and senior leadership positions be diverse. Women cannot get hired if they are not in the pool of candidates.
• Diversify search committees for pres-idential, senior leadership, and faculty positions. Often diversification on the committee helps ensure a search will be expanded to the broadest range of quali-fied candidates.
• Make certain search committees have data on the status and benefits of women and women of color candidates.
• If universities hire search firms, they should ensure the firms have a reputa-tion for providing diverse pools of candi-dates.
• Public institutions should pay particu-lar attention to the declining number of women leaders. Among all the sectors, academia is the only one that has this trend. Typically, public organizations, entities, and offices have a better repre-sentation of women overall.

17
ACTION STEPSRECOMMENDED FROM COLORADO WOMEN’S COLLEGE
SELECT RESOURCESThe following list provide additional information about scholars, researchers, policymakers, and organizations that are working to research, educate, and promote knowledge on women, leadership, and inclusive leadership practices.
ACE Women’s Networkhttp://www.acenet.edu/higher-education/topics/Pages/Gender-Equity.aspx
American Association of University Women www.aauw.org
WorkLife Law – UC Hastings College of the Law –Higher Education http://worklifelaw.org/projects/higher-education/
American Association of University Professorshttps://www.aaup.org/issues/women-academic-profession
Catalystwww.catalyst.org
Institute for Women’s Policy Researchhttps://iwpr.org/
National Alliance for Partnerships in Equityhttps://www.napequity.org/
Preparing Women to Leadwww.plen.org
Collaborative to Advance Equity Through Researchhttp://equitythroughresearch.com/
Gender Justicehttp://www.genderjustice.us/
EY Women. Fast Forwardhttp://www.ey.com/gl/en/issues/business-environment/women-fast-forward
18
SourcesAssociation of Governing Boards of Universities and Colleges. 2010. 2010 Policies, Practices, and
Composition of Governing Boards of Independent Colleges and Universities. Washington, DC: Association of Governing Boards of Universities and Colleges. http://agb.org/reports/2010/2010-policies-practices-and-composition-governing-boards-independent-colleges-and-unive.
Gagliardi, Jonathan S., Lorelle L. Espinosa, Jonathan M. Turk, and Morgan Taylor. 2017. American College President Study 2017. Washington, DC: American Council on Education.
Snyder, Thomas D., Cristobal de Brey, and Sally A. Dillow. 2016. Digest of Education Statistics 2015. NCES 2016-014.Washington, DC: U.S. Department of Education, National Center for Education Statistics.
U.S. Department of Education, Digest of Education 2016. Washington, DC: U.S. Department of Education, National Center for Education Statistics.
University of Denver. 2013. Benchmarking Women’s Leadership in the United States. Denver, CO: University of Denver Colorado Women’s College.
The White House Project. 2009. The White House Project: Benchmarking Women’s Leadership. Washington, DC: The White House Project. http://www.in.gov/icw/files/benchmark_wom_leadership.pdf.
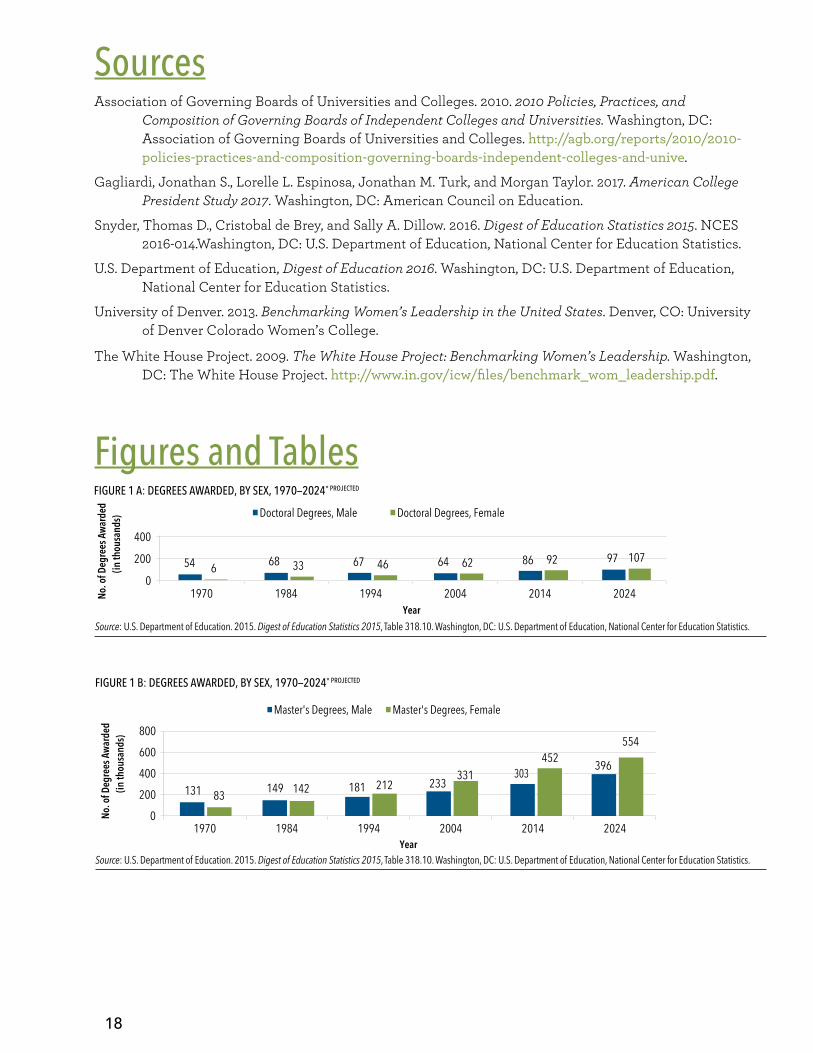
54 68 67 64 86 976 33 46 62 92 107
0
200
400
1970 1984 1994 2004 2014 2024No. o
f Deg
rees
Awar
ded
(in th
ousa
nds)
Year
Doctoral Degrees, Male Doctoral Degrees, Female
FIGURE 1 A: DEGREES AWARDED, BY SEX, 1970—2024* PROJECTED
131 149 181 233303 396
83 142 212331
452554
0
200
400
600
800
1970 1984 1994 2004 2014 2024Year
Master's Degrees, Male Master's Degrees, Female
FIGURE 1 B: DEGREES AWARDED, BY SEX, 1970—2024* PROJECTED
No. o
f Deg
rees
Awar
ded
(in th
ousa
nds)
Figures and Tables
Source: U.S. Department of Education. 2015. Digest of Education Statistics 2015, Table 318.10. Washington, DC: U.S. Department of Education, National Center for Education Statistics.
Source: U.S. Department of Education. 2015. Digest of Education Statistics 2015, Table 318.10. Washington, DC: U.S. Department of Education, National Center for Education Statistics.

19
57,840
72,716
18,37256,350
88,269
70,482
22,58681,038
42,936
84,762
87,317
0 20,000 40,000 60,000 80,000 100,000 120,000
Professors
Associate professors
Assistant professors
Instructors
Lecturers
Other faculty
No. of Academic Staff
Prof
esso
r Ran
k
FIGURE 2: NUMBER OF ACADEMIC STAFF MEMBERS,* BY RANK AND SEX
Male Female
124,364
130,000
117 203 215 260391
439
89250 315 405
613801
0
200
400
600
800
1970 1984 1994 2004 2014 2024No. o
f Deg
rees
Awar
ded
(in th
ousa
nds)
Year
Associate Degrees, Male Associate Degrees, FemaleFIGURE 1 D: DEGREES AWARDED, BY SEX, 1970—2024* PROJECTED
Source: U.S. Department of Education. 2015. Digest of Education Statistics 2015, Table 318.10. Washington, DC: U.S. Department of Education, National Center for Education Statistics.
*Only instructional faculty were classified by academic rank. Primarily research and primarily public service faculty, as well as faculty without ranks, appear under “other faculty.”
Source: U.S. Department of Education. 2016. Digest of Education Statistics 2016, Table 315.20. Washington, DC: U.S. Department of Education, National Center for Education Statistics.
451 482 532 595802 834
341492
637804
1,0681,159
0
200
400
600
800
1,000
1,200
1970 1984 1994 2004 2014 2024
No. o
f Deg
rees
Awar
ded
(in th
ousa
nds)
Year
Bachelor's Degrees, Male Bachelor's Degrees, Female
FIGURE 1 C: DEGREES AWARDED, BY SEX, 1970—2024* PROJECTED
Source: U.S. Department of Education. 2015. Digest of Education Statistics 2015, Table 318.10. Washington, DC: U.S. Department of Education, National Center for Education Statistics.

20
TABLE 1: NUMBER OF FULL-TIME FACULTY IN DEGREE-GRANTING POSTSECONDARY INSTITUTIONS, BY RACE/ETHNICITY, SEX, AND ACADEMIC RANK* (FALL 2015)
Rank White Male
White Female
Black Male
Black Female
Hispanic Male
Hispanic Female
Asian/Pacific Islander
Male
Asian/Pacific Islander Female
American Indian/ Alaska Native Male
American Indian/ Alaska Native Female
Total**
Professors 99,759 47,205 4,010 2,710 3,827 2,129 12,816 4,108 364 234 182,204Associate professors 64,010 52,501 4,333 4,744 3,800 3,167 10,501 6,758 288 321 157,799Assistant professors 55,186 59,808 4,171 6,679 3,692 3,923 10,263 9,158 290 349 173,031Instructors 31,457 41,030 2,570 4,710 3,118 3,763 2,485 3,182 425 435 99,286Lecturers 13,885 16,683 871 1,213 1,009 1,359 1,043 1,648 58 84 40,958Other faculty 47,888 46,245 3,077 5,058 2,813 3,186 8,610 6,850 302 383 153,754
* Only instructional faculty were classified by academic rank. Primarily research and primarily public service faculty, as well as faculty without ranks, appear under “other faculty.” Race categories exclude persons of Hispanic ethnicity.** Total also includes those of two or more races, race/ethnicity unknown, and non-resident alien race/ethnicity categories.
Source: U.S. Department of Education. 2016. Digest of Education Statistics 2016, Table 315.20. Washington, DC: U.S. Department of Education, National Center for Education Statistics.
TABLE 2: PERCENT OF FULL-TIME INSTRUCTIONAL FACULTY WITH TENURE AT DEGREE-GRANTING POSTSECONDARY INSTITUTIONS WITH A TENURE SYSTEM, BY SEX AND INSTITUTION CONTROL AND LEVEL (2015–16)
Control and level of institutions % of institutions with tenure system % of Males % of FemalesAll institutions 51.9 55.5 42.4 Public institutions 74.7 57.4 44.9 Four-year 95.2 55.9 40.6 Doctoral 99.6 54.6 37.4 Master’s 97.6 60.7 48.2 Other 85.7 57.3 51.4 Two-year 58.8 67.5 63.1 Not-for-profit institutions 57.7 51.7 37.0 Four-year 60.6 51.7 37.0 Doctoral 79.8 48.8 32.2 Master’s 60.8 57.3 45.2 Other 47.0 61.4 49.1 Two-year 7.5 46.1 25.6 For-profit institutions 1.3 18.9 15.5
Source: U.S. Department of Education. 2016. Digest of Education Statistics 2016, Table 316.80. Washington, DC: U.S. Department of Education, National Center for Education Statistics.
$121,363
$84,713$72,159
$62,303 $60,364 $63,004
$103,272
$78,954$66,589
$59,672 $54,816 $58,813
$0
$20,000
$60,000
$80,000
$100,000
$120,000
$140,000
Professor Associate Professor Assistant Professor Instructor Lecturer No rank
Aver
age S
alary
Academic Rank
FIGURE 3: AVERAGE SALARY* OF FULL-TIME INSTRUCTIONAL FACULTY ON NINE-MONTH CONTRACTS IN DEGREE-GRANTING POSTSECONDARY INSTITUTIONS, BY ACADEMIC RANK AND SEX (2015–16)
MaleFemale
$40,000
*2015–16 constant dollars based on the Consumer Price Index, prepared by the Bureau of Labor Statistics, U.S. Department of Labor, adjusted to an academic-year basis.
Source: U.S. Department of Education. 2016. Digest of Education Statistics 2016, Table 316.10. Washington, DC: U.S. Department of Education, National Center for Education Statistics.

21
TABLE 3: PERCENTAGE OF PRESIDENCIES HELD BY WOMEN, BY INSTITUTION TYPE (2001–2016)
Institution Type 2001 2006 2011 2016All institutions*
Doctorate-granting 13.3 13.7 22.3 21.8Master’s 20.3 21.7 22.8 29.1Bachelor’s 18.7 23.3 22.9 27.9Associate 26.8 28.7 33.0 35.8Special focus 14.8 16.4 20.5 30.6Total** 21.1 23.0 26.4 30.1
PublicDoctorate-granting 15.7 16.0 23.9 23.2Master’s 20.9 23.1 22.9 30.3Bachelor’s 18.2 34.4 27.5 32.8Associate 27.0 28.9 32.3 36.0Special focus 22.0 29.0 21.4 40.0Total** 23.9 26.5 29.4 32.8
Private Not-for-ProfitDoctorate-granting 8.7 7.6 20.7 19.6Master’s 19.6 20.3 22.5 28.6Bachelor’s 18.8 21.1 22.3 26.3Associate 27.6 34.0 40.7 34.8Special focus 13.7 13.4 17.8 29.3Total** 17.9 18.7 21.9 27.2
* Includes public, private not-for-profit, and private for-profit institutions** Total includes institutions classified as “Other,” which includes institutions not included in Carnegie Classification, such as some state higher education systems.
Source: Gagliardi, Jonathan S., Lorelle L. Espinosa, Jonathan M. Turk, and Morgan Taylor. 2017. American College President Study 2017. Washington, DC: American Council on Education.
$85,349
$97,590$90,459
$67,300
$98,041
$30,050
$71,475$79,389
$74,386
$64,870
$79,800
$32,495
$0
$10,000
$20,000
$30,000
$40,000
$50,000
$60,000
$70,000
$80,000
$90,000
$100,000
Total Public Total Private 4-Year Public 2-Year Public 4-Year Private 2-Year Private
Aver
age S
alary
Institution Type
FIGURE 4: AVERAGE SALARY* OF FULL-TIME INSTRUCTIONAL FACULTY ON NINE-MONTH CONTRACTS IN DEGREE-GRANTING POSTSECONDARY INSTITUTIONS, BY INSTITUTION TYPE AND SEX (2015–16)
MaleFemale
* 2015–16 constant dollars based on the Consumer Price Index, prepared by the Bureau of Labor Statistics, U.S. Department of Labor, adjusted to an academic-year basis.
Source: U.S. Department of Education. 2016. Digest of Education Statistics 2016, Table 316.10. Washington, DC: U.S. Department of Education, National Center for Education Statistics.

22
FIGURE 5: FAMILY CHARACTERISTICS OF PRESIDENTS, BY GENDER IDENTITY
89.8 88.6
16.3
74.7 73.7
31.6
0102030405060708090
100
Currently married Have children Altered career to care for dependent, spouse/partner, or parent
Perce
ntag
e of A
mer
ican C
olleg
e Pre
siden
ts
Family Information
MenWomen
77.0
36.6
14.5 10.6
86.3
51.3
13.4 12.6
0
10
20
30
40
50
60
70
80
90
Have PhD or EdD Education or higher education
Humanities/fine artsSocial sciences
Education attainment and top three fields of study
FIGURE 6: PRESIDENTS' EDUCATIONAL ATTAINMENT AND TOP FIELDS OF STUDY, BY GENDER IDENTITY
MenWomen
Perce
ntag
e of A
mer
ican C
olleg
e Pre
siden
ts
23.8
41.1
16.7 15.9
24.3
46.1
14.9 13.6
05
1015202530354045
President/CEO* Provost/CAO, other senior executive
in academic affairs, dean**
Other senior campus executive***
Outside higher
Prior Position
FIGURE 7. PRESIDENTS' IMMEDIATE PRIOR POSITION, BY GENDER IDENTITY
MenWomen
Perce
ntag
e of A
mer
ican C
olleg
e Pre
siden
ts
education
Source: Gagliardi, Jonathan S., Lorelle L. Espinosa, Jonathan M. Turk, and Morgan Taylor. 2017. American College President Study 2017. Washington, DC: American Council on Education.
Source: Gagliardi, Jonathan S., Lorelle L. Espinosa, Jonathan M. Turk, and Morgan Taylor. 2017. American College President Study 2017. Washington, DC: American Council on Education.
* Includes interim president/CEO/chancellor, president/CEO/chancellor of a system, and interim president/CEO/chancellor of a system** Excludes department chairs and faculty.*** Reflects sum of all senior executive positions outside academic affairs.
Source: Gagliardi, Jonathan S., Lorelle L. Espinosa, Jonathan M. Turk, and Morgan Taylor. 2017. American College President Study 2017. Washington, DC: American Council on Education.

23
TABLE 4: PERCENTAGE OF CAO POSITIONS HELD BY WOMEN, BY INSTITUTION TYPE
Institution Type 2008 2013
All Institutions*
Doctorate-granting 33.3 26.1
Master's 37.2 43.6
Bachelor’s 36.6 38.2
Associate 49.8 54.7
Special Focus 30.2 35.8
Total** 40.2 43.6
Public
Doctorate-granting 40.0 25.3
Master's 33.6 42.0
Bachelor’s 27.8 40.8
Associate 49.9 54.1
Special Focus 39.1 63.6
Total** 44.02 47.69
Private
Doctorate-granting 25.9 27.9
Master's 40.2 44.8
Bachelor’s 38.2 36.9
Associate 60.0 48.4
Special Focus 26.6 30.2
Total** 34.95 37.66
* Includes public, private not-for-profit, and private for-profit institutions ** Total includes institutions classified as “Other,” which includes institutions not included in Carnegie Classification, such as some state higher education systems.
Source: American Council on Education, unpublished 2008 and 2013 Chief Academic Officers Survey data
88.50 87.30
70.70 73.10
0102030405060708090
100
Married Have childrenFamily Information
FIGURE 8: FAMILY CHARACTERISTICS OF CHIEF ACADEMIC OFFICERS, BY SEX
MaleFemale
Perce
ntag
e of C
hief
Acad
emic
Offic
ers
Source: American Council on Education, unpublished 2013 Chief Academic Officers Survey data

24
TABLE 6: BOARD CHAIRS
Institutional Type 2015 2010PrivateFemale 22.6 19.0Male 77.4 81.0PublicFemale 24.1 17.4Male 75.9 82.6
Source: Association of Governing Boards of Universities and Colleges. 2010. 2010 Policies, Practices, and Composition of Governing Boards of Independent Colleges and Universities.
84.0
26.215.3 18.8
80.30
38.6
13.4 15.4
0102030405060708090
Has PhD or EdD Education or higher education Humanities/fine arts Social sciencesEducation attainment and top three fields of study
FIGURE 9: CHIEF ACADEMIC OFFICERS’ EDUCATION ATTAINMENT AND TOP FIELDS OF STUDY, BY SEX
MaleFemale
Perce
ntag
e of C
hief
Acad
emic
Offic
ers
Source: American Council on Education, unpublished 2013 Chief Academic Officers Survey data
Source: American Council on Education, unpublished 2013 Chief Academic Officers Survey data
TABLE 5: OVERALL BOARD SEX COMPOSITION
Institutional Type 2015 2010IndependentFemale 31.7 30.2Male 68.2 69.8PublicFemale 31.5 28.4Male 68.5 71.6
Source: Association of Governing Boards of Universities and Colleges. 2010. 2010 Policies, Practices, and Composition of Governing Boards of Independent Colleges and Universities.
11.9
29.4
7.3
17.3
8.210.4
4.1
12.7
27.6
9.313.7
9.66.6 5.6
0
5
10
15
20
25
30
35
CAO or provostof a campus
Dean of an academic
Senior academic officer with campus-
wide responsibility
Other campus executive in
academic affairs
Department Faculty Other senior campus executive outside academic affairs
Perce
ntag
e of C
hief
Acad
emic
Offic
ers
Prior Position
FIGURE 10: CAREER HISTORY: POSITION PRIOR TO BEING CAO, BY SEX
Male Female
collegechair/head