PIPELINE MONITORING WITH DRONES
14
STUDIA UBB AMBIENTUM, LXI, 1-2, 2016, pp. 105-118 (RECOMMENDED CITATION) PIPELINE MONITORING WITH DRONES Giuseppe RAMALLI 1 , Marcello GIOVANI 2* , Fabrizio PACCHIACUCCHI 2 , Mattia MANNESCHI 2 1 EtruriaVolo Srl, Loc. Manciano no.225, Castiglion Fiorentino (AR), Italy, 2 ICARO Srl, Vicolo Boni no. 7, Cortona (AR), Italy, tel +390575638311 * Corresponding author: [email protected] ABSTRACT. Possible pipeline leakages along routes that are not always manned or populated often cause (if hazardous substances are released) significant environmental damage, with substantial economic impacts for subsequent cleanup and recovery. In the case of releases of flammable substances, there is also the risk of fire and explosion, which can involve people, production facilities, residential or commercial areas, infrastructures and other possible vulnerable targets in the area. Timely identification of possible leaks can make it possible to take immediate action and limit the amounts released, and thus reduce the possible consequences. With the systems routinely used for the detection of any containment leaks from pipelines it can be particularly difficult to detect losses that are below the tolerance limits of the installed measurement systems, but are nonetheless able to cause extensive environmental damage of great economic significance. These issues give rise to the idea of using the SAPR (Remote Piloting Aircraft System) for monitoring pipelines, both underground and above ground, used for the conveying of liquid hydrocarbon products. The use of spectral analyses, combined with RGB input, allows the detecting of possible irregularities due to leakages occurring along the pipelines. The acquisition of multispectral digital images makes it possible to identify possible pools of petroleum hydrocarbons and, in certain cases, also the possible infiltration into the soil. The acquisition of digital images in the visible spectrum allows the determination, through the comparison of successive scans, of any unexpected changes in the morphology of the soil to be subjected to further investigation. This article illustrates a technologically-advanced, economical and reliable solution, based on the use of drones, for the detection of smaller- sized leaks due to internal/external causes or to illegal removals by third parties, with limited costs, reduced times and excellent performance, also in comparison to other similar monitoring techniques. Key words: Drone, Pipeline, Photogrammetry, Thermometric, Spectrometric
Transcript of PIPELINE MONITORING WITH DRONES

STUDIA UBB AMBIENTUM, LXI, 1-2, 2016, pp. 105-118 (RECOMMENDED CITATION)
PIPELINE MONITORING WITH DRONES
Giuseppe RAMALLI1, Marcello GIOVANI2*, Fabrizio PACCHIACUCCHI2, Mattia MANNESCHI2
1EtruriaVolo Srl, Loc. Manciano no.225, Castiglion Fiorentino (AR), Italy,
2ICARO Srl, Vicolo Boni no. 7, Cortona (AR), Italy, tel +390575638311 *Corresponding author: [email protected]
ABSTRACT. Possible pipeline leakages along routes that are not always manned or populated often cause (if hazardous substances are released) significant environmental damage, with substantial economic impacts for subsequent cleanup and recovery. In the case of releases of flammable substances, there is also the risk of fire and explosion, which can involve people, production facilities, residential or commercial areas, infrastructures and other possible vulnerable targets in the area. Timely identification of possible leaks can make it possible to take immediate action and limit the amounts released, and thus reduce the possible consequences. With the systems routinely used for the detection of any containment leaks from pipelines it can be particularly difficult to detect losses that are below the tolerance limits of the installed measurement systems, but are nonetheless able to cause extensive environmental damage of great economic significance.
These issues give rise to the idea of using the SAPR (Remote Piloting Aircraft System) for monitoring pipelines, both underground and above ground, used for the conveying of liquid hydrocarbon products. The use of spectral analyses, combined with RGB input, allows the detecting of possible irregularities due to leakages occurring along the pipelines. The acquisition of multispectral digital images makes it possible to identify possible pools of petroleum hydrocarbons and, in certain cases, also the possible infiltration into the soil. The acquisition of digital images in the visible spectrum allows the determination, through the comparison of successive scans, of any unexpected changes in the morphology of the soil to be subjected to further investigation.
This article illustrates a technologically-advanced, economical and reliable solution, based on the use of drones, for the detection of smaller-sized leaks due to internal/external causes or to illegal removals by third parties, with limited costs, reduced times and excellent performance, also in comparison to other similar monitoring techniques. Key words: Drone, Pipeline, Photogrammetry, Thermometric, Spectrometric

GIUSEPPE RAMALLI, MARCELLO GIOVANI, FABRIZIO PACCHIACUCCHI, MATTIA MANNESCHI
106
INTRODUCTION The problems Pipeline networks normally have many branches and can be built in sections
of varying length, even reaching hundreds (or even thousands) of kilometers. They are built mainly in one of two ways: either above ground or buried underground. At present the extension of pipeline networks is continuously increasing; in the world, according to data provided by the CIA (Central Intelligence Agency) in 2013, it totaled 3•106 km worldwide (C.I.A., 2013). As for Italy, in 2013 there were 20,223 km of gas pipelines, 1393 km of pipelines for crude oil and 1574 km of pipelines for refined products.
The safety and the protection of all pipelines is important both for the system in itself and for the people and the surrounding environment, i.e. the targets that can be damaged by possible leaks. In order to ensure safety it is essential to keep the pipeline in excellent condition through regular maintenance, so as to prevent the aging of the components and their wear. Despite continuous and effective maintenance, the possibility of a leak cannot be eliminated, since not all causes of leakage can be detected in advance. Leaks from the pipeline can occur due to various causes, such as earthquakes or slippage of the soil (Gómez and Green, 2015), but also due to accidental hot taps or external actions by third parties.
A wide variety of consequences may occur from a leak, and these depend on various parameters, such as the temperature and pressure of the line, the diameter of the leak hole, the location of the pipe and the type of fluid carried. Large spills of fluid can lead to significant scenarios of fire, explosion and spreading, with consequences for the environment and humans. Small spills, however, may be more insidious, being difficult to detect since they do not involve a disruption of the soil in the case of buried pipelines or the formation of pools of liquid on the surface. The failure to recognize a leak allows the diffusion of the liquid hydrocarbon into the ground all the way to the aquifer, resulting in pollution of the subsoil even at great distances from the leak point. In most cases the current instrumental monitoring technologies do not allow the identification of small leaks (or cracking) without interrupting the pipeline transport.
Current monitoring methods Widely differing methods are currently used for the monitoring and
surveillance of both gas and oil pipelines. The oldest method still in use is visual inspection carried out by “walkers,”
i.e. contract employees with pipeline management companies. Walkers have the job of patrolling predefined areas to detect any leaks, inspecting the wells, although in general they are not able to work on any leaks. The main limitation is that it may be difficult to detect small leaks through visual/olfactory inspections, if the pipe is buried and there is no surfacing. Another limitation of inspections is that they are carried out according to a pre-established pattern based mainly on the statistical analysis of the accessible points that have higher probability of loss; thus there are areas that are never inspected.

PIPELINE MONITORING WITH DRONES
107
The pressure monitoring method is based on the use of a series of pressure taps placed at pre-established distances along the pipeline, in order to monitor the trend of the pressure along the line. Through the interpolation of the point pressure values it is possible to extrapolate a continuous pressure trend with regard to the length of the pipe. If a leak occurs, there will be a deviation from the expected pressure trend. The advantage of pressure monitoring is that it allows one to identify the section where the leak is. The electronic equipment sends signals continuously to the control panel, so the trend of the pipeline parameters can be checked moment by moment. The main limitation is definitely the cost, given the high number of measuring instruments and need for wiring all along the pipeline. An additional limit is that of the presence of leaks that are not detected by the instrumentation; small leaks, i.e. those that have a flow rate less than or equal to 2% of the transported flow, and which can create variations in pressure not detectable by the instruments (P & G Journal, 2014) (Offshore Technology Report, 1996).
Leakage monitoring can also be done using ultrasonic flow detectors. The principle of operation behind these detectors is based on the contribution that a moving fluid makes to a sound wave, ultrasonic in particular, and thus the instruments that make use of this phenomenon are called transit time ultrasonic flow-meters. In this case as well, the limits of such meters are the impossibility of detecting small leaks and the costs connected with the installation of the system.
Pipeline monitoring can be done with the determining of the mass flow at different points along the line and the measuring of the flow rate differentials. To do this, detection systems based on the Coriolis effect are used; the mass flow rate should remain constant all along the line, and thus any variation indicates the presence of a leak. The monitoring of the flow rate based on the Coriolis effect is capable of detecting small leaks not easily detected by the preceding systems, although it still has detection limitations. The costs for a control system distributed into sections on the pipeline and its maintenance are decidedly high.
Another leakage monitoring method involves the use of conducting wires along the pipeline. The principle of operation is based on the fact that a mixture of hydrocarbons is an excellent solvent; if there is a leakage of the hydrocarbon mixture, it acts as a solvent for the cable jacket, usually made from plastic material, causing the conductors inside to short-circuit. Detecting the absence of an electric signal in a given portion of wire, it is possible to locate the leak. The main advantage of monitoring via conducting wires is the ability to detect both leaks and fires. The main limitation consists in the difficulty of detecting small leaks, given that to have total coverage of the pipeline it is necessary to wrap the cables along the entire circumference of the pipe, and this entails a very high cost, in consideration of the great length of the pipes.
The monitoring of pipelines, especially those not buried and of considerable length, can be done by flying over them by helicopter or airplane. The capacity of these aircraft allows the transport of a number of instruments, such as the DIAL (Differential Absorption LiDAR) instrument, which uses the radiation emanated to determine the presence and concentration of gas, or ground-penetrating radar to analyze the structure underlying the surface. The advantage of this method is the
GIUSEPPE RAMALLI, MARCELLO GIOVANI, FABRIZIO PACCHIACUCCHI, MATTIA MANNESCHI
108
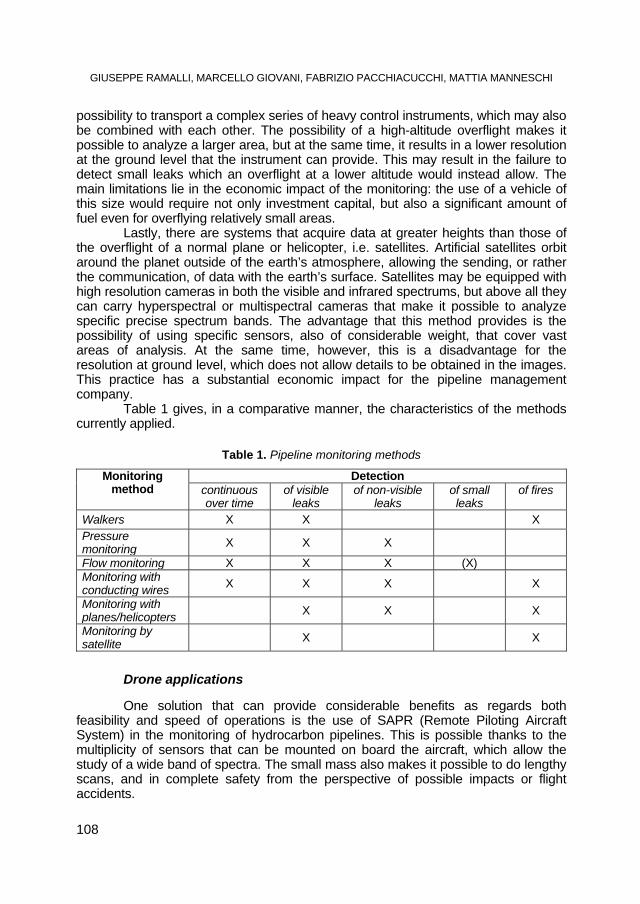
possibility to transport a complex series of heavy control instruments, which may also be combined with each other. The possibility of a high-altitude overflight makes it possible to analyze a larger area, but at the same time, it results in a lower resolution at the ground level that the instrument can provide. This may result in the failure to detect small leaks which an overflight at a lower altitude would instead allow. The main limitations lie in the economic impact of the monitoring: the use of a vehicle of this size would require not only investment capital, but also a significant amount of fuel even for overflying relatively small areas.
Lastly, there are systems that acquire data at greater heights than those of the overflight of a normal plane or helicopter, i.e. satellites. Artificial satellites orbit around the planet outside of the earth’s atmosphere, allowing the sending, or rather the communication, of data with the earth’s surface. Satellites may be equipped with high resolution cameras in both the visible and infrared spectrums, but above all they can carry hyperspectral or multispectral cameras that make it possible to analyze specific precise spectrum bands. The advantage that this method provides is the possibility of using specific sensors, also of considerable weight, that cover vast areas of analysis. At the same time, however, this is a disadvantage for the resolution at ground level, which does not allow details to be obtained in the images. This practice has a substantial economic impact for the pipeline management company.
Table 1 gives, in a comparative manner, the characteristics of the methods currently applied.
Table 1. Pipeline monitoring methods
Monitoring method
Detectioncontinuous over time
of visible leaks
of non-visible leaks
of small leaks
of fires
Walkers X X X Pressure monitoring X X X
Flow monitoring X X X (X) Monitoring with conducting wires
X X X X
Monitoring with planes/helicopters
X X X
Monitoring by satellite
X X
Drone applications One solution that can provide considerable benefits as regards both
feasibility and speed of operations is the use of SAPR (Remote Piloting Aircraft System) in the monitoring of hydrocarbon pipelines. This is possible thanks to the multiplicity of sensors that can be mounted on board the aircraft, which allow the study of a wide band of spectra. The small mass also makes it possible to do lengthy scans, and in complete safety from the perspective of possible impacts or flight accidents.

PIPELINE MONITORING WITH DRONES
109
Pipelines, like any transport line, extend for several kilometers. In some cases the areas they cross are hard to reach because they are located in rural areas or on the edge of wooded areas: this can make inspections, even if only visual, extremely difficult for operators of the pipeline management company. The use of drones makes it possible to overcome this limitation, because the operator controls the flight of the vehicle from his station, positioning it over the area of interest in order to obtain the required data. When monitoring large areas it is usually better to use fixed-wing drones, so as to allow a longer flight time and a greater monitoring efficiency. With simple direct visual inspections, without subsequent processing of the data collected, the camera placed on the drone transmits images directly to a video terminal, where a technician checks the state of the system being analyzed.
For inspections that require more detailed and specific analyses, rotorcraft drones are preferable for their greater capacity for movement in restricted areas.
The leakage of liquids and gases from pipes, which originate small but continuous leaks difficult to detect with the naked eye or by fixed instrumentation, propagates into the environment. When accumulating, these leaks can cause fire or explosion scenarios that are dangerous for operators who are in the area. Executing a flyby, rotorcraft drones equipped with appropriate instruments are able to identify small drops on the surface of the pipe or small clouds of gas, as if the operator were performing an analysis on site using the instrument on the drone, but in conditions of absolute safety. Fixed-wing drones, furthermore, travel at a height that makes it possible to avoid the possible igniting of flammable clouds by the drone itself.
The deliberate actions by third parties mainly concern the theft of the transported product, generally from underground pipelines, where it is easier to hide the illegal branch by means of excavations, later covered, with considerable economic damage to the operators of the pipelines and serious environmental risks caused by probable leaks, given the poor quality of the illegal branches. The photogrammetric technique, which can be done by means of aerial filming or multiple photos from the aircraft, allows the obtaining of an orthophoto, either flat or solid, of the area around the pipeline with a very high ground-level resolution. By comparing the images from inspections carried out at different times, it is possible to spot the differences between the images themselves and identify possible human intervention in the surrounding area of the pipeline. In any case the presence of unauthorized vehicles in the area or unauthorized intervention is possible.
THE PROPOSAL
The high-performance solution, designed for monitoring pipelines leaks, regards the use of SAPR combined with software for the management and reprocessing of the raw data. The possibility of installing a variety of sensor types, both individually and in combination, opens up a vast field among the activities that can be carried out. The technological development makes it possible to combine the traditional overflight for visual inspection with actions aimed at the search for specific irregularities in the analysis area. The action involves two types of machines:

GIUSEPPE RAMALLI, MARCELLO GIOVANI, FABRIZIO PACCHIACUCCHI, MATTIA MANNESCHI
110
• Fixed-wing SAPR, glider drones that allow surveying of very wide areas, in relation to a higher flying speed and lower battery consumption;
• Rotorcraft SAPR, multi-rotor drones that make it possible to obtain maximum detail for medium/small-sized areas, so as to allow close scans of non-buried pipelines.
These two aircraft can be equipped, either individually or in combination, with two types of sensors:
• RGB camera, i.e. a normal photo/video camera, for obtaining images in the visible spectrum;
• spectral cameras, which allow the analyzing of specific spectra, both visible and infrared.
These may be accompanied by thermo-graphic cameras, which allow the analyzing of the far infrared (IR) spectrum.
The Drone
The aircraft primarily used for these actions is the fixed-wing type, which has the following characteristics:
• Dimensions: wingspan 1300 mm (figure 1); • Mass: <2 kg, variable from 1200 to 1300 g; • Payload: >400g; • Batteries: lithium polymer; • Endurance: approx. 40 minutes; • Cruising speed: 21 km/h (6m/s); • Maximum speed: up to 53.6 km/h (14.9m/s); • Minimum speed: 6.1 to 6.5 km/h (1.7 to 1.8m/s).
Fig. 1. The drone considered

PIPELINE MONITORING WITH DRONES
111
PROPOSED DETECTION TECHNIQUES AND PROCEDURES
Photogrammetry Photogrammetry is a surveying technique based on the central perspective
model, which makes it possible to obtain three-dimensional metric information on the shape and position of the object being analyzed, by means of a system that does not require physical contact with the object. The processing is done through the acquisition of photographic images.
The use of the photogrammetric technique thus allows one to identify irregularities in the morphology of the ground, by analyzing the chromatic variation and the variation of the relief through the use of the technique and the aid of suitable software. The result of the method is a KMZ file (a compressed version of the KML -Keyhole Markup Language - file) or GIS file, designed for managing geospatial data, in order to geographically locate the irregularities identified. This technique is thus applicable to both buried and above-ground pipelines that transport either liquid compounds or gas, in order to identify possible interventions (illegal or not) by third parties.
The sensors, or payload, required are the traditional compact cameras for capturing images and/or videos, or which make it possible to obtain a representation of the visible spectrum. The interaction between the sensor and the lens mounted and the flight altitude are fundamental for the determining of the GSD (Ground Sample Distance), which provides the resolution of the picture relative to the ground, i.e. it indicates how many centimeters at ground level are represented by one pixel. The resolution is expressed in cm/px (www.pix4d.com, 2015).
The cameras must have the least possible mass, so as not to require a large-size drone and to allow long flight duration. In fact, a smaller payload is reflected in a reduction of the power required by the drone rotors, which consequently increases the life of the batteries. The camera size is a crucial aspect for fixed-wing drones, since the camera must be inserted inside the body of the aircraft.
The software used for processing allows one to obtain, as main products, two-dimensional and three-dimensional reconstructions of the earth’s surface. These reconstructions are respectively called flat and solid orthophotos. An orthophoto is a photograph that has been georeferenced and corrected from a geometrical perspective, so as to have a uniform scale; the photo can be considered the equivalent of a map and can be used for measurements (Ciaramella, 2008).
The procedure is based on the execution of a series of overflights, with the acquisition of georeferenced images of the area around the pipeline. The comparison between the data obtained in two successive overflights allows the identifying of possible illegal actions.
The algorithm uses as input the software output, i.e. the 3D and 2D representations of the surface, in the form of TIFF files, with an RGB color scale, and LAS files. The processing steps can be grouped as follows.
• Acquisition of the first overflight and georeferencing files, by means of vectors, of the pixels constituting the image.

GIUSEPPE RAMALLI, MARCELLO GIOVANI, FABRIZIO PACCHIACUCCHI, MATTIA MANNESCHI
112
• Acquisition of the second overflight files and georeferencing, by means of vectors, of the pixels constituting the image.
• Uniforming of the color scheme of the two images, in order to reduce the background noise resulting from the mathematical subtraction of the image levels, and the creating of color maps, according to the color difference.
• Comparison of the elevation with the corresponding latitude and longitude, creating a colored map.
• Combination of the two colored maps. These steps were tested in a practical test, carried out over the Etruria Volo
srl experimentation field. The test involved two overflights: • the first done before creating variations on the ground; • the second after having created holes having the dimensions given
in table 2.
Table 2. Hole characteristics
Type of hole Length (mm) Width (mm)
Depth (mm)
Number
Small 200 300 50 2 Medium 400 600 50 4 Large 500 900 50 2 Deep 500 900 500 1
The results obtained are shown in figure 2, taking by the outgoing KML.
Fig. 2. Showing of variations on the KML file

PIPELINE MONITORING WITH DRONES
113
It can be seen from the images obtained how the “largest” size excavation (highlighted in white in the image) is easily visible, while the smaller ones are less evident. The size of the area removed, also in the case shown, is less than 0.5 m2, which is not overly large. This implies a quite good potential for the proposed technique.
Spectrometric The term spectrometry indicates the set of measurement methods and
techniques carried out using spectrometers, which are instruments that measure the electromagnetic spectrum as a function of wavelength. Spectrometry, which makes it possible in our specific case to analyze the infrared spectrum, is based on the interaction that every single molecule has with electromagnetic radiation: when radiation strikes a substance or material, part of it can pass through it, another part is absorbed by the substance, and part of it is reflected.
The instruments considered for spectrometric analysis do not emit radiation but receive it, thus they are called passive; they receive the radiation that passes through the test substance in the case of a gas, and the reflected radiation in the case of a liquid/solid.
The sensors used are specific to the activity to be performed. A main macro division of the sensors is carried out depending on the bands and are divided into multispectral and hyper-spectral. A multispectral sensor is an instrument that records the intensity of the energy reflected by objects such as the earth’s surface, at different wavelengths of the electromagnetic radiation between the visible and the infrared. The bands taken into account by the instrument are wide, distant from each other and few in number. Reprocessing the reflectance values measured by the instrument at the precise bands through specific indexes, it is possible to analyze the object or surface from which the radiation comes. A hyper-spectral sensor divides the electromagnetic radiation reflected by the object being analyzed into a series of very narrow bands and in large quantities. The analysis spectrum includes ultraviolet, visible and infrared, depending on the type of semiconductor used in the sensor (Masini, 2013).
The result provided by the instrument is a visual representation of the area surveyed, showing the variation of the intensity of the reflected radiation having a wavelength belonging to that band: a greater intensity will be represented by a lighter pixel. Greater radiation striking the element constituting the sensor corresponds to a strong signal sent from the element, represented by a lighter color. Thus different images are obtained, where each represents the intensity of the specific band. Using algorithms (indexes) it is possible to trace the images to a single map, where a color is associated to specific index values. The use of appropriate indices makes it possible to highlight, or differentiate, characteristics of the areas being analyzed.
The spectrometric method is based on the use of the spectrometric technique, employing both multispectral and hyper-spectral systems for the detection and identification of leaks of hydrocarbons in the liquid or gaseous state. The results of the method depend on the instrument used, which may make a simple video or produce a KMZ or GIS file, so as to manage geospatial data in order to geographically locate the irregularities detected. Therefore this technique is

GIUSEPPE RAMALLI, MARCELLO GIOVANI, FABRIZIO PACCHIACUCCHI, MATTIA MANNESCHI
114
applicable for buried and above-ground pipelines carrying either liquid or gaseous compounds, in order to identify possible leakages.
The use of such instrumentation, however, allows one to obtain a much smaller quantity of information compared to hyper-spectral instruments.
The usable spectrum is the IR that is reflected by the objects, including at wavelengths close to the visible spectrum, in the NIR - Near Infra Red (800-1700nm) region; in fact liquid hydrocarbons have a specific spectrum in the NIR region, as is pointed out by figure 3, in which the reflectance spectra of two mixtures of hydrocarbons are shown. The vertical line indicates the boundary between the visible spectrum and the infrared spectrum.
Fig. 3. Spectrum of two hydrocarbon mixtures (Headwall – www.headwallphotonics.com)
Figure 4 instead shows the reflectance of the soil, which is dependent on the percentage of moisture it contains.
Fig. 4. Spectrum of the soil (Headwall – www.headwallphotonics.com)

PIPELINE MONITORING WITH DRONES
115
The comparison between the spectra shows a very different response of the soil with respect to the hydrocarbon mixtures; therefore, using specific indexes it is possible to construct indexed maps for identifying hydrocarbon with respect to the surrounding soil. More specifically, it can be seen that the presence of hydrocarbons has an influence on the NIR band, while the hydrocarbon behavior is similar to that of vegetation, although the response differs in the blue and green bands. These considerations were used to develop an index shown in Equation 1.
GNIRIHC = , (1)
where IHC – index; NIR – intensity of the near infrared band; G – intensity of the green band.
According to that described, the sensor considered is a multispectral three-band sensor, with green (G), blue (B) and infrared (NIR).
The procedure conceived is based on the making of periodic overflights along the pipeline, with the acquisition of geo-referenced images of the area adjacent to the pipeline. The immediate analysis of the data obtained allows the detecting of possible leaks.
The algorithm uses the 2D representation of the surface as input in the form of TIFF files. The processing stages can be grouped as follows.
• Division of the data into the three levels of NIR-G-B bands and the creation of the matrix of the index considered.
• Color representation of the matrix developed earlier. • Graphic representation of the indexed map obtained.
The flow of the operations was subjected to a practical test, carried out at the Etruria Volo experimentation field. The test is based on an overflight, where watertight hydrocarbon containers with the bottom covered with earth had been positioned. Table 3 shows the size of the pools and the hydrocarbon mixtures considered.
Table 3. Pool characteristics.
Pool Mixture Type Length (mm) Width (mm) Small Gasoline Surface film 200 300
Diesel Surface film Medium Gasoline Surface film 400 600
Diesel Surface film Gasoline Soaked soil
Diesel Soaked soil Large Gasoline Surface film 500 900
Diesel Surface film
The sensor used is a modified camera: in the place of the filter that does not allow infrared to pass a red-block filter was positioned, so as to eliminate the absorption of red.
The results obtained are shown in figure 5.

GIUSEPPE RAMALLI, MARCELLO GIOVANI, FABRIZIO PACCHIACUCCHI, MATTIA MANNESCHI
116
Fig. 5. Results of the hydrocarbons search
The images obtained show how the “larger” pools are more easily seen, while the smaller ones are less evident. The extension of the film, in this case as in the previous one, is less than 0.5 m2, which is still not overly large. This implies a quite good potential for the proposed technique. One disadvantage in the functioning of this technique is the necessary presence of sunlight, as the different radiation reflected from the hydrocarbon film with regard to the surrounding soil is being analyzed. This limit is always found in any instrument that analyzes reflected radiation, such as a classic photo camera.
Thermometric The use of a thermo-graphic camera, as mentioned previously, makes it
possible to analyze the trend of the far IR spectrum (10-12μm) and, therefore, the trend of the surface temperatures of the bodies being examined. It also allows the identification of hydrocarbon gases that interact with the infrared spectrum, which, in this case, are methane, LPG and gasoline vapors. This can be easily understood by analyzing the absorption spectrum of these substances, as shown in figure 6.
Fig. 6. Spectrum in the infrared region corresponding to methane
(NIRST – www.webbook.nist.gov).
PIPELINE MONITORING WITH DRONES
117
The highest peak corresponds precisely to the area of interest in the LWIR (Long Wavelengths Infra Red) thermo-graphic cameras, implying a visibility during the use of the camera for the photographing of the area.
CONCLUSIONS
The applications of the proposed SAPR, which can apply the detection
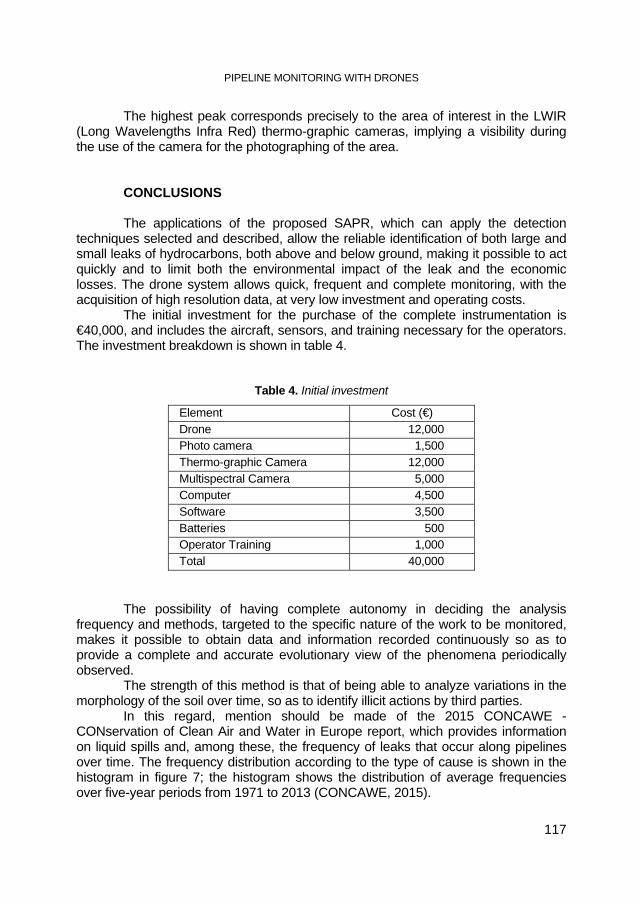
techniques selected and described, allow the reliable identification of both large and small leaks of hydrocarbons, both above and below ground, making it possible to act quickly and to limit both the environmental impact of the leak and the economic losses. The drone system allows quick, frequent and complete monitoring, with the acquisition of high resolution data, at very low investment and operating costs.
The initial investment for the purchase of the complete instrumentation is €40,000, and includes the aircraft, sensors, and training necessary for the operators. The investment breakdown is shown in table 4.
Table 4. Initial investment
Element Cost (€) Drone 12,000 Photo camera 1,500 Thermo-graphic Camera 12,000 Multispectral Camera 5,000 Computer 4,500 Software 3,500 Batteries 500 Operator Training 1,000 Total 40,000
The possibility of having complete autonomy in deciding the analysis
frequency and methods, targeted to the specific nature of the work to be monitored, makes it possible to obtain data and information recorded continuously so as to provide a complete and accurate evolutionary view of the phenomena periodically observed.
The strength of this method is that of being able to analyze variations in the morphology of the soil over time, so as to identify illicit actions by third parties.
In this regard, mention should be made of the 2015 CONCAWE - CONservation of Clean Air and Water in Europe report, which provides information on liquid spills and, among these, the frequency of leaks that occur along pipelines over time. The frequency distribution according to the type of cause is shown in the histogram in figure 7; the histogram shows the distribution of average frequencies over five-year periods from 1971 to 2013 (CONCAWE, 2015).

GIUSEPPE RAMALLI, MARCELLO GIOVANI, FABRIZIO PACCHIACUCCHI, MATTIA MANNESCHI
118
Fig. 7. Histogram of the distribution of average frequencies according to cause (CONCAWE, 2015)
The figure shows how activities by third parties is the dominant cause over
time. In particular, illegal removals over time have acquired increasingly greater weight. In confirmation of the above, in 2013 the value of thefts came to 50% of the annual leakage rate. The possibility of taking prompt action against this illicit activity therefore appears to be a considerable advantage for the manager of the pipeline.
REFERENCES Ciaramella G., 2008, La tecnica fotogrammetrica d’archivio per l’analisi delle variazioni multi
temporali superficiali di corpi franosi, University of Bologna. Gómez C., Green D.R., 2015, Small-Scale Airborne Platforms for Oil and Gas Pipeline
Monitoring and Mapping, AICSM – UCEMM – University of Aberdeen. Masini F., 2013, Relizzazione di una applicazione per l’analisi di immagini iperspettrali,
University of Bologna. C.I.A. (Central Intelligence Agency), 2013. www.cia.gov/library/publications/the-
worldfactbook/fields/2117.html CONCAWE, 2015, Performance of European cross-country oil pipelines (CONservation of
Clean Air and Water in Europe), statistical summary of reported spillages in 2013 and since 1971.
HSE, 1996, Pipeline Leak Detection Study – Offshore Technology Report, Heath & Safety Executive.
P & G Journal, 2014, www.pipelineandgasjournal.com. Pix4D mapper, 2015, www.pix4d.com.