Pipeline Maintenance Best Practices - US EPA · PDF filePipeline Maintenance Best Practices...
44
Pipeline Maintenance Best Practices Lessons Learned from the Natural Gas STAR Program SGA Environmental Round Table Charlotte, North Carolina June 25 - 27, 2008 epa.gov/gasstar
Transcript of Pipeline Maintenance Best Practices - US EPA · PDF filePipeline Maintenance Best Practices...
Pipeline Maintenance Best Practices
Lessons Learned from the Natural Gas STAR Program
SGA Environmental Round TableCharlotte, North Carolina
June 25 -
27, 2008
epa.gov/gasstar
1
Pipeline Maintenance Agenda
Methane LossesWhat are the sources of emissions?How much methane is emitted?
Methane Recovery Hot TapsPipeline PumpdownComposite WrapsAdditional Partner Reported Opportunities
Discussion
2
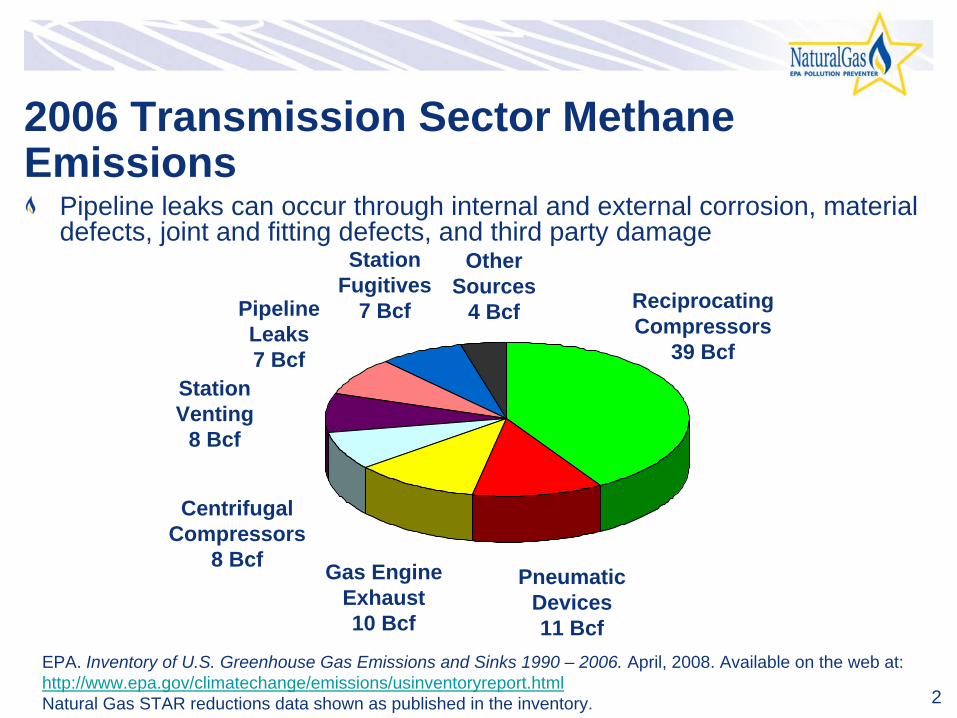
2006 Transmission Sector Methane Emissions
Pipeline leaks can occur through internal and external corrosion, material defects, joint and fitting defects, and third party damage
EPA. Inventory of U.S. Greenhouse Gas Emissions and Sinks 1990 –
2006. April, 2008. Available on the web at: http://www.epa.gov/climatechange/emissions/usinventoryreport.htmlNatural Gas STAR reductions data shown as published in the inventory.
Pneumatic Devices11 Bcf
CentrifugalCompressors
8 Bcf
Pipeline Leaks7 Bcf
Gas Engine Exhaust10 Bcf
ReciprocatingCompressors
39 BcfStation Venting
8 Bcf
Other Sources
4 Bcf
Station Fugitives
7 Bcf
3
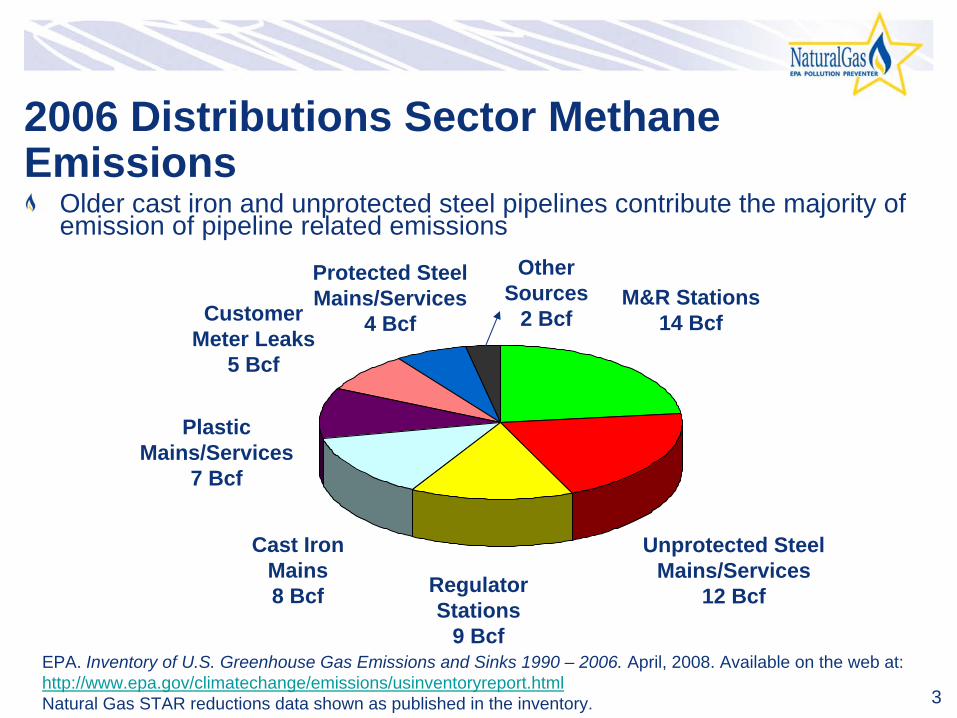
2006 Distributions Sector Methane Emissions
Older cast iron and unprotected steel pipelines contribute the majority of emission of pipeline related emissions
EPA. Inventory of U.S. Greenhouse Gas Emissions and Sinks 1990 –
2006. April, 2008. Available on the web at: http://www.epa.gov/climatechange/emissions/usinventoryreport.htmlNatural Gas STAR reductions data shown as published in the inventory.
Unprotected SteelMains/Services
12 Bcf
Cast IronMains8 Bcf
CustomerMeter Leaks
5 Bcf
Regulator Stations
9 Bcf
M&R Stations 14 Bcf
PlasticMains/Services
7 Bcf
Other Sources
2 Bcf
Protected SteelMains/Services
4 Bcf
4
What is the problem with current practices?Methane gas leaks are invisible, unregulated, and go unnoticedMethane vented in preparation for pipeline maintenance/new connectionsSmallest possible linear section of pipeline is blocked in and depressurized to the atmosphere“Hot work”
may require purging pipeline with inert gas
These practices results in methane emissionsLoss of SalesService disruption and customer inconvenienceCosts of evacuating the existing piping system
5
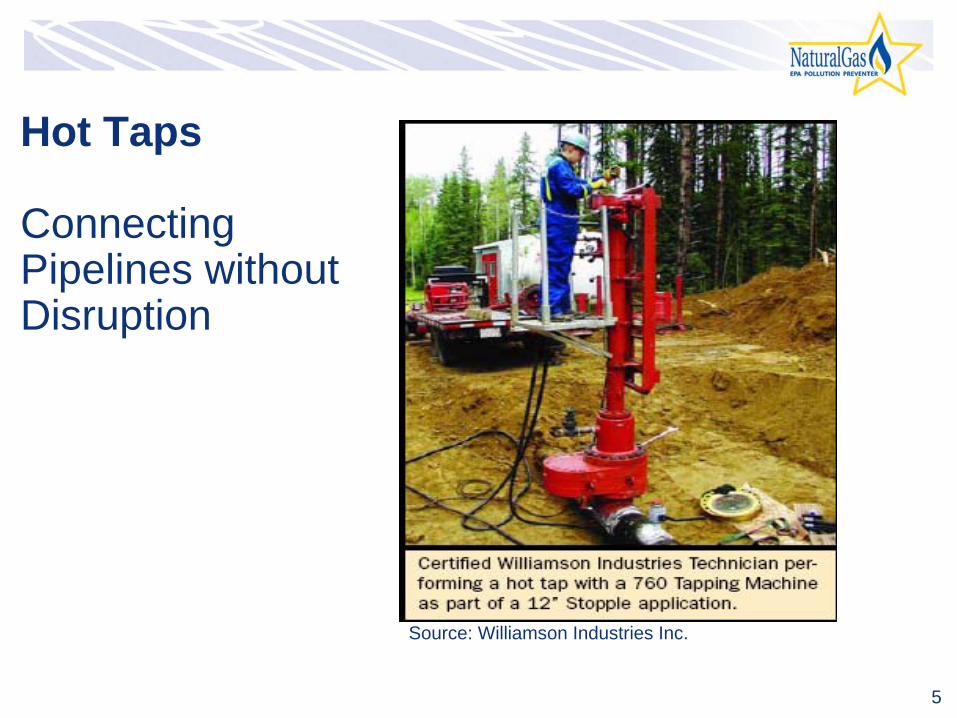
Hot Taps
Connecting Pipelines without
Disruption
Source: Williamson Industries Inc.
6
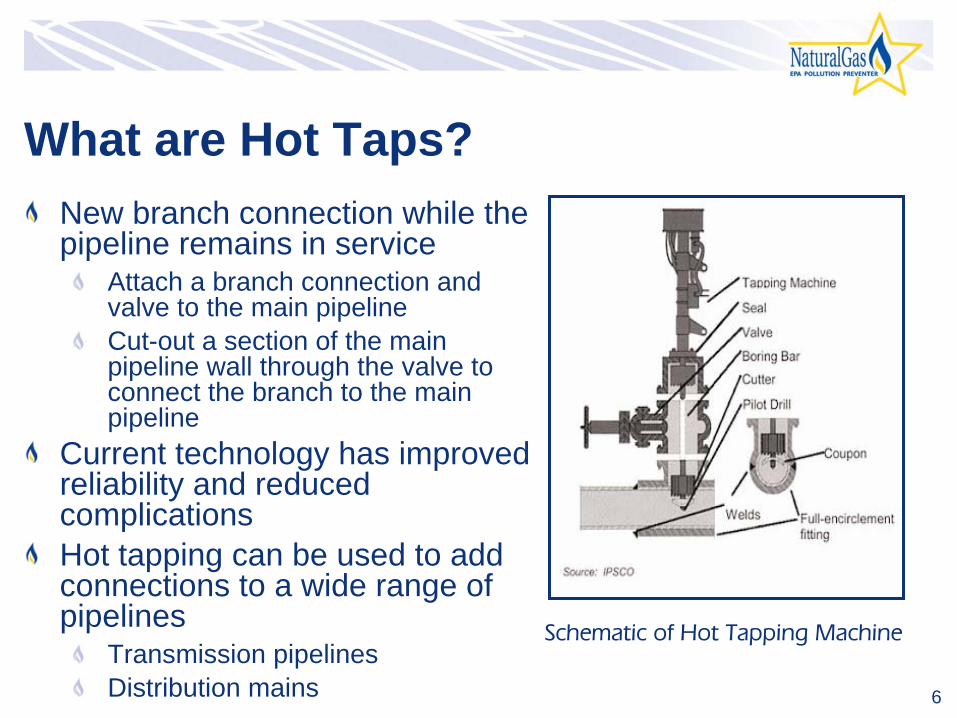
What are Hot Taps?New branch connection while the pipeline remains in service
Attach a branch connection and valve to the main pipelineCut-out a section of the main pipeline wall through the valve to connect the branch to the main pipeline
Current technology has improved reliability and reduced complicationsHot tapping can be used to add connections to a wide range of pipelines
Transmission pipelinesDistribution mains
Schematic of Hot Tapping Machine
7
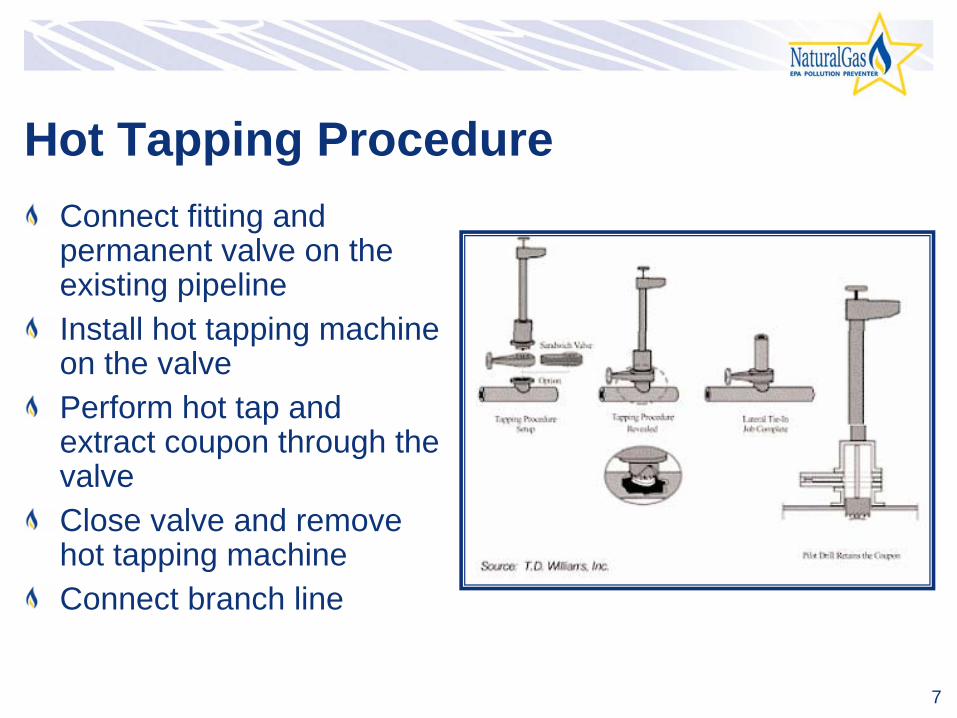
Hot Tapping ProcedureConnect fitting and permanent valve on the existing pipeline Install hot tapping machine on the valvePerform hot tap and extract coupon through the valveClose valve and remove hot tapping machineConnect branch line
8
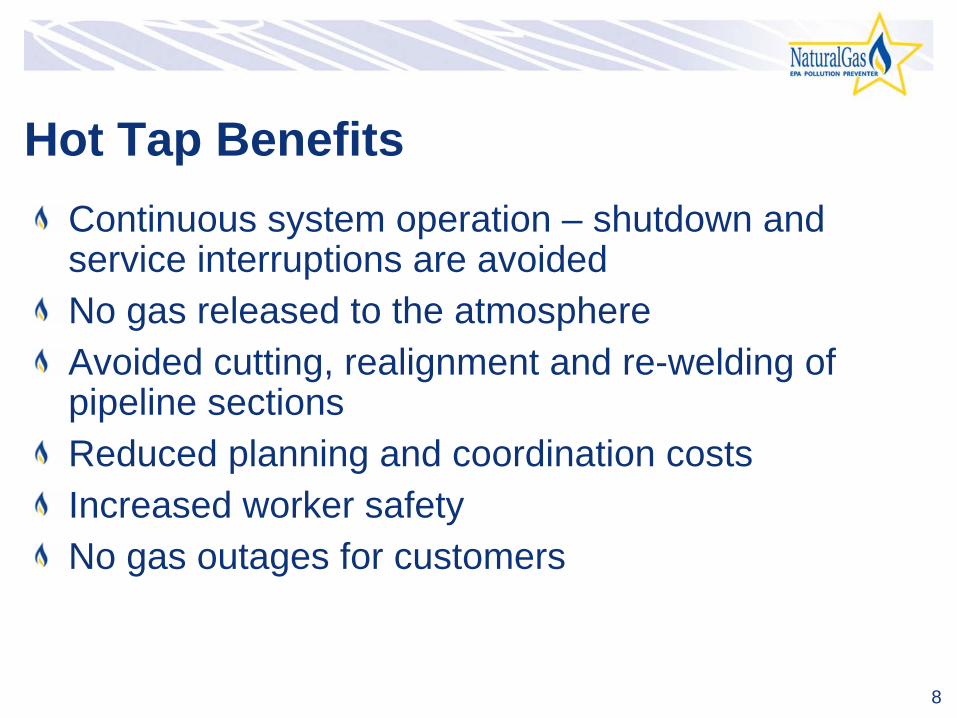
Hot Tap BenefitsContinuous system operation –
shutdown and
service interruptions are avoidedNo gas released to the atmosphereAvoided cutting, realignment and re-welding of pipeline sectionsReduced planning and coordination costsIncreased worker safetyNo gas outages for customers
9
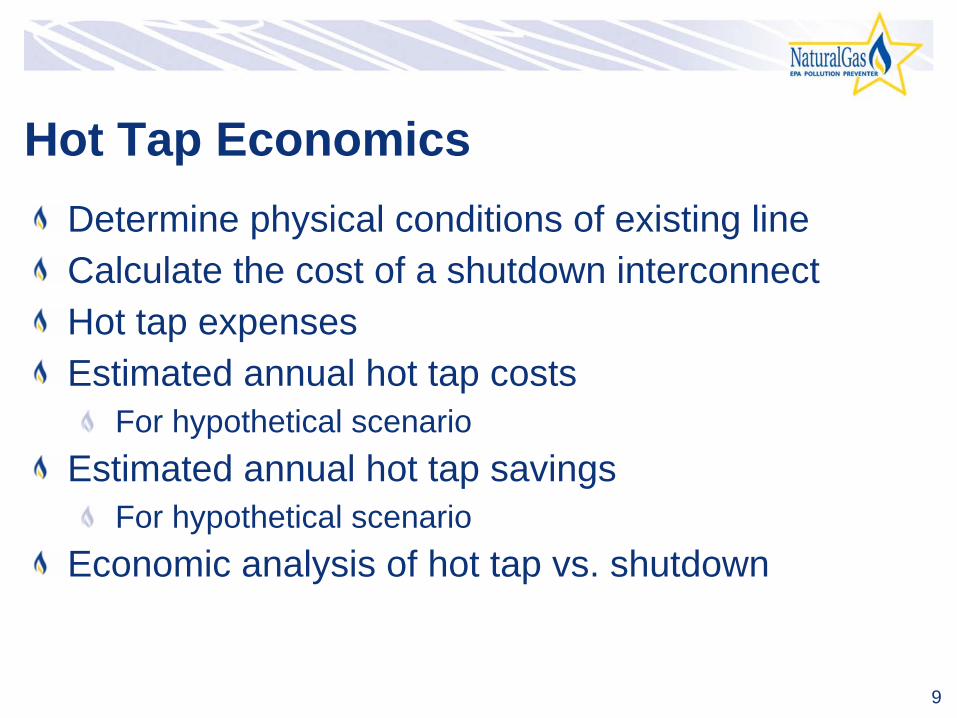
Hot Tap EconomicsDetermine physical conditions of existing line Calculate the cost of a shutdown interconnectHot tap expensesEstimated annual hot tap costs
For hypothetical scenarioEstimated annual hot tap savings
For hypothetical scenarioEconomic analysis of hot tap vs. shutdown
10
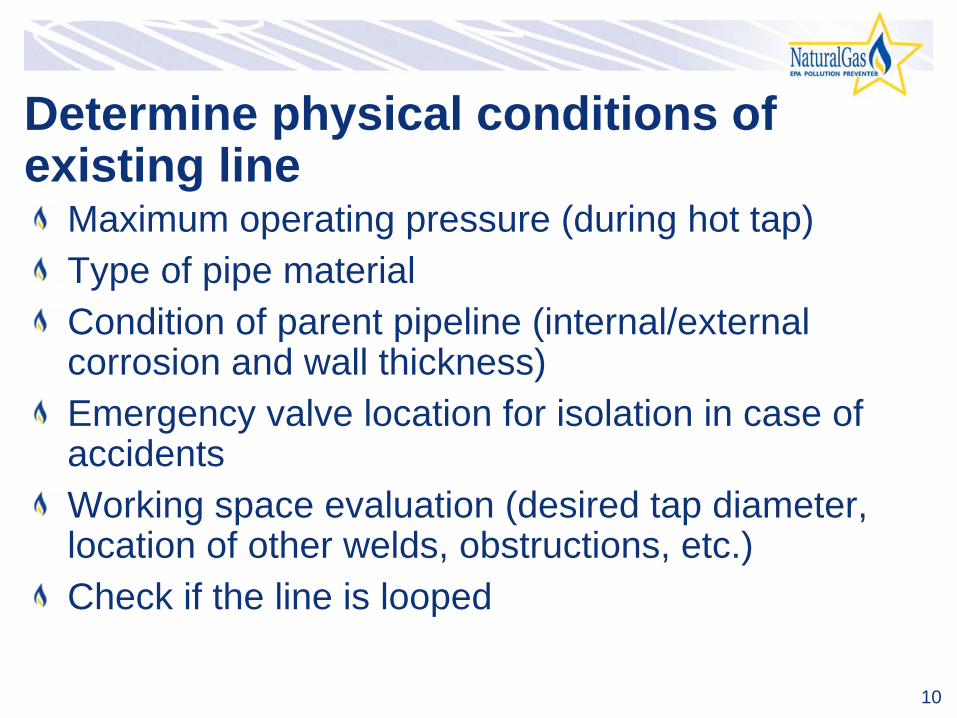
Determine physical conditions of existing line
Maximum operating pressure (during hot tap)Type of pipe material Condition of parent pipeline (internal/external corrosion and wall thickness)Emergency valve location for isolation in case of accidentsWorking space evaluation (desired tap diameter, location of other welds, obstructions, etc.)Check if the line is looped
11
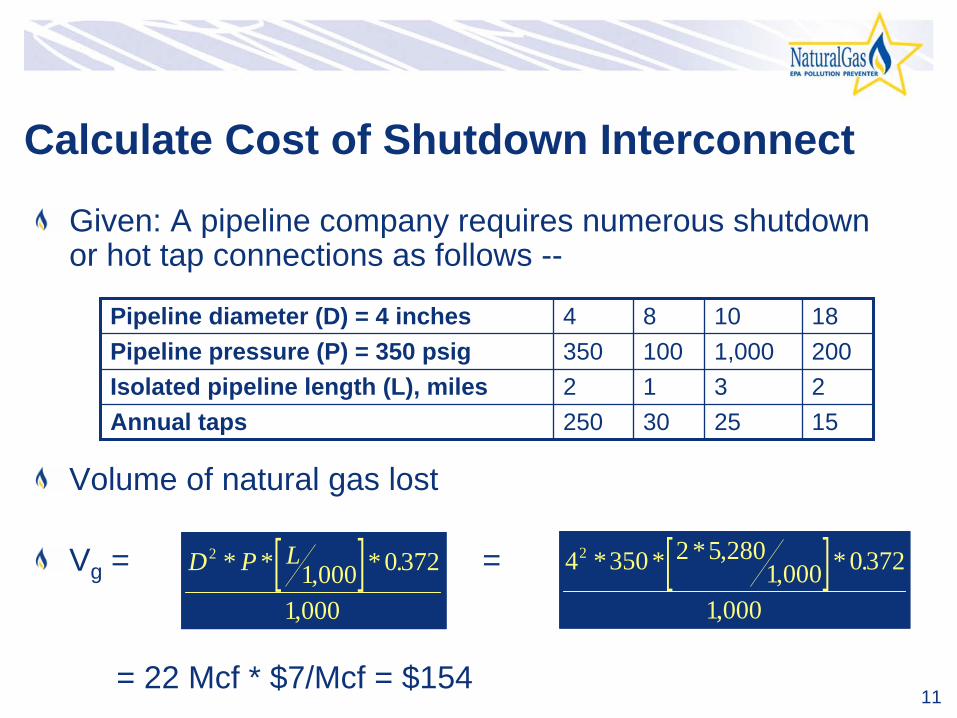
Calculate Cost of Shutdown Interconnect
Given: A pipeline company requires numerous shutdown or hot tap connections as follows --
Volume of natural gas lost
Vg
= =
= 22 Mcf * $7/Mcf = $154
Pipeline diameter (D) = 4 inches 4 8 10 18Pipeline pressure (P) = 350 psig 350 100 1,000 200Isolated pipeline length (L), miles 2 1 3 2Annual taps 250 30 25 15
[ ]D P L21 000 0372
1 000
* * , * .
,[ ]4 350 2 5 280
1 000 0372
1 000
2 * * * ,, * .
,
12
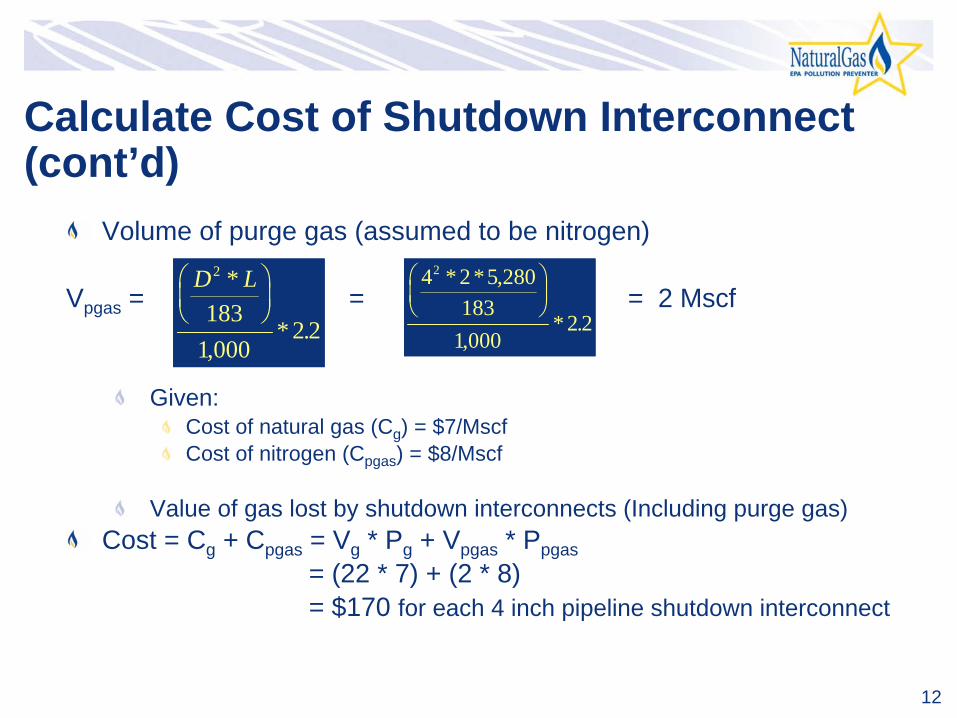
Calculate Cost of Shutdown Interconnect (cont’d)
Volume of purge gas (assumed to be nitrogen)
Vpgas
= = = 2 Mscf
Given:Cost of natural gas (Cg
) = $7/MscfCost of nitrogen (Cpgas
) = $8/Mscf
Value of gas lost by shutdown interconnects (Including purge gas)Cost = Cg
+ Cpgas
= Vg
* Pg
+ Vpgas
* Ppgas= (22 * 7) + (2 * 8)= $170 for each 4 inch pipeline shutdown interconnect
D L2
1831 000
2 2
*
,* .
⎛⎝⎜
⎞⎠⎟
4 2 5 280183
1 0002 2
2 * * ,
,* .
⎛⎝⎜
⎞⎠⎟
13
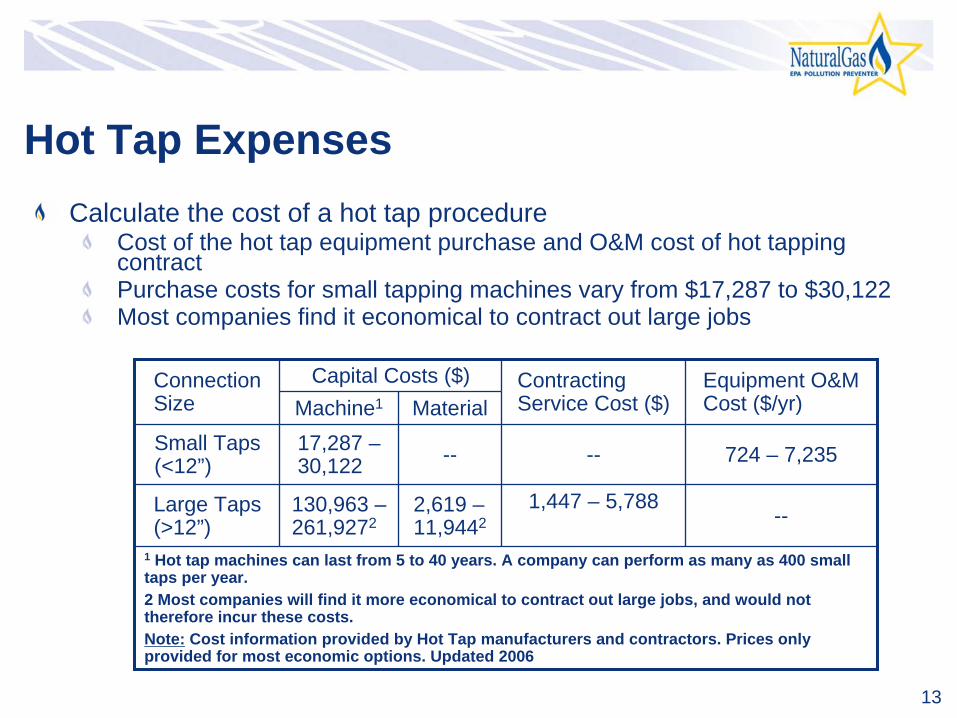
Hot Tap ExpensesCalculate the cost of a hot tap procedure
Cost of the hot tap equipment purchase and O&M cost of hot tapping contractPurchase costs for small tapping machines vary from $17,287 to $30,122Most companies find it economical to contract out large jobs
Connection Size
Capital Costs ($) Contracting Service Cost ($)
Equipment O&M Cost ($/yr)Machine1 Material
Small Taps (<12”)
17,287 –
30,122 -- -- 724 –
7,235
Large Taps (>12”)
130,963 –
261,9272
2,619 –
11,9442
1,447 –
5,788--
1
Hot tap machines can last from 5 to 40 years. A company can perform as many as 400 small taps per year.2 Most companies will find it more economical to contract out large jobs, and would not therefore incur these costs.Note:
Cost information provided by
Hot Tap manufacturers and contractors. Prices only provided for most economic options.
Updated 2006
14
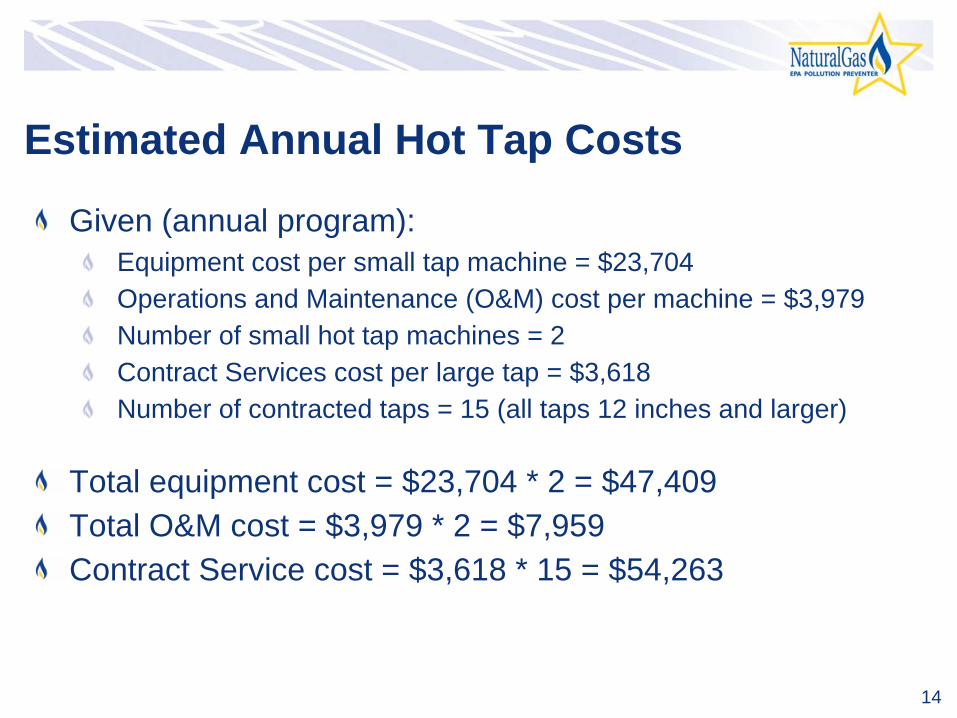
Estimated Annual Hot Tap Costs
Given (annual program):Equipment cost per small tap
machine = $23,704Operations and Maintenance (O&M) cost per machine = $3,979Number of small
hot tap machines = 2Contract Services cost per large
tap = $3,618Number of contracted taps = 15 (all taps 12 inches and larger)
Total equipment cost = $23,704 * 2 = $47,409Total O&M cost = $3,979 * 2 = $7,959Contract Service cost = $3,618 * 15 = $54,263
15
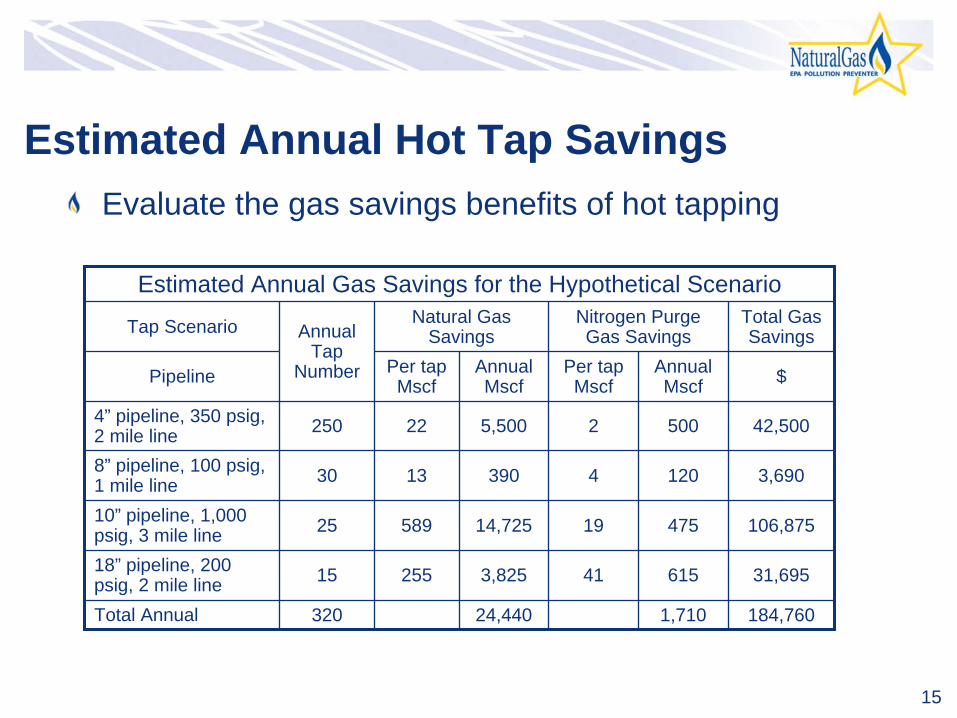
Estimated Annual Hot Tap SavingsEvaluate the gas savings benefits of hot tapping
Estimated Annual Gas Savings for the Hypothetical Scenario
Tap Scenario Annual Tap
Number
Natural Gas Savings
Nitrogen Purge Gas Savings
Total Gas Savings
Pipeline Per tap Mscf
Annual Mscf
Per tap Mscf
Annual Mscf $
4”
pipeline, 350 psig, 2 mile line 250 22 5,500 2 500 42,500
8”
pipeline, 100 psig, 1 mile line 30 13 390 4 120 3,690
10”
pipeline, 1,000 psig, 3 mile line 25 589 14,725 19 475 106,875
18”
pipeline, 200 psig, 2 mile line 15 255 3,825 41 615 31,695
Total Annual 320 24,440 1,710 184,760
16
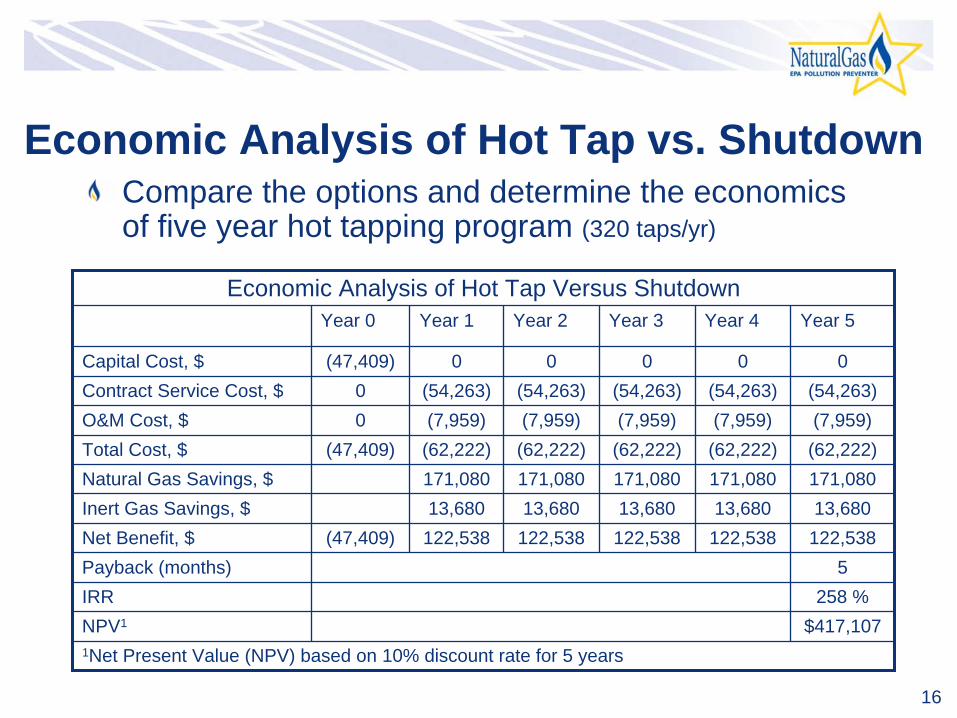
Economic Analysis of Hot Tap vs. ShutdownCompare the options and determine the economics of five year
hot tapping program (320 taps/yr)
Economic Analysis of Hot Tap Versus ShutdownYear 0 Year 1 Year 2 Year 3 Year 4 Year 5
Capital Cost, $ (47,409) 0 0 0 0 0Contract Service Cost, $ 0 (54,263) (54,263) (54,263) (54,263) (54,263)O&M Cost, $ 0 (7,959) (7,959) (7,959) (7,959) (7,959)Total Cost, $ (47,409) (62,222) (62,222) (62,222) (62,222) (62,222)Natural Gas Savings, $ 171,080 171,080 171,080 171,080 171,080Inert Gas Savings, $ 13,680 13,680 13,680 13,680 13,680Net Benefit, $ (47,409) 122,538 122,538 122,538 122,538 122,538Payback (months) 5IRR 258 %NPV1 $417,1071Net Present Value (NPV) based on 10% discount rate for 5 years
17
Methane Recovery by Pipeline Pumpdown
Most applicable to large pipelines operating at high pressuresUse In-Line compressors to “pull down”
the pressure
to minimum suction pressureUse portable compressor to “pull down”
pressure
even furtherCost is justified by immediate payback in gas savingsAbout 90% of gas usually vented is recoverable
18
Pipeline Pumpdown
TechniqueIn-line Compressor
Typically 2:1 compression ratioBy blocking upstream valve, the pressure in the pipeline is reduced to safe limits for maintenance
Portable CompressorTypically 5:1 compression ratioCan be used in conjunction with in-line compressors to reduce pressure in pipeline sectionCost-justifiable only when multiple sections of pipeline are being servicedDistribution mains generally do not contain a large enough volume of gas to justify the use of portable compressors

19
Sequence of Depressurization Events

20
Economics of Pipeline PumpdownsCalculate gas vented by depressurizing pipelineCalculate gas saved with in-line compressorsCalculate gas saved with portable compressor
Consider cost of a portable compressorCalculate annual savings
21
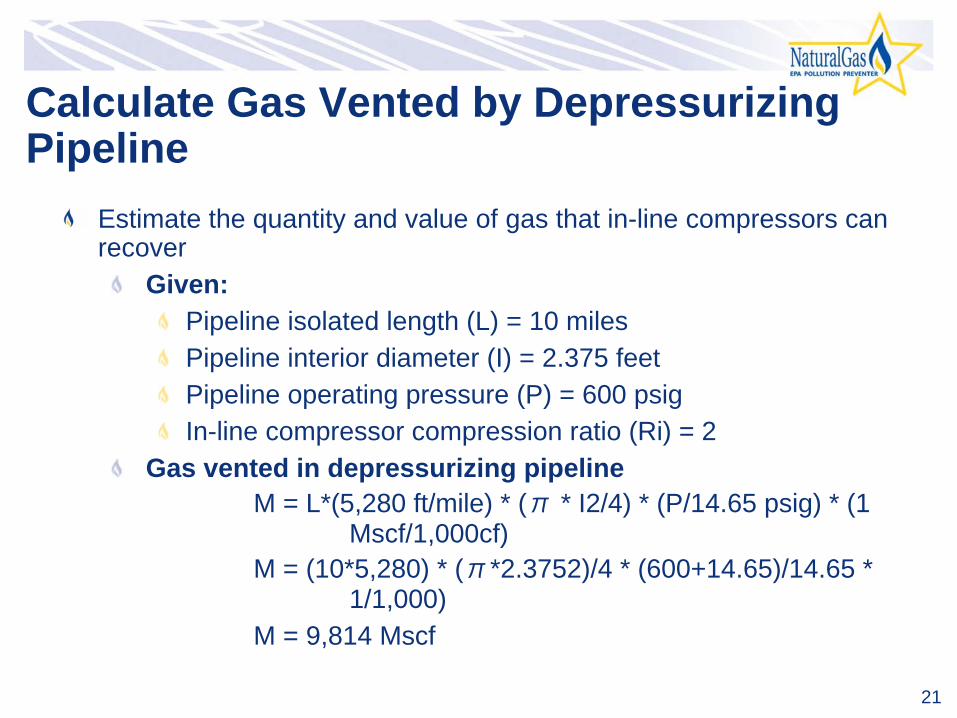
Calculate Gas Vented by Depressurizing Pipeline
Estimate the quantity and value of gas that in-line compressors can recover
Given:Pipeline isolated
length (L) = 10 milesPipeline interior diameter (I) = 2.375 feetPipeline operating pressure (P) = 600 psigIn-line compressor compression ratio (Ri) = 2
Gas vented in depressurizing pipelineM = L*(5,280 ft/mile) * (π * I2/4) * (P/14.65 psig) * (1
Mscf/1,000cf)M = (10*5,280) * (π*2.3752)/4 * (600+14.65)/14.65 *
1/1,000)M = 9,814 Mscf

22
Calculate Gas Saved using In-line Compressors
Amount of gas recoverable per action using an in-line compressorNi = M –
(M/Ri) = 9,814 –
(9,814/2) = 4,907 scf
Value of gas recovered per action using an in-line compressorVi = Ni * $7/Mscf = 4,907 * $7 = $34,349
Annual value of gas recovered assuming 4 actions per month= $34,349 * 4 * 12 = $1,648,752

23
Calculate Gas Saved using Portable Compressors
Given:Portable compression ratio (Rp) = 8Rate of compressor = 416 Mscf / hour
Gas available for recovery= M –
Ni = 9,814 –
4,907 = 4,907 Mscf
Gas saved using a portable compressorNp = Ni –
(Ni / Rp) = 4,907 –
(4,907 / 8) = 4,294 Mscf
Value of gas recovered using portable compressor1
Vg = Np * $7/ Mscf = 4,294 * 7 = $ 30,056 * 4 * 12 = $ 1,442,688
1
Because cost of operating portable compressor is high, assume portable compressor is used for 4 pipeline pumpdowns
per month.

24
Consider Costs of a Portable Compressor
Estimate the costs associated with using a portable compressor
Fuel costs (mostly natural gas) (Vcf) ~ 7,000 –
8,400 Btu per brake horse power per hourMaintenance costs (Vcm) ~ $5 -
$12 per horsepower per
monthLabor costs (Vcl)Taxes and administrative costs (Vct)Installation costs (Vci)Freight costs (Vcs)
25
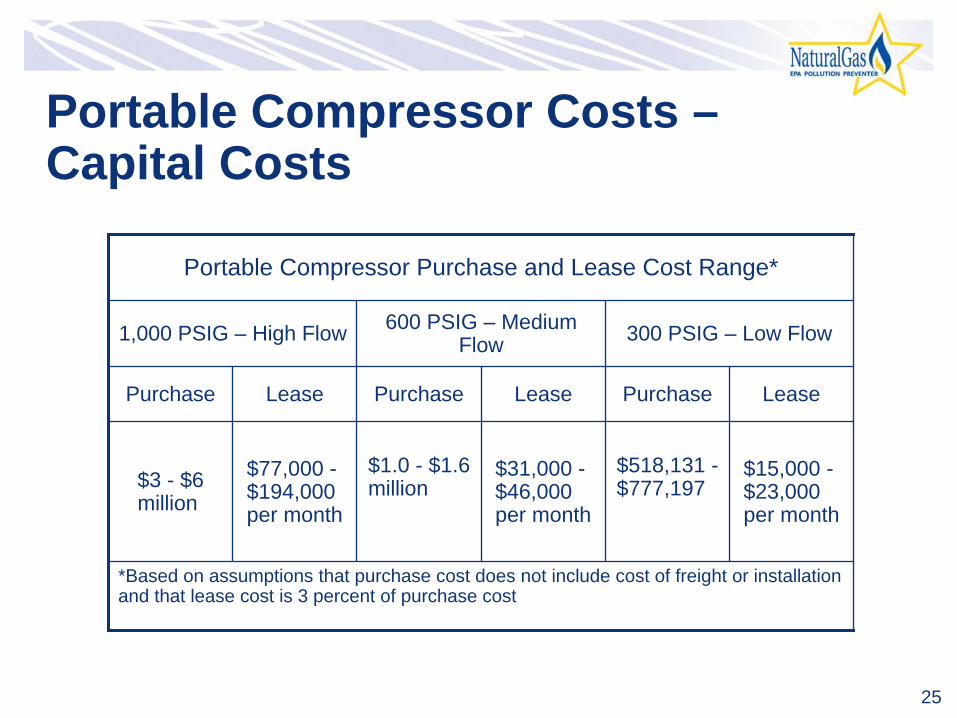
Portable Compressor Costs – Capital Costs
Portable Compressor Purchase and Lease Cost Range*
1,000 PSIG –
High Flow 600 PSIG –
Medium Flow 300 PSIG –
Low Flow
Purchase Lease Purchase Lease Purchase Lease
$3 -
$6 million
$77,000 -
$194,000 per month
$1.0 -
$1.6 million
$31,000 -
$46,000 per month
$518,131 -
$777,197
$15,000 -
$23,000 per month
*Based on assumptions that purchase cost does not include cost of freight or installation and that lease cost is 3 percent of purchase cost
26
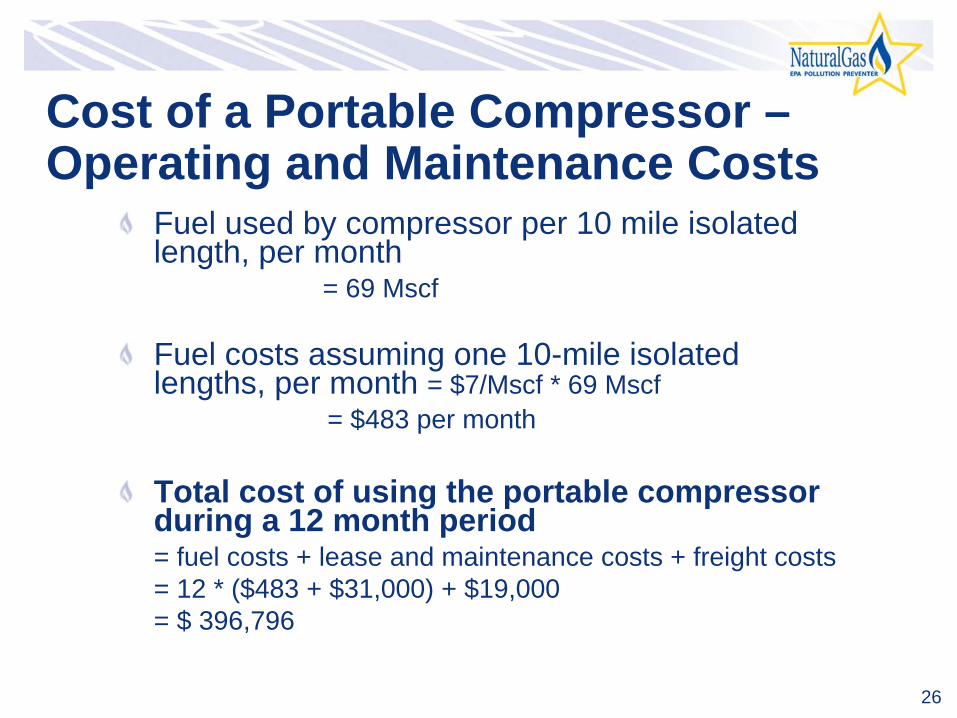
Cost of a Portable Compressor – Operating and Maintenance Costs
Fuel used by compressor per 10 mile isolated length, per month
= 69 Mscf
Fuel costs assuming one 10-mile isolated lengths, per month = $7/Mscf * 69 Mscf
= $483 per month
Total cost of using the portable compressor during a 12 month period= fuel costs + lease and maintenance costs + freight costs= 12 * ($483 + $31,000) + $19,000= $ 396,796
27
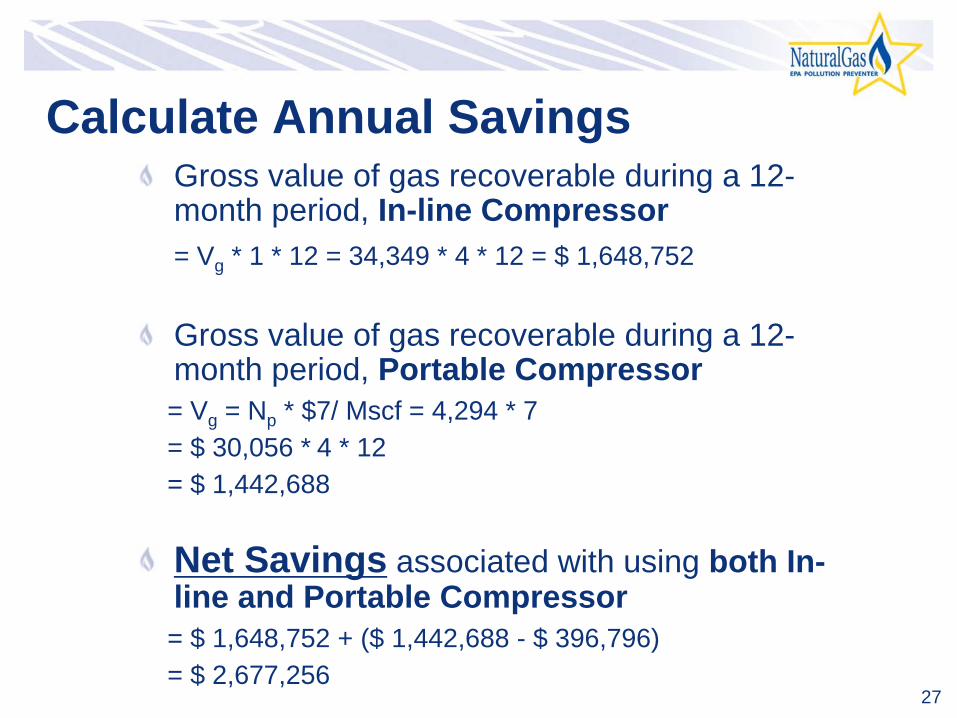
Calculate Annual SavingsGross value of gas recoverable during a 12-
month period, In-line Compressor= Vg
* 1 * 12 = 34,349 * 4 * 12 = $ 1,648,752
Gross value of gas recoverable during a 12- month period, Portable Compressor
= Vg
= Np
* $7/ Mscf
= 4,294 * 7= $ 30,056 *
4 * 12 = $ 1,442,688
Net Savings
associated with using both In- line and Portable Compressor
= $ 1,648,752 + ($ 1,442,688 -
$ 396,796)= $ 2,677,256
28
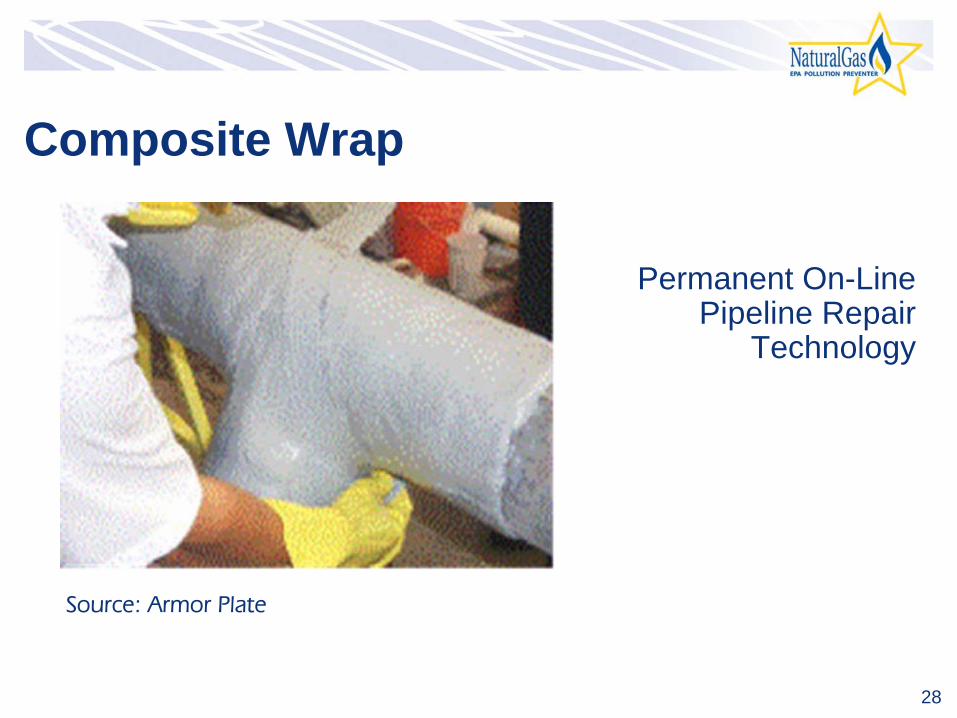
Permanent On-Line Pipeline Repair
Technology
Source: Armor Plate
Composite Wrap
29
What is Composite Wrap?Non-leaking pipeline defects can only be fixed in one of three ways, per Department of Transportation (DOT) regulations:
Cut out damaged segment and replace with new pipesInstall a full-encirclement steel split sleeve over the damaged areaInstall a composite sleeve over the damaged area
Composite Wrap Advantages:Can be performed without taking pipeline out of serviceRepair is quick and less costly than replacement or sleeve optionsEliminates venting associated with replacement
30
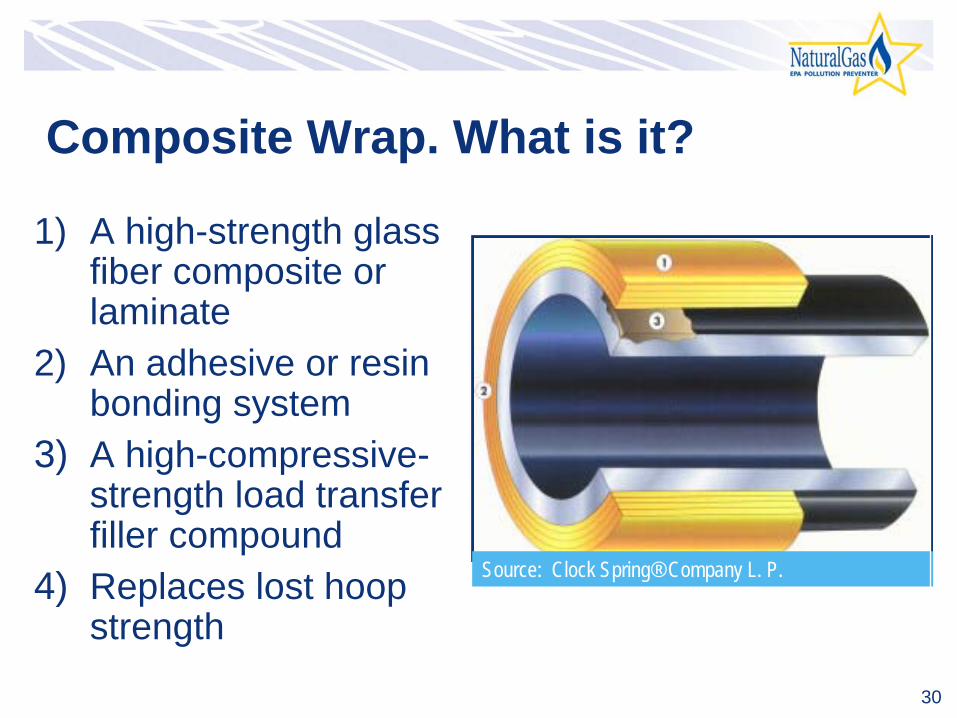
Composite Wrap. What is it?
1)
A high-strength glass fiber composite or laminate
2)
An adhesive or resin bonding system
3)
A high-compressive- strength load transfer
filler compound4)
Replaces lost hoop strength
Source: Clock Spring®
Company L. P.
31
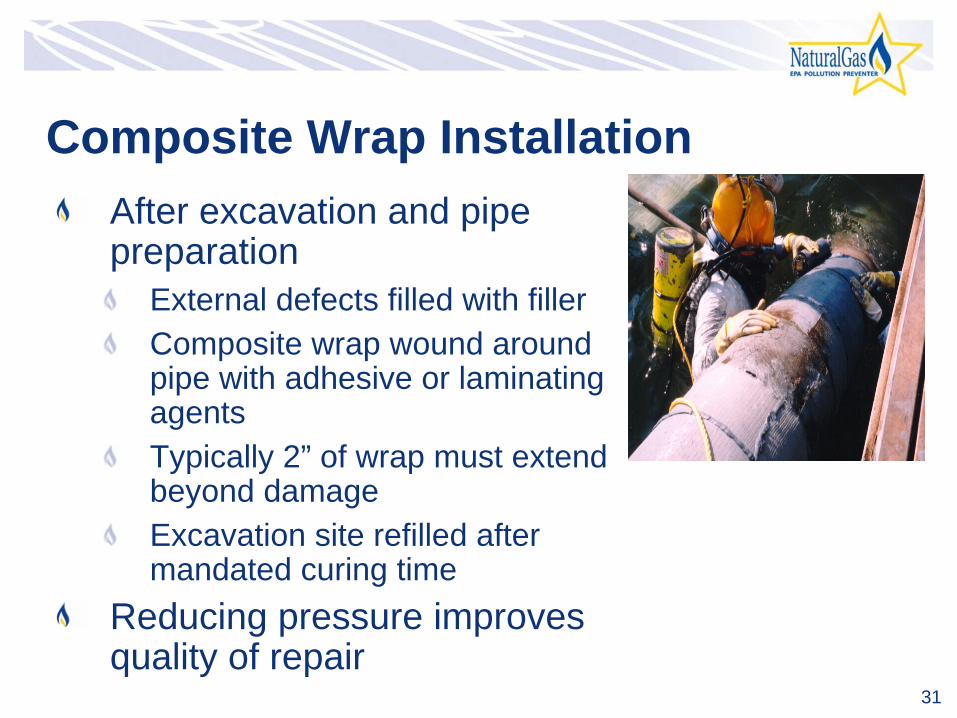
Composite Wrap InstallationAfter excavation and pipe preparation
External defects filled with fillerComposite wrap wound around pipe with adhesive or laminating agentsTypically 2”
of wrap must extend
beyond damageExcavation site refilled after mandated curing time
Reducing pressure improves quality of repair
32
Economics of Composite WrapCalculate associated costs
State assumptionsCalculate labor costCalculate equipment costCalculate indirect costs
Calculate Natural Gas Savings
Compare options

33
Calculate Associated Costs: Assumptions
Given:Need to repair a 6”
non-leaking defect on a 24”
pipeline, operating at 350 psig; assume 16 hours to complete the project1. Assume cost of engineering management is 25% cost of field labor.
Clabor
= cost of laborHourly rate of field labor categoryOperator
= $ 46/hrPipeliner
= $ 42/hrApprentice
= $ 28/hrCequip
= cost of equipmentCost of individual equipmentComposite Wrap Kit
= $ 1,087/kitBackhoe
= $ 45/hrSandblasting equipment
= $ 12/hrPipeline coatings (5% composite kit)
= $ 541Partner supplied information. Updated to 2006 costs.
34
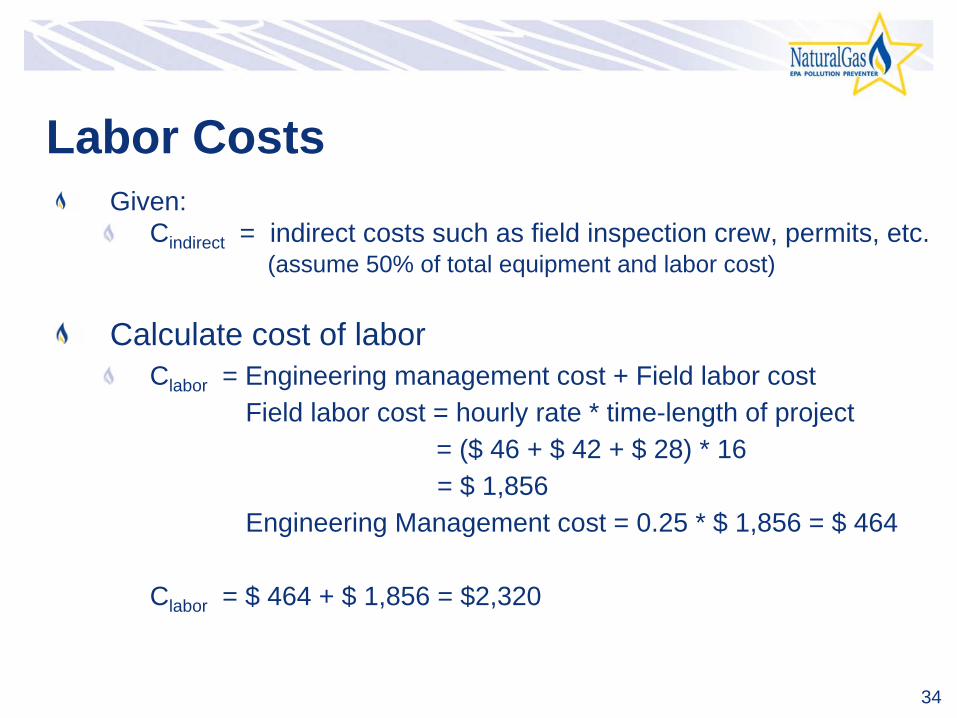
Labor Costs Given:
Cindirect
= indirect costs such as field inspection crew, permits, etc.(assume 50% of total equipment and labor cost)
Calculate cost of laborClabor
= Engineering management cost + Field labor costField labor cost = hourly rate * time-length of project
= ($ 46 + $ 42 + $ 28) * 16= $ 1,856
Engineering Management cost = 0.25 * $ 1,856 = $ 464
Clabor
= $ 464 + $ 1,856 = $2,320

35
Equipment and Indirect CostsCalculate cost of equipment
Cequip
= Cost of consumable materials (composite wrap kit and coatings) + Cost of renting/using equipment on site
= $ 1,087 + $ 54 + ($ 45 * 16) + ($ 12 * 16)= $ 2,053
Calculate indirect costsCindirect
= Cost of permits, inspection services, right-of-way, etc.= 0.5 * (Clabor
+ Cequip
) = 0.5 * ($ 2,320 + $ 2,053)= $ 2,186
Calculate total cost of repairTotal Cost of Repair = Clabor
+ Cequip
+ Cindirect
= $ 2,320 + $ 2,053 + $ 2,186= $ 6,559

36
Calculate Natural Gas SavingsGiven:
D = inside diameter of pipeline (inches)L = length of pipeline between shut-off valves (feet)P = Pipeline pressurePnatural
gas
= Current natural gas market price ($7/Mcf)Vnatural
gas
= Volume of natural gas emissions
Vnatural
gas
= D2
* P * (L/1000) * 0.3721,000
= 242
* 350 * (52,800/1,000) * 0.3721,000
= 3,960 McfValue of natural gas = Vnatural
gas
* Pnatural
gas
= 3,960 * $7/Mcf= $27,720
37
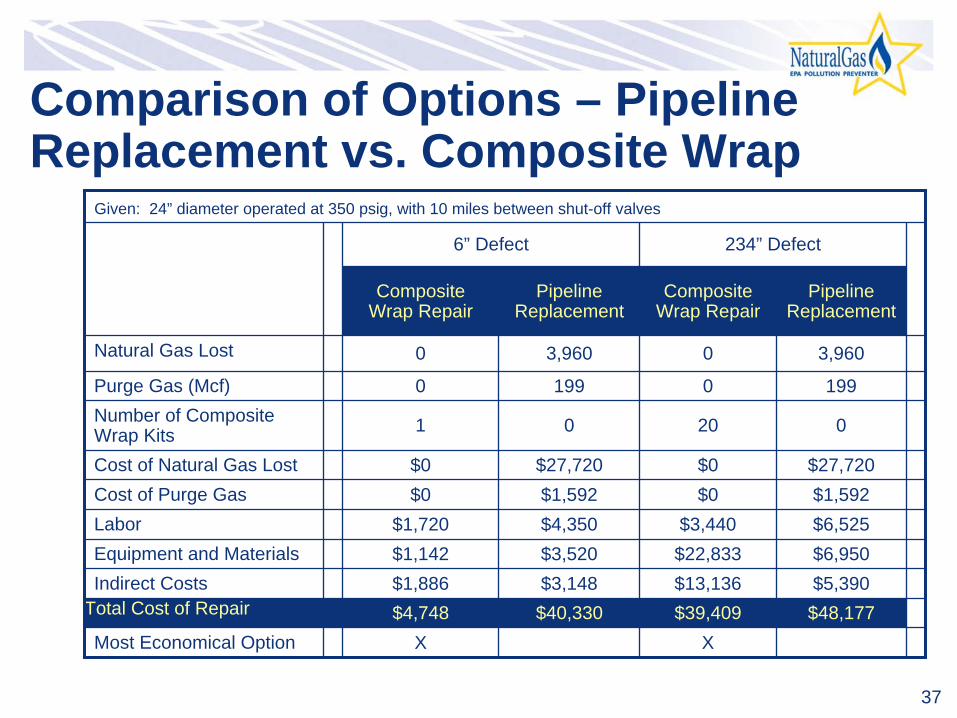
Comparison of Options –
Pipeline Replacement vs. Composite Wrap
Given: 24”
diameter operated at 350 psig, with 10 miles between shut-off valves
6”
Defect 234”
Defect
Composite Wrap Repair
Pipeline Replacement
Composite Wrap Repair
Pipeline Replacement
Natural Gas Lost 0 3,960 0 3,960
Purge Gas (Mcf) 0 199 0 199Number of Composite Wrap Kits 1 0 20 0
Cost of Natural Gas Lost $0 $27,720 $0 $27,720Cost of Purge Gas $0 $1,592 $0 $1,592Labor $1,720 $4,350 $3,440 $6,525Equipment and Materials $1,142 $3,520 $22,833 $6,950Indirect Costs $1,886 $3,148 $13,136 $5,390
Total Cost of Repair $4,748 $40,330 $39,409 $48,177Most Economical Option X X
38
Composite Wrap Lesson LearnedProven permanent repair for external defectsTemporary repair for internal faultsIn-service pipeline repair methodologyIdeal for urgent and quick repairAvoid service disruptionsCost-effective
Trained but not skilled crafts persons requiredSpecialized welding and lifting equipment not requiredMinimizes access concernsNo delays awaiting metal sleeveCathodic protection remains functional
39
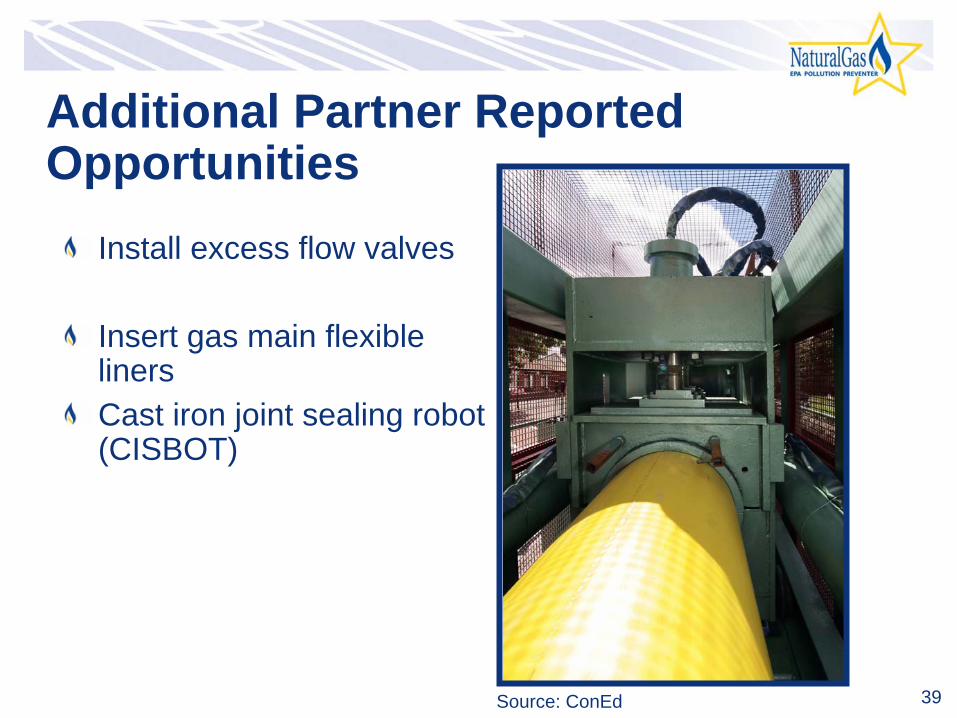
Additional Partner Reported Opportunities
Install excess flow valves
Insert gas main flexible linersCast iron joint sealing robot (CISBOT)
Source: ConEd
40
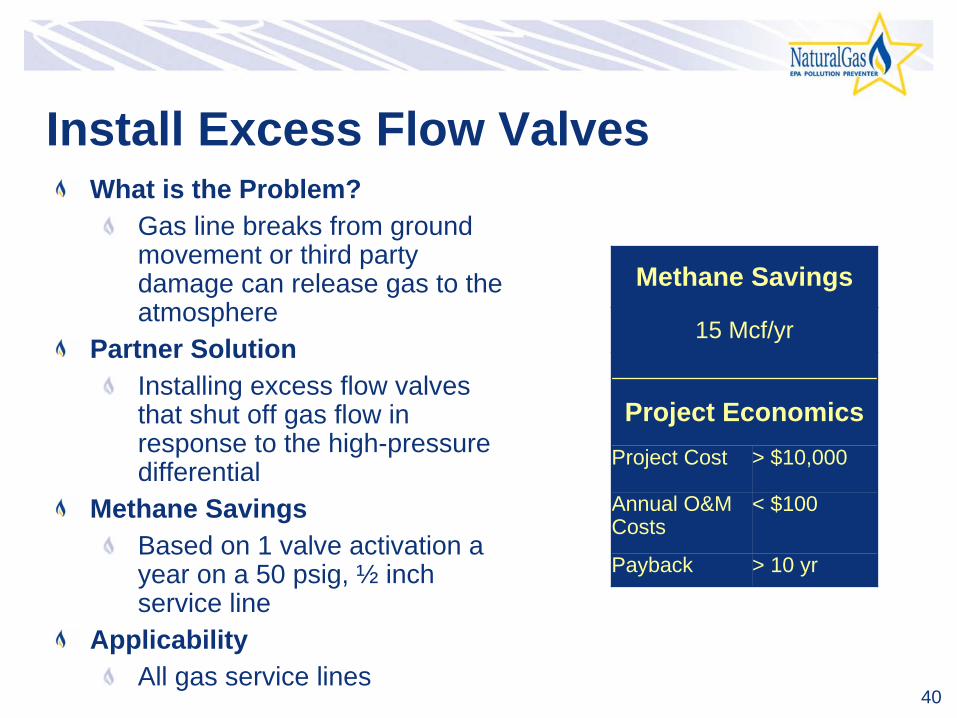
Install Excess Flow ValvesWhat is the Problem?
Gas line breaks from ground movement or third party damage can release gas to the atmosphere
Partner SolutionInstalling excess flow valves that shut off gas flow in response to the high-pressure differential
Methane SavingsBased on 1 valve activation a year on a 50 psig, ½
inch service line
ApplicabilityAll gas service lines
Methane Savings
15 Mcf/yr
Project EconomicsProject Cost > $10,000
Annual O&M Costs
< $100
Payback > 10 yr
41
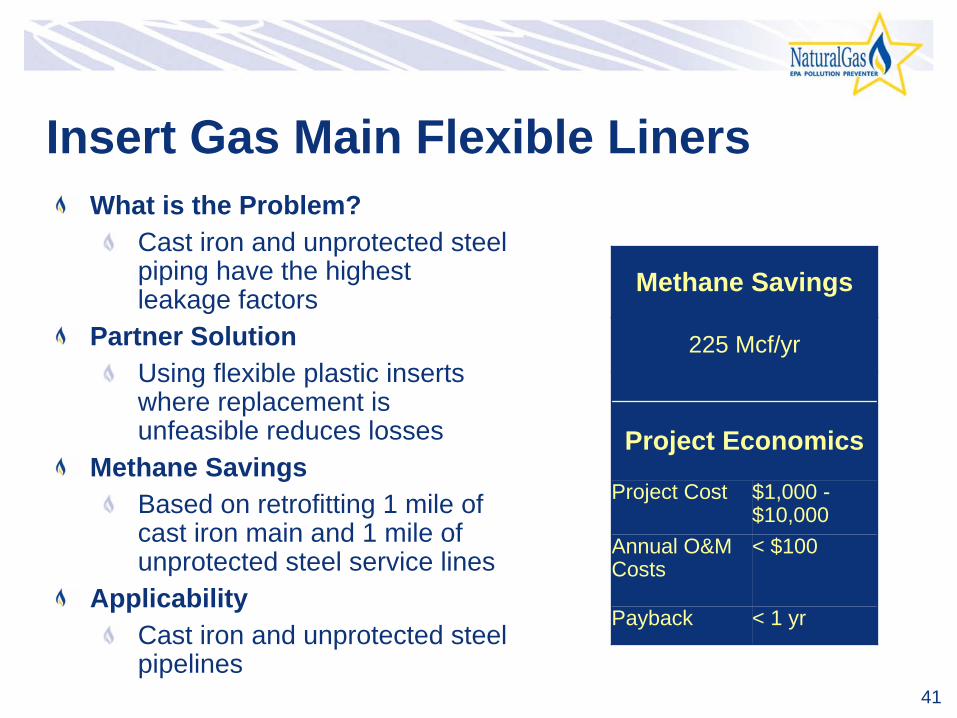
Insert Gas Main Flexible Liners
Methane Savings
225 Mcf/yr
Project Economics
Project Cost $1,000 -
$10,000
Annual O&M Costs
< $100
Payback < 1 yr
What is the Problem?Cast iron and unprotected steel piping have the highest leakage factors
Partner SolutionUsing flexible plastic inserts where replacement is unfeasible reduces losses
Methane SavingsBased on retrofitting 1 mile of cast iron main and 1 mile of unprotected steel service lines
ApplicabilityCast iron and unprotected steel pipelines
42
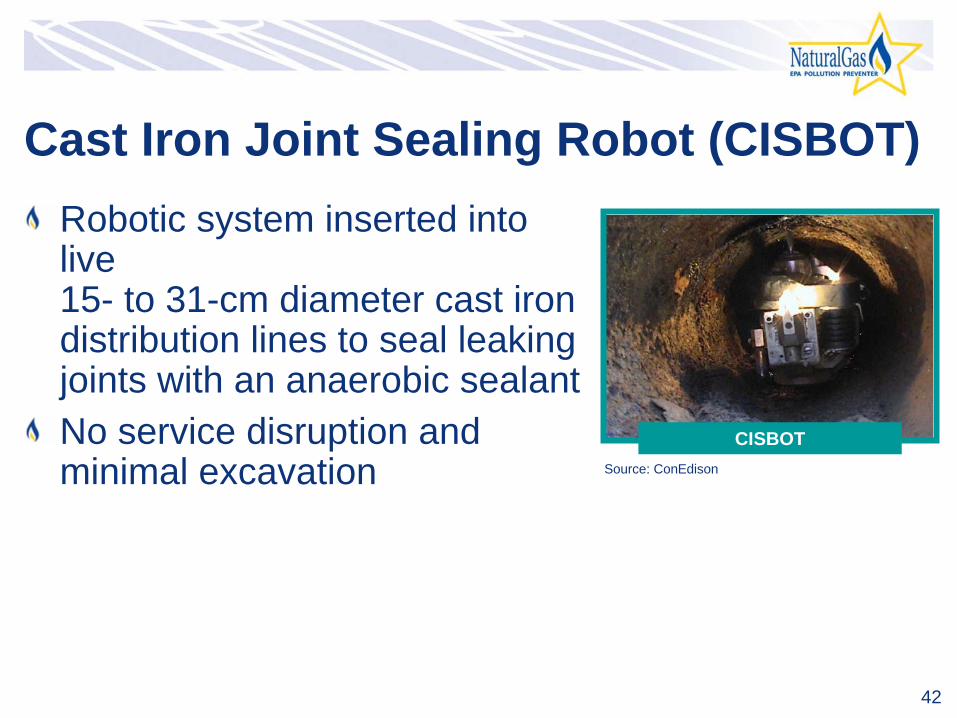
Cast Iron Joint Sealing Robot (CISBOT)Robotic system inserted into live 15-
to 31-cm diameter cast iron
distribution lines to seal leaking joints with an anaerobic sealantNo service disruption and minimal excavation
CISBOTSource: ConEdison
43
DiscussionIndustry experience applying these technologies and practicesLimitations on application of these technologies and
practicesActual costs and benefits