Pipeline Hydraulic Transport of Biomass Materials: A ...
45
1 Pipeline Hydraulic Transport of Biomass Materials: A Review of Experimental Programs, Empirical Correlations, and Economic Assessments Mahdi Vaezi, Amit Kumar 1∗ 4-9, Department of Mechanical Engineering, University of Alberta, Edmonton, AB, Canada, T6G 2G8 Abstract Pipeline hydro-transport, an economically viable means of delivering large volumes of biomass, can replace conventional modes of transport - road, rail, and river - to improve the economy of pulp and paper mills, as well as bio-based energy facilities. This paper is a review of experimental and theoretical studies conducted by various sectors on the transport of wood and non-wood biomass-water mixtures (slurries) in pipes. The aims were to collect technical challenges, governing mechanical equations, and associated economic issues, as well as to identify the gaps in knowledge in the area. There have been several experiments conducted on pipeline hydro-transport of wood chips over a wide range of pipeline materials, lengths, and diameters. However, pipeline transport of non-wood agricultural residue slurries, as well as the performance of the centrifugal slurry pump handling such mixtures, has recently been investigated in a single lab-scale pipeline facility. Several researchers have proposed empirical correlations to estimate friction loss in wood chip slurries flowing in pipes and also recommended technically and economically optimum pumping velocities. Those correlations, however, are reported to come with noticeable deviations from one 1∗ Corresponding author. Tel.:+1-780-492-7797; fax: +1-780-492-2200. E-mail address: [email protected]
Transcript of Pipeline Hydraulic Transport of Biomass Materials: A ...
1
Pipeline Hydraulic Transport of Biomass Materials: A Review of
Experimental Programs, Empirical Correlations, and Economic
Assessments
Mahdi Vaezi, Amit Kumar1∗
4-9, Department of Mechanical Engineering, University of Alberta, Edmonton, AB, Canada,
T6G 2G8
Abstract
Pipeline hydro-transport, an economically viable means of delivering large volumes of
biomass, can replace conventional modes of transport - road, rail, and river - to improve the
economy of pulp and paper mills, as well as bio-based energy facilities. This paper is a
review of experimental and theoretical studies conducted by various sectors on the transport
of wood and non-wood biomass-water mixtures (slurries) in pipes. The aims were to collect
technical challenges, governing mechanical equations, and associated economic issues, as
well as to identify the gaps in knowledge in the area. There have been several experiments
conducted on pipeline hydro-transport of wood chips over a wide range of pipeline materials,
lengths, and diameters. However, pipeline transport of non-wood agricultural residue slurries,
as well as the performance of the centrifugal slurry pump handling such mixtures, has
recently been investigated in a single lab-scale pipeline facility. Several researchers have
proposed empirical correlations to estimate friction loss in wood chip slurries flowing in
pipes and also recommended technically and economically optimum pumping velocities.
Those correlations, however, are reported to come with noticeable deviations from one
1∗ Corresponding author. Tel.:+1-780-492-7797; fax: +1-780-492-2200.
E-mail address: [email protected]

2
another and from experimental measurements. One empirical correlation has been also
proposed to predict, with an uncertainty of less than 10%, the longitudinal pressure gradients
in pipeline hydro-transport of agricultural residue biomass. All the experimental
measurements and empirical correlations based some studies on the economic feasibility of
pipelining wood chip-water mixtures. These studies proved the concept of economy of scale
to be highly applicable to biomass pipeline systems.
Keywords: Biomass, wood chip, agricultural residue, pipeline, hydro-transport
Nomenclature
1. Introduction
Hydraulic transport (hydro-transport) of solids in pipes has been the subject of investigation
since the turn of the last century. The first person to conduct a systematic investigation on
solid-liquid mixture flows through a 25 mm horizontal pipe was Nora Blatch in 1906 [1].
Since then, particularly owing to the improvements in centrifugal pump design and the
advances in solid-liquid mixture flow knowledge during the 1960s [2], several short and long
solid-liquid mixture pipelines have been constructed to hydraulically transport a variety of
solids, from coal to limestone to complex bitumen. The technical and economic advantages
of pipeline hydro-transport have encouraged various sectors to consider replacing
conventional modes of transport, e.g., road, river, and rail, with pipelines for long-distance
transport purposes. Major advantages include benefits from economies of scale in the
construction of the pipeline and associated equipment; large transportation volume (e.g.,
2.273 Gt y-1 of phosphate concentrate [1, 3]); excellent safety record (fewer than two
incidents per 10,000 km of pipeline reported per year [4]); continuous operation; reduced in-
transit inventory; low labor content; independence from weather, road, and terrain conditions;

3
possible reuse of carrier liquid; and the possibility of sharing between more than one
companies [5].
While, to the authors’ best knowledge, there is no large-scale long-distance biomass pipeline
in operation at the moment, the pulp and paper industry uses hydro-transport technology for
wood pulp fibres for on-site processing over short distances [6-9]. The pulp and paper
industry has also conducted some laboratory-scale research projects on wood chips pipeline
hydro-transport for feedstock supply purposes [10-12]. Besides the pulp and paper industry,
pipeline hydro-transport of biomass, more specifically lignocellulosic biomass, is now
receiving new interest as an alternative means of delivering biomass to bio-based plants [13-
20] that can potentially reduce the cost of feedstock delivery [13] and enable bio-based
energy facilities to reach higher capacities.
Wood pulp fibre is not a natural biomass but a mechanically or chemically processed
biomass, and, therefore, its hydro-transport is not reviewed here. This paper instead reviews
the literature published on the pipeline hydro-transport of unprocessed biomass in the pulp
and paper industry as well as in the bio-based energy sector. The literature is reviewed in
chronological order and is classified into experimental programs, empirical correlations, and
economic assessments. All the costs reported in the economic assessments section have been
inflated to the 2014 U.S. dollar. Table 1 lists the research activities conducted in this field and
reviewed here. The objectives of this review are to understand the technical challenges and
mechanical limitations as well as the economy of biomass pipeline hydro-transport, also to
identify gaps in the knowledge of biomass pipeline hydro-transport for future research.
Table 1
2. Experimental Programs

4
2.1. Introduction
The design and operation of solid-liquid mixture (slurry) pipelines is a complex problem
where, as it was listed by Nardi in 1959 [34], as many as 32 variables have to be taken into
account before someone designs a pipeline to successfully pump solids. These complexities
have been previously addressed while pipelining conventional solids such as coal [35],
phosphates [3], iron ore [36], bitumen [37], rock, sand, and stone [38, 39]. Several
researchers studied such complexities in biomass slurry pipelines as well, all non-commercial
practices, though.
In this section, experimental investigations on slurry pipelines for wood chips and
agricultural residue biomass are examined over a wide range of variables. The biomass
pipeline projects reviewed here cover a wide range of biomass physical properties and
pipeline operating conditions, including pipeline materials of aluminum, clear plastic, acrylic,
and steel; pipeline lengths of 25 to 1220 m; pipeline diameters of 50 to 300 mm; moisture
contents (MC - mass fraction of water in the solid) of 50 to 79%; particle diameters (d50) of
1.9 to 28.4 mm; slurry solid volume contents of 1.8 to 47%; and biomass-water mixture
velocities of 0.5 to 5.0 m s-1. The advantages specific to biomass pipelines include all usable
(wood and non-wood) species transported without losses related to truck delivery or moving
wood on river drives; possible transportation of small-diameter wood, as well as bark,
needles, and stumps (now wasted) for use at the mill; the elimination of log storage, handling,
and protection; and wider choice for the location of new mills [5, 26]. Practical experience
with these feedstocks would be of great help in the design of new pipelines or modification of
existing systems.
2.2. Wood Chip-Water Mixtures in Pipes

5
Elliott and de Montmorency [10, 21] at the Pulp and Paper Institute of Canada (PAPRICAN,
later merged with two main forest sector research institutes, FERIC and Forintek Canada
Corp., to form FPInnovations) were the first to install a laboratory-scale experimental facility
to study the hydro-transport of wood chips in pipes. The velocities used range from 1.2 to 3.0
m s-1 and the mixture ranged up to 48% by volume of wood [5]. The facility was composed
of 160 m of 200 mm diameter aluminum pipe, and the chips were spruce and balsam fir, with
d50 of 6.4 mm that, at a fully saturated condition, attained a moisture content of 68% to 70%
and density of 1030 to 1060 kg m-3 [10]. Elliott [21] observed a deterioration (also referred to
as degradation or particle size reduction) caused mainly by the pump and reported the
production of wood chips smaller than 12.7 mm to be four times more by weight compared to
control chips from the original batch after four hours of circulation. The optimum mixture
solid volume content was reported to be about 30%, since at a solid volume content of 35%
the pump power consumption began to increase slightly and at 47% the mixing operation
became erratic because the equipment was not designed for such a heavy mixture.
Considering pressure drop measurements, Elliot and de Montmorency [10], using a pressure
drop-velocity plot, showed that with increasing velocity the curves corresponding to the
mixtures above a solid volume fraction of 20% go through a minimum of friction loss, where
chips along the bottom start to build up toward plugging conditions. Afterwards, the curves
straighten and become parallel/close to the pure water line where chips are in complete
suspension. This research work stimulated similar experimental studies in the United States
[12, 28, 30] and the Soviet Union [25].
The research and development section of the Shell Pipeline Company [23] studied hydro-
transport of wood chip-water mixtures in a closed-circuit pipeline facility of 1220 m length
and 200 mm diameter in Houston, Texas, U.S.A. The results were inconclusive and the
system was later dismantled; further experiments were conducted on shorter and smaller clear

6
plastic pipelines 50 mm in diameter. The results, however, were proprietary and not released
[22].
Faddick [11] conducted an experimental investigation on wood chip-water mixtures on a 100
mm diameter pipeline. Later, he tried to simulate the pipeline hydro-transport of wood chips
using uniform-sized plastic chips instead [30] (discussed in a subsequent section).
To verify the feasibility of the concept of wood chip hydro-transport and to determine the
empirical laws relating various variables, Brebner [24] performed a series of experiments on
a test circuit that was made up of 120 m of 100 mm diameter aluminum pipe. He used
standard jack pine and spruce chips with d50 of 6.4 mm, which at fully saturated conditions
attained a moisture content of 70% and density of 1150. Considering slurry flow regimes,
Brebner observed three regimes at velocities between 1.5 and 4.5 m s-1 consisted of
″suspension″ for solid volume contents below 5%, ″discontinuous sliding bed with saltation″
for solid volume contents between 5% and 12%, and ″continuous sliding bed″ for solid
volume contents above 12%. In the latter, chips were physically interlocked while loose chips
progressed at a slightly faster rate above the sliding bed.
In another attempt to transport wood chips by pipeline, the Pulp and Paper Research Institute
of Canada established a pilot-scale pipeline (Project DC-302) in Marathon, Ontario, beside
one of Canada’s pulp mills [5, 26, 27]. The pipeline was 610 m long, U-shaped, and
comprised of a 150 mm diameter aluminum pipe, as well as 200 and 250 mm diameter steel
pipes with two inclined sections at 10 and 20 degrees to simulated extremes in terrains.
Equipment for the construction of the experimental facility was provided by ten companies
(two major Canadian railroad companies, a construction and engineering design firm, a
pipeline company, and six pulp and paper producing companies). Pumping pressures, pump
speeds, flow rates, pressure drops, concentrations, pipe wear (using radioactive sections in the

7
two steel lines), and water pH were monitored, recorded, and analyzed at the rate of 17 data
every two seconds over 10 weeks. PAPRICAN concluded that ordinary commercial chips can
be sent in a water slurry through a pipeline at velocities of 1.2 to 3.0 m s-1 and in mixtures up
to 40% by volume of chips. At these velocities and concentrations, a 200 mm diameter
pipeline can carry hundreds of tonnes of wood every 24 hours. The amount of wood damage
for later mechanical pulping or sulfite pulping in pulp production procedures was found also
to be slight, even after long transport. The detailed findings of the research project are
confidential.
The Georgian Research Institute of Forest Industry (GrusvNIILesprom.) proposed a steel
pipeline; 300 mm diameter and 80-120 km long, to be laid parallel to the Ingur River for the
transport of wood chips to the pulp and paper combine at 1.6 m s-1 velocity [25]. To study the
technical and economic feasibility of the proposed project, the research institute built a model
gravity-fed steel pipeline system, 150 mm in diameter and 48 m long and wood chip-water
mixtures with consistencies of 5 to 20% by volume at flow velocities of 1.0 to 2.5 m s-1
where used in the investigation. A bunker of wood chips with an electrically-driven screw
feeder and a tank of water with a funnel were used to convey wood chips and water into the
pipeline, separately, and also to adjust the wood chip to water ratio. The experiments showed
that with an increase in mixture flow velocity, specifically beyond 2.2 m s-1, the hydraulic
characteristics of the flow improve. The research institute concluded that ″pipelines are fully
suitable for the transport of wood chips in water suspensions″. The institute also
recommended the application of steel pipes lined with plastic because of favorable hydraulic
and economic indications.
Wasp et al. [28] conducted an experiment on conveying wood chips with a density of 1130
(fully saturated) and dimensions of 19 mm×12.7 mm×2.5 mm through a 200 mm diameter

8
pipe at 3.0 m s-1 velocity. They applied the homogeneous-heterogeneous model [40] (see
section 3, Eqs. 5 and 6) to identify the flow regime and mixture solid volume content across
the pipe cross section.
Soucy [29], using 150 mm diameter acrylic pipes, conducted a series of experiments to
measure the pressure drop of wood chip-water mixtures in pipes. Soucy’s data were later
used by Faddick [30] and Gow [12].
In 1962, the Montana State University entered into a cooperative aid agreement with the U.S.
Forest Service to conduct a series of technical and economic analyses to establish criteria to
design, construct, and operate wood chip pipeline systems to feed the pulp and paper industry
[12, 30, 41]. As a part of this study and to simulate the pipeline hydro-transport of wood
chips as well as investigate friction loss parameters, Faddick [30] transported uniform-sized
plastic chips of densities of 920 and 1050 and dimensions of 12.7 mm×9.5 mm×2.5 mm
through 75 mm and 100 mm diameter and 210 m long acrylic pipes. Later, Gow [12]
modified Faddick’s laboratory pipeline system to study wood chip-water mixtures and
correlated experimental friction loss data over a range of mixture velocities, pipe diameters,
wood chip sizes, and mixture solid volume contents. The use of lodgepole pine wood chips
with d50 of 9.5 mm, a fully saturated moisture content of 50%, and a density of 1015 resulted
in the mixture velocity’s being limited to 3.3 m s-1 and 1.3 m s-1 through 100 mm diameter
acrylic plastic and 150 mm diameter aluminum pipes, respectively. Gow’s investigation was
directly comparable to Faddick’s experimental data [11] (the two experiments were
conducted with a 100 mm diameter pipe). Gow concluded that at a given mixture velocity,
the friction factor increases in magnitude with increasing solid volume content. Also at a
given mixture velocity and solid volume content, the friction factor decreases with increasing
pipe diameter. However, Gow noted the dependence of friction factor on pipe diameter was

9
non-linear for high solid volume contents and insignificant at high velocities. An abrupt
change was also observed in friction factor in which the corresponding velocity (critical
velocity) depended on mixture solid volume contents and was due to the change in the mode
of transport of wood chips from ″heterogeneous discontinuous sliding bed with saltation″ to
″continuous sliding bed.″ This study employed the terms ″pseudo-laminar″ and ″pseudo-
turbulent″ to refer to sliding bed and saltation flows, respectively, to distinguish these
phenomena from classical laminar and turbulent pipe flows.
Hunt [22] studied the hydro-transport of wood chip-water mixtures using elongated oblong
plate-shaped lodgepole pine wood chips with d50 of 28.4 mm and approximate density of
1000 to 1050. He used 200 mm and 300 mm diameter and 91 m and 183 m long steel pipes in
order to scale up the experiments conducted on 75 mm, 100 mm, and 150 mm diameter pipes
and to examine the applicability of the extrapolation approach to friction loss correlations
proposed by others [12, 30]. The friction loss correlation proposed by Hunt will be reviewed
in the next section.
2.3. Agricultural Residue Biomass Slurries in Pipes
Mohammadabadi [32] was the first to experimentally study the feasibility of pipelining
biomass materials in the form of solid-liquid mixtures (slurries). Mohammadabadi designed,
fabricated, and instrumented a 50 mm diameter and 25 m long closed-circuit lab-scale
pipeline facility in the Large-scale Fluids Lab at the University of Alberta, and successfully
pumped wheat straw-water mixtures up to a solid mass content (dry-matter) of 6.5%.
Mohammadabadi mainly focused on the change in wheat straw particles’ physical properties
through exposure to water. For instance, the change in wet-basis moisture content of particles
with nominal dimensions (labelled after the size of the classifier sieves openings) of 3.2 mm
and 19.2 mm was measured while the particles were being soaked and mechanically mixed

10
for 192 hours. The samples containing small size particles absorbed water faster, the final
moisture level (saturation level) of the samples of large size particles was greater (81.2% vs.
81.0%), and mechanical mixing compared to soaking increased the magnitude of absorption
(82.4% vs. 81.2% for 19.2 mm particles) as well as the rate of absorption of water into wheat
straw particles. In addition, the saturated particle density of wheat straw samples was found
to be greater for smaller particles compared to larger ones (1050 kg m-3 vs. 1030 kg m-3) and
greater after 192 hours of mixing compared to the density obtained after the same amount of
soaking time (1060 kg m-3 vs. 1050 kg m-3 for 3.2 mm particles). The lab-scale closed-circuit
pipeline facility created by Mohammadabadi was used later by Luk et al. [31, 33] and Vaezi
et al. [16, 17] to experimentally investigate the hydraulics of pipeline transport of agricultural
residue biomass slurries.
Luk et al. [31, 33] studied the pressure drop behavior of wheat straw-water mixtures for
wheat straw particles of dimensions of 3.2, 6.4, and 19.2 mm, solid mass contents (dry
matter) of 1.92, 3.90, and 5.94%, and slurry bulk velocities of 1.5 to 3.0 m s-1. Luk et al.
realized that fibre-like wheat straw particles can suppress the flow turbulence at elevated
velocities of more concentrated flows and cause the pressure drop to fall below the pressure
drop of water alone (the drag-reduction effect).
In order to obtain the true specifications of knife-milled pre-classified wheat straw and corn
stover in the Large-scale Fluids Lab., Vaezi et al. [19] used the ImageJ [42] image processing
platform and developed a user-coded plugin to obtain the particle dimensions, particle size
distribution, size distribution algorithms, shape factors, and other morphological features of
wheat straw and corn stover. Large dimensions of 2.0 to 9.0 mm (length), small aspect ratios
of 2 to 7, and uunusual characteristics, e.g., wide size distribution and fibrous, pliable,

11
flexible, and asymmetric nature, distinguished agricultural residue biomass fibres from
conventional solid particles, e.g., coal, ash, and sand.
Vaezi et al. [16, 17] critically examined the applicability of previously developed correlations
for wood chip- and conventional solid particles-water mixtures pressure drop in estimating
friction losses while hydraulically transporting wheat straw and corn stover particles. The
correlations were found to be inapplicable to the slurries when the slurries of wheat straw and
corn stover fibres exhibited unique friction loss behavior, and pressure drop values dropped
below that of clear water at elevated velocities, i.e., the drag-reduction effect, as had been
previously reported by Luk et al. [33] too. The authors later proved the direct benefit of such
drag-reducing ability in reducing pipeline system pumping requirements [17].
Vaezi et al. [16] then studied the change in slurry friction loss and rheological behaviors with
the change in agricultural residue biomass particles type (wheat straw and corn stover),
particle nominal dimension (<3.2, 3.2, 6.4, and 19.2 mm), slurry solid mass content (1.0 to
8.8% dry-matter - solid volume content of 1.8 to 14.7%), and slurry velocity (0.5 to 5.0 m s-
1). A drag reduction of 33% was reported for a 7.6% slurry of <3.2 mm wheat straw particles
at 5.0 m s-1 (Fig. 1(a)). An increase in slurry solid mass content inversely changed the slurry
friction loss compared to conventional solid-liquid systems and decreased the slurry pressure
gradient. Large particle size and broad particle size distribution were also found to produce
lower friction losses at high flow rates (Fig. 1(b)). Variations in momentum transfer
mechanisms, carrier fluid and apparent suspension viscosities, and slurry network strength
were the major reasons reported behind such unique behaviors.
Fig. 1
Vaezi et al. [17] later investigated the effect of wheat straw particles on the performance
characteristics of an open-impeller centrifugal pump. They studied the change in total head

12
height, efficiency, and power consumption of the pump with the change in solid particle
dimension and slurry solid mass content. In clear contrast to the performance of the
centrifugal pumps handling slurries of conventional solid particles, the head height produced
by the centrifugal pump here increased with an increase in slurry solid mass content for the
entire range of flow rates (0.5 to 5.0 m s-1) and particle dimensions (<3.2 to 19.2 mm) (Fig.
2(a)). With regard to the power consumption of the pump, the input power for the pump
handling slurries of <3.2 mm particles dropped below the power required by the pump
handling pure water only throughout the entire range of flow rates and solid mass contents. In
addition, the efficiency of the pump, while centrifugally pumping the slurries of <3.2 mm
wheat straw fibres, was 2.0 to 20% higher than the same pump handling pure water only (Fig.
2(b)). The unique performance of the pump while handling wheat straw solid particles was
mainly attributed to particle drag-reducing effect, change in slippage, or damping of
turbulence.
Fig. 2
3. Empirical Correlations
3.1. Introduction
Reliable correlations are necessary to predict friction loss at the design conditions of piping
systems that transport biomass slurries to prevent oversized systems and needlessly high
capital and operating costs [8, 43]. However, over fifty years of research have not yet
produced a universally applicable correlation for the transport of biomass-water mixtures in
pipes. The basic reason is the complex flow behavior of such mixtures which is not yet
sufficiently well understood [8]. The carrier liquid could be Newtonian or non-Newtonian
(fluid which viscosity or flow behavior changes under stress), the slurry flow could be
laminar or turbulent (flow in which the fluid undergoes irregular fluctuations and the speed of

13
the fluid at a point is continuously undergoing changes in both magnitude and direction), and
the mixture could be classified as settling or non-settling (no tendency shown by particles in
mixture to settle under no-flow conditions) [1]. In addition, there are several modes of
particle motions (flow regimes) in hydraulic conveying, depending on how the particles are
distributed over the cross section of horizontal pipe (function of particle size, mixture
velocity, and mixture concentration). Newitt and Richardson [44] listed those modes as
suspended flow, suspended flow with a moving bed, suspended flow with a stationary bed,
and saltation with a stationary bed. The conditions at which any of those modes are dominant
are illustrated in Fig. 3.
Fig. 3
The present section reviews correlations proposed to predict the mechanical behavior of
wood chip-water mixture flows of various modes, as discussed above, in pipes. A deviation
of 30% between estimated values of the friction loss of the same mixture using various
correlations, and a deviation of 300% between estimated values and experimental
measurements were reported in literature, both of which pointed out the need for additional
experimental work. The size and density of the wood chips, as well as the density and
viscosity of the carrier liquid were among those variables not considered in some of the
proposed correlations. However, all the effective variables were included in the more recently
developed equations, where a standard deviation of 12% from previously obtained
experimental data was reported.
3.2. Correlations
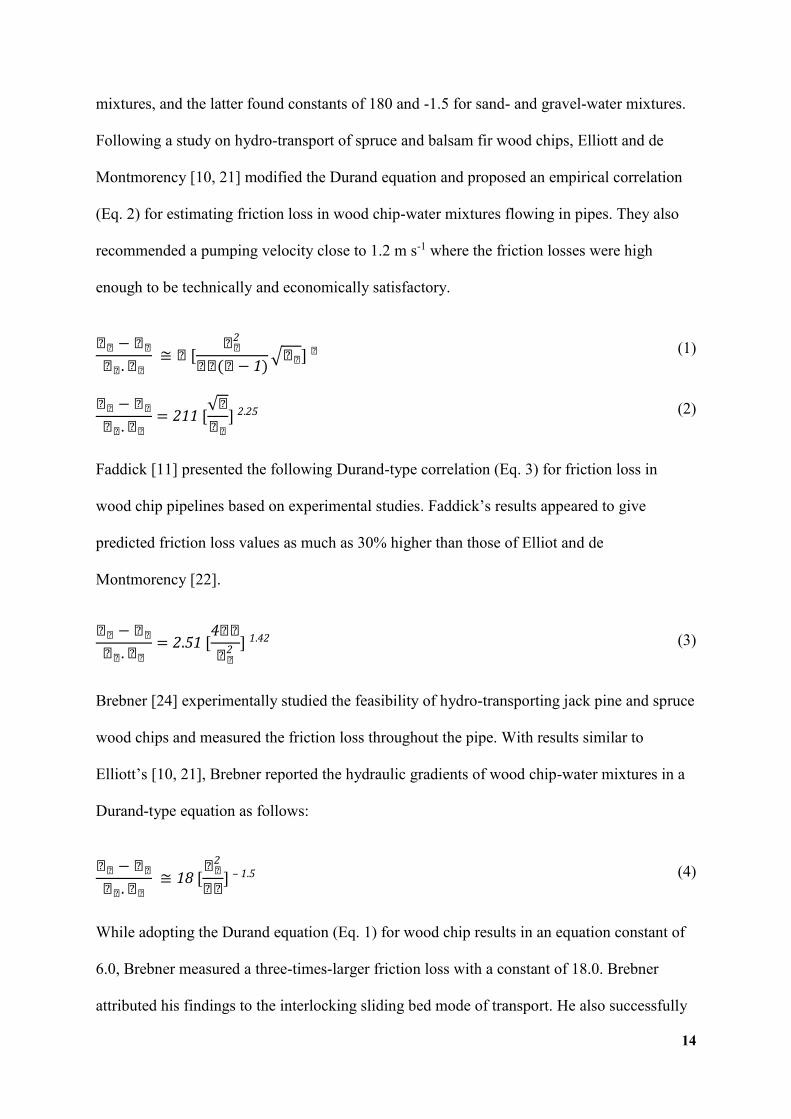
In 1952 Durand and Condolios [46] presented a universal correlation to estimate the friction
loss in solid-liquid pipelines (Eq. 1). α and β constants were later empirically determined by
Worster [47] and Gibert [48]. The former found constants of 81 and -1.5 for coal-water
14
mixtures, and the latter found constants of 180 and -1.5 for sand- and gravel-water mixtures.
Following a study on hydro-transport of spruce and balsam fir wood chips, Elliott and de
Montmorency [10, 21] modified the Durand equation and proposed an empirical correlation
(Eq. 2) for estimating friction loss in wood chip-water mixtures flowing in pipes. They also
recommended a pumping velocity close to 1.2 m s-1 where the friction losses were high
enough to be technically and economically satisfactory.
𝑖𝑖 − 𝑖𝑖
𝑖𝑖.𝑖𝑖 ≅ 𝑖 [
𝑖𝑖2
𝑖𝑖(𝑖 − 1)√𝑖𝑖] 𝑖 (1)
𝑖𝑖 − 𝑖𝑖
𝑖𝑖.𝑖𝑖= 211 [
√𝑖
𝑖𝑖] 2.25 (2)
Faddick [11] presented the following Durand-type correlation (Eq. 3) for friction loss in
wood chip pipelines based on experimental studies. Faddick’s results appeared to give
predicted friction loss values as much as 30% higher than those of Elliot and de
Montmorency [22].
𝑖𝑖 − 𝑖𝑖
𝑖𝑖.𝑖𝑖= 2.51 [
4𝑖𝑖
𝑖𝑖2 ] 1.42 (3)
Brebner [24] experimentally studied the feasibility of hydro-transporting jack pine and spruce
wood chips and measured the friction loss throughout the pipe. With results similar to
Elliott’s [10, 21], Brebner reported the hydraulic gradients of wood chip-water mixtures in a
Durand-type equation as follows:
𝑖𝑖 − 𝑖𝑖
𝑖𝑖.𝑖𝑖 ≅ 18 [
𝑖𝑖2
𝑖𝑖] – 1.5 (4)
While adopting the Durand equation (Eq. 1) for wood chip results in an equation constant of
6.0, Brebner measured a three-times-larger friction loss with a constant of 18.0. Brebner
attributed his findings to the interlocking sliding bed mode of transport. He also successfully

15
tried a pumping velocity as low as 1.5 m s-1 in which, since it was the commonly accepted
velocity for water alone, he found no advantage going below such velocity.
Wasp et al. [40] introduced a model that is widely used in coal pipeline hydro-transport to
classify the particles as either uniformly distributed (homogeneous) or with solid volume
fraction gradient across a cross section (heterogeneous or partially stratified). Wasp’s model
calculates the friction loss per unit pipe length as the sum of losses due to water+suspended
fine particles flow (Eq. 5) and water+coarse particles flow (Eq. 1) together with the amount
of suspended particles contributing to the former flow (Eq. 6). Following an experimental
study on pipeline hydro-transport of wood chips [28], Wasp investigated solid volume
content distribution and calculated the solid volume fraction at the top (Ctop) and middle
(Cmid) of the pipe. It was found that for every 7 chips at the top, there were 100 chips at the
center. This implied that the solid volume content distribution was non-uniform and that the
nature of the flow was heterogeneous.
𝑖𝑖 = (0.0032 + 0.221𝑖𝑖
𝑖−0.237) 𝑖𝑖
2
2𝑖𝑖𝑖
(5)
𝑖𝑖𝑖𝑖𝑖𝑖𝑖
𝑖𝑖𝑖𝑖= −1.8 (
𝑖∞
𝑖𝑖𝑖𝑖√𝑖𝑖
8
) (6)
Wasp et al. [40] examined the compatibility of the Durand correlation with the published data
of Elliott and de Montmorency. While a good agreement was observed for 10-20% solid
volume content, a systematic trend for the Durand equation to predict high values for low
concentrates (i.e., 5% solid volume content) and low values for high concentrates were found.
Zandi and Govatos [49] proposed a criterion to determine the transition in flow regimes from
heterogeneous (suspension) to discontinuous sliding bed with saltation and improved the
original Durand equation by eliminating the corresponding saltation data. Observing the

16
apparent inconsistency between Elliott and de Montmorency’s [10] and Faddick’s [11]
experimental results, Wasp et al. also attempted to refine the Durand equation by modifying
its constants, as proposed by Zandi and Govatos [49]. However, the Zandi and Govatos
correlation did not fit the data any better than the old Durand equation, which pointed out the
need for additional experimental work.
Faddick [30] simulated the pipeline hydro-transport of wood chips using uniform-sized
plastic chips to investigate friction loss parameters. With the data from four sets of
experiments using plastic chips and three sets of experiments (by other researchers) using
wood chips, Faddick proposed calculating the friction loss in wood chip pipelines using the
Darcy-Weisbach equation and evaluated the mixture friction factor using curve-fitting
techniques as follows:
𝑖𝑖𝑖𝑖𝑖 = 𝑖1𝑖𝑖(𝑖
𝑖)𝑖 + 𝑖2𝑖𝑖𝑖(𝑖𝑖
𝑖) + 𝑖3𝑖𝑖(
𝑖
𝑖)𝑖 𝑖𝑖𝑖 (𝑖𝑖𝑖)2 (7)
where a1, a2, a3, x, and y are empirical coefficients determined experimentally.
Metzner and Reed [50] developed a semi-theoretical correlation to analyze friction loss of
laminar non-Newtonian fluids (Eq. 9), and Dodge and Metzner [51] extended their method to
include turbulent non-Newtonian fluids (Eq. 10). Gow found Metzner and Reed’s method for
laminar non-Newtonian flows to be capable of analyzing the friction loss data for wood chip-
water mixtures in pseudo-laminar flow (sliding bed) conditions, where n and K coefficients
were obtained from wood chip-water mixture friction loss data as functions of solid volume
contents. Gow also indicated that the ratio of friction factors of two various pipe diameters
equals the reciprocal ratio of the pipe diameters to the n power (Eq. 11).
𝑖𝑖𝑖 = 𝑖𝑖 𝑖𝑖
2−𝑖 𝑖𝑖
8𝑖−1 𝑖
(8)

17
𝑖𝑖 = 16
𝑖𝑖𝑖 (9)
1
√𝑖𝑖
= 4
𝑖0.75 𝑖𝑖𝑖 (𝑖𝑖𝑖 𝑖𝑖
1−𝑖2) −
0.4
𝑖1.2 (10)
𝑖𝑖,1
𝑖𝑖,2= (
𝑖2
𝑖1)𝑖
(11)
However, the correlation for turbulent non-Newtonian flows proposed by Dodge and Metzner
[51] was not applicable for wood chip-water mixtures in pseudo-turbulent (saltation flow)
regions. Because of the similarity between friction loss curves for wood chip-water mixtures
in pseudo-turbulent regions and clear water lines defined by Prandtl’s universal law of
friction for turbulent pipe flow (Eq. 12), Gow [12] proposed a new correlation (Eq. 14)
where, with friction loss experimental data, a plot of 1
√𝑖𝑖 versus 𝑖𝑖𝑖 (𝑖𝑖𝑖√𝑖𝑖) gives the
constant value A and the quantity (𝑖 − 𝑖𝑖𝑖𝑖𝑖) as the slope and the ordinate intercept,
respectively. Assuming Eq. 13 to be valid, Gow found the coefficients A and logφ to be 4.0
and 0.0 for a 0% solid volume content and E to be -4.0 for all the mixture solid volume
contents. Gow also observed that the wood chip-water mixture viscosity, as defined by Eq.
13, increased with increasing mixture solid volume contents and became larger for larger chip
sizes. Gow found such viscosity variation to be the result of increased particle-wall
interaction due to increased solid volume content and decreased turbulent intensity due to
increased chip size.
1
√𝑖𝑖
= 4 𝑖𝑖𝑖 (𝑖𝑖𝑖 √𝑖𝑖) − 0.4 (12)
𝑖𝑖
𝑖0= 𝑖(𝑖𝑖,𝑖𝑖,𝑖,𝑖𝑖,𝑖50) (13)

18
1
√𝑖𝑖= 𝑖 𝑖𝑖𝑖 (𝑖𝑖𝑖 √𝑖𝑖) + 𝑖 − 𝑖𝑖𝑖𝑖𝑖 (14)
Hunt [22] studied the hydro-transport of wood chip-water mixtures and examined the
applicability of the extrapolation approach to friction loss correlations proposed by Gow [12]
and Faddick [30]. Hunt found the failings on previously developed correlations to be: (1) the
difficulty in calculating the wood chip density and drag coefficients for Eq. 1 by Durand; (2)
the lack of inclusion of the effect of particle-to-pipe size ratio for Eq. 2 by Elliott and de
Montmorency and Eq. 3 by Faddick; (3) the non-consideration of the viscosity of the carrier
liquid (water) for Eqs. 1, 2, and 3; (4) the lack of convergence to the clear water friction
factor for a mixture solid volume content of 0% for Eq. 7 by Faddick; and (5) the
inconsistency with values reported by Elliott and de Montmorency in 200 mm pipes [10] for
Eq. 9 and by Gow for Eq. 14. To correct these deficiencies, Hunt proposed a correlation (Eq.
16) to predict the wood chip-water mixture friction loss in terms of an excess friction factor
(fm fw-1 -1) as a function of four dimensionless parameters (Eq. 15). In the selection of a
mathematical model for fitting the data into a single equation including all four dimensionless
groups of Eq. 15, Hunt modified the mixture solid volume content (Cv) and particle-to-pipe
size ratio (P) to satisfy two boundary conditions; the mixture friction factor should be
identical with that of clear water when the mixture solid volume content equals zero, and the
mixture friction factor for a given mixture solid volume content should increase with an
increase in the particle-to-pipe size ratio. Hunt’s expression for a wood chip-water mixture
friction factor brings about a standard deviation of about 12% from previously reported data
[10, 12, 29, 30] on pipes of 75 mm, 100 mm, 150 mm, 200 mm, and 300 mm diameter.
𝑖𝑖
𝑖𝑖− 1 = 𝑖[(
𝑖𝑖3
𝑖𝑖), (
𝑖1.5𝑖0.5
𝑖),𝑖𝑖, (
𝑖50
𝑖)] (15)

19
𝑖𝑖𝑖𝑖
− 1 = 197(𝑖0.97 𝑖1.312 𝑖0.342
𝑖𝑖 2.964 )(
𝑖𝑖1−𝑖𝑖
)0.838+0.930 𝑖𝑖 (1−𝑖)
(16)
Vaezi et al. [16, 17, 19] conducted a series of experiments on the morphological features of
wheat straw and corn stover agricultural residue (non-wood) biomass, as well as longitudinal
pressure gradients of residue-water mixtures in pipes and the change in the performance of
the centrifugal slurry pumps handling such mixtures. Later, Vaezi et al. [18] used EViews 7.1
[52] econometric software to analyze the pressure gradients measured through the
experimental course of the pipeline transport of wheat straw- and corn stover-water mixtures.
Introducing a fourth-order polynomial equation and using the nonlinear least square (NLS)
regression analysis model, they developed an empirical model (Eq. 17) capable of predicting,
with an uncertainty less than 10%, the dependent variable of longitudinal pressure gradient
(kPa m-1) as a function of the independent variables of slurry bulk velocity (m s-1), slurry
solid mass content (dry matter, %), and solid particle size representative (particle shape
factor, dimensionless). The shape factor was defined to take into account the physical
properties and shape characteristics of the particles (Eqs. 18 and 19) and to extend the
specific results obtained here to other fibrous non-wood particles. Vaezi et al. also adopted
three scale-up approaches to incorporate the pipeline specification (i.e., pipeline diameter) in
the correlation where it was found by increasing the diameter of the pipe, the pressure
gradient will be modified proportional to D-1.2.
∆𝑖
𝑖= (1.22𝑖 − 1.97𝑖2 + 0.16𝑖𝑖
2 − 0.001𝑖𝑖2𝑖𝑖
2 + 0.64𝑖3 + 0.0006𝑖𝑖3 )(
𝑖
0.05)−1.2 (17)
𝑖 =𝑖𝑖
𝑖𝑖×∑𝑖𝑖=1 (𝑖𝑖𝑖,𝑖𝑖𝑖𝑖𝑖×𝑖)
𝑖 =𝑖𝑖
𝑖𝑖×∑𝑖𝑖=1 (𝑖𝑖𝑖,𝑖×𝑖𝑖,𝑖)
(18)

20
𝑖𝑖𝑖𝑖𝑖 𝑖𝑖𝑖𝑖𝑖𝑖 = 𝑖 × √𝑖𝑖𝑖𝑖𝑖,𝑖𝑖𝑖𝑖𝑖
𝑖𝑖𝑖Shape factor (S) = 𝑖 × √
𝑖𝑖𝑖
𝑖𝑖𝑖 (19)
4. Economic Assessments
4.1. Introduction
Based on experimental measurements and empirical correlations reported in the literature, a
few researchers studied the economic feasibility of pipelining wood chip-water mixtures to
processing plants. The concept of economy of scale was found to be highly applicable to
pipeline systems, the water required at the pipeline inlet was reported to be not exceptionally
large (in relation to the amount of resources available on most timber limits), and a 25%
variation in the total cost of a pipeline system was obtained by using various pressure drop
correlations. It was shown that the power required and, accordingly, the operating costs of the
pipeline system would decrease and the capital costs of the pipeline system would increase
with an increase in solid volume content, decrease in mixture velocity, and increase in
pipeline length. Furthermore, capital charges were reported to account for more than 70% of
the total transportation cost.
4.2. Techno-economic Studies
Following an empirical study on pipeline hydro-transport of pulpwood chips, Elliot and de
Montmorency [10, 21] studied the economic feasibility of wood chip transport via a
hypothetical system of pipelines leading from a landing to the mill (Fig. 4). The forest field
included a productive area of 2300 km2 with an annual cut of 900 dam3. The aluminum
pipeline was composed of surface-laid branch pipelines converging into a buried feeder line
that discharged into a buried main line. Elliot and de Montmorency argued that the amount of
water required, e.g., 4000 dam3 y-1 to transport 1500 dam3 y-1 of wood chips in a 40% solid

21
volume content mixture, was not exceptionally large in terms of the amount of resources
available on most timber limits. Further, they presented the power loss per kilometer distance
for 150 mm, 200 mm, and 250 mm diameter pipes carrying wood chips at mixture solid
volume contents of 20%, 30%, and 40%. It was shown that power and operating costs could
be lowered by increasing the mixture solid volume content and decreasing the pumping
velocity, which would also increase capital investments. The direct economic benefits named
by researchers included low unit transportation costs for an annual capacity over 700 dam3, a
minor increase in transportation costs over a period of 20 years due to low labor
requirements, low depreciation compared to new road or rail construction, and a drastic
reduction in mill, forest, and in-transit inventories.
Fig. 4
Using only those friction losses found experimentally, Brebner [24] calculated the cost of
transport of a 35% solid volume content wood chip-water mixture in a 200 mm diameter
pipeline at 2.0 m s-1 pumping velocity and 55% pump/motor efficiency to be 0.095 $ t-1km-1.
Brebner did not measure wear, corrosion, or erosion in the pipe (all of which could increase
both the operating and the capital costs).
The Georgian Research Institute of Forest Industry fabricated a laboratory-scale pipeline
facility to investigate the technology and the economy of pipeline transport of wood chips-
water mixtures for pulp and paper production purposes [25]. The research institute derived
the cost estimates based on the guide on canalization and water system construction
(Leningrad water canal report) while taking into account the cost of steel pipes, installations,
and digging 2 m trenches in dry soil. Amortization costs were considered to be 3.5%,
including all repairs and complete replacement. The annual maintenance cost was estimated
at 6000 $ km-1 and the transportation cost was estimated at 0.08 $ m-3 km-1. With this means

22
of transport, the cost of production of pulpwood was calculated to reduce by 80% per cubic
meter of solid wood chips.
Wasp et al. [28], while reviewing wood chip pipelining, discussed the related economics. Fig.
5(a) presents the investment cost and Fig. 5(b) shows the capital costs (including carbon steel
pipe, external coating, installation costs, positive displacement pump stations and related
facilities, communication system, water supply system, chip injection facilities, terminal
dewatering facilities, and indirect costs including a contingency allowance, interest during
construction, working capital, and engineering management) and the operating costs
(including electrical power costs for driving the pumps and mixing, costs of operating
personnel for the pipeline system, an allowance for chemical corrosion inhibitors, supplies
and maintenance for the pipeline and pump stations, administration costs, and a contingency
allowance) of such pipelines based on a 100 km long pipeline capable of hydro-transporting
various amounts of so-called green (35% moisture content) wood chips at 20% solid volume
content. Wasp also found the sensitivity to change in length to be quite low, e.g., a 50%
reduction in length causes a 7% increase in total unit transportation costs. In addition to
showing the concept of economy of scale, which is found to be highly applicable to pipeline
systems, Fig. 5 shows that capital charges account for more than 70% of the total
transportation cost, i.e., once the pipeline is constructed, 70% of the transportation costs are
not subject to increase. This is a distinct advantage of pipeline hydro-transport over nearly
every other mode of transport. To achieve these results, Wasp used Elliot and de
Montmorency’s [10] friction loss data. Using Faddick’s [11] data increased the total and
capital costs by 25%.
Fig. 5

23
Hunt [53, 54] conducted an analysis to determine the conditions under which a pipeline
system might be economically competitive with other methods of transporting wood chips to
processing plants. The economic model to determine the cost of transporting one tonne of
wood chips for one kilometer by a given transportation system included the capital
investment, operating expenses, and associated overhead charges. Hunt subdivided the costs
into seven groups, each depending on one or more of the 23 variables selected to formulate
the algebraic expressions that relate the hydraulic properties of the pipeline and physical
properties of the wood chips to the economics of the system. Using Brebner’s friction loss
equation [24], the total cost per one tonne of wood chips per unit distance can be found with
Eqs. 23 to 30 for each of the seven cost groups previously mentioned.
𝑖𝑖 = 𝑖𝑖[(𝑖𝑖 + 1)𝑖𝑖𝑖𝑖 − 1] + 1 (20)
𝑖 =1
216𝑖𝑖5
𝑖
𝑖𝑖𝑖𝑖𝑖𝑖 (21)
𝑖𝑖 = 31,680(0.547𝑖−1.42 + 1)𝑖𝑖𝑖 +𝑖𝑖
𝑖 (22)
𝑖𝑖 = ∑
7
𝑖=1
𝑖𝑖 (23)
𝑖1 = 0.000753 𝑖1
𝑖 𝑖𝑖𝑖𝑖
𝑖𝑖 𝑖𝑖
𝑖𝑖 (24)
𝑖2 =𝑖2 𝑖
365 𝑖(𝑖𝑖𝑖) (25)
𝑖3 = 0.000000115 𝑖3
𝑖 𝑖𝑖𝑖𝑖
𝑖𝑖 𝑖𝑖
𝑖𝑖(𝑖𝑖𝑖) (26)
𝑖4 =𝑖4 + 𝑖5
365 𝑖(𝑖𝑖𝑖) (27)

24
𝑖5 =𝑖6
365 𝑖 𝑖 (28)
𝑖6 =1
365 𝑖 𝑖7
𝑖𝑖
𝑖𝑖𝑖+ 𝑖8 (29)
𝑖7 = 0.000240 1 − 𝑖𝑖
𝑖𝑖
𝑖9
𝑖𝑖𝑖𝑖 𝑖 (30)
Table 2
Developing a computer program and using the cost data listed in Table 2, Hunt obtained the
cost per tonne per unit distance for transporting various amounts of wood chips per day (500
t, 1000 t, and 2000 t). An investigation of the effect of mixture solid volume content, pipe
diameter, pipe length, and wood chip transport capacity per day on the total cost per tonne per
unit distance (e.g., Fig. 6(a)) showed a 10% reduction in the unit cost when the same volume
was transported in a line twice as long and a 30% reduction in the unit cost when the volume
was double for a given distance. 20-22% mixture solid volume content was found to be the
maximum working solid volume content for wood chip pipelines. Hunt also indicated that the
optimum solid volume content to transport 500 t d-1 of wood chips over 160 km was
approximately 21% for 200 mm diameter, 14% for 250 mm diameter, and 9% for 350 mm
diameter pipelines.
Hunt [55] collected data for the cost of transportation by truck and rail from 43 pulp mills in
the Great Lake states, as well as northwest, northeast, and southern regions in U.S., and
compared the cost per tonne per unit distance for pipeline hydro-transport of wood chips with
that for truck and rail haul (Fig. 6(b)). It was found that hydro-transport of wood chips in
quantities greater than 1000 t d-1 could compete economically with the rates for truck haul
and northern railroad haul for distances up to 88 km. However, if the cost of the construction

25
of highways and railroads was also included in Hunt’s transportation cost database, the cost
of pipeline hydro-transport would be much more favorable.
Fig. 6
Kumar et al. [13-15] conducted a series of techno-economic analyses on pipeline hydro-
transport of wood chips and pipeline hydro-transport and simultaneous saccharification of
corn stover. Drawing on the works of Wasp et al. [28] on pipelining wood chips and Liu et al.
[56] on pipelining compressed coal cylinders, Kumar et al. [15] developed pipeline cost
estimates for transporting wood chip-water mixtures; these estimates are shown on Table 3
and Fig. 7(a). Comparing the cost of truck delivery of wood chips with the cost of pipeline
transport of a wood chip-water mixture with solid volume content of 30% over an arbitrary
pipeline length of 160 km, the marginal cost of pipeline hydro-transport was found to be
higher than truck delivery cost at capacities <0.5 M t y-1 dry wood chips for a pipeline
without the return line for the carrier liquid (one-way). The corresponding minimum capacity
for a pipeline with the return line for the carrier liquid (two-way) was 1.25 M t y-1 dry wood
chips. It was shown that the minimum length of the pipeline to recover the fixed costs of a
pipeline with a capacity of 2.0 M t y-1 dry wood chips was 75 km for a one-way pipeline and
470 km for a two-way pipeline (in addition to the initial 35 km truck haul to the pipeline
inlet). In addition, the authors investigated the drop in the lower heating value (LHV) of
biomass because of the take-up of the carrier liquid and discussed the limited application of
pipeline hydro-transport of biomass to supply aqueous-based processes only, e.g., bio-ethanol
production or supercritical water gasification.
Table 3
Kumar et al. [15] also investigated the pipeline hydro-transport of corn stover and found the
one-way pipeline at a scale of 1.0 to 2.0 M t y-1 dry corn stover and mixture solid volume

26
content of above 15% to cost less than truck delivery (Fig. 7). To estimate the corn stover-
water mixture friction factor in pipes, Kumar et al. used Hunt’s correlation [22], which was
originally proposed for wood chip-water mixtures in pipes. However, they examined the
sensitivity to friction factor parameter and found that a variation of -50% to +100% in friction
factor results in a -16% to +31% change in the distance variable cost of pipeline hydro-
transport of corn stover, a sensitivity that did not invalidate the conclusion of the study.
Fig. 7
Ellis et al. [61] considered the possibility of partial processing-in-transit through solid-liquid
mixture pipelines. Nardi [34] suggested a similar technique for wood chips to inject the
chemicals into a heated section near the receiving facility. Kumar et al. [15] examined the
simultaneous saccharification and transport (SST) on a corn stover hydro-transport pipeline.
It was found that, since the current cellulase enzyme (that converts starch into sugar) causes
an acidic environment in the pipe, the SST requires a prohibitively expensive stainless steel
pipeline that makes it technically and economically inapplicable. Furthermore, residence time
and mixture temperature are critical factors, as National Renewable Energy Laboratory
(NREL) suggests a contact time of 35 hr at a saccharification temperature of 65°C [62]. The
fuel cost for heating a corn stover-water mixture by 40°C using natural gas at 5 $ GJ-1 was
estimated to be more than 0.069 $ L-1 of produced ethanol. Insulation might also be required,
specifically for smaller capacity pipelines buried in the soil. Furthermore, it was found that
insulating a 100 mm diameter pipeline carrying 1.5 M t y-1 dry corn stover with 25 mm of
foam would cause an approximately 15% increase in the installed cost of a corn stover-water
mixture pipeline and a 10% increase in the distance variable cost.
5. Conclusion

27
Using pipeline hydro-transport to replace traditional modes of delivery i.e., road, rail, and
river, is a major step towards building large-scale bio-based facilities. This paper reviewed
the literature published on pipeline hydro-transport of wood chips and agricultural residue
biomass for pulp and paper production, as well as for fuel and energy generation. The
technical challenges and economic issues were reviewed, and correlations to predict biomass-
water mixture mechanical behavior were introduced.
None of the studies conducted either experimentally or theoretically considered wear,
corrosion, or erosion in a pipeline, all of which could impact the mechanical specifications
(e.g., friction loss) and economic features (e.g., capital cost) of the pipeline and which should
be measured/calculated in future studies. As described in this paper, pipeline hydro-transport
of wheat straw and corn stover biomass has been experimentally studied on a 50 mm
diameter and 25 m long (laboratory-scale) horizontal pipeline facility. The scaling up of such
a pipeline must be studied to understand how the change in pipeline diameter and orientation
would change the slurry mechanical behavior. More research needs to be conducted to
develop empirical correlations to estimate corresponding slurry friction loss. Such
correlations could be used to study the economy of agricultural residue pipelines, as previous
studies on this field used friction loss correlations originally proposed for wood chip-water
mixtures instead. Water mixtures of other sorts of biomass materials could be also
investigated to understand how biomass physical specifications would change slurry
mechanical behavior. Chemical processing-in-transit through pipeline hydro-transport of
biomass materials is another interesting issue that, although its economic viabilities have
been analyzed, needs its mechanical and chemical feasibility to be experimentally
investigated.
Acknowledgements

28
The authors are grateful to Alberta Innovates – Bio Solutions, Natural Sciences and
Engineering Research Council of Canada (NSERC), and Biorefining Conversion Network of
Canada (BCN) for the financial and equipment support to carry out this project. The authors
are also thankful to Astrid Blodgett for assistance with editing. However, all the views are
solely the authors’ and have not been endorsed by any other party.
References
[1] Abulnaga B. Slurry systems handbook. New York, NY, USA: McGraw-Hill; 2002.
[2] Bain AJ, Bonnington ST. The hydraulic transport of solids by pipeline. New York,
NY, US: Pergamon Press; 1970.
[3] Weston MD, Worthen L. Chevron phosphate slurry pipeline commissioning and start-
up. 12th International conference on slurry technology; March 31 – April 3; Washington, DC,
USA; 1987.
[4] How pipelines work? Paris (France): TRAPIL Petrolum pipeline transport company.
[Cited April 2013] Available from http://www.trapil.fr/uk/comcamarche4.asp.
[5] Thiesmeyer LR. Hydraulic transport of wood chips by pipeline. In: United
Nation/FAO. Conference on pulp and paper developement in Africa and the near east; Cairo,
Egypt; 1965. p. 865-876.
[6] Duffy GG. Measurement, mechanisms, and models: some important insights into the
mechanisms of flow of fibre suspensions. Trans Annu Nordic Rheol Soc 2006; 14: 19-31.
[7] Lee PFW, Duffy GG. Analysis of drag reducing regime of pulp suspension flow.
Tappi 1976 (a); 59(8): 119-22.
[8] Moller K. Correlation of pipe friction data for paper pulp suspensions. Ind Eng Chem
Proc Des Dev 1976; 15(1): 16-19.

29
[9] Paul T, Duffy G, Chen D. New insights into the flow of pulp suspensions. Tappi
2001; 1(1); 74-80.
[10] Elliott DR, de Montmorency WH. The transportation of pulpwood chips in pipelines.
Montreal: Pulp and Paper Institute of Canada (PAPRICAN); August 1963. Report No.: 144.
[11] Faddick RR. The aqueous transport of pulpwood chips in a four inch aluminum pipe
[dissertation]. Kingston (ON): Queen's University; 1963.
[12] Gow JL. Hydraulic transport of woodchips in pipelines [dissertation]. Bozeman (Mt):
Montana State University; 1971.
[13] Kumar A, Cameron JB, Flynn PC. Pipeline transport of biomass. Appl Biochem
Biotech 2004; 113(1): 27-39.
[14] Kumar A, Cameron JB, Flynn PC. Large-scale ethanol fermentation through pipeline
delivery of biomass. Appl Biochem Biotech 2005; 121(1): 47-58.
[15] Kumar A, Cameron JB, Flynn PC. Pipeline transport and simultaneous
saccharification of corn stover. Biores Tech 2005; 96(7): 819-29.
[16] Vaezi M, Katta AK, Kumar A. Investigation into the mechanisms of pipeline
transport of slurries of wheat straw and corn stover to supply a bio-refinery. Biosystems Eng
2014; 118(1): 52-67.
[17] Vaezi M, Kumar A. The flow of wheat straw suspensions in an open impeller
centrifugal pump. Biomass and Bioenergy 2014 October; 69: 106-23.
[18] Vaezi M, Kumar A. Development of correlations for the flow of agricultural residues
as slurries in pipes for Bio-refining. Biosystems Eng 2014 August; 127: 144-58.
[19] Vaezi M, Pandey V, Kumar A, Bhattacharyya S. Lignocellulosic biomass particle
shape and size distribution analysis using digital image processing for pipeline hydro-
transportation. Biosystems Eng 2013; 114(2): 97-112.

30
[20] Vaezi M, Nimana B, Kumar A. Is the pipeline hydro-transport of wheat straw and
corn stover to a biorefinery realistic? Biofuels Bioprod Bioref 2015; XX: XX.
[21] Elliott DR. The transportation of pulpwood chips in pipelines. Pulp Paper Mag Can
1960 May; 61: 170-75.
[22] Hunt WA. Friction factors for mixtures of wood chips and water flowing in pipelines.
4th International Hydrotransport Conference. Banff, AB, Canada; 1976. p. 1-18.
[23] O'donnell JP. Diversification of owners is common in products pipeline. Oil Gas J
1964; 62: 88-100.
[24] Brebner A. On pumping of wood chips through 4 inch aluminum pipeline. Can J
Chem Eng 1964; 42(3): 139-42.
[25] Gulisashvili BG, Nodaraya VL, Korobov VV. Transport of wood chips by water in
pipeline. Woodlands Research Index 1964; 150: 5-7.
[26] Hewlett Packard Co. Dymec system speeds wood chip pipeline test. Measure Mag
1965 February: 6-7.
[27] Elliott DR. Chiplines-closer than we think. Pulp Paper Mag 1964 August; 363: 27-29.
[28] Wasp EJ, Aude TC, Thompson TL, Bailey CD. Economics of chip pipelining. Tappi
1967; 50(7): 313-18.
[29] Soucy A. Data supplied to R.R. Faddick by Laval University. Quebec City, QC; 1968.
[30] Faddick RR. Hydraulic transportation of solids in pipelines [dissertation]. Bozeman
(Mt): Montana State University; 1970.
[31] Luk J. Pipeline transport of wheat straw slurry [dissertation]. Edmonton (AB):
University of Alberta; 2010.
[32] Mohamadabadi HS. Characterization and pipelining of biomass slurries [dissertation].
Edmonton (AB): University of Alberta; 2009.

31
[33] Luk J, Mohammadabadi HS, Kumar A. Pipeline transport of biomass: Experimental
development of wheat straw slurry pressure loss gradients. Biomass and Bioenergy 2014
May; 64: 329-36.
[34] Nardi J. Pumping solids through a pipeline. Chem Eng 1959; 66(15): 26-33.
[35] Coffey GR, Partridge VA. Coal slurry pipelines: the ETSI project. The Right of Way
J 1982 August: 11-16
[36] de Souza, JCM, Braganca ACCR, da Cruz Rodrigues CA, Lima ELG. The Samarco
pipeline - 26 years of operation. 16th International Hydrotransport Conference; Santiago,
Chile; 2004. p. 659-73.
[37] Winter CH, Sillers R, Glowach AM. High temperature insulated coating aids
construction of Alberta bitumen pipeline. Oil Gas J 2003 January; 101: 56-58.
[38] Billington DP, Jackson DC, Melosi MV. The history of large federal dams: planning,
design, and construction. Denver, CO, US: U.S. Department of the Interior, Bureau of
Reclamation; 2005.
[39] Parham CP. The golden dream: a history of the St. Lawrence seaway. Michigan Hist
Rev 2011; 37(2): 124-25.
[40] Wasp EJ, Regan TJ, Withers J, Cook PAC, Clancey JT. Crosscountry coal pipeline
hydraulics. Pipeline News 1963; 35(7): 20-28.
[41] Schmidt RE. An investigation of the effects of pressure and time on the specific
gravity, moisture content, and volume of wood chips in a water slurry [dissertation]. Montana
(Mt): Montana State University; 1965.
[42] Rasband WS. ImageJ. Research Services Branch, U.S. National Institutes of Health,
Bethesda, Maryland; 2008.
[43] Duffy GG. A review and evaluation of design methods for calculating friction loss in
stock piping systems. Tappi 1976; 59(8): 124-27.

32
[44] Newitt DM, Richardson JF. Hydraulic Conveying of Solids. Nature 1955; 175: 800-
01.
[45] Brebner A. An introduction to aqueous hydraulic conveyence of solids in pipelines.
Queen's University, Kingston, Ontario: The National Research Council of Canada and The
Ontario Mining Association; 1962. Report No. 21
[46] Durand R, Condolios G. The hydraulic trasnport of coal and solid materials in pipes.
Conference on hydraulic transport of coal; London; 1952. p. 39-55.
[47] Worster RC. Hydraulic transport of solids. Conference on hydraulic transport of coal;
London; 1952.
[48] Gibert R. Hydraulic transport and discharge of mixtures in pipes. Annals of Roads
and Bridges; 1960. Report No. 12-17.
[49] Zandi I, Govatos G. Hetrogeneous flow of solids in pipelines. ASCE Hydraul Div J
1967 May; 93: 145-59.
[50] Metzner AB, Reed JC. Flow of non-Newtonian fluids - correlation of the laminar,
transition, and turbulent flow regions. Aiche J 1955; 1(4): 434-40.
[51] Dodge DW, Metzner AB. Turbulent flow of non-Newtonian systems. Aiche Journal
1959; 5(2): 189-204.
[52] Quantitative Micro Software (QMS), EViews 7.1. IHS Global Inc., Irvine, CA, USA;
2010.
[53] Hunt WA. Economic analysis of wood chip pipeline. Forest Prod 1967; 17(9): 68-74.
[54] Hunt WA. Continuous flow transport of low value forst products by hydraulic
pipeline. Bozman (Mt): Intermountain Forest and Range Experiment Station; 1962
[55] Scheer AC. Survey on wood chips transportation charges. Bozman (Mt):
Intermountain Forest and Range Experiment Station; 1962.

33
[56] Liu H, Noble J, Zuniga R, Wu J. Economic analysis of coal log pipeline transportation
of coal. Columbia, Missouri: Capsule Pipeline Research Center (CPRC), University of
Missouri; 1995. Report No. 95-1.
[57] Marrison CI, Larson ED. Cost versus scale for advanced plantation-based biomass
energy systems in the US and Brazil. 2nd Biomass Conference of the Americas: Energy,
Environment, Agriculture, and Industry; Portland, OR; 1995. p. 1272-90.
[58] Jenkins BM, Dhaliwal RB, Summers MD, Bernheim LG, Lee H, Huisman W, et al.
Equipment performance, costs, and constraints in the commercial harvesting of rice straw for
industrial applications. American Society of Agricultural Engineers (ASAE) Conference.
Milwaukee, WI, US: 2000.
[59] Kumar A, Cameron JB, Flynn PC. Biomass power cost and optimum plant size in
western Canada. Biomass & Bioenergy 2003; 24(6): 445-64.
[60] Glassner D, Hettenhaus J, Schechinger T. Corn stover collection project. Bioenergy
Conference. Madison, WI, USA; 1998, p. 1100-10.
[61] Ellis HS, Redberger PJ, Bolt LH. Slurries: basic principles and power requirements.
Indust Eng Chem J 1963; 55(8): 18-26.
[62] Aden A, Ruth M, Ibsen K, Jechura J, Neeves K, Sheehan J, et al. Lignocellulosic
biomass to ethanol process design and economics utilizing co-current dilute acid
prehydrolysis and enzymatic hydrolysis for corn stover. Golden, Colorado: National
Renewable Energy Laboratory (NREL); 2002. Report No. NREL/TP-510-32438.

34
a
)
b
)
Fig. 1: a) Drag reduction as a function of slurry solid mass content (data not available for
19.2 mm corn stover particles), b) Pressure drop vs. pumping velocity for 5.4% slurries of
various size wheat straw particles [16], Figures reproduced with the permission of Elsevier
Publication (license number: 3413821384248)

35
a) b)
Fig. 2: Centrifugal slurry pump performance characteristics (pump head and efficiency) over
a range of flow rates (0.5 to 5.0 m s-1) and dry matter solid mass contents (2.0 to 8.8%) at 185
rad s-1 (1765 rpm). a) characteristics of 6.4 mm wheat straw particle slurries; b)
characteristics of <3.2 mm wheat straw particle slurries [17] Figures reproduced with the
permission of Elsevier Publication (license number: 3587221437445)

36
a) b)
Fig. 3: Various modes of mixture flow in pipes at a) constant mixture concentration, pipe
diameter, and particle density, b) constant pipe diameter, particle size, and particle density
[45]

37
Fig. 4: Layout of the proposed system by Elliot and de Montmorency [10, 21] for the pipeline
hydro-transport of wood chips

38
a) b)
Fig. 5: Wood chip pipeline capital and operating costs vs. pipeline capacity for green chips at
35% moisture content, 20% wood chip-water mixture solid volume content, and 310
operation days per year (operating factor 85%) [28], Figures reproduced with the permission
of Technical Association of the Pulp and Paper Industry (TAPPI) (license number:
3414870205753)

39
a) b)
Fig. 6: a) The cost of pipeline hydro-transport as a function of pipeline diameter and mixture
solid mass content for capacities of 1000 t d-1 over 160 km, b) Comparative transportation
costs (both the graphs are based on 365 operation days per year) [53], Figures reproduced
with the permission of Forest Products Research Society (license number: 3413841423702)

40
a) b)
Fig. 7: a) Truck and pipeline hydro-transport costs of wood chips without the return line for
the carrier liquid [13], b) Distance variable cost of truck and pipeline hydro-transport of corn
stover at different solid volume contents without the return line for the carrier liquid [15],
truck transport (1): study by Marrison and Larson [57], truck transport (2): study by Jenkins
et al. [58] and Kumar et al. [59], truck transport (3): study by Glassner et al. at NREL [60],
Figures reproduced with the permission of Springer (license number: 3413831485326) and
Elsevier Publications (license number: 3415470571765)

41
Nomenclature
d1, d2, d3 dummy variables, dimensionless
a1, a2, a3 empirical coefficients, dimensionless
x, y empirical coefficients, dimensionless
α, β empirical coefficients, dimensionless
m number of cost group, from 1 to 7
e combined efficiency of motor-pump drivers, %
g gravitational acceleration, m s-2
k von Karman constant (0.4 in this paper)
s specific gravity (the ratio of density to density of water), dimensionless
d representative chip dimension defined, m
n fluid behavior index, dimensionless
z distance from the pipe invert, m
ν kinematic viscosity of the carrier fluid, m2 s-1
crf charge on capital investment to cover interest, depreciation, etc.
r.m.s. root mean square
K fluid consistency index, units consistent with those in generalized Reynolds number
A empirical constant, dimensionless
E empirical constant, dimensionless
P ratio of characteristic particle dimension (here d50) to pipe diameter, dimensionless
D pipe internal diameter, m
W tonnes per day of oven-dry chips, t d-1 dry biomass
L length of the pipeline, km
S solid particle shape factor, dimensionless
ΔH L-1 longitudinal pressure gradient, kPa m-1
MC Mass fraction of water in the solid, %
LHV lower heating value, J kg-1
AS solid particle area, mm2
X1 energy cost, $ t-1km-1
X2 installed cost of pipeline and its appurtenance (valves, meters, flow controls), $ t-1km-1
X3 installed cost of pump station, $ t-1km-1
X4 installed cost of injection and separation system, $ t-1km-1
X5 cost of fixed salaries, wages, and operations that are independent of length of pipeline or number of pump stations, $ t -1km-1
X6 cost of variable salaries, wages, and operations that are dependent on the length of the pipeline and the number of pumping
stations, $ t-1km-1
X7 cost of water treatment, $ t-1km-1
Xm each of the 7 cost groups, $ t-1km-1
XT total cost of pipeline hydro-transport, $ t-1km-1
Xgw geometric mean width, mm
Xgl geometric mean length, mm
R1 cost of electrical energy, $ kWh-1
R2 installed cost of pipeline, including right-of-way, $ m-1km-1
R3 cost of pump station and controls, $ per installed kW
R4 cost of wood chip injection system, $ t-1d-1 dry biomass
R5 cost of wood chip separation system, $ t-1d-1 dry biomass
R6 annual cost of fixed salaries, wages, and operation maintenance, exclusive of pipeline maintenance and pump station operation

42
R7 annual wages, salaries, etc., for pump stations, $ per pump station
R8 annual maintenance cost of pipeline, $ km-1
R9 cost of water and treatment, $ Mm-3
d50 particle length at respective 50% cumulative number fraction of particles, mm
ZT difference in elevation between inlet and discharge of the pipe, m
Sm specific gravity of wood chip-water mixture, dimensionless
HT head due to friction and difference in elevation, mH2O km-1
Hsa total head developed per pump station, mH2O
Sodc specific gravity of oven-dried wood chips, dimensionless
Cv solid volume content, %
Cm solid mass content, %
Cd particle drag coefficient, dimensionless
Ctop solid volume content at z D-1 = 0.92 (z is the vertical position from the pipe bottom)
Cmid solid volume content at z D-1 = 0.5
Ms mass of solid particle sample, kg
Ql carrier liquid (water) flow rate, m3 s-1
Qs wood chip flow rate, m3 s-1
Qs,max maximum wood chip flow rate, m3 s-1
Ref Reynolds number of water and suspended fine particles flow, dimensionless
Reg generalized Reynolds number, dimensionless
Rem mixture Reynolds number, dimensionless
Rew clear water Reynolds number, dimensionless
Vm mean mixture velocity, m s-1
V∞ particle settling velocity, m s-1
im hydraulic gradient of mixture, mH2O mpipe-1
iw hydraulic gradient of water, mH2O mpipe-1
if hydraulic gradient of water and suspended fine particles flow, mH2O mpipe-1
fF Fanning friction factor, dimensionless
fD Darcy-Weisbach friction factor, dimensionless
fm mixture friction factor, dimensionless
ff friction coefficient of the water and fins particles flow, dimensionless
fw clear water friction factor, dimensionless
μ0 dynamic viscosity of clear water, N.s m-2
μm viscosity of mixture, N.s m-2
ρp density of solid particle, kg m-3
ρf density of water and suspended fine particles mixture, kg m-3
ρw density of clear water, kg m-3
ρm density of mixture, kg m-3
φ the ratio of mixture viscosity to clear water viscosity, dimensionless
λ parameter dependent of the flakiness of the particle, dimensionless

43
Table 1: Historical development of biomass slurry pipelines
Organization Time Location Biomass
Feedstock
Pipeline
Length
Pipeline
Diameter Particle Dimension
Reference
No.
D.T. Elliott and
W.H. de
Montmorency
Pulp and Paper
Research Institute of
Canada
1958 Quebec,
Canada
Spruce and balsam
fir wood chips 160 m 200 mm d50 = 6.4 mm [10, 21]
Shell Pipeline
Company 1962 Texas, U.S. Wood chips 1220 m 200 mm --- [22, 23]
R.R. Faddick
Queen’s University 1963
Ontario,
Canada Wood chips --- 100 mm --- [11]
Brebner
Queen’s University 1964
Ontario,
Canada
Jack pine and
spruce wood chips 120 m 100 mm d50 = 6.4 mm [24]
Georgian Research
Institute of Forest
Industry
1964
Georgia,
Soviet
Union
Wood chips 48 m 150 mm --- [25]
A co-operative
enterprise of 20
companies
1964 Ontario,
Canada Wood chips 610 m
150 mm
200 mm
250 mm
15 mm×12 mm×6 mm [5, 26, 27]
E.J. Wasp
Bechtel Crop. 1967
California,
U.S. Wood chips --- 200 mm
19 mm×12.7 mm×2.54
mm [28]
A. Soucy
Laval University 1967
Quebec,
Canada Wood chips --- 150 mm --- [29]
R.R. Faddick
Montana State
University
1970 Montana,
U.S.
Uniform-sized
plastic chips 210 m
75 mm
100 mm
12.7 mm×9.5 mm×2.54
mm [30]
J.L. Gow
Montana State
University
1971 Montana,
U.S.
Lodgepole pine
wood chips ---
100 mm
150 mm d50 = 9.5 mm [12]
W.A. Hunt
Montana State
University
1976 Montana,
U.S
Lodgepole pine
wood chips
91 m
183 m
200 mm
300 mm d50 = 28.4 mm [22]
University of
Alberta
2007-
2015
Alberta,
Canada
Wheat straw
Corn stover 25 m 50 mm d50 = 1.9 mm to 8.3 mm
[16-19, 31-
33]

44
Table 2: Data for a generalized economic model by Hunt [53] (Originally presented in
imperial units). Table reproduced with the permission of Forest Products Research Society
(license number: 3413841423702)
Item Value Unit Item Value Unit Item Value Unit
crf 0.200 Sodc 0.40 R5 107.8 $ t-1d-1
e 0.650 ZT 0 m R6 323,400 $ y-1
f 0.018 R1 0.05 $ kWh-1 R7 51,000 $ per pump station
g 9.8 m s-2 R2 615,600 $ m-1km-1 R8 425.3 $ km-1y-1
Hsa 244 m R3 1000 $ kW-1 R9 0.1423 $ m-3
M 1.80 R4 53.9 $ t-1d-1

45
Table 3: Economic and technical parameters used by Kumar et al. to estimate the capital and
operating costs of a wood chip-water mixture pipeline [13], Table reproduced with the
permission of Springer Publication (license number: 3413831485326)
Item Value Unit
Life of pipeline 30 y
Contingency cost 20 % of total cost
Engineering cost 10 % of total capital cost
Discount rate 10 %
Operating factor 0.85
Power cost 50 $ MWh-1
Velocity of slurry 1.5 m s-1
Velocity of water in water return line 2.0 m s-1
Maximum pressure 4100 kPa
Pump efficiency 80 %
Scale factor applied to inlet, outlet, and booster station facilities excluding pumps 0.75