Pipeline Deposit Assessment and Cleaning Techniques · Pipeline Deposit Assessment and Cleaning...
38
Pipeline Deposit Assessment and Cleaning Techniques Rachel Riddell [email protected] +44 1224 776680
Transcript of Pipeline Deposit Assessment and Cleaning Techniques · Pipeline Deposit Assessment and Cleaning...
Pipeline Deposit Assessment
and Cleaning Techniques
Rachel Riddell
+44 1224 776680

© 2014 HALLIBURTON. ALL RIGHTS RESERVED. 2
This presentation is
copyrighted to Halliburton
and it and the associated
handouts contain
information that is
confidential and proprietary
to Halliburton and is therefore
released on the
understanding that the
recipient will use only
the information for
conducting business on
behalf of Halliburton.

© 2014 HALLIBURTON. ALL RIGHTS RESERVED. 3
Agenda
Why do we clean Pipelines
Typical Pipeline Deposits
Deposit Assessment
Pipeline Cleaning
Inline Inspection
Decommissioning
Waste management / disposal

© 2014 HALLIBURTON. ALL RIGHTS RESERVED. 4
But why clean pipelines?
▌ Commissioning
▌ Maintenance / production / efficiency of the system
▌ To enable inspection
▌ Change of service
▌ To decommission
© 2014 HALLIBURTON. ALL RIGHTS RESERVED. 5
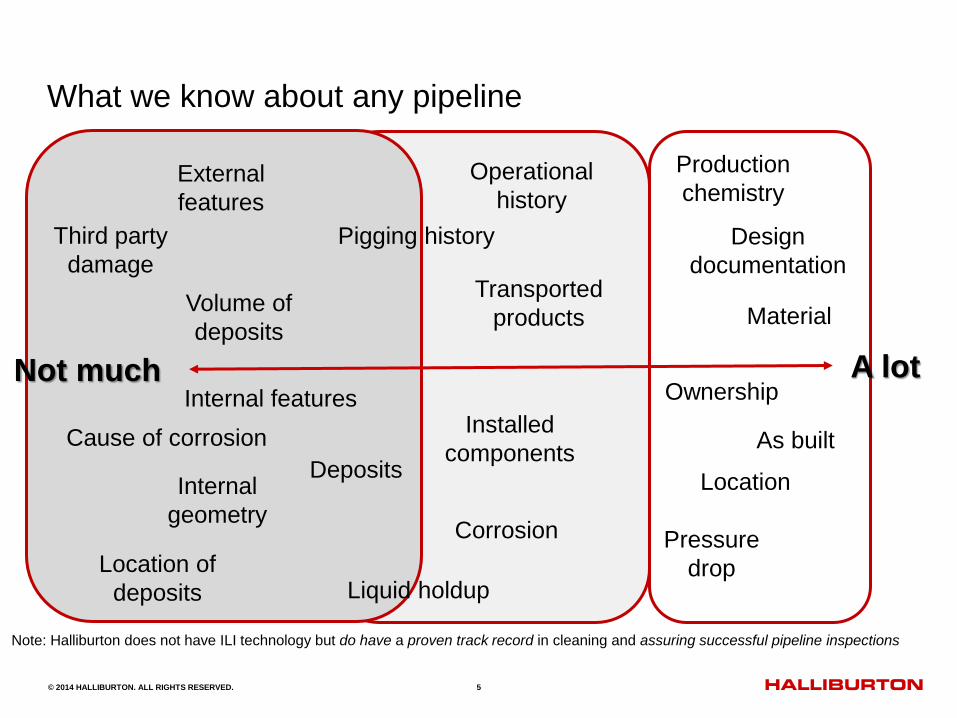
What we know about any pipeline
Not much A lot
Design
documentation
As built
Operational
history
Ownership
Material
Pigging history
Installed
components
Transported
products
Deposits
Location of
deposits
Volume of
deposits
External
features
Internal features
Location Internal
geometry
Liquid holdup
Pressure
drop
Third party
damage
Corrosion
Cause of corrosion
Production
chemistry
Note: Halliburton does not have ILI technology but do have a proven track record in cleaning and assuring successful pipeline inspections

© 2014 HALLIBURTON. ALL RIGHTS RESERVED. 6 © 2013 HALLIBURTON. ALL RIGHTS RESERVED.
Start
End
Cleaning
Methodology
Non intrusive
Survey?
Deposits
present?
Chemical
analysis report
Line piggable?
Sample
available?
Samples
recovered?
Chemical
analysis
Intrusive
survey?
Run
assessment
Deposit
location report
Production
analysis
Reports Cleaning
operations
Yes
Do not know No
No
No
No
No
Yes
Yes
Yes
Yes
Yes
Project Planning / Engineering

© 2014 HALLIBURTON. ALL RIGHTS RESERVED. 7
Chemical analysis of a deposit in a pipeline
▌ Laboratory chemical analysis of the
produced fluids
▌ Samples removed during regular
pigging operations
Issues
– Is the sample representative?
– What if there are a number of different
types of deposit?
– If a sample is obtained - where in the
pipe did it originate?

© 2014 HALLIBURTON. ALL RIGHTS RESERVED. 8
Agenda
Why do we clean Pipelines
Typical Pipeline Deposits
Deposit Assessment
Pipeline Cleaning
Inline Inspection
Decommissioning
Waste management / disposal
© 2014 HALLIBURTON. ALL RIGHTS RESERVED. 9
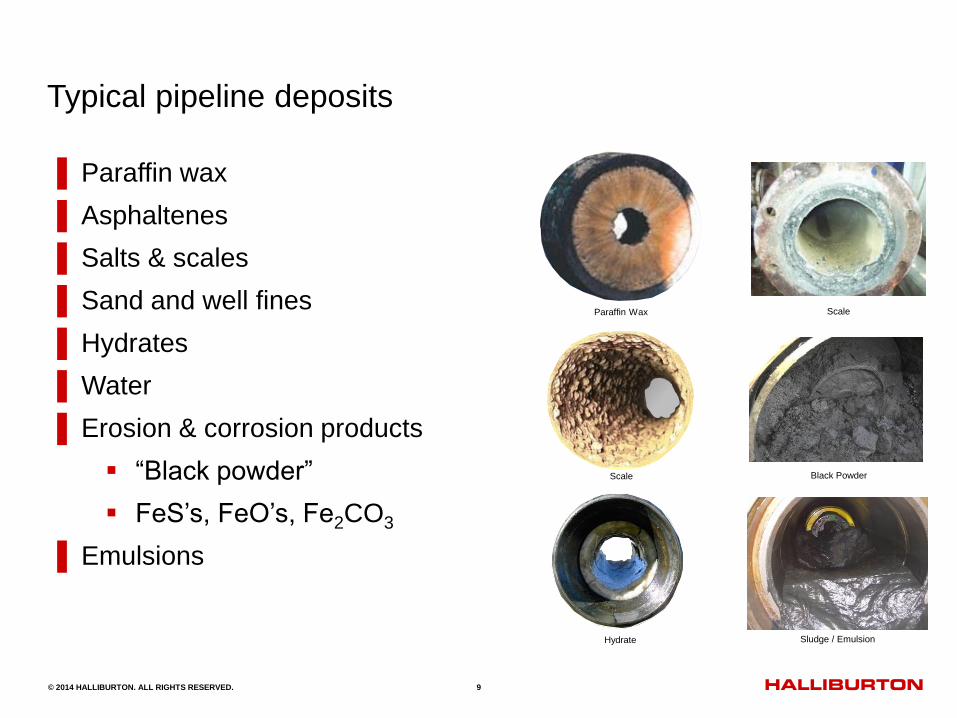
Typical pipeline deposits
▌ Paraffin wax
▌ Asphaltenes
▌ Salts & scales
▌ Sand and well fines
▌ Hydrates
▌ Water
▌ Erosion & corrosion products
“Black powder”
FeS’s, FeO’s, Fe2CO3
▌ Emulsions
Paraffin Wax Scale
Scale Black Powder
Hydrate Sludge / Emulsion
© 2014 HALLIBURTON. ALL RIGHTS RESERVED. 10
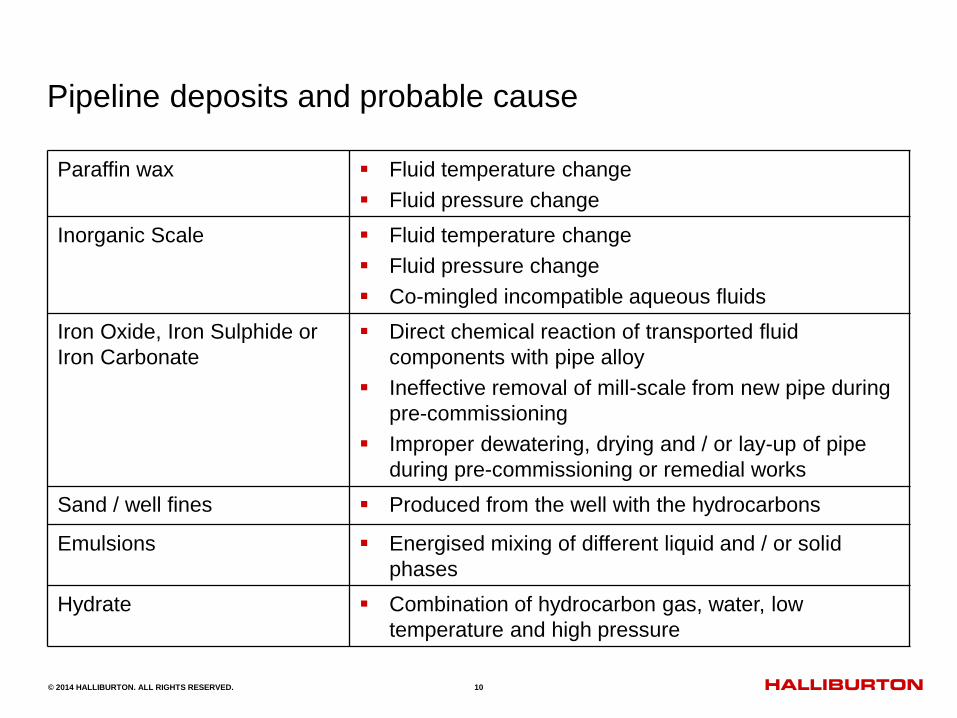
Pipeline deposits and probable cause
Paraffin wax Fluid temperature change
Fluid pressure change
Inorganic Scale Fluid temperature change
Fluid pressure change
Co-mingled incompatible aqueous fluids
Iron Oxide, Iron Sulphide or
Iron Carbonate
Direct chemical reaction of transported fluid
components with pipe alloy
Ineffective removal of mill-scale from new pipe during
pre-commissioning
Improper dewatering, drying and / or lay-up of pipe
during pre-commissioning or remedial works
Sand / well fines Produced from the well with the hydrocarbons
Emulsions Energised mixing of different liquid and / or solid
phases
Hydrate Combination of hydrocarbon gas, water, low
temperature and high pressure

© 2014 HALLIBURTON. ALL RIGHTS RESERVED. 11 © 2013 HALLIBURTON. ALL RIGHTS RESERVED.
Impact of deposits
▌ Production
▌ Efficiencies
▌ Reliability
▌ Product quality
▌ Profitability
▌ OPEX costs
▌ Pumping costs
▌ Maintenance cost
▌ Risk

© 2014 HALLIBURTON. ALL RIGHTS RESERVED. 12
Agenda
Why do we clean Pipelines
Typical Pipeline Deposits
Deposit Assessment (3 Methods)
Pipeline Cleaning
Inline Inspection
Decommissioning
Waste management / disposal
© 2014 HALLIBURTON. ALL RIGHTS RESERVED. 13
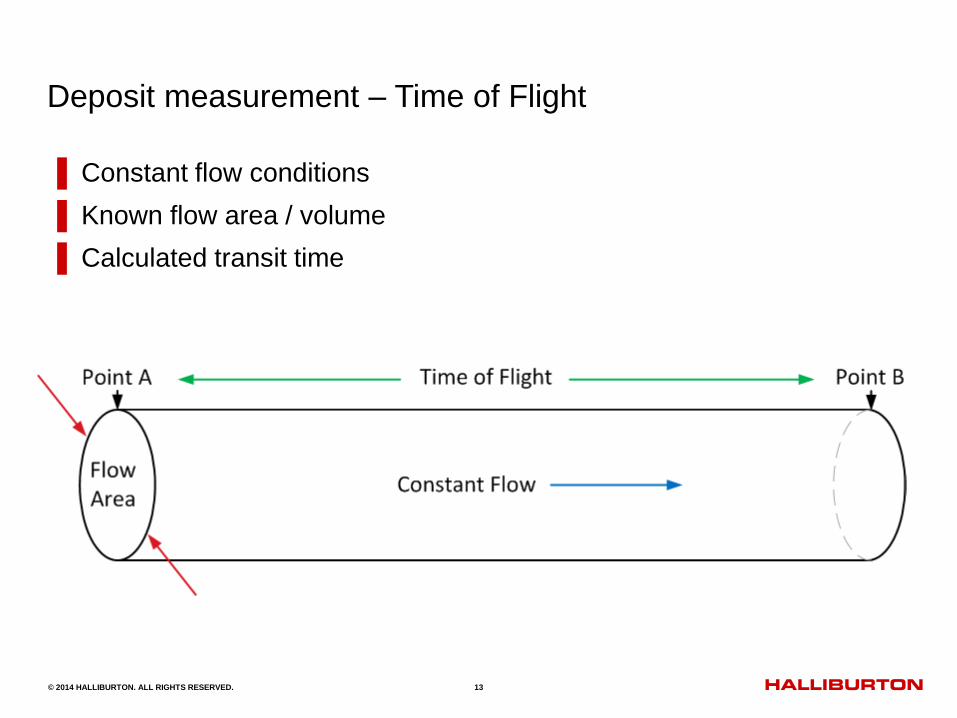
Deposit measurement – Time of Flight
▌ Constant flow conditions
▌ Known flow area / volume
▌ Calculated transit time
© 2014 HALLIBURTON. ALL RIGHTS RESERVED. 14
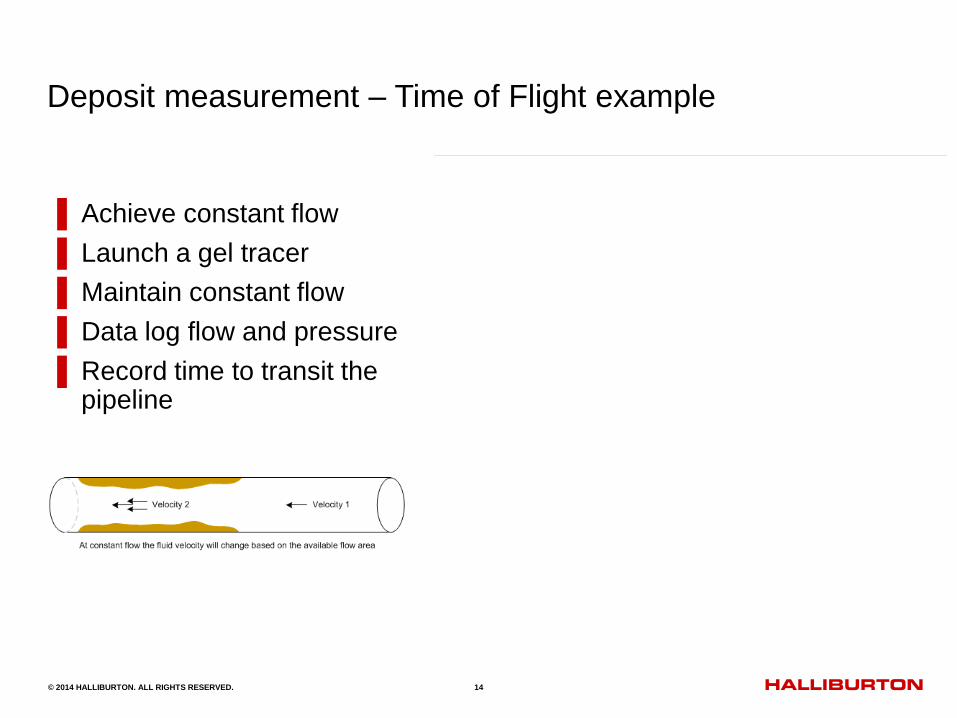
Deposit measurement – Time of Flight example
▌ Achieve constant flow
▌ Launch a gel tracer
▌ Maintain constant flow
▌ Data log flow and pressure
▌ Record time to transit the pipeline
Pipe diameter 12 inches 12 inches
Pipe length 10,000 m 10,000 m
Pipe wall thickness 0.38 inches 0.38 inches
Pipe ID 11.25 inches 11.25 inches
285.7 mm 285.7 mm
Flow area 0.06 m2 0.06 m 2̂
12,000 bbl / day
= 1.325 m3/min 1.325 m 3̂/min
Fluid velocity 20.7 m / min 21.1 m / min
Time of flight 484.20 Minutes 473.00 Minutes
29052 Seconds 28,380 Seconds
Estimated Deposit Volume 14.84 m^3
Average Pipeline ID #1 282.42 mm
Average Deposit Thickness #1 1.66 mm
Note #1 Based on an even distribution along the pipe
HALLIBURTON TIME OF FLIGHT TECHNIQUE
As Built Input Field Data Input

© 2014 HALLIBURTON. ALL RIGHTS RESERVED. 15
Time of flight technique
Issues:
▌ With ‘time of flight’ the deposit profile will be unknown
Do we have this …
Or this …….………

© 2014 HALLIBURTON. ALL RIGHTS RESERVED. 16
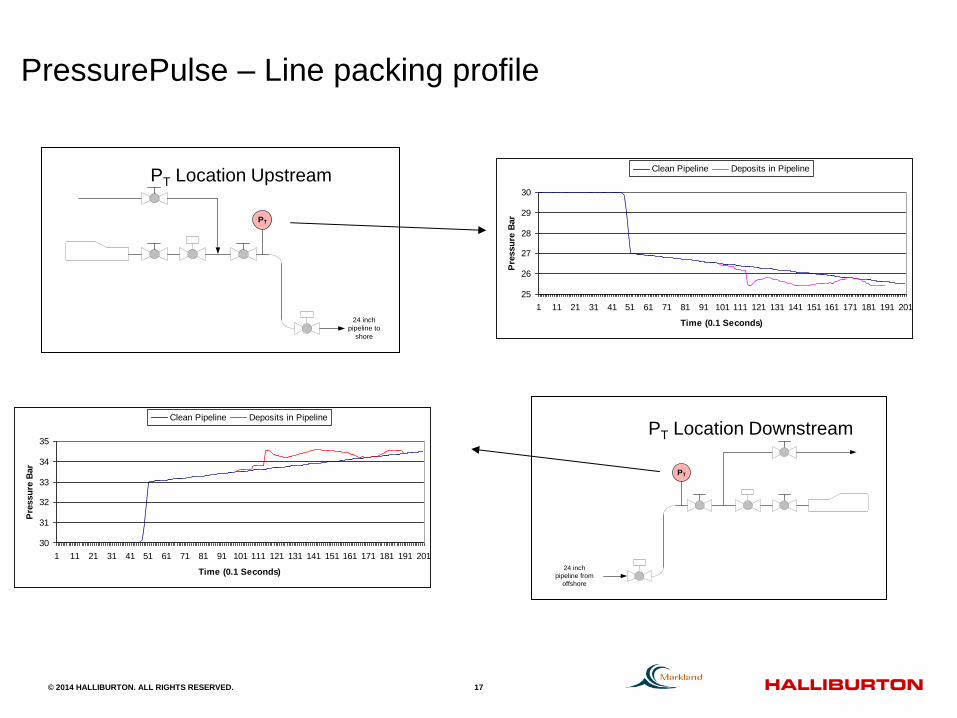
Deposit location – PressurePulse technology
▌ Achieve constant flow
▌ Induce pressure pulse
▌ The pulse travels at the speed
of sound
▌ The line packing signal reflects
the flow conditions at the front
of the pulse
30
31
32
33
34
35
1 11 21 31 41 51 61 71 81 91 101 111 121 131 141 151 161 171 181 191 201
Time (0.1 Seconds)
Pre
ssu
re B
ar
Clean Pipeline Deposits in Pipeline
© 2014 HALLIBURTON. ALL RIGHTS RESERVED. 17
PressurePulse – Line packing profile
25
26
27
28
29
30
1 11 21 31 41 51 61 71 81 91 101 111 121 131 141 151 161 171 181 191 201
Time (0.1 Seconds)
Pre
ssu
re B
ar
Clean Pipeline Deposits in Pipeline
30
31
32
33
34
35
1 11 21 31 41 51 61 71 81 91 101 111 121 131 141 151 161 171 181 191 201
Time (0.1 Seconds)
Pre
ssu
re B
ar
Clean Pipeline Deposits in Pipeline
PT
24 inch
pipeline to
shore
PT Location Upstream
PT
24 inch
pipeline from
offshore
PT Location Downstream

© 2014 HALLIBURTON. ALL RIGHTS RESERVED. 18
Deposit location – PressurePulse technology
© 2014 HALLIBURTON. ALL RIGHTS RESERVED. 19
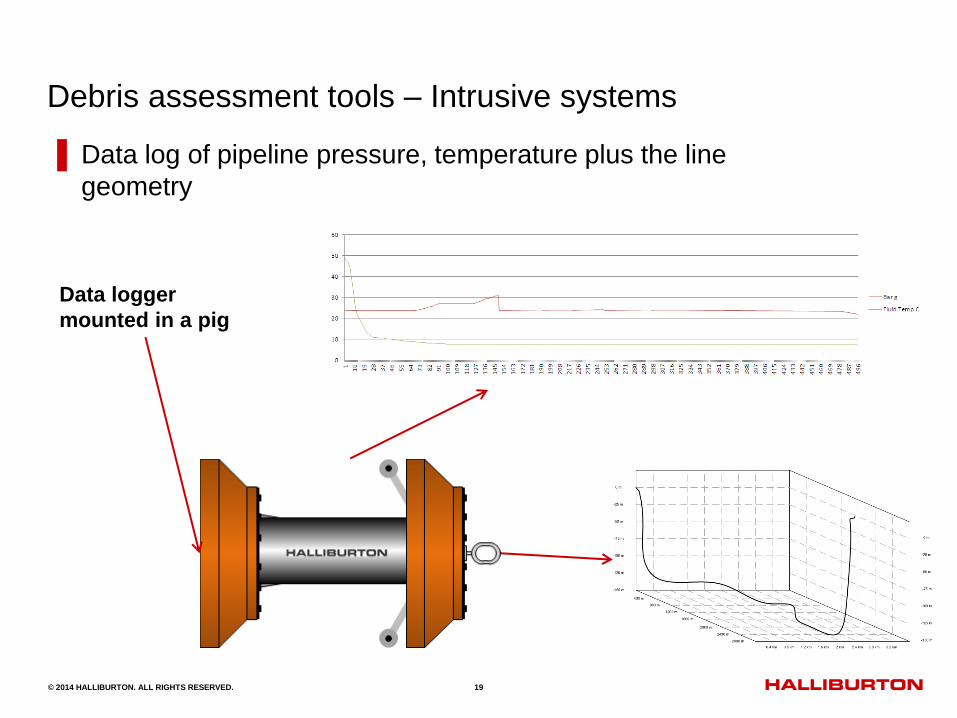
Debris assessment tools – Intrusive systems
▌ Data log of pipeline pressure, temperature plus the line
geometry
Data logger
mounted in a pig
© 2014 HALLIBURTON. ALL RIGHTS RESERVED. 20
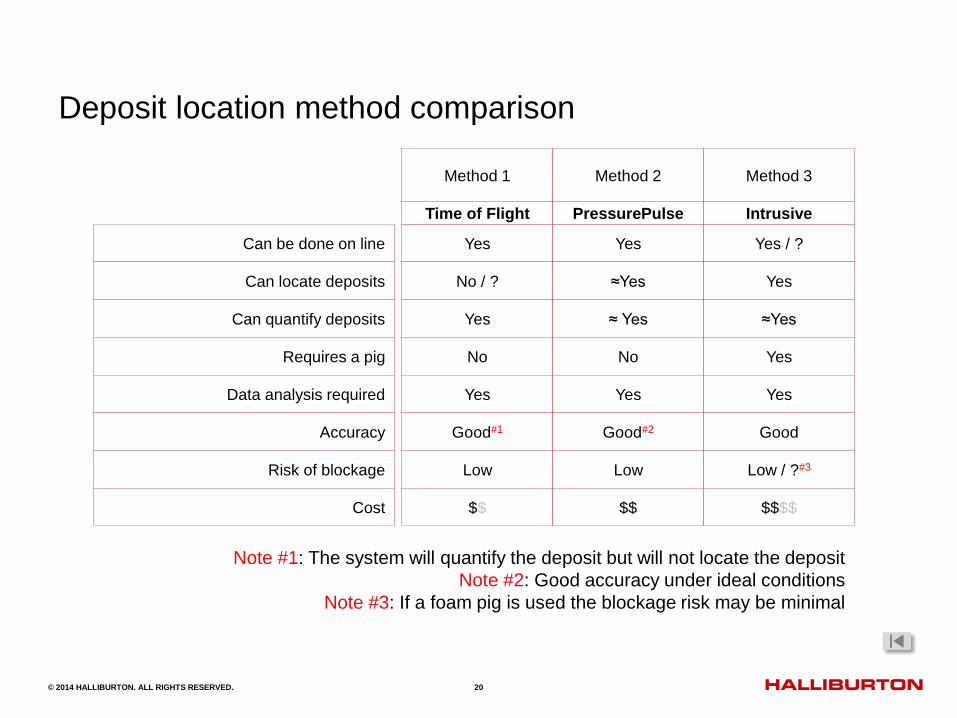
Deposit location method comparison
Can be done on line
Can locate deposits
Can quantify deposits
Requires a pig
Data analysis required
Accuracy
Risk of blockage
Cost
Method 1 Method 2 Method 3
Yes Yes Yes / ?
No / ? ≈Yes Yes
Yes ≈ Yes ≈Yes
No No Yes
Yes Yes Yes
Good#1 Good#2 Good
Time of Flight PressurePulse Intrusive
Low Low Low / ?#3
$$ $$ $$$$
Note #1: The system will quantify the deposit but will not locate the deposit
Note #2: Good accuracy under ideal conditions
Note #3: If a foam pig is used the blockage risk may be minimal

© 2014 HALLIBURTON. ALL RIGHTS RESERVED. 21
Three example cleaning projects
▌ Project 1 GoM
Line pressure
drop high
Throughput
declining
Complete
blockage highly
likely
▌ Project 2 W Africa
Unable to pig
the line
Unable to
inspect the line
High concerns
over corrosion
▌ Project 3 N Sea
Line to be
decommissioned
Hydrocarbon
decontamination
scope
Oil in water
acceptance
criteria of 20 ppmv
After SureStream Flow
Assurance Services a
production increase of 3,020
bbl/day
After SureStream Flow Assurance Services successful ILI and a production increase of 3,000 bbl/day
SureStream Flow Assurance
Services chemical &
mechanical cleaning efficiently
resulting in <20 ppm.
In almost all projects after completion of services a production increase has been experienced

© 2014 HALLIBURTON. ALL RIGHTS RESERVED. 22 © 2013 HALLIBURTON. ALL RIGHTS RESERVED.
Case Study – West Africa
▌ 16 inch oil pipeline
▌ 20.5 km
▌ Unknown quantity of deposits in the pipeline
▌ Cleaning required to enable pipeline inspection

© 2014 HALLIBURTON. ALL RIGHTS RESERVED. 23 © 2013 HALLIBURTON. ALL RIGHTS RESERVED.
Case Study – West Africa
▌ Deposit profile prior to cleaning
▌ Survey indicated approximately 350 cubic meters of material in the
pipeline

© 2014 HALLIBURTON. ALL RIGHTS RESERVED. 24 © 2013 HALLIBURTON. ALL RIGHTS RESERVED.
Case Study – West Africa
▌ Deposit profile after the first stage of the cleaning operation
© 2014 HALLIBURTON. ALL RIGHTS RESERVED. 25 © 2013 HALLIBURTON. ALL RIGHTS RESERVED.
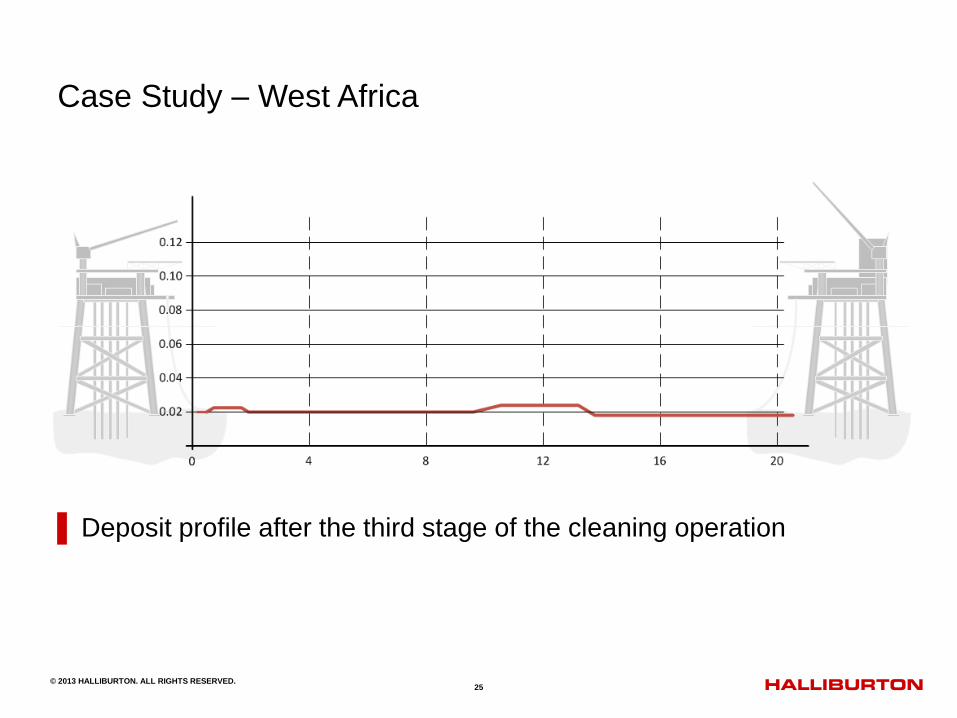
Case Study – West Africa
▌ Deposit profile after the third stage of the cleaning operation
© 2014 HALLIBURTON. ALL RIGHTS RESERVED. 26 © 2013 HALLIBURTON. ALL RIGHTS RESERVED.
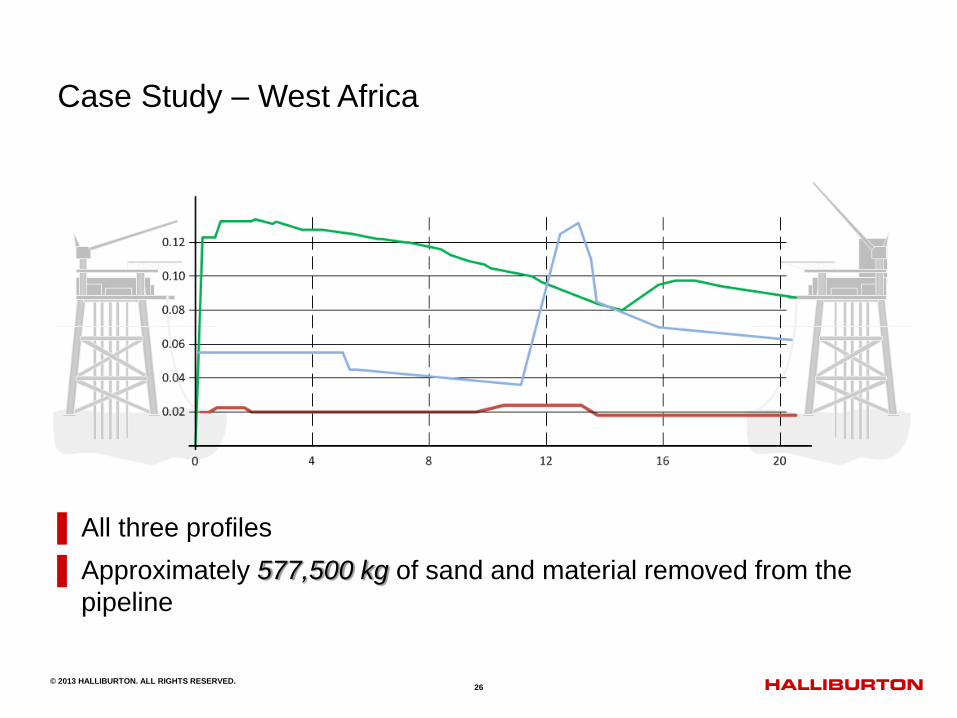
Case Study – West Africa
▌ All three profiles
▌ Approximately 577,500 kg of sand and material removed from the
pipeline
© 2014 HALLIBURTON. ALL RIGHTS RESERVED. 27
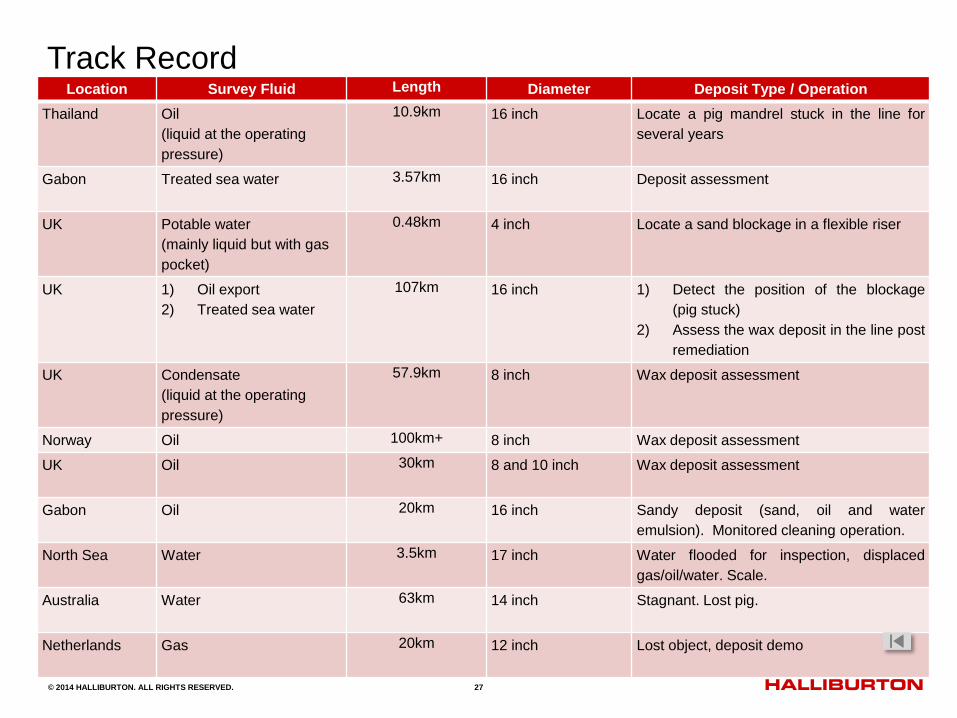
Track Record
Location Survey Fluid Length Diameter Deposit Type / Operation
Thailand Oil
(liquid at the operating
pressure)
10.9km 16 inch
Locate a pig mandrel stuck in the line for
several years
Gabon Treated sea water 3.57km 16 inch
Deposit assessment
UK Potable water
(mainly liquid but with gas
pocket)
0.48km 4 inch
Locate a sand blockage in a flexible riser
UK 1) Oil export
2) Treated sea water
107km 16 inch
1) Detect the position of the blockage
(pig stuck)
2) Assess the wax deposit in the line post
remediation
UK Condensate
(liquid at the operating
pressure)
57.9km 8 inch
Wax deposit assessment
Norway Oil 100km+ 8 inch Wax deposit assessment
UK Oil 30km 8 and 10 inch
Wax deposit assessment
Gabon Oil 20km 16 inch
Sandy deposit (sand, oil and water
emulsion). Monitored cleaning operation.
North Sea Water 3.5km 17 inch
Water flooded for inspection, displaced
gas/oil/water. Scale.
Australia Water 63km 14 inch
Stagnant. Lost pig.
Netherlands Gas 20km 12 inch
Lost object, deposit demo

© 2014 HALLIBURTON. ALL RIGHTS RESERVED. 28
Agenda
Why do we clean Pipelines
Typical Pipeline Deposits
Deposit Assessment
Pipeline Cleaning
Inline Inspection
Decommissioning
Waste management / disposal

© 2014 HALLIBURTON. ALL RIGHTS RESERVED. 29
Pipeline cleaning / deposit removal
▌ Prior to removal
Deposit may be evenly
distributed or at a specific
orientation
Probably adhered to pipe
wall
Probably cause reduced
flow area
▌ After removal from the pipe wall
deposits are
transported out of the
pipeline
not accumulated at the 6
o’clock position

© 2014 HALLIBURTON. ALL RIGHTS RESERVED. 30
Key considerations for pipeline cleaning operations
▌ If the cleaning is to be completed
with routine pigs:
How much material is
transported with each pig?
How much material is in the
pipeline?
How much material will have
to be removed?
Where will the removed
material be disposed of?
How much will disposal
cost?
▌ Pipeline deposit calculations
Paraffin wax
Sand
Corrosion

© 2014 HALLIBURTON. ALL RIGHTS RESERVED. 31
31
Many factors affect particle behaviour
Fluid properties
Particle properties
Flow regime
Velocity
Turbulence
Viscosity
Area Specific gravity
Transportation of deposits / debris

© 2014 HALLIBURTON. ALL RIGHTS RESERVED. 32 © 2013 HALLIBURTON. ALL RIGHTS RESERVED.
Cleaning with pigs
▌Key considerations when using pigs:- Deposit hardness
Deposit adhesion
Deposit volume
Deposit abrasion
Deposit Restriction
Fluid flow rate
Flow type
− Laminar
− Turbulent
Fluid properties
Fluid carrying capacity
© 2014 HALLIBURTON. ALL RIGHTS RESERVED. 33
33
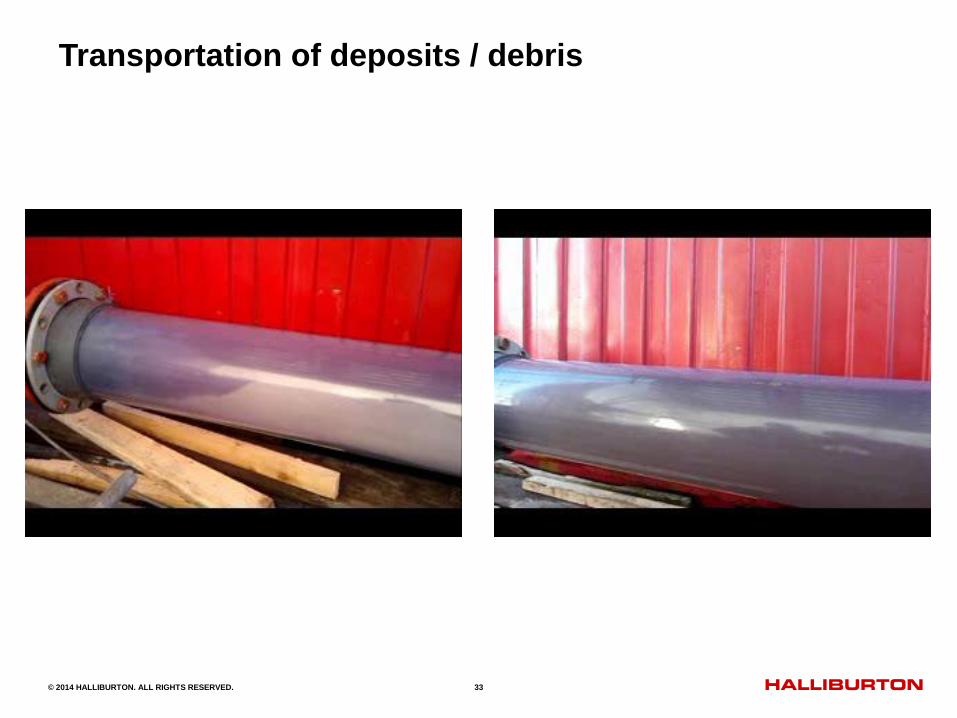
Transportation of deposits / debris

© 2014 HALLIBURTON. ALL RIGHTS RESERVED. 34
Transportation of deposits / debris
▌ Fluid design based on deposit and pipeline properties
Custom formulation per project
Compatability with production
Vast database of fluid characteristics
Particle / fluid interaction reasearch
Experienced laboratory technicians and chemists
Extensive track record

© 2014 HALLIBURTON. ALL RIGHTS RESERVED. 35
Agenda
Why do we clean Pipelines
Typical Pipeline Deposits
Deposit Assessment
Pipeline Cleaning
Inline Inspection
Decommissioning
Waste management / disposal
© 2014 HALLIBURTON. ALL RIGHTS RESERVED. 36
Waste management / disposal
▌ Waste from pipeline cleaning operations has to be disposed of
▌ Waste disposal can be the most costly part of a cleaning program
▌ The three P’s for minimising waste disposal costs
Plan, Plan & Plan
© 2014 HALLIBURTON. ALL RIGHTS RESERVED. 37 © 2013 HALLIBURTON. ALL RIGHTS RESERVED.
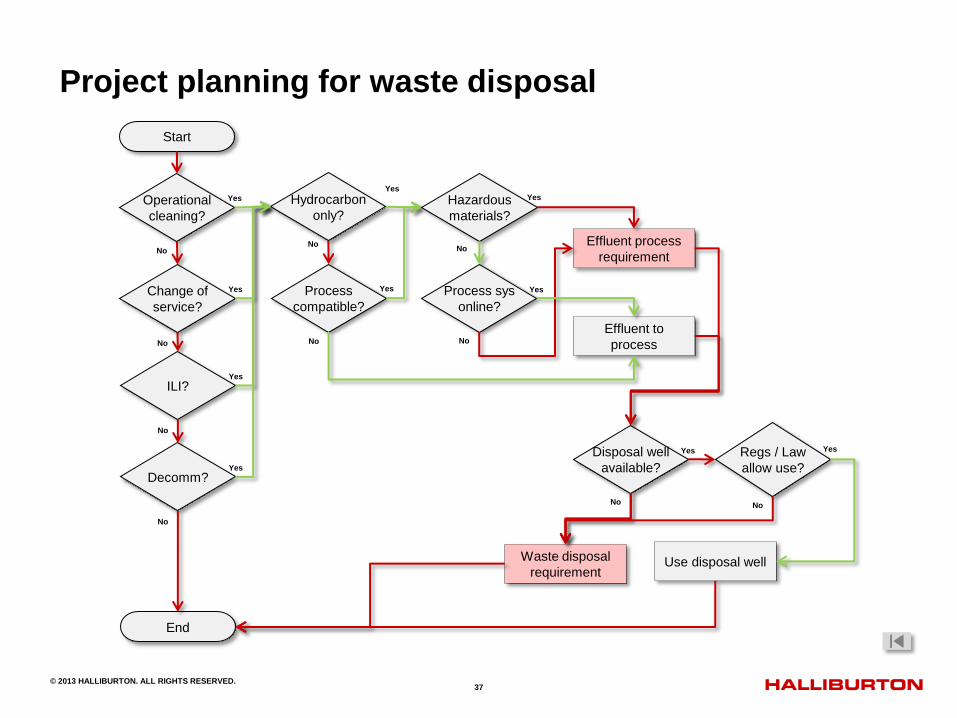
Project planning for waste disposal
Start
End
Process
compatible?
Change of
service?
Hydrocarbon
only? Operational
cleaning?
Yes
No No
No
Process sys
online?
No
Yes Yes Yes
Yes
Decomm?
No
Yes
ILI?
No
Yes
Effluent to
process
No Effluent process
requirement
Hazardous
materials?
No
Yes
Disposal well
available?
No
Yes Regs / Law
allow use?
No
Yes
Waste disposal
requirement Use disposal well
© 2014 HALLIBURTON. ALL RIGHTS RESERVED. 38
This presentation is
copyrighted to Halliburton
and it and the associated
handouts contain
information that is
confidential and proprietary
to Halliburton and is therefore
released on the
understanding that the
recipient will use only
the information for
conducting business on
behalf of Halliburton.