Pipe flow velocity profiles of complex suspensions, like ... · This paper will study the flow...
8
Abstract: The flow of different suspensions has been studied in literature in order to maximize the transport capacity or to minimize the needed pressure. For concrete, several research projects have been performed, but the question remains if the results for one type of concrete are applicable to another type. This paper deals mainly with the flow of self-compacting concrete in pipes. It is shown that the flow of this type of concrete is not influenced by friction between the aggregates, but that the material does not remain homogeneous during the flow. By means of full scale experiments, it is shown that the measured pressure losses are lower than the theoretically calculated pressure losses, due to three effects lowering the viscosity near the wall. The results have been compared with the available literature dealing with traditional concrete, showing some major points of difference. Finally, it is assumed that the velocity profile of concrete in a pipe consists of a plug with uniform velocity in the centre, a lubrication layer with a large velocity gradient near the wall and possibly, a part of the homogeneous concrete also being sheared, depending on the rheological properties and the type of concrete. Unfortunately, no direct velocity profile measuring equipment is available. Keywords: Concrete, velocity, rheology, pressure loss. I. INTRODUCTION The flow of suspensions, which are liquid materials loaded with solid particles, has been studied for several decades, especially in order to maximize the transport capacities of the carrier liquid, or in order to reduce the pressure needed to transport the suspension [1,2]. The flow of some types of concrete in pipes has been reported in literature, but due to the development of new types of concretes, and due forces of different natures acting on the concrete during flow, it is not certain if the obtained results for one type of concrete can be transferred to another type. This paper will study the flow behaviour in pipes of different concrete types, based on literature and experimental results. In order to distinguish between the different concrete types, suggestions for the velocity profiles will be given, as direct measurements are not yet possible. In case no particles are present in the suspension, consequently only studying the carrier liquid, the velocity profile can be easily, analytically calculated based on the rheological properties. The addition of particles complicates the situation seriously and analytical solutions are no longer evident to be found. Adding particles can result in two different situations. In the first situation, particles sink to the bottom of the pipe and move much slower than the liquid flowing above, which is better known as bed-flow [1,2]. In the second situation, the particles remain suspended during the flow [1,2]. Only this suspended flow will be described in detail in this paper. In the next part, concrete will be regarded as a homogeneous suspension and the velocity profile will be calculated based on the rheological properties. Afterwards, the flow behaviour of concrete in pipes will be discussed based on literature and the experimentally obtained results will be described. In the last section, some theoretical modifications to the concrete properties will be proposed in order to approach the experimentally measured pressure losses as well as possible. II. CONCRETE – SELF-COMPACTING CONCRETE A. Composition The composition of concrete can be varied in many different ways, resulting in no real standard composition. Although, it can be roughly estimated that 1 m³ of traditional (vibrated) concrete contains 1300 kg coarse aggregates between 2 and 20 mm (maybe 40 mm), 650 kg of sand, 300 kg of cement and 165 kg of water [3,4]. Self-compacting concrete (SCC) is a rather fluid type of concrete, which does not need any external energy for the removal of air bubbles, and it is able to fill a formwork completely under the acting force of gravity alone. A more detailed description on the difference between traditional and self-compacting concrete will be given in the next section, but a rough composition can be set as follows: 650 kg of coarse aggregates, 850 kg of sand, 350 kg of cement, 250 kg of filler (other fine materials than cement), 165 kg of water and a small amount of superplasticizer, which makes the concrete much more fluid [3]. In any way, whether the concrete is self-compacting or not, it contains around 16.5 vol % of liquid, 1.5 vol % of non- removable air and thus 82 vol % of solid materials, varying in size from 100 nm to 1 cm. As a result, not only the viscosity of the material is modified, but the properties are also influenced by inter-particle forces, inertia and friction. In this paper, the effects of inertia are of no importance for the described results (although it is in other cases) and friction will be discussed separately. B. Rheological properties The rheological properties of different concretes have been measured in concrete rheometers and based on the obtained experimental results and literature, a distinction between steady state and transient behaviour will be made. Steady state behaviour corresponds to the situation where all transient Pipe flow velocity profiles of complex suspensions, like concrete. Dimitri Feys 1,2 , Ronny Verhoeven 2 , Geert De Schutter 1 1 Magnel Laboratory for Concrete Research, Department of Structural Engineering, Faculty of Engineering, Ghent University Technologiepark 904 – 9052 Zwijnaarde - Belgium 2 Hydraulics Laboratory, Department of Civil Engineering, Faculty of Engineering, Ghent University Sint-Pietersnieuwstraat 41, 9000 Gent - Belgium email: [email protected]
Transcript of Pipe flow velocity profiles of complex suspensions, like ... · This paper will study the flow...

Abstract: The flow of different suspensions has been studied in literature in order to maximize the transport capacity or to minimize the needed pressure. For concrete, several research projects have been performed, but the question remains if the results for one type of concrete are applicable to another type.
This paper deals mainly with the flow of self-compacting concrete in pipes. It is shown that the flow of this type of concrete is not influenced by friction between the aggregates, but that the material does not remain homogeneous during the flow. By means of full scale experiments, it is shown that the measured pressure losses are lower than the theoretically calculated pressure losses, due to three effects lowering the viscosity near the wall. The results have been compared with the available literature dealing with traditional concrete, showing some major points of difference. Finally, it is assumed that the velocity profile of concrete in a pipe consists of a plug with uniform velocity in the centre, a lubrication layer with a large velocity gradient near the wall and possibly, a part of the homogeneous concrete also being sheared, depending on the rheological properties and the type of concrete. Unfortunately, no direct velocity profile measuring equipment is available.
Keywords: Concrete, velocity, rheology, pressure loss.
I. INTRODUCTION
The flow of suspensions, which are liquid materials loaded with solid particles, has been studied for several decades, especially in order to maximize the transport capacities of the carrier liquid, or in order to reduce the pressure needed to transport the suspension [1,2]. The flow of some types of concrete in pipes has been reported in literature, but due to the development of new types of concretes, and due forces of different natures acting on the concrete during flow, it is not certain if the obtained results for one type of concrete can be transferred to another type. This paper will study the flow behaviour in pipes of different concrete types, based on literature and experimental results. In order to distinguish between the different concrete types, suggestions for the velocity profiles will be given, as direct measurements are not yet possible.
In case no particles are present in the suspension, consequently only studying the carrier liquid, the velocity profile can be easily, analytically calculated based on the rheological properties. The addition of particles complicates the situation seriously and analytical solutions are no longer evident to be found. Adding particles can result in two different situations. In the first situation, particles sink to the bottom of the pipe and move much slower than the liquid flowing above, which is better known as bed-flow [1,2]. In the second situation, the particles remain suspended during the
flow [1,2]. Only this suspended flow will be described in detail in this paper.
In the next part, concrete will be regarded as a homogeneous suspension and the velocity profile will be calculated based on the rheological properties. Afterwards, the flow behaviour of concrete in pipes will be discussed based on literature and the experimentally obtained results will be described. In the last section, some theoretical modifications to the concrete properties will be proposed in order to approach the experimentally measured pressure losses as well as possible.
II. CONCRETE – SELF-COMPACTING CONCRETE
A. Composition
The composition of concrete can be varied in many different ways, resulting in no real standard composition. Although, it can be roughly estimated that 1 m³ of traditional (vibrated) concrete contains 1300 kg coarse aggregates between 2 and 20 mm (maybe 40 mm), 650 kg of sand, 300 kg of cement and 165 kg of water [3,4].
Self-compacting concrete (SCC) is a rather fluid type of concrete, which does not need any external energy for the removal of air bubbles, and it is able to fill a formwork completely under the acting force of gravity alone. A more detailed description on the difference between traditional and self-compacting concrete will be given in the next section, but a rough composition can be set as follows: 650 kg of coarse aggregates, 850 kg of sand, 350 kg of cement, 250 kg of filler (other fine materials than cement), 165 kg of water and a small amount of superplasticizer, which makes the concrete much more fluid [3].
In any way, whether the concrete is self-compacting or not, it contains around 16.5 vol % of liquid, 1.5 vol % of non-removable air and thus 82 vol % of solid materials, varying in size from 100 nm to 1 cm. As a result, not only the viscosity of the material is modified, but the properties are also influenced by inter-particle forces, inertia and friction. In this paper, the effects of inertia are of no importance for the described results (although it is in other cases) and friction will be discussed separately.
B. Rheological properties
The rheological properties of different concretes have been measured in concrete rheometers and based on the obtained experimental results and literature, a distinction between steady state and transient behaviour will be made. Steady state behaviour corresponds to the situation where all transient
Pipe flow velocity profiles of complex suspensions, like concrete.
Dimitri Feys1,2, Ronny Verhoeven2, Geert De Schutter1
1Magnel Laboratory for Concrete Research, Department of Structural Engineering, Faculty of Engineering, Ghent University Technologiepark 904 – 9052 Zwijnaarde - Belgium
2Hydraulics Laboratory, Department of Civil Engineering, Faculty of Engineering, Ghent University Sint-Pietersnieuwstraat 41, 9000 Gent - Belgium
email: [email protected]

effects have been eliminated and can be regarded as a momentary snapshot of the rheological properties.
1) Steady state properties The relationship between the shear stress (related to the
applied force or pressure) and shear rate (related to the velocity and the geometry) is generally accepted to be of the Bingham type in case of traditional concrete [4]. As a result, a certain stress needs to be exceeded in order to initiate the flow, which is the yield stress, and once the flow has started, an additional stress is needed to accelerate the flow, of which its magnitude is controlled by the viscosity. The Bingham model is shown in equation 1.
In case of self-compacting concrete, a non-linear behaviour has been observed in the experiments, indicating an increase in viscosity with increasing shear rate [5-7]. In this case, the modified Bingham model (eq. 2) [7,8] has been chosen as the most appropriate model to describe the rheological behaviour in steady state.
Equation 1: Bingham model
t∂
∂⋅+= γµττ 0 (1)
Equation 2: Modified Bingham model
2
0
∂∂⋅+
∂∂⋅+=
tc
t
γγµττ (2)
where: τ = shear stress (Pa) τ0 = yield stress (Pa) µ = viscosity (Pa s) dγ/dt = shear rate (s-1) c = second order parameter (Pa s²) (> 0) The main differences between traditional and self-
compacting concrete are, apart from the non-linear behaviour, the lower yield stress and higher viscosity in case of SCC [3]. Especially the low yield stress causes the SCC to spread out widely under the force of gravity, while its higher viscosity prevents (or at least slows down) the segregation/sinking of the larger particles [3].
2) Transient behaviour Due to physical and chemical phenomena which are acting
between the cement particles in the concrete, the rheological properties vary in time continuously. Theoretically, the transient behaviour can be divided into three parts: thixotropy, structural breakdown and loss of workability [9].
Thixotropy has a physical nature and is defined as the reversible disruption and rebuilding of connections between the particles. Due to shearing, connections are broken and a larger degree of dispersion is obtained, while due to build-up, more particles get connected. The internal structural state is related to the amount of connections between the particles, resulting in a higher structural state during build-up and a lower structural state due to break down [9,10]. An increase in structural state causes an increase in yield stress and viscosity, and at each shear rate (except at very low shear rates), there exists an equilibrium structural state which is attained when the shear rate is applied during a sufficiently long time [9,10].
At the first contact between cement and water, some chemical reactions occur resulting in some connections between cement particles (other than the thixotropic connections). Due to the hydrodynamic forces induced by
shearing, some of these connections can be broken, which is defined as structural breakdown, but during the first 2 – 3 hours of age of the concrete, these chemical connections do not rebuild, at least not at the same rate as the thixotropic connections [9].
Loss of workability is the result of both physical and chemical (at higher ages) connections, which can no longer be broken by the amount of work applied. As a result, the concrete becomes stiffer and finally transforms from a liquid to a strong solid material [9,11].
As can be seen, many phenomena complicate the rheological behaviour of concrete seriously, making it one of the most difficult materials to determine its rheological properties. Currently, the research in this field is still going on, trying to find a practical distinction between the phenomena. In the remaining part of this paper, as it is not easy to distinguish between the thixotropic and the pure structural breakdown, these two effects will be combined in a new definition of structural breakdown [4].
III. FLOW OF HOMOGENEOUS LIQUIDS IN CYLINDRICAL PIPES
The velocity profile of homogeneous liquids in cylindrical pipes can be very easily calculated when the applied pressure or pressure loss, rheological properties of the material and the geometry of the pipe are known. The equilibrium of forces states that the shear stress at the wall must relate to the pressure loss according to equation 3 [12].
Equation 3: Equilibrium of forces
22R
pR
L
ptotw ⋅∆=⋅∆=τ (3)
where: τw = wall shear stress (Pa) ∆ptot = total pressure loss over the length L (Pa) L = length of the pipe (m) R = radius of the pipe (m) ∆p = pressure loss per unit of length (Pa/m) Across the pipe, the shear stress varies linearly from zero in
the centre to its maximal value (τw) at the wall. This variation of the shear stress is a so-called universal law, meaning it is independent of the rheological properties.
Substituting the shear stress values by the rheological models, like equations 1 and 2, delivers the shear rate distribution across the pipe. For yield stress liquids, the shear rate equals zero in a certain zone of the pipe.
Integrating the shear rate distribution to the pipe radius, with as integration constant the velocity at the wall, which is set at zero due to the no slippage condition, delivers the velocity profile. Figure 1 shows the theoretically calculated velocity profiles for a Newtonian liquid (like water and oil), for a Bingham material (like toothpaste and paint), and a modified Bingham material. Note that for all yield stress materials, a zone of uniform velocity can be observed, which is called the plug.
Further integration of the velocity over the cross section of the pipe delivers the discharge as a function of the pressure loss (or wall shear stress), the rheological properties and the geometry of the pipe. This is shown in equations 4, 5 and 6.
Equation 4: Poiseuille formula

µ
π 4
8
1 RpQ
⋅∆⋅⋅= (4)
Equation 5: Buckingham-Reiner equation
µττ
⋅⋅∆⋅∆⋅⋅⋅⋅−⋅⋅+∆⋅⋅
=Lp
pRLLpRQ
tot
tottot3
330
440
44
24
8163
(5) Equation 6: Extended Poiseuille for modified Bingham
( )( )
( )( )
−+
+++
+−−
++−
−++−
=
30
333
02
0222
003322
0
05
04
330
367
34
3
64120
82432
43870
1462
140
840
ττ
ττττµττττµτ
τµττµττµµµ
τπ
WcWc
cW
Wcc
ccW
cW
c
RQ
w
ww
ww
w
w
w
(6)
with: 02 44 ττµ ⋅⋅−⋅⋅+= ccW w
As can be seen, for Newtonian liquids, the Poiseuille formula for laminar flow is obtained (eq. 4) [12,13], and the calculations result in the Buckingham-Reiner equation for Bingham materials [12,14].
velocity (m/s)
Distance from the centre (m)
Newtonian
Bingham
modified Bingham
Plug
Pip
ew
all
Pip
ece
nte
r
Figure 1: Velocity profile for a Newtonian, Bingham and modified Bingham material. All viscosity parameters equal 10 Pa s, the yield stress equals 20 Pa and c = 0.5 Pa s². The pipe has a radius of 10 cm. Note that in the plug, the velocity is constant for the yield stress materials.
IV. THEORETICAL STUDY OF THE FLOW OF CONCRETE IN PIPES
Due to the high concentration of solids in concrete, very different flow situations can be obtained with different concrete compositions. In the first section, the theoretical framework will be described, while in the second section, the theory will be applied to different concrete types.
A. Theoretical framework
1) Liquid interactions The flow of concrete in pipes can be divided into two major
classes, depending on the stress transfer inside the concrete [15]. If the stress transfer is of the liquid type, the concrete flows according to the hydrodynamic laws. In a first approach, the principles of section III can be applied in order to describe the flow behaviour of concrete. This case can also be extended to concrete with varying rheological properties across the pipe (see section VI), forming a so-called lubrication layer [15,16] and possibly, an additional velocity component due to slippage can be added [15].
As a result of these liquid type of interactions, the pressure loss per unit of length remains constant along the length of the pipe when disregarding the transient effects and the total pressure evolves linearly with the length of the pipe [17].
2) Solid interactions The applied pressure during pumping does not only cause
the concrete to move in the pipes, but it can also cause the internal water to move inside the concrete [17,18]. In this case, some zones with a low water amount can be created and the stress is transferred by solid interactions between the aggregates. As a result, the hydrodynamic laws of section III can no longer be applied and Coulomb’s friction law is valid. The pressure loss at a certain position in the pipe is dependent on the local pressure and as a result, the total pressure decreases exponentially with the length of the pipe [15,17].
Several researchers have shown that these solid interactions cause a much larger pressure loss and that this case must be avoided as much as possible [17]. In case the pump cannot deliver the pressure needed to overcome the frictional stresses, the concrete flow stops and the pipe gets blocked.
B. Application on different concrete types
In literature, a main distinction is made between “pumpable” and “non-pumpable” concretes [15,17]. Although no exact scientific results are available, concrete can be made pumpable by reducing the amount of coarse aggregates and increasing the amount of fines. Also the yield stress must not be higher than a certain value. Pumpable concretes are assumed to move due to the liquid interactions in the cement paste, while non-pumpable concretes suffer more from friction between the aggregates.
Self-compacting concrete is due to its composition already pumpable in any situation. As a result, no problems concerning friction are expected, which has been verified during the full scale tests on 18 different SCC compositions. Nevertheless, friction becomes important during the filling of the pipes with concrete, as the fine materials stick to the wall in order to lubricate the flow and as the coarse aggregates move ahead of the bulk concrete due to inertia caused by the specific pumping action. In this case, a front of aggregates is created in front of the concrete, which can lead to blocking in case the stress transfer is changed from the liquid to the frictional type.

V. FULL SCALE PUMPING TESTS WITH SCC
A. Test setup
In order to execute the full scale pumping tests with SCC, an industrial truck-mounted concrete piston pump has been applied. This type of pump contains two hydraulic cylinders, alternately pushing concrete inside the pipes and pulling concrete from the reservoir. A powerful valve inside the concrete reservoir switches the connection between the pipes and the cylinders, when the pushing cylinder is empty and consequently, the cylinders swap jobs. This specific pump can deliver a discharge which can be varied in 10 discrete steps, between 4 to 5 l/s (step 1) and 40 l/s (step 10).
Figure 2: Truck mounted concrete piston pump.
Figure 3: Loop circuit with a length of 25 m.
Behind the pump, a loop circuit with a total length of around 25 m has been built with steel pipes with an inner diameter of 106 mm and a thickness of around 3 mm. The circuit consisted of a straight, horizontal section with a length of 12 m, a 180° bend and an inclined part. At the end of the circuit, the concrete flows inside a suspended reservoir, equipped with a valve. In normal conditions, the valve is open and the concrete falls back inside the reservoir of the pump. For sampling and discharge calibration, the valve is closed.
The concrete pump and the loop circuit are depicted in figures 2 and 3 respectively.
B. Measurement systems
1) Pressure losses The pressure losses have been measured by means of two
pressure sensors, located in the straight, horizontal section with a separation distance of 10 m. Close to each pressure sensor, three strain gauges have been attached to the outer pipe wall, following the deformation of the pipe, which is related to the local pressure [15]. These strain gauges acted as a back-up in case something happened with the pressure sensor. Both the pressure sensors and all strain gauges are connected with a data acquisition system, registering the output at a rate of 10 measurements per second.
The pressure sensor and strain gauges are depicted in figure 4.
Pressuresensor
Strain gauges
Temperature sensor
Figure 4: Pressure sensor and strain gauges.
2) Discharge No direct equipment was available for measuring the
velocity or discharge. On the other hand, during the switch of the valve of the pump, a clear pressure drop can be seen in the obtained data files. By measuring the time between two switches of the valve of the pump, the discharge can be easily calculated, knowing that the total contents of 1 pumping cylinder is 83.1 l.
This discharge has been calibrated by pumping the contents of 1 full cylinder inside the suspended reservoir with the valve closed. As this reservoir is attached to the rolling bridge by means of a load cell, the force variation is easily recorded and with known density, the discharge can be easily calculated. This calibration procedure has proven that the applied discharge measuring system delivers accurate results.
As mentioned, no direct measurement equipment has been applied to determine the discharge, although an electromagnetic discharge meter has proven to be useful in case of concrete [15]. Also the above described volumetric discharge calibration could have been performed during all tests, but it was too elaborate to be performed continuously. Specific equipment to measure the velocity profile is on the other hand not yet available for concrete. The only tool able of

non-invasive measuring of the velocity is MRI, but this is too expensive to be applied in concrete research [19].
3) Rheological properties The rheological properties have been measured with the
Tattersall Mk-II rheometer [4,20], by stepwise decreasing the rotational velocity after a pre-shearing period. This procedure has been applied in order to eliminate thixotropy and structural breakdown in the concrete before the measurement [4,9-11]. The rotational velocity and resulting torque have been transformed into fundamental rheological units. Afterwards, if possible, both the Bingham and modified Bingham models have been applied on the results. More information and details on the Tattersall Mk-II rheometer and the measuring and data transformation procedure can be found in [20].
C. Testing procedure
The total amount of concrete needed for the execution of the tests is at least 1.25 m³. As a result, all concretes have been produced in a ready-mix plant and transported to the lab. In normal conditions, the concrete arrived in the lab 45 minutes after its production. The insertion of the concrete took normally 10 minutes and afterwards, the setup was ready for the first test.
A test consisted of pumping the concrete at the five lowest discharges available (steps 1 to 5), for safety reasons, in descending order, while maintaining each discharge step during five full strokes (= 5 full cylinders being pumped). A plot of the upstream pressure during a test can be seen in figure 5, in which clearly the decreases and increases in pressure can be seen due to the change of the valve. In the beginning of the test, the pressure is high, which is due to the high discharge (high Q) and the pressure spikes are close to each other. At the end, the opposite can be seen. At each discharge, the average of the pressure in equilibrium during the five strokes has been calculated.
Upstream pressure (bar)
Time (s)
0
2
4
6
8
10
12
14
16
18
20
0 50 100 150 200 250
0
1
2
3
4
5
6
7
8
72 72.5 73 73.5 74 74.5 75
strain gauges
pressure sensor
Upstream pressure (bar)
Time (s)
High Q
Low Q
Figure 5: Upstream pressure during a pumping test. The inset shows a detailed evolution of the pressure during the switch of the valve of the pump.
Before each test, a certain amount of concrete is pumped in the suspended reservoir with the valve closed, and a sample is
loaded in the rheometer in order to determine the rheological properties simultaneously as the pumping test.
Each 30 minutes, the test has been repeated until the concrete was removed according to the planning.
D. Results
1) Elimination of inaccurate results The amount of concrete needed for the rheometer test is
12.5 l, which is only 1% of the total amount of concrete available in the circuit. In some cases, serious doubts arose whether the taken sample was fully representative for the total concrete amount. In these cases, the tests have not been taken into account for the further analysis, described in this paper.
Furthermore, due to structural breakdown defined at the end of section 2, the flow resistance of the concrete decreases during the first three pumping tests on the concrete. As the pressure losses have not been determined in equilibrium conditions during the first two tests, these results have been omitted also. As a result, only results from the third test on have been applied in the analysis. Figure 6 shows the pressure loss – discharge curve for a self-compacting concrete (LM 7) and a traditional concrete (TC 1), clearly indicating shear thickening in the first case and perfectly linear behaviour in the second case.
0
5
10
15
20
25
30
35
40
45
0 5 10 15 20 25
SCC LM 7
TC 1
Pressure loss (kPa/m)
Discharge (l/s)
Figure 6: The pressure loss – discharge curve for self-compacting concrete SCC LM 7 (grey) shows non-linear behaviour, while the traditional concrete TC 1 (black) does not.
2) Comparison with theoretical formulae Based on the obtained rheological properties, both with the
Bingham and the modified Bingham model, if applicable, the pressure loss corresponding to each discharge applied has been determined with equations 5 and 6. In this first approach, the concrete was assumed to be homogeneous over the cross section of the pipe. When defining the prediction ratio as the ratio of the theoretical pressure loss to the experimental pressure loss, values between 2 and 5.5 in case of the Bingham model, and 4 and 10.5 in case of the modified Bingham model have been obtained. These values are too high to be attributed to measurement inaccuracies, and as a consequence, some effects must cause lower pressure losses, which will be discussed in the next section.

VI. HETEROGENEOUS CONCRETE FLOW
As no direct velocity profile measurements are currently possible, an estimation of three effects, being the geometrical wall effect, structural breakdown and dynamic segregation, which all cause a decrease in the pressure loss, will be given in this section. Only for the geometrical wall effect, some approximate calculations are given, as a lot of inaccuracies are encountered. For the other effects, their influence will only be described qualitatively.
A. Geometrical wall effect
1) Principle The principle of the geometrical wall effect is quite simple:
the aggregates cannot penetrate a rigid boundary, in this case the pipe wall, creating a layer with a lower concentration of aggregates in this region. As it has been described in literature, a lower concentration of aggregates induced lower rheological properties [9].
2) Mathematical description In order to incorporate the geometrical wall effect into a
mathematical model, the same principles of section III will be applied. The shear stress distribution remains linear, as it is a universal law, but due to the varying concentration of aggregates, the rheological properties vary across the pipe. At a distance larger than dmax/2 from the wall, with dmax corresponding to the maximal aggregate size (16 mm in our case), the rheological properties are assumed to remain constant. This “unaffected zone” will be reflected as the bulk concrete in this section. When approaching the wall, the yield stress and viscosity are assumed to decrease linearly from their value in the bulk concrete, to the values of the composing cement paste (= cement + water + filler + superplasticizer) at the wall. As the rheological properties of the cement paste have not been measured, a value equal to 1/100 of the values for the concrete have been chosen. The shear thickening parameter c of the modified Bingham model has a somewhat more complicated evolution, described in detail in [20]. Figure 7 shows the assumed evolution of the Bingham parameters yield stress and viscosity, and of the modified Bingham parameters yield stress and c across the pipe.
Note that the average of the rheological properties calculated over the cross section of the pipe corresponds to the measured values in the rheometer, as due to the presence of ribs in the latter case, the geometrical wall effect is prevented to influence the measurements.
Based on these new rheological properties, the shear rate and velocity profiles can be calculated, which are shown in figure 8. As can be clearly seen in case of the Bingham model, a large velocity gradient is present near the wall, indicating the existence of a lubrication layer. For the modified Bingham model, this velocity gradient is not so clearly visible, due to the very large importance of the shear thickening near the wall.
Unfortunately, due to the large mathematical complexity, no theoretical formulae for the velocity and discharge are available.
BINGHAM
Distance from pipe centre (m)
MODIFIED BINGHAM
Distance from pipe centre (m)
Yie
ldst
ress
(P
a)
Yie
ldst
ress
(P
a)
Vis
cosi
ty(P
a s)
She
arth
icke
ning
“c”
(Pa
s²)
Viscosity is not shown
Figure 7: Evolution of Bingham yield stress and viscosity (left) and modified Bingham yield stress and shear thickening parameter “c” (right), for SCC LM 7, test 3. The values measured in the rheometer were: τ0 = 21.25 Pa, µ = 21.42 Pa s (Bingham) and τ0 = 31.22 Pa, µ = 16.73 Pa s, c = 0.367 Pa s² (modified Bingham).
BINGHAM
Distance from pipe centre (m)
MODIFIED BINGHAM
Distance from pipe centre (m)
She
arra
te(1
/s)
Ve
loci
ty(m
/s)
Ve
loci
ty(m
/s)
She
arra
te(1
/s)
Figure 8: Shear rate (top) and velocity (bottom) profile in case the Bingham (left) or the modified Bingham (right) model have been applied to the concrete. The results correspond to the rheological properties shown in figure 7 and an applied pressure loss of 20.57 kPa/m.
3) Prediction ratio When applying this new theoretical model, the prediction
ratio decreases to 0.6 (but mostly larger than 1) to 2 for the Bingham model, and to 2 to 9 for the modified Bingham model. As a result, when neglecting shear thickening in the concrete, the pressure losses in straight sections can be almost perfectly predicted (within a factor 2).
On the other hand, as shown in figure 9, a shear thickening effect must be present in the pumped SCC. When considering the Bingham model, it can be seen that the prediction ratio decreases with increasing discharge, indicating the presence of shear thickening. On the other hand, as the prediction ratio increases with increasing discharge for the modified Bingham model, it can be concluded that the shear thickening in the pipes is not as large as measured in the rheometer. As a result,
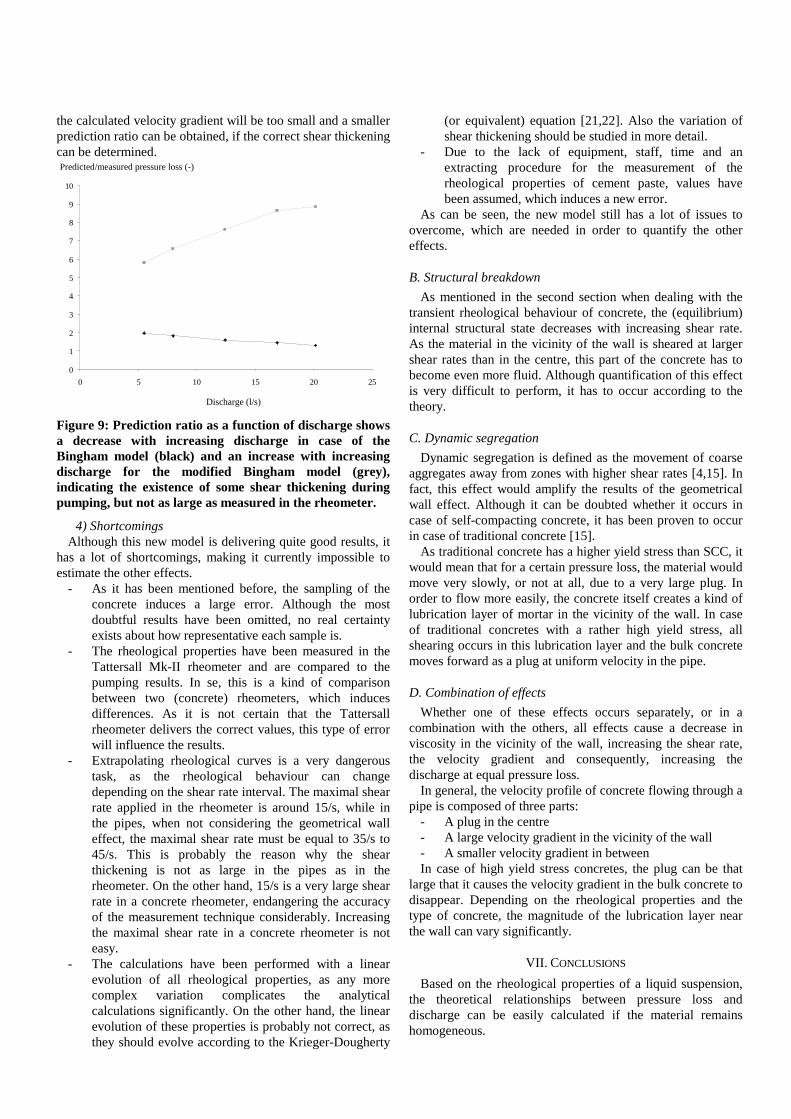
the calculated velocity gradient will be too small and a smaller prediction ratio can be obtained, if the correct shear thickening can be determined.
0
1
2
3
4
5
6
7
8
9
10
0 5 10 15 20 25
Predicted/measured pressure loss (-)
Discharge (l/s)
Figure 9: Prediction ratio as a function of discharge shows a decrease with increasing discharge in case of the Bingham model (black) and an increase with increasing discharge for the modified Bingham model (grey), indicating the existence of some shear thickening during pumping, but not as large as measured in the rheometer.
4) Shortcomings Although this new model is delivering quite good results, it
has a lot of shortcomings, making it currently impossible to estimate the other effects.
- As it has been mentioned before, the sampling of the concrete induces a large error. Although the most doubtful results have been omitted, no real certainty exists about how representative each sample is.
- The rheological properties have been measured in the Tattersall Mk-II rheometer and are compared to the pumping results. In se, this is a kind of comparison between two (concrete) rheometers, which induces differences. As it is not certain that the Tattersall rheometer delivers the correct values, this type of error will influence the results.
- Extrapolating rheological curves is a very dangerous task, as the rheological behaviour can change depending on the shear rate interval. The maximal shear rate applied in the rheometer is around 15/s, while in the pipes, when not considering the geometrical wall effect, the maximal shear rate must be equal to 35/s to 45/s. This is probably the reason why the shear thickening is not as large in the pipes as in the rheometer. On the other hand, 15/s is a very large shear rate in a concrete rheometer, endangering the accuracy of the measurement technique considerably. Increasing the maximal shear rate in a concrete rheometer is not easy.
- The calculations have been performed with a linear evolution of all rheological properties, as any more complex variation complicates the analytical calculations significantly. On the other hand, the linear evolution of these properties is probably not correct, as they should evolve according to the Krieger-Dougherty
(or equivalent) equation [21,22]. Also the variation of shear thickening should be studied in more detail.
- Due to the lack of equipment, staff, time and an extracting procedure for the measurement of the rheological properties of cement paste, values have been assumed, which induces a new error.
As can be seen, the new model still has a lot of issues to overcome, which are needed in order to quantify the other effects.
B. Structural breakdown
As mentioned in the second section when dealing with the transient rheological behaviour of concrete, the (equilibrium) internal structural state decreases with increasing shear rate. As the material in the vicinity of the wall is sheared at larger shear rates than in the centre, this part of the concrete has to become even more fluid. Although quantification of this effect is very difficult to perform, it has to occur according to the theory.
C. Dynamic segregation
Dynamic segregation is defined as the movement of coarse aggregates away from zones with higher shear rates [4,15]. In fact, this effect would amplify the results of the geometrical wall effect. Although it can be doubted whether it occurs in case of self-compacting concrete, it has been proven to occur in case of traditional concrete [15].
As traditional concrete has a higher yield stress than SCC, it would mean that for a certain pressure loss, the material would move very slowly, or not at all, due to a very large plug. In order to flow more easily, the concrete itself creates a kind of lubrication layer of mortar in the vicinity of the wall. In case of traditional concretes with a rather high yield stress, all shearing occurs in this lubrication layer and the bulk concrete moves forward as a plug at uniform velocity in the pipe.
D. Combination of effects
Whether one of these effects occurs separately, or in a combination with the others, all effects cause a decrease in viscosity in the vicinity of the wall, increasing the shear rate, the velocity gradient and consequently, increasing the discharge at equal pressure loss.
In general, the velocity profile of concrete flowing through a pipe is composed of three parts:
- A plug in the centre - A large velocity gradient in the vicinity of the wall - A smaller velocity gradient in between In case of high yield stress concretes, the plug can be that
large that it causes the velocity gradient in the bulk concrete to disappear. Depending on the rheological properties and the type of concrete, the magnitude of the lubrication layer near the wall can vary significantly.
VII. CONCLUSIONS
Based on the rheological properties of a liquid suspension, the theoretical relationships between pressure loss and discharge can be easily calculated if the material remains homogeneous.

The flow of concrete in pipes can occur in two different regimes: the flow can be dominated by liquid interactions, providing the possibility to apply the derived theoretical formulae, or it can be dominated by friction between the aggregates, increasing the pressure needed and possibly leading to blocking.
Self-compacting concrete is a much more fluid concrete type, with a lower yield stress than traditional concrete and a lower amount of coarse aggregates. As a result, the flow of this concrete type is expected to be dominated by liquid interactions.
Full scale pumping tests on self-compacting concrete have shown that the material does not remain completely homogeneous in the pipe. Several effects create a less viscous material layer near the wall increasing the velocity gradient and total discharge at equal pressure loss.
An attempt has been made in order to incorporate the geometrical wall effect into the theoretical calculations, and although promising results have been obtained, a lot of shortcomings still need to be handled.
Structural breakdown causes theoretically a decrease in rheological properties in the zones with high shear rates, which is near the wall. Unfortunately, a practical quantification of this effect is currently very difficult.
Dynamic segregation has been described as the effect enabling the movement of high yield stress traditional concrete, but it is not expected to have such a large effect on the flow of self-compacting concrete.
As a general conclusion, one can state that the velocity profile of concrete flowing through a pipe is composed of three parts:
- a plug in the centre of the pipe due to the yield stress - a part of the bulk concrete in the centre which is
sheared, if the yield stress is not too high - a lubrication layer with a large velocity gradient, of
which the magnitude and properties depend on the rheological properties and the type of concrete.
As can be seen in this paper, a lot of uncertainties still exist on this topic and further research is certainly needed in order to better understand the movement of concrete in pipes. Only in this way, measures can be taken in order to optimize the concrete transport an to increase energy savings during placing.
ACKNOWLEDGEMENTS
The authors would like to acknowledge the Research Foundation in Flanders (FWO-Vlaanderen) for the financial support of this project and the technical staff of both the Magnel and Hydraulics laboratory for the preparation and execution of numerous tests.
REFERENCES
1 Brown N.P., Heywood N. I, Slurry Handling, Design of Solid-Liquid Systems, Elsevier Applied Science, London, 1991.
2 Coussot P., Mudflow Rheology and Dynamics, Balkema, Rotterdam, 1997.
3 De Schutter G., Bartos P., Domone P., Gibbs J., Self-Compacting Concrete, Whittles Publishing, Caithness, 2008.
4 Tattersall G.H., Banfill P.F.G., The rheology of fresh concrete, Pitman, London, 1983.
5 de Larrard F., Ferraris C.F., Sedran T., Fresh concrete: A Herschel-Bulkley material, Mat. Struct. 31 (1998), 494-498.
6 Heirman G., Vandewalle L., Van Gemert D., An analytical solution of the Couette inverse problem for shear thickening SCC in a wide-gap concentric cylinder rheometer, J. non-Newt. Fluid Mech. 150 (2008), 93-103.
7 Feys D., Verhoeven R., De Schutter G., Fresh self compacting concrete: a shear thickening material, Cem. Conc. Res. 38 (2008), 920-929.
8 Yahia A., Khayat K.H., Analytical models for estimating yield stress of high-performance pseudoplastic grout, Cem. Conc. Res. 31 (2001), 731-738.
9 Wallevik J.E., Rheological properties of cement paste: Thixotropic behavior and structural breakdown, Cem. Conc. Res. 39 (2009), 14-29.
10 Roussel N., A thixotropy model for fresh fluid concretes: Theory, validation and applications, Cem. Conc. Res. 36 (2006), 1797-1806.
11 Wallevik J.E., Rheology of particle suspensions, Fresh concrete, mortar and cement paste with various types of lignosulphonates, Ph-D dissertation, The Norwegian University of Science and Technology, Trondheim, 2003.
12 Macosko C.W., Rheology Principle, measurements and applications, Wiley-VCH, New-York, 1994.
13 Poiseuille J.L.M., Recherches expérimentales sur le mouvement des liquides dans les tubes de très-petits diameters, CR Acad. Sci. Paris. 11 (1840); 961-967, 1041-1049.
14 Buckingham E., On plastic flow through capillary tubes. Proc. Am. Soc. Testing Mat. 21 (1921), 1154–1161.
15 Kaplan D., Pumping of concretes, Ph-D dissertation (in French), Laboratoire Central des Ponts et Chausées, Paris, 2001.
16 Thrane L.N., Form filling with self-compacting concrete, Ph-D dissertation, Danish Technological Institute – Technical University of Denmark, Copenhagen, 2007.
17 Browne R.D., Bamforth P.B., Tests to establish concrete pumpability, ACI-Journal 74 (1977), 193-203.
18 Ede A.N., The resistance of concrete pumped through pipelines, Mag. Conc. Res. 9 (1957), 129-140.
19 Jarny S., Roussel N., Rodts S., Bertrand F., Le Roy R., Coussot P., Rheological behavior of cement pastes from MRI velocimetry, Cem. Conc. Res. 35 (2005), 1873-1881.
20 Feys D., Interactions between rheological properties and pumping of self-compacting concrete, Ph-D dissertation, Ghent University, Ghent, 2009.
21 Krieger I.M., Rheology of monodisperse lattices, Adv. Coll. Interface Sc. 3:2 (1972), 111-136.
22 Mahaut F., Chateau X., Coussot P., Ovarlez G., Yield stress and elastic modulus of suspensions of noncolloidal particles in yield stress fluids, J. Rheol. 52 (2008), 287-313.