Pioneer Advantage: Marketing Logic or Marketing Legend? Author(s ...
14
American Marketing Association is collaborating with JSTOR to digitize, preserve and extend access to Journal of Marketing Research. http://www.jstor.org Pioneer Advantage: Marketing Logic or Marketing Legend? Author(s): Peter N. Golder and Gerard J. Tellis Source: Journal of Marketing Research, Vol. 30, No. 2 (May, 1993), pp. 158-170 Published by: American Marketing Association Stable URL: http://www.jstor.org/stable/3172825 Accessed: 20-05-2015 16:52 UTC Your use of the JSTOR archive indicates your acceptance of the Terms & Conditions of Use, available at http://www.jstor.org/page/ info/about/policies/terms.jsp JSTOR is a not-for-profit service that helps scholars, researchers, and students discover, use, and build upon a wide range of content in a trusted digital archive. We use information technology and tools to increase productivity and facilitate new forms of scholarship. For more information about JSTOR, please contact [email protected]. This content downloaded from 152.3.153.225 on Wed, 20 May 2015 16:52:23 UTC All use subject to JSTOR Terms and Conditions
Transcript of Pioneer Advantage: Marketing Logic or Marketing Legend? Author(s ...

American Marketing Association is collaborating with JSTOR to digitize, preserve and extend access to Journal of Marketing Research.
http://www.jstor.org
Pioneer Advantage: Marketing Logic or Marketing Legend? Author(s): Peter N. Golder and Gerard J. Tellis Source: Journal of Marketing Research, Vol. 30, No. 2 (May, 1993), pp. 158-170Published by: American Marketing AssociationStable URL: http://www.jstor.org/stable/3172825Accessed: 20-05-2015 16:52 UTC
Your use of the JSTOR archive indicates your acceptance of the Terms & Conditions of Use, available at http://www.jstor.org/page/ info/about/policies/terms.jsp
JSTOR is a not-for-profit service that helps scholars, researchers, and students discover, use, and build upon a wide range of content in a trusted digital archive. We use information technology and tools to increase productivity and facilitate new forms of scholarship. For more information about JSTOR, please contact [email protected].
This content downloaded from 152.3.153.225 on Wed, 20 May 2015 16:52:23 UTCAll use subject to JSTOR Terms and Conditions

PETER N. GOLDER and GERARD J. TELLIS*
Several studies have shown that pioneers have long-lived market share advan- tages and are likely to be market leaders in their product categories. However, that research has potential limitations: the reliance on a few established databases, the exclusion of nonsurvivors, and the use of single-informant self-reports for data collection. The authors of this study use an alternate method, historical analysis, to avoid these limitations. Approximately 500 brands in 50 product categories are analyzed. The results show that almost half of market pioneers fail and their mean market share is much lower than that found in other studies. Also, early market leaders have much greater long-term success and enter an average of 13 years
after pioneers.
Pioneer Advantage: Marketing Logic or
Marketing Legend?
The subject of order of market entry is critical to firms' survival and success. Pioneering new markets is expen- sive and risky, but also potentially very rewarding. If pioneers have advantages in supplies, costs, informa- tion, product quality, product line breadth, distribution, and long-term market share (Robinson and Fornell 1985), firms may benefit from early entry. In contrast, if later entrants can leapfrog pioneers with superior technology, positioning, or brand names, firms could be better off entering late (Lieberman and Montgomery 1988). Thus, the extent and nature of pioneering advantages need to be more fully understood.
Several studies have shown that pioneers have long- lived market share advantages (Bond and Lean 1977; Lambkin 1988; Parry and Bass 1990; Robinson 1988;
Robinson and Fornell 1985; Urban et al. 1986; Whitten 1979). Some researchers have interpreted these studies as showing that first entrants often become market lead- ers. The cumulative evidence led Scherer (1985) to con- clude that pioneer advantage is a general phenomenon. Though current research overwhelmingly supports the advantages of pioneering, three major concerns remain.
First, two of the main databases used for past re- search, PIMS and ASSESSOR (Urban et al. 1986), have a sampling bias from including only survivors (Day and Freeman 1990). The exclusion of pioneers that have failed may overstate the advantage of pioneers. Indeed, as time passes after a pioneer has failed, successful firms in the same market may come to regard themselves as pi- oneers.
Second, PIMS and ASSESSOR data rely on self- reports of single informants to classify pioneers. In the PIMS data, an informant in each business classifies it as one of the pioneers, an early follower, or a late entrant. In the ASSESSOR data, an informant in each firm pro- vides the year it entered the market. Though surveys for these data may have at times contacted more than one informant, they did not collect multiple measures to as- sess reliability and validity. Such self-reported data by single informants present a potential measurement prob- lem. Respondents, especially if newer employees, may not be well informed about the order of market entry, especially of older products that have existed for decades or longer. Self-perception bias may lead respondents in
*Peter N. Golder is a doctoral candidate and Gerard J. Tellis is Associate Professor, Graduate School of Business Administration, University of Southern California.
The authors deeply appreciate the advice, encouragement, and valu- able contributions of Gary Frazier, especially during the conceptual phase of the research. They thank Robert Fisher, Jeff Inman, Mike Kamins, Dennis Rook, William Robinson, Avu Sankaralingam, Dave Stewart, and participants at a USC seminar for their comments on a
previous draft of the article. The article also benefited from the com- ments of Barton Weitz and four anonymous JMR reviewers. The au- thors gratefully acknowledge financial support from the Marketing Science Institute and Univeristy of Southern California Graduate School of Business Administration and the generous provision of data by Simmons Market Research Bureau.
158
Journal of Marketing Research Vol. XXX (May 1993), 158-70
This content downloaded from 152.3.153.225 on Wed, 20 May 2015 16:52:23 UTCAll use subject to JSTOR Terms and Conditions

PIONEER ADVANTAGE 159
dominant firms to classify themselves as pioneers. This bias may be one reason why 52% of firms in the PIMS data classify themselves as pioneers, including multiple competitors in the same product category (Buzzell and Gale 1987; Lieberman and Montgomery 1988).
Third, the PIMS definition of "pioneer" is inconsis- tent with the term's use by researchers. PIMS defines pioneers as "one of the pioneers in first developing such products or services" (Buzzell and Gale 1987, p. 260). PIMS does not identify the firstfirm in each product cat- egory even though the researchers who used the PIMS data conceptually define a pioneer as the first entrant in a market. Therefore, PIMS data are capable of deter- mining only an early entry advantage, not a pioneer ad- vantage. This distinction is critical and not pedantic. For example, if certain early entrants can dominate markets by entering after pioneers in order to learn from the pi- oneers' mistakes, it would be inappropriate to classify their advantage as pertaining to the pioneer.
Researchers have advocated using new data and re- search methods to study pioneer advantage (e.g., Lie- berman and Montgomery 1988). Different approaches can compensate for some of the limitations of previous research. Our study has three primary objectives.
1. To estimate the rewards of pioneers after controlling for survival bias by studying successful and unsuccessful pi- oneers. The study examines rewards in three areas: suc- cess rate, market share, and market leadership.
2. To demonstrate the use of a new method for studying this phenomenon, historical analysis.
3. To provide an objective measure of the true pioneer or first entrant in each product category by using this method.
In accomplishing these objectives, we hope to provide new insights on pioneering and order of entry. Previous studies (Robinson and Fornell 1985; Urban et al. 1986) addressed order-of-entry effects among only surviving brands. We examine the performance of both failed and surviving pioneers. In addition, we compare their per- formance with that of early and current market share leaders.
We first present the definitions, background, and method of the study. Then we report and discuss the re- sults. We close with conclusions and implications.
DEFINITIONS
We define four key terms used in the study. -Inventor is the firm(s) that develops patents or important
technologies in a new product category. -Product pioneer is the first firm to develop a working
model or sample in a new product category. -Market pioneer is the first firm to sell in a new product
category. -Product category is a group of close substitutes such that
consumers consider the products substitutable and dis- tinct from those in another product category.
More than one firm may be an inventor in a product category because many ideas and processes may be in-
volved in a completely new product. We provide a sep- arate classification for product pioneers because they are not always the same as the market pioneer, but are im- portant players in new markets.
Our definition of "market pioneer" is consistent with that of "pioneer" or "first mover" in other studies. Schmalensee (1982, p. 350) defined a pioneer as "the first appearance" of a brand in "a distinctly new prod- uct" category. Robinson and Fornell (1985, p. 305) de- fined a market pioneer as "the first entrant in a new mar- ket" and Urban et al. (1986) defined the pioneer as the first product to enter the market. Lieberman and Mont- gomery's (1988) review concluded that the standard def- inition for identifying pioneers based on market entry was appropriate. We use an operational definition for market pioneers that is the same as the conceptual def- inition. In contrast, other researchers operationalized market pioneers as early entrants that survive. Thus, our study addresses a slightly different issue. Because our study is primarily about market pioneers, we use the term "pioneer" alone to mean "market pioneer."
Product category has long been considered a some- what ambiguous concept (Day, Shocker, and Srivastava 1979). Determining separate product categories is an empirical issue that may be resolved only in retrospect after the category develops. Our definition is consistent with research that has taken a customer orientation in determining product categories (Day, Shocker, and Sri- vastava 1979; Loken and Ward 1990; Ratneshwar and Shocker 1991; Sujan and Bettman 1989).
The example of mainframe computers may clarify how our definitions apply. Much of the early research was done during World War II and many firms can be con- sidered inventors. The product pioneer is widely re- garded to be the ENIAC developed at The University of Pennsylvania. The market pioneer is Remington-Rand, which sold a Univac to the Census Bureau in 1951. IBM entered in 1953 with a sale to the government research facility at Los Alamos, New Mexico, and had estab- lished dominance by 1955 (Shurkin 1984).
BACKGROUND
This section summarizes the theories and evidence for and against a pioneer advantage. Our purpose is not to develop new theory or evaluate current theories, but merely to provide a background for our research.
Theories of Pioneer Advantage We classify the theories that support pioneer advan-
tage by whether the advantage is based on consumers or producers.
Consumer-based advantages relate to the benefits that can be derived from the way consumers first choose and then repurchase the product. Three of these theories have been fairly well developed. First, Schmalensee (1982) argues that when consumers successfully use the first brand in a new product category, they will favor it over later entrants because they know with certainty that it
This content downloaded from 152.3.153.225 on Wed, 20 May 2015 16:52:23 UTCAll use subject to JSTOR Terms and Conditions

160 JOURNAL OF MARKETING RESEARCH, MAY 1993
works. This reasoning is similar to the argument that consumers develop stable preferences for early entrants (Bain 1956). Second, Carpenter and Nakamoto (1989) use a slightly different rationale by applying learning theory to explain pioneer advantage. This theory argues that the pioneer influences how consumers evaluate at- tributes in the product category and that the pioneer may become the standard for the product category. Third, Lane (1980) shows how firms that enter early and position near the center of the market can receive higher profits. Fur- ther, he shows how first entrants can earn large profits and still prevent further entry. Finally, a pioneer can "lock- in" consumers in categories that have high switching costs. Some of these consumer-based advantages may also ap- ply to resellers (Alpert, Kamins, and Graham 1992).
Producer-based advantages refer to the benefits de- rived from the supply of the product, and are based on the concept of barriers to entry (Bain 1956). Robinson and Fornell (1985) and Urban et al. (1986) consider them to be major causes of pioneer advantage. For example, economies of scale and learning could lead to lower costs for pioneers. Other important advantages are technolog- ical leadership (Gilbert and Newberry 1982; Lieberman and Montgomery 1988; Spence 1981) and preemption of scarce assets (Lieberman and Montgomery 1988; Pres- cott and Visscher 1977; Schmalensee 1978; Spence 1977). Staying at the forefront of technology enables pioneers to consistently have better products than competitors. Also, when only a limited number of suppliers are pres- ent, long-term agreements can prevent them from sup- plying later entrants. Karakaya and Stahl (1989) review several other barriers to entry that contribute to the pro- ducer advantages of pioneers.
Evidence for Pioneer Advantage The evidence for pioneer advantage comes from three
sources: PIMS data, other private data, and the business
press. The majority of studies supporting pioneer ad- vantage are based on PIMS data (Lambkin 1988; Lamb- kin and Day 1989; Parry and Bass 1990; Robinson 1988; Robinson and Fornell 1985). Table 1 summarizes their findings. Note that the market share of pioneers is con- sistent across all types of goods and firms. The weighted average market share of pioneers is 29%. For consumer goods (Parry and Bass 1990; Robinson and Fornell 1985), the weighted average market share is also 29%. The cu- mulative evidence from the PIMS data leaves little doubt of a substantial market share reward from pioneering. Similarly, the PIMS data also show that pioneers tend to be market leaders. Seventy percent of market leaders are pioneers, and almost half of all pioneers are market leaders (Buzzell and Gale 1987).
Three studies on pioneering have used other private data. Urban et al. (1986) demonstrated a strong pioneer advantage by using the ASSESSOR data. They found that the second firm to enter the market would obtain only 71% as much market share as the pioneer, and the third firm to enter would obtain only 58% as much. Us- ing the assumptions in their article, Urban et al. (1986, p. 654) estimated the market share of pioneers to be 43.6, 35.7, or 30.8% with three, four, or five brands in a cat- egory. Their own database includes an average of 3.6 brands per category. They also point out the possibility of the pioneer failing after a second firm enters. How- ever, they state, "We are not aware of the existence of this situation in the categories we studied" (p. 655). Bond and Lean (1977) carried out a longitudinal analysis of two prescription drug markets and found pioneers have a long-lived market share advantage. Whitten (1979) analyzed seven subcategories of the cigarette market to reach a similar conclusion.
One study reported in the business press (Advertising Age 1983) has often been used as evidence of pioneer advantage (e.g., Carpenter and Nakamoto 1989). This
Table 1 PIONEERS' MARKET SHARE ADVANTAGE IN THE PIMS DATA
Market share (%)
Advantage Early Late pioneer -
Study Pioneer follower entrant late entrant
Robinson and Fornell (1985) Consumer goods (n = 371) 29 17 12 17
Robinson (1988) Industrial goods (n = 1209) 29 21 15 14
Parry and Bass (1990) Concentrated industry
Consumer goods (n = 437) 34 24 17 17 Industrial goods (n = 994) 33 26 20 13
Nonconcentrated industry Consumer goods (n = 156) 12 7 6 6 Industrial goods (n = 293) 14 10 8 6
Lambkin (1988) Start-up firms (n = 129) 24 10 10 14 Adolescent firms (n = 187) 33 19 13 20
This content downloaded from 152.3.153.225 on Wed, 20 May 2015 16:52:23 UTCAll use subject to JSTOR Terms and Conditions

PIONEER ADVANTAGE 161
study compares the ranks of market share leaders in 25 product categories in 1923 with their ranks in 1983 (see Table 2). Of these 25 leaders in 1923, 19 were still first, four were second, one was third, and one was among the top five in 1983.
Theories Against Pioneer Advantage The literature suggests at least seven reasons why pi-
oneers may be at a disadvantage, some of which have been better developed as theories. Lieberman and Mont- gomery (1988) review four factors: free-rider effects, shifts in technology, shifts in customer needs, and incumbent inertia. Additionally, improper positioning, changing re- source requirements, and insufficient investments may prevent the pioneer from capturing market leadership. We briefly review each of these factors.
First, free-rider effects are present when a late entrant can acquire the same technology at a lower cost. Fersht- man, Mahajan, and Muller (1990) show that under some conditions, final market shares do not depend on order of entry because of information diffusion among firms. Similarly, a late entrant can also acquire more produc- tive labor than the pioneer (Guasch and Weiss 1980). Second, good opportunities for successful late entry oc- cur with technological discontinuities (Yip 1982). Late entrants can capture market leadership by implementing superior technology to produce a better or cheaper prod- uct before the pioneer. Third, shifts in consumers' tastes also provide opportunities for late entrants better posi- tioned for such shifts than pioneers. For instance, since
Table 2 MARKET SHARE RANK OF BRANDS: 1923 VS 1983 AS
PUBLISHED IN ADVERTISING AGE (1983)
Brand 1923 rank 1983 rank
Swift's Premium bacon 1 1 Kellogg's corn flakes 1 3 Eastman Kodak cameras 1 1 Del Monte canned fruit 1 1 Hershey's chocolates 1 2 Crisco shortening 1 2 Carnation canned milk 1 1 Wrigley chewing gum 1 1 Nabisco biscuits 1 1 Eveready flashlight batteries 1 I Gold Medal flour 1 1 Life Savers mint candies 1 1 Sherwin-Williams paint 1 I Hammermill paper 1 1 Prince Albert pipe tobacco 1 1 Gillette razors 1 1 Singer sewing machines 1 1 Manhattan shirts 1 top 5 Coca-Cola soft drinks 1 1 Campbell's soup 1 1 Ivory soap 1 1 Lipton tea 1 1 Goodyear tires 1 I Palmolive toilet soap 1 2 Colgate toothpaste 1 2
the mid-1800s, new leaders have emerged in the soft drink category as the preferred flavor has changed from lemon to ginger ale to cola. Fourth, incumbent inertia may de- ter a pioneer from making the investments necessary to remain a market leader. Such inertia may be profit-max- imizing for a pioneer if the return on investment from market leadership is below that available elsewhere. In this case, the best strategy for a pioneer is to steadily harvest market share (Lieberman and Montgomery 1988).
Fifth, late entrants may gain an advantage by posi- tioning at the "ideal point" in attribute space if the pi- oneer has not done so and its costs of repositioning are high. Such a situation may occur if the ideal point be- comes apparent only after the product is widely intro- duced. Sixth, pioneers may not have long-lived advan- tages if they are unable to adapt successfully to change. This situation occurs when the pioneer's competencies fail to meet the changes in demand, competitive threats, or the environment (Abell 1978). Seventh, pioneers may not be willing or able to commit the resources to succeed in new markets. For example, Chandler (1990) shows how the firm that commits resources for large-scale pro- duction, not necessarily the pioneer, tends to lead the market.
Evidence Against Pioneer Advantage Scattered evidence, some of it indirect, may support
some of the preceding theories. Some studies have not examined pioneer advantage specifically and others have not covered a broad cross section of goods. Therefore, the findings can be considered only suggestive of a pi- oneer disadvantage.
Glazer (1985) examined newspapers in Iowa from 1836 to 1976. He found that in successful markets, first en- trants survived longer than second entrants, but in all markets first entrants survived as long as second en- trants. Another study examining 100 successes and 100 failures found that the advantages of being "first-in" were almost equally balanced by the many pitfalls and dis- advantages (Cooper 1979). In a convenience sample of French industrial products, Lilien and Yoon (1990) found lower market shares for first and second entrants and higher market shares for third and fourth entrants. A case study found six markets in which pioneers were suc- cessful and six markets in which pioneers were unsuc- cessful (Schnaars 1986). Another study found that late entry by brand extensions was successful (Sullivan 1991). Finally, using PIMS data, Moore, Boulding, and Good- stein (1991) questioned some conclusions about the ef- fect of pioneering on market share by treating pioneering as endogenous rather than exogenous. Similarly, using reverse regression, Van Honacker and Day (1987) sug- gest that pioneer market share advantages may result from superior performance rather than time of entry.
Summary The preceding review describes several theories for and
against pioneer advantage. However, the empirical evi-
This content downloaded from 152.3.153.225 on Wed, 20 May 2015 16:52:23 UTCAll use subject to JSTOR Terms and Conditions
162 JOURNAL OF MARKETING RESEARCH, MAY 1993
dence strongly favors a pioneer advantage. Studies that specifically examine order-of-entry effects all support some pioneer advantage. In particular, they show that pioneers are more likely than late entrants to (1) have high market share, (2) succeed, or (3) be market leaders in their product categories.
However, as explained previously, these studies have three limitations that may qualify their conclusions: (1) a bias toward studying only surviving firms, (2) a single- informant's self-reported measure of order of market en- try, and (3) the use of the PIMS definition of "one of the pioneers" to mean the pioneer or first entrant in a market. The source of these problems is the use of large cross-sectional databases (e.g., PIMS, ASSESSOR) that may not have been designed to study order-of-entry ef- fects. Indeed, authors have specifically called for alter- nate methods to avoid these limitations. We adopt one such method for our study.
METHOD
Our study method is historical analysis, which we ex- plain in terms of rationale, procedure, and sampling.
Rationale
Historical analysis is a method that is probably best suited to analyzing the rewards of order of market entry, especially because the records of nonsurvivors are sparse. It is a process of assembling, critically examining, and summarizing the records of the past (Gottschalk 1969). This method of inquiry has been used sparingly in busi- ness research, though most notably by Chandler (e.g., 1990). The records of the past used in our study are all publicly available, published sources of information.
The primary advantage of historical analysis is that it focuses on information collected at the time the new product category was emerging. The approach provides a prospective look at pioneering because information is based on records written as the product category devel- oped. In contrast, surveys or interviews with current sur- vivors may be considered retrospective because the re- spondents report on events that occurred decades or centuries previously. To do so, respondents rely on per- sonal recall or the oral tradition of the firm being sur- veyed.
A second advantage of historical analysis is that it can use multiple narratives of neutral observers such as re- porters, experts, and students of the market. In contrast, surveys tend to rely on self-reports of one or two infor- mants in the firms being studied. Thus, the historical approach is more likely to collect data that are factual rather than interpretive.
Researchers have often called for historical analysis in marketing (Nevett 1991; Savitt 1980). The approach is particularly well suited for the chronological dimension in research on pioneering. On the basis of their literature review, Lieberman and Montgomery (1988) emphasize the need for new data for studying pioneering. Robinson and Fornell (1985) note that the static nature of their cross-
sectional analysis precludes consideration of important events that occur over time. Aaker and Day (1986) found that the techniques of historians would provide useful insights and generalizations for the analysis of growth markets. Urban et al. (1986) suggest that historical data would be useful in research on pioneering.
Procedure
We sought information on 17 key variables in each product category: the firms classified as product pioneer, market pioneer, early leader, and current leader; parent company, date of market entry, and current market share of each firm in these four classifications; and duration of leadership of pioneers. We also recorded information on many other related variables, events, and firms.
The sources covered for our study are myriad and are of two types: periodicals and books. First, we collected usable information from 450 articles in 25 different pe- riodicals, though several hundred more articles were ex- amined. Two of the most helpful and commonly used periodicals were Business Week and Advertising Age. Second, we collected usable information from 125 books and examinied about 125 more. These books tend to document individual product categories and brands. Many were written by university professors and contain ref- erences to periodicals going back hundreds of years. One of the reasons for examining so many sources is to find articles written close to the time each event occurred. Another reason is to corroborate as many sources as pos- sible.
Some degree of uncertainty is inherent in the historical method because the researcher may face evidence that is diverse, complicated, and sometimes contradictory (Nevett 1991). Therefore, we used four criteria in evaluating and accepting information (see Gottschalk 1969 for a primer).
1. Competence: Is the informant able to report correct in- formation?
2. Objectivity: Is the informant willing to report correct in- formation (i.e., no vested interest)?
3. Reliability: Is the informant a trusted source of accurate information?
4. Corroboration: Is there confirmatory evidence from a similar source?
The competence criterion is satisfied by relying on highly regarded sources that were written or based on information written at the time each firm made an im- portant move in the product category. The objectivity criterion is satisfied by relying on sources of information that were written by disinterested third parties. The re- liability criterion is satisfied by using information from sources that have been well respected for a long time. For example, the top five periodicals used in our study are Advertising Age, Business Week, Consumer Reports, Dealerscope Merchandising, and Forbes. The longevity and continued respect for these periodicals attest to their reliability. A list of all sources used in the study is avail- able from the authors. The corroboration criterion is sat-
This content downloaded from 152.3.153.225 on Wed, 20 May 2015 16:52:23 UTCAll use subject to JSTOR Terms and Conditions
PIONEER ADVANTAGE 163
isfied by using information from multiple data sources for each product category.
As an illustration of the effectiveness of the method used in our study, consider the following quotations from Financial World about a company in the restaurant busi- ness:
-"World's biggest chain of highway restaurants" (May 20, 1964, p. 5).
-"Pioneer in restaurant franchising" (April 5, 1967, p. 6). -"Most strongly entrenched factor and highest quality in-
vestment" (April 5, 1967, p. 6). -"Most fabulous success story in restaurant chains" (Sep-
tember 8, 1965, p. 5).
These statements probably bring McDonald's to mind. Indeed, if written today they probably would be describ- ing McDonald's. However, these statements were writ- ten in the 1960s and they refer not to McDonald's, but to Howard Johnson's restaurants. Because restaurant franchising was developing in the 1960s, information about this market was collected from publications writ- ten in the 1960s. Thus, the prospective approach of his- torical analysis can be more insightful and accurate than the retrospective approach of surveys or interviews con- ducted today.
Sampling The data for our study come from three sequential
samples containing a total of 50 product categories. Be- cause the results of the first sample were surprising, we selected two more samples on entirely different princi- ples to validate the findings. In addition, the different samples enable us to determine how sampling affects the results.
Sample I is a selective sample based on three criteria. First, the sample includes only consumer goods. Sec- ond, it covers only recent product categories because of the easier availability of information on them. Third, the sample contains both new product categories (e.g., mi- crowave ovens) and extensions of existing product cat- egories (e.g., light beer). We found 17 product cate- gories satisfying these criteria.
Sample 2 consists of 12 categories from the 25 in the Advertising Age report of long-term leaders (see Table 2). These 12 were chosen because they are distinctive and new within recent history. The other 13 categories, which are too old for identification of the market pi- oneers, are analyzed separately in Table 3.
Sample 3 consists of seven product categories, each of which contains a widely acknowledged market pi- oneer such as Xerox and Polaroid. (Samples 1 and 2 also contain a few widely acknowledged pioneers such as Apple, Pampers, and Singer.)
Thus, by definition, sample 2 and especially sample 3 are more favorable to the null hypothesis that pioneers are successful.
RESULTS
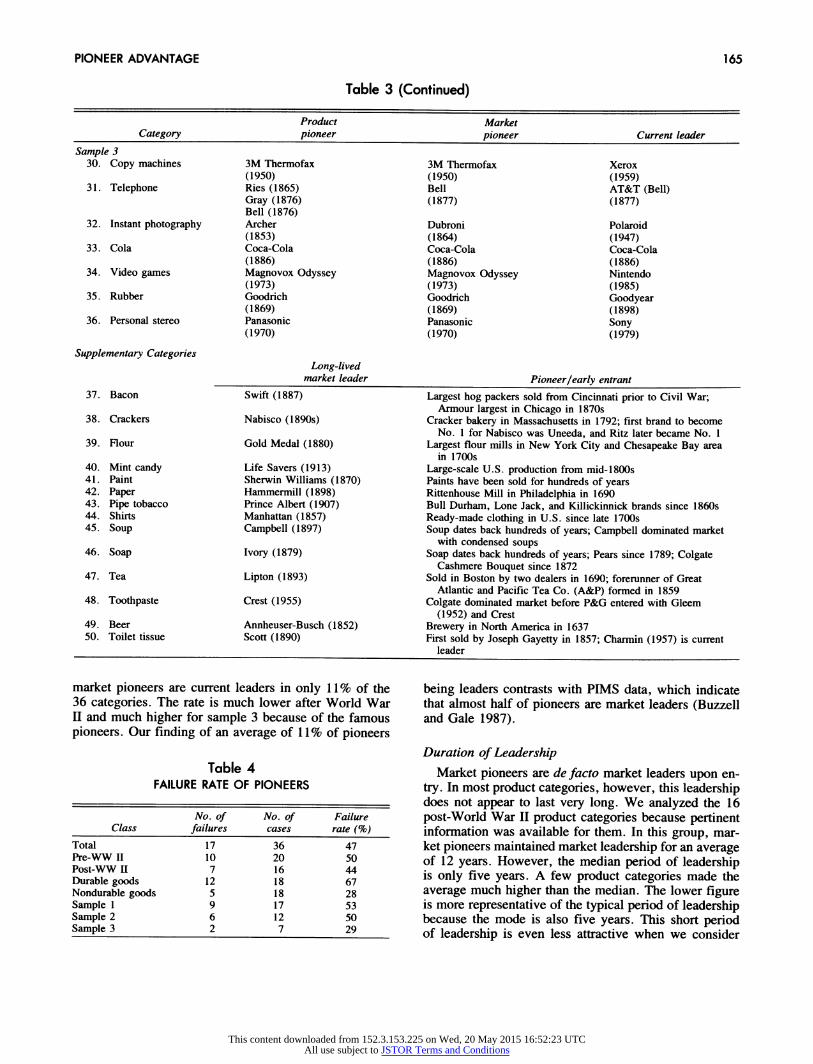
Table 3 contains the main data obtained from exten- sive analysis of historical records. The product pioneer, market pioneer, current market leader, and year of entry are reported separately for samples 1, 2, and 3. Because of limited information on the 14 supplementary cate- gories, we report only the long-lived market leader and pioneer or early entrant. Tables 4 through 6 summarize the performance of pioneers in terms of failure rate, mar- ket share, and market leadership for the 36 product cat- egories in samples 1, 2, and 3. This section merely high- lights the results reported in the tables and contrasts them to those of prior studies; we try to explain the differences in the discussion.
Failure Rate
By "failure" we mean the end of sales in the category under the brand name with which it entered. We use "success" and "survival" as antonyms for failure. Table 4 shows the failure rate of market pioneers to be 47%. This high failure rate is not due to old categories; note that the rate is similar for categories starting before and after World War II. In contrast, other researchers claim that the failure of market pioneers does not alter their findings or that no pioneers failed in the categories stud- ied (Urban et al. 1986). Table 4 shows some differences in failure rates across classes. The failure rate is lower for sample 3 because that sample was chosen specifically to include only well-known pioneers. The failure rate is also more than twice as high for durable than for non- durable goods. This finding can be attributed to more technological change in durable goods categories. Over- all, our finding of a 47% failure rate suggests that the survival bias could be a potential problem in past studies and should be considered in future work.
Market Share
Table 5 shows mean market share of pioneers to be 10%. For product categories starting after World War II, average market share of pioneers is only 7%. Market share is higher for nondurable goods, probably because of their lower failure rate. The market share of pioneers is much higher for sample 3, which contains some fa- mous pioneers. Most important, our finding of an av- erage market share of 10% for pioneers is substantially lower than the 30% market share found by several re- searchers from the PIMS data (Table 1) and also by Ur- ban et al. (1986) from the ASSESSOR data. Indeed, even the market share advantage of about 15 percentage points for pioneers over late entrants in the PIMS data is higher than the mean market share of pioneers in our data. These figures run contrary to the prevalent belief of a dominant and long-lived market share reward for pioneers.
Market Leadership In the rest of the article, we use the term "leader"
alone for the market share leader. Table 6 shows that the
This content downloaded from 152.3.153.225 on Wed, 20 May 2015 16:52:23 UTCAll use subject to JSTOR Terms and Conditions

164 JOURNAL OF MARKETING RESEARCH, MAY 1993
Table 3 CHARACTERISTICS OF SAMPLES 1 THROUGH 3 AND SUPPLEMENTARY CATEGORIES
(date of firm's market entry in parentheses)
Product Market Category pioneer pioneer Current leader
Sample 1 1. Video recorders Ampex Ampex RCA/Matsushita
(1956) (1963) (1977) 2. Microwave ovens Raytheon Amana GE/Samsung
(1946) (1966) (1979) 3. Dishwasher Crescent Washing Machine Co. Crescent Washing Machine Co. GE
(1900) (1900) (1935) 4. Laundry dryers Canton clothes dryer Canton clothes dryer Whirlpool
(1925) (1925) (1950) 5. Facsimile machines Xerox Xerox Sharp
(1964) (1964) (1982) 6. Personal computer MITS MITS IBM
(1975) (1975) (1981) 7. Camcorder Sony, JVC Kodak/Matsushita RCA/Matsushita
(1982) (1984) (1985) 8. Color TV set Bell Labs RCA RCA/Thomson
(1929) (1954) (1954) 9. Wine cooler California Cooler California Cooler Seagram, Bartles &
(1979) (1981) Jaymes (1984)
10. Laundry detergent Reychler Dreft Tide (1913) (1933) (1946)
11. Disposable diapers Chux Chux P&G/Pampers and Luvs (1950) (1950) (1961)
12. Frozen dinners Swanson Swanson Stouffer (1946) (1946) (1956)
13. Liquid dishwashing Liquid Lux Liquid Lux Ivory Liquid detergent (1948) (1948) (1957)
14. Light beer Trommer's Red Letter Trommer's Red Letter Miller Lite (1961) (1961) (1975)
15. Diet cola Kirsch's No-cal cola Kirsch's No-cal cola Diet Coke (1952) (1952) (1982)
16. Liquid laundry Wisk Wisk Liquid Tide detergent (1956) (1956) (1984)
17. Dandruff shampoo Fitch's Fitch's Head & Shoulders (1919) (1919) (1961)
Sample 2 18. Cereal Granula Granula Kellogg
(1863) (1863) (1906) 19. Cameras Daguerrotype Daguerrotype Kodak
(1839) (1839) (1888) 20. Canned fruit Libby, McNeill, Libby Libby, McNeill, Libby Del Monte
(1868) (1868) (1891) 21. Chocolate Whitman's Whitman's Hershey
(1842) (1842) (1903) 22. Vegetable shortening Crisco Crisco Crisco
(1911) (1911) (1911) 23. Canned milk Borden Borden Carnation
(1856) (1860) (1899) 24. Chewing gum Black Jack/ American Chicle Black Jack/ American Chicle Wrigley
(1871) (1871) (1892) 25. Flashlight batteries Bright Star Bright Star Eveready
(1909) (1909) (1920) 26. Safety razors Star Star Gillette
(1876) (1876) (1903) 27. Sewing machine Elias Howe 4 firms Singer
(1842) (1849) (1851) 28. Soft drinks Vernors Vernors Coca-Cola
(1866) (1866) (1886) 29. Tires Hartford Rubber Works Hartford Rubber Works Goodyear
(1895) (1895) (1898)
This content downloaded from 152.3.153.225 on Wed, 20 May 2015 16:52:23 UTCAll use subject to JSTOR Terms and Conditions
PIONEER ADVANTAGE 165
Table 3 (Continued)
Product Market Category pioneer pioneer Current leader
Sample 3 30. Copy machines 3M Thermofax 3M Thermofax Xerox
(1950) (1950) (1959) 31. Telephone Ries (1865) Bell AT&T (Bell)
Gray (1876) (1877) (1877) Bell (1876)
32. Instant photography Archer Dubroni Polaroid (1853) (1864) (1947)
33. Cola Coca-Cola Coca-Cola Coca-Cola (1886) (1886) (1886)
34. Video games Magnovox Odyssey Magnovox Odyssey Nintendo (1973) (1973) (1985)
35. Rubber Goodrich Goodrich Goodyear (1869) (1869) (1898)
36. Personal stereo Panasonic Panasonic Sony (1970) (1970) (1979)
Supplementary Categories Long-lived
market leader Pioneer/early entrant 37. Bacon Swift (1887) Largest hog packers sold from Cincinnati prior to Civil War;
Armour largest in Chicago in 1870s 38. Crackers Nabisco (1890s) Cracker bakery in Massachusetts in 1792; first brand to become
No. 1 for Nabisco was Uneeda, and Ritz later became No. 1 39. Flour Gold Medal (1880) Largest flour mills in New York City and Chesapeake Bay area
in 1700s 40. Mint candy Life Savers (1913) Large-scale U.S. production from mid-1800s 41. Paint Sherwin Williams (1870) Paints have been sold for hundreds of years 42. Paper Hammermill (1898) Rittenhouse Mill in Philadelphia in 1690 43. Pipe tobacco Prince Albert (1907) Bull Durham, Lone Jack, and Killickinnick brands since 1860s 44. Shirts Manhattan (1857) Ready-made clothing in U.S. since late 1700s 45. Soup Campbell (1897) Soup dates back hundreds of years; Campbell dominated market
with condensed soups 46. Soap Ivory (1879) Soap dates back hundreds of years; Pears since 1789; Colgate
Cashmere Bouquet since 1872 47. Tea Lipton (1893) Sold in Boston by two dealers in 1690; forerunner of Great
Atlantic and Pacific Tea Co. (A&P) formed in 1859 48. Toothpaste Crest (1955) Colgate dominated market before P&G entered with Gleem
(1952) and Crest 49. Beer Annheuser-Busch (1852) Brewery in North America in 1637 50. Toilet tissue Scott (1890) First sold by Joseph Gayetty in 1857; Charmin (1957) is current
leader
market pioneers are current leaders in only 11% of the 36 categories. The rate is much lower after World War II and much higher for sample 3 because of the famous pioneers. Our finding of an average of 11% of pioneers
Table 4 FAILURE RATE OF PIONEERS
No. of No. of Failure Class failures cases rate (%)
Total 17 36 47 Pre-WW II 10 20 50 Post-WW II 7 16 44 Durable goods 12 18 67 Nondurable goods 5 18 28 Sample 1 9 17 53 Sample 2 6 12 50 Sample 3 2 7 29
being leaders contrasts with PIMS data, which indicate that almost half of pioneers are market leaders (Buzzell and Gale 1987).
Duration of Leadership Market pioneers are de facto market leaders upon en-
try. In most product categories, however, this leadership does not appear to last very long. We analyzed the 16 post-World War II product categories because pertinent information was available for them. In this group, mar- ket pioneers maintained market leadership for an average of 12 years. However, the median period of leadership is only five years. A few product categories made the average much higher than the median. The lower figure is more representative of the typical period of leadership because the mode is also five years. This short period of leadership is even less attractive when we consider
This content downloaded from 152.3.153.225 on Wed, 20 May 2015 16:52:23 UTCAll use subject to JSTOR Terms and Conditions

166 JOURNAL OF MARKETING RESEARCH, MAY 1993
Table 5 MARKET SHARE OF PIONEERS (1990)
Mean market No. of
Class share (%) cases
Total 10 36 Pre-WW II 13 20 Post-WW II 7 16 Durable goods 7 18 Nondurable goods 13 18 Sample 1 6 17 Sample 2 10 12 Sample 3 21 7
that the product category often has not achieved signif- icant sales levels in the initial years of leadership.
Nature of Leadership The proposition of a long-lived market share leader-
ship for pioneers is supported in only four of the 50 product categories studied. However, detailed analysis of these four categories shows that attributing current market position to market pioneering can be supported unambiguously in only one instance, Crisco shortening. In the other three categories the effect of being first in the market is less clear. For instance, Coca-Cola "en- tered the market as one of thousands of exotic medicinal products belonging to the nationwide patent medicine in- dustry" (Louis and Yazijian 1980, p. 14). Coca-Cola originally contained two stimulants, kola nut extract with caffeine and coca leaves with cocaine. These addictive ingredients probably contributed as much to repeat pur- chase behavior as any other factor posited by theories supporting a pioneer advantage. In color television sets, RCA still has the highest market share but General Elec- tric sold its color TV set business to Thomson Electron- ics of France because it was not profitable enough. Fi- nally, in the telephone product category, Bell was able to dominate the market only after reaching a settlement with Western Union for patent infringement. This set- tlement called for Bell to pay 20% of its revenues to Western Union for 17 years.
Table 6 LEADERSHIP OF PIONEERS
No. of No. of Percentage of Class leaders cases leaders
Total 4 36 11 Pre-WW II 3 20 15
Post-WW II 1 16 6 Durable goods 2 18 11 Nondurable goods 2 18 11 Sample 1 1 17 6 Sample 2 1 12 8 Sample 3 2 7 29
In all of the other 46 categories, the pioneers either failed or are not leaders, or leaders were incorrectly clas- sified as pioneers. This conclusion may seem surprising, but an example demonstrates the insights provided by our research method. Most people think of Xerox as the pioneer in copying machines, but consider the following quotation from an article about Xerox's entry into copy- ing (Business Week, September 19, 1959, p. 86).
Office copying is a field where Haloid (Xerox) will find plenty of competition. Most of the 30 or so copying machine manufacturers are already in it with a variety of products and processes-including such strong competition as Minnesota Mining & Mfg. Co. (Thermo-fax), Eastman Kodak (Verifax), and American Photocopy Equipment Co. (Apeco).
DISCUSSION
We first explain our results in comparison with the findings of previous research, then report some results about "early leaders" and cite some important limita- tions and directions for future research.
Comparison With Previous Research
Our findings indicate that the rewards of pioneering are less than those found in previous research. The dif- ference may be due to three important factors: (1) the sampling of nonsurvivors, (2) the operational definition of the pioneer, and (3) the historical method. A consid- eration of these factors suggests that our results comple- ment rather than contradict past findings.
First, a key difference between our study and prior studies is our sampling of all firms, both survivors and nonsurvivors. By so doing, we found a failure rate of 47% for pioneers, which is closer to the failure rate of 33 to 35% found in the Booz, Allen & Hamilton (1982) study of new products. The substantially lower market share of pioneers (10%) we found is due partially to the high number of failed market pioneers with an effective market share of zero. To determine the effect of failed pioneers, we calculated the average market share of only surviving pioneers and found it to be 19%. This figure is closer to the approximately 30% market share found by Robinson and Fornell (1985) and Urban et al. (1986). Other factors such as definition and measurement may contribute to the remaining 11-percentage-point differ- ence in mean market share.
Second, our operational definition of pioneer is dif- ferent from that used in previous studies (even though the conceptual definition is the same). We operational- ized pioneer as the first entrant, Urban et al. (1986) op- erationalized pioneer as the earliest surviving brand in the ASSESSOR database, and Robinson and Fomrnell (1985) operationalized pioneer as "one of the pioneers
" among current survivors (the PIMS measure). As a result, our study addresses the success of first entrants whereas the other two studies address the effects of order of entry among survivors. However, these two databases
This content downloaded from 152.3.153.225 on Wed, 20 May 2015 16:52:23 UTCAll use subject to JSTOR Terms and Conditions

PIONEER ADVANTAGE 167
may not include all surviving brands in a category. Hence, the two approaches address slightly different though im- portant aspects of pioneering. One may even suggest a nonlinear relationship from these studies: first entrants and late entrants do not fare as well as early (surviving) entrants.
Third, the identification of pioneers is a potential problem in some prior studies. For example, Urban et al. (1986) identify Miller Lite as the first entrant in light beer whereas Carpenter and Nakamoto (1989) point out that Miller Lite was not the first entrant. We found that Trommer's Red Letter was the pioneer and entered 14 years before Miller Lite. We were unable to ascertain completely the extent of misidentification because of the proprietary nature of the PIMS and ASSESSOR data. Misidentification is probably due to reliance on self-re- ports instead of a thorough historical analysis of each product category.
For example, many people consider Goodyear (in- stead of Goodrich) to be the pioneer in rubber and tires because Charles Goodyear discovered the process for vulcanizing rubber. However, the Goodyear company bearing his name was founded decades after his death and decades after the entry of Goodrich. More recently, Apple Computer has been considered the pioneer in per- sonal computers. The popular press perpetuates this im- age and Apple's advertising builds on this belief. How- ever, closer analysis indicates that Apple was preceded by MITS and entered the personal computer market along with dozens of other personal computer companies (Frei- berger and Swaine 1984).
Thus, self-reports may be unreliable. As time passes and history fades, a respondent within a successful and dominant firm may consider it to be one of the pioneers, if not the pioneer. Time clouds the facts and success feeds the legend. We suspect that some surveys may have wrongly identified the early leader as the pioneer. To pursue this hypothesis, we analyzed the performance of early leaders.
Early Leaders
We define the early leader as the firm that is the mar- ket share leader during the early growth phase of the product life cycle. Table 7 indicates the performance of these firms. Note that early leaders are currently leaders in more than half of the product categories studied and have very low failure rates (8%). Most interestingly, their market share of 28% is very close to that obtained for market pioneers in PIMS and ASSESSOR data. Such similarities lead one to suspect that self-report surveys or inconsistent definitions may wrongly classify early leaders as pioneers. The success, leadership, and stabil- ity of early leaders may also explain the persistent mar- ket share stability indicated in the Advertising Age report (Table 2).
How close are early leaders to pioneers? We find that early leaders enter product categories many years after the market pioneer. In the product categories studied,
Table 7 CHARACTERISTICS OF EARLY MARKET LEADERS
Percentage No. Failure Market of of
Class rate (%) share (%) leaders cases
Total 8 28 53 36 Pre-WW II 10 35 60 20 Post-WW II 6 20 44 16 Durable goods 11 30 61 18 Nondurable
goods 6 26 44 18 Sample 1 6 21 47 17 Sample 2 8 30 50 12 Sample 3 14 42 71 7
early leaders entered 13 years after market pioneers. The time lag was 19 years in pre-World War II product cat- egories and five years in post-World War II categories. Similarly, current leaders entered 20 years after market pioneers. The time lag was 26 years in pre-World War II categories and 11 years in post-World War II cate- gories. These time lags are not trivial. In the quest to enter and dominate markets, firms time their entry very carefully, often striving to be first by months or a few years. Hence, these early leaders should not be classified as pioneers.
Why are early leaders so successful? The reason may be their ability to spot a market opportunity and their willingness to commit large resources to develop the market. Indeed, in many of the categories we studied, the start of the growth phase in the product life cycle may well be attributed to the market-building efforts of these early leaders. Our finding is similar to Chandler's (1990) for industrial goods, where long-term survival and success were due more to the commitment of adequate resources to large-scale production than to entering first.
Limitations
Our study has several limitations that future research should address. Most important, the study does not con- sider the impact of the marketing mix (e.g., advertising, price, promotion, product quality, distribution) and man- agerial effectiveness. These variables may explain why some pioneers have succeeded while others have failed. Separation of these effects would reveal the true rewards of pioneering, if any. However, it is interesting to note that inclusion of additional variables in Urban's model reduces the order-of-entry penalty: " . . . order effect parameter is -0.61 when it is the only independent vari- able, -0.53 when the positioning variable is added, -0.43 when the advertising variable also is appended, and -0.48 with all the variables" (Urban et al. 1986, p. 651). Sim- ilarly, Robinson and Fornell's (1985, p. 310) descriptive statistics indicate that pioneers have 29% market share. However, after inclusion of several additional variables such as relative product quality, relative price, number of competitors, and relative advertising and promotion,
This content downloaded from 152.3.153.225 on Wed, 20 May 2015 16:52:23 UTCAll use subject to JSTOR Terms and Conditions

168 JOURNAL OF MARKETING RESEARCH, MAY 1993
the effect of pioneering on market share is actually neg- ative (though not significant; p. 312). Historical research may be necessary to determine the true pioneer, but scanner panel data may be able to separate the effects of order of entry from those of marketing mix.
Another limitation is our use of a customer-oriented definition of product category. Though that definition is always arbitrary (Day, Shocker, and Srivastava 1979), Table 3 reveals that our product categories are all plau- sible. We have chosen to identify pioneers in distinctive product categories rather than in narrow subcategories. We believe this approach is necessary, as otherwise the theory of pioneer advantage would not be falsifiable- the leader of each subcategory could be considered its pioneer. Also, note that the rewards of pioneering are not any stronger in the lower level categories we con- sidered (numbers 13 through 17 in Table 3). However, because the identification of pioneers is contingent on determining product categories, an interesting direction for future research would be to incorporate work on product categorization (e.g., Loken and Ward 1990; Ratneshwar and Shocker 1991; Sujan and Bettman 1989). Future research could also consider issues relating to continuous and discontinuous innovation. There may be instances in which a new technology is sufficiently im- proved that a new category is formed. Pioneers that con- tinue with the old technology may not be as successful as pioneers that adopt the new technology. Determining an appropriate method for categorizing product-markets over time may help to resolve the discrepancies between our findings and those of previous studies.
One may wonder to what extent category selection drives the results. Concern about this issue led us to draw three sequential samples. Whereas sample 1 was chosen on certain objective criteria, samples 2 and 3 are in- creasingly biased in favor of finding a pioneer advan- tage. Sample 2 is from the Advertising Age report, which was based on a select 25 categories exhibiting long-term share stability. Sample 3 consists of well-known pi- oneers. A comparison of results across samples in Tables 4 through 6 shows that the results are certainly not due to choosing categories unfavorable to pioneers. More- over, if all 50 categories had been selected randomly, the results may have been more unfavorable to pioneers. Similarly, the exclusion of the 14 old categories (Table 3) from sample 2 biases the results in favor of finding successful pioneers because the market pioneers have
probably failed in these 14 categories. In addition, we chose only well-established categories. The costs and risks of pioneering unsuccessful product categories are likely to be even higher. Future research could extend this work to other categories and explore differences across cate- gories.
Another question is how sensitive even these results are to survival bias. Actually, we cannot be certain that a survival bias is not still present in these data. For ex- ample, some other firms may well have entered the mar- ket before the firm we identified as the market pioneer.
However, such other firms are more likely to have failed than to have succeeded, because a surviving pioneer would very likely have publicized that fact and early commen- tators would have noted it. Hence, a potential bias, if any, would underscore the findings because it would lead to the discovery of more unsuccessful market pioneers with 0% market share. An additional potential limitation of our study is that some of the data could be incorrect because historical records are not 100% accurate. How- ever, our use of corroborating evidence wherever pos- sible mitigates this concern. Also, because of the large number of categories and the fairly consistent findings across subcategories and classes, a few errors would not alter the main conclusions. In addition, we performed a sensitivity analysis using syndicated data from Simmons Market Research Bureau. The main results presented here are robust to this alternate source of data (Golder and Tellis 1992).
Finally, classifying pioneers as failures on the basis of market exit may produce some bias. For example, some discontinued brands might have become successful if an alternative marketing approach had been applied. Alter- natively, some brands may remain on the market too long, causing "failure" to be recorded later than it should be. Understanding and clarifying these issues is another area for future research.
If pioneers do not have rewards as great as previously believed, what motivates firms to rush a product to mar- ket? The answer is probably expected profits. Even if the probability of long-term market dominance is small, the payoff when it occurs may be so large that it may more than compensate for the risks. In addition, by def- inition all pioneers have the opportunity to collect mo- nopoly profits for some period. Our entire analysis fo- cuses on market share, not profits (similar to most other research on pioneering). Market pioneers that failed may very well have realized a good return on investment or achieved their profit goals. Also, surviving market pi- oneers with low market share could still be profitable. The issue of financial rewards to pioneers is an important area for future research. Similarly, a financial analysis of the profitability of market leaders is also important.
CONCLUSIONS AND IMPLICATIONS
Though several studies show that market pioneers have some long-term advantages, their findings are qualified by problems of survival bias, imprecise definition of the
pioneer, and self-reports of single informants from the sampled firms. We use a historical analysis of 50 cate- gories to assess the rewards of pioneering while avoiding these limitations. Our main results, subject to the limi- tations of our study, follow.
1. The mean market share of pioneers is 10%, much lower than the 30% from the PIMS and ASSESSOR data. Our analysis shows that about half of this difference is due to our sampling both survivors and nonsurvivors, and the rest is probably due to our identification of pioneers through historical records (rather than by survey).
This content downloaded from 152.3.153.225 on Wed, 20 May 2015 16:52:23 UTCAll use subject to JSTOR Terms and Conditions

PIONEER ADVANTAGE 169
2. Forty-seven percent of market pioneers fail. In compar- ison, other researchers have found no pioneers that failed, or have not considered the survival problem to be seri- ous.
3. Eleven percent of pioneers are current market leaders. In comparison, PIMS data indicate that almost half of pioneers are market leaders.
4. Our results about market pioneers are in spite of our sampling categories that are more favorable to pioneers. The results are not very sensitive to the age of the cat- egory. Indeed, pioneers are market leaders usually for only 5 to 10 years. The rewards of pioneering are stronger for nondurable goods.
5. Early market leaders that have a higher market share, success rate, and market leadership than pioneers enter markets about 13 years after the market pioneers.
Our findings have three important implications, but they should be viewed cautiously because past success or failure does not automatically imply future outcomes. First, the findings underscore the need for carefully re- searching the problem of pioneering, preferably with ex- tensive historical analysis. Second, they suggest the im- portance of continuous innovation within the product category. This approach enabled many later entrants to become successful and may help pioneers defend against new entrants. For example, Gillette has maintained lead- ership in the safety razor market by constantly innovat- ing even at the cost of cannibalizing its older brands.
Third, our results suggest that being first in a new market may not confer automatic long-term rewards. An alternative strategy worth considering may be to let other firms pioneer and explore markets, and enter after learn- ing more about the structure and dynamics of the market. Indeed, early leaders who entered an average of 13 years after the pioneer are more likely than pioneers to lead markets today. The reason is that the early leaders en- tered decisively and committed large resources to build- ing and leading the market. An example by Lieberman and Montgomery (1988) underscores this point. Mat- sushita's nickname, maneshita denki (meaning "elec- tronics that have been copied") reflects its strategy. The company generally lets Sony innovate and then takes a position based on manufacturing and marketing skills.
Actually, markets evolve over a number of years, new technologies emerge, and leading companies occasion- ally make mistakes. The logic of success is not to be first to enter the market, but to strive for leadership by scanning opportunities, building on strengths, and com- mitting resources to serve consumers effectively. The evolution of products repeatedly shows that each firm that was not able or willing to commit the resources nec- essary for market leadership was passed by another firm that was able and willing. This trend has happened throughout history and it will continue.
REFERENCES
Aaker, David A. and George S. Day (1986), "The Perils of High-Growth Markets," Strategic Management Journal, 7 (September-October), 409-21.
Abell, Derek F. (1978), "Strategic Windows," Journal of Marketing, 42 (July), 21-8.
Advertising Age (1983), "Study: Majority of 25 Leaders in 1923 Still On Top" (September 19), 32.
Alpert, Frank H., Michael A. Kamins, and John L. Graham (1992), "An Examination of Reseller Buyer Attitudes To- ward Order of Brand Entry," Journal of Marketing, 56 (July), 25-37.
Bain, Joe S. (1956), Barriers to New Competition. Cam- bridge, MA: Harvard University Press.
Bond, R. S. and D. F. Lean (1977), "Sales, Promotion, and Product Differentiation in Two Prescription Drug Markets." Washington, DC: U.S. Federal Trade Commission.
Booz, Allen & Hamilton (1982), New Product Management for the 1980's. New York: Booz, Allen & Hamilton.
Buzzell, Robert D. and Bradley T. Gale (1987), The PIMS Principles: Linking Strategy to Performance. New York: The Free Press.
Carpenter, Gregory S. and Kent Nakamoto (1989), "Con- sumer Preference Formation and Pioneering Advantage," Journal of Marketing Research, 26 (August), 285-98.
Chandler, Alfred D. (1990), "The Enduring Logic of Indus- trial Success," Harvard Business Review, 68 (March-April), 131-9.
Cooper, Robert G. (1979), "The Dimensions of Industrial New Product Success and Failure," Journal of Marketing, 43 (Summer), 93-103.
Day, George S. and Jonathan S. Freeman (1990), "Burnout or Fadeout: The Risks of Early Entry Into High Technology Markets," in Strategic Management in High Technology Firms, Michael W. Lawless and Luis R. Gomez-Mejia, eds. Greenwich, CT: JAI Press, Inc., 43-65. I- , Allan D. Shocker, and Rajendra K. Srivastava (1979), "Customer-Oriented Approaches to Identifying Product- Markets," Journal of Marketing, 43 (Fall), 8-19.
Fershtman, Chaim, Vijay Mahajan, and Eitan Muller (1990), "Market Share Pioneering Advantage: A Theoretical Ap- proach," Management Science, 36 (August), 900-18.
Freiberger, Paul and Michael Swaine (1984), Fire in the Val- ley: The Making of the Personal Computer. Berkeley CA: Osborne/McGraw-Hill.
Gilbert, R. J. and D. M. G. Newberry (1982), "Preemptive Patenting and the Persistence of Monopoly," American Eco- nomic Review, 72 (June), 514-26.
Glazer, A. (1985), "The Advantages of Being First," Amer- ican Economic Review, 75 (June), 473-80.
Golder, Peter N. and Gerard J. Tellis (1992), "Do Pioneers Really Have Long-Term Advantages: A Historical Analy- sis," Marketing Science Institute Working Paper. Boston: Marketing Science Institute.
Gottschalk, Louis R. (1969), Understanding History: A Primer of Historical Method. New York: Knopf.
Guasch, J. L. and A. Weiss (1980), "Adverse Selection of Markets and the Advantages of Being Late," Quarterly Journal of Economics, 94 (May), 453-66.
Karakaya, Fahri and Michael J. Stahl (1989), "Barriers to En- try and Market Entry Decisions in Consumer and Industrial Goods Markets," Journal of Marketing, 53 (April), 80-91.
Lambkin, Mary (1988), "Order of Entry and Performance in New Markets," Strategic Management Journal, 9 (Sum- mer), 127-40.
- and George S. Day (1989), "Evolutionary Processes in Competitive Markets: Beyond the Product Life Cycle," Journal of Marketing, 53 (July), 4-20.
This content downloaded from 152.3.153.225 on Wed, 20 May 2015 16:52:23 UTCAll use subject to JSTOR Terms and Conditions

170 JOURNAL OF MARKETING RESEARCH, MAY 1993
Lane, W. J. (1980), "Product Differentiation in a Market With Endogenous Sequential Entry," Bell Journal of Economics, 11 (Spring), 237-60.
Lieberman, Marvin B. and David B. Montgomery (1988), "First-Mover Advantages," Strategic Management Journal, 9 (Summer), 41-58.
Lilien, Gary L. and Eunsang Yoon (1990), "The Timing of Competitive Market Entry: An Exploratory Study of New Industrial Products," Management Science, 36 (May), 568- 85.
Loken, Barbara and James Ward (1990), "Alternative Ap- proaches to Understanding the Determinants of Typicality," Journal of Consumer Research, 17 (September), 111-26.
Louis, J. C. and Harvey Yazijian (1980), The Cola Wars. New York: Everest House.
Moore, Michael J., William Boulding, and Ronald C. Good- stein (1991), "Pioneering and Market Share: Is Entry Time Endogenous and Does It Matter?" Journal of Marketing Re- search, 28 (February), 97-104.
Nevett, Terence (1991), "Historical Investigation and the Practice of Marketing," Journal of Marketing, 55 (July), 13-23.
Parry, Mark and Frank M. Bass (1990), "When To Lead or Follow? It Depends," Marketing Letters, 1 (November), 187- 98.
Prescott, E. and M. Visscher (1977), "Sequential Location Among Firms With Foresight," Bell Journal of Economics, 8 (Autumn), 378-93.
Ratneshwar, S. and Allan D. Shocker (1991), "Substitution in Use and the Role of Usage Context in Product Category Structures," Journal of Marketing Research, 28 (August), 281-95.
Robinson, William T. (1988), "Sources of Market Pioneer Advantages: The Case of Industrial Goods Industries," Journal of Marketing Research, 25 (February), 87-94.
- and Claes Fornell (1985), "Sources of Market Pioneer Advantage in Consumer Goods Industries," Journal of Mar- keting Research, 22 (August), 305-17.
Savitt, Ronald (1980), "Historical Research in Marketing," Journal of Marketing, 44 (Fall), 52-8.
Scherer, F. M. (1985), "Editorial: Post-Patent Barriers to En- try in the Pharmaceutical Industry," Journal of Health Eco- nomics, 4 (March), 83-7.
Schmalensee, Richard (1978), "Entry Deterrence in the Ready to Eat Breakfast Cereal Industry," Bell Journal of Econom- ics, 9 (Autumn), 305-27.
(1982), "Product Differentiation Advantages of Pi- oneering Brands," American Economic Review, 72 (June), 349-65.
Schnaars, Steven P. (1986), "When Entering Growth Markets, Are Pioneers Better Than Poachers?" Business Horizons, 29 (March-April), 27-36.
Shurkin, Joel N. (1984), Engines of the Mind: A History of the Computer. New York: Norton.
Spence, M. (1977), "Entry, Capacity, Investment, and Oli- gopolistic Pricing," Bell Journal of Economics, 8 (Autumn), 534-44.
(1981), "The Learning Curve and Competition," Bell Journal of Economics, 12 (Spring), 49-70.
Sujan, Mita and James R. Bettman (1989), "The Effects of Brand Positioning Strategies on Consumers' Brand and Cat- egory Perceptions: Some Insights From Schema Research," Journal of Marketing Research, 26 (November), 454-67.
Sullivan, Mary (1991), "Brand Extension and Order of En- try," Marketing Science Institute Working Paper, Report Number 91-105. Boston: Marketing Science Institute.
Urban, Glen L., Theresa Carter, Steven Gaskin, and Zofia Mucha (1986), "Market Share Rewards to Pioneering Brands: An Empirical Analysis and Strategic Implications," Man- agement Science, 32 (June), 645-59.
Van Honacker, Wilfried R. and Diana Day (1987), "Cross- Sectional Estimation in Marketing: Direct Versus Reverse Regression," Marketing Science, 6 (Summer), 254-67.
Whitten, Ira T. (1979), "Brand Performance in the Cigarette Industry and the Advantages of Early Entry." Washington, DC: U.S. Federal Trade Commission.
Yip, George S. (1982), Barriers to Entry. Lexington, MA: Lexington Books/D.C. Heath and Company.
Reprint No. JMR302102
This content downloaded from 152.3.153.225 on Wed, 20 May 2015 16:52:23 UTCAll use subject to JSTOR Terms and Conditions