
Pinpointing Genomic Regions Associated with Root System ...
38
Pinpointing Genomic Regions Associated with Root System Architecture in Rice Through an Integrative Meta-Analysis Approach Parisa Daryani University of Mohaghegh Ardabili Hadi Darzi Ramandi ABRII: Agricultural Biotechnology Research Institute of Iran Sara Dezhsetan University of Mohaghegh Ardabili Raheleh Mirdar Mansuri ABRII: Agricultural Biotechnology Research Institute of Iran Ghasem Hosseini Salekdeh Macquarie University Zahra-Sadat Shobbar ( [email protected] ) Agricultural Biotechnology Research Institute of Iran https://orcid.org/0000-0002-7011-5415 Research Article Keywords: Root system architecture, Drought responsive genes, QTL meta-analysis, Oryza sativa, Genome-wide association studies. Posted Date: July 6th, 2021 DOI: https://doi.org/10.21203/rs.3.rs-342601/v1 License: This work is licensed under a Creative Commons Attribution 4.0 International License. Read Full License Version of Record: A version of this preprint was published at Theoretical and Applied Genetics on October 8th, 2021. See the published version at https://doi.org/10.1007/s00122-021-03953-5.
Transcript of Pinpointing Genomic Regions Associated with Root System ...

Pinpointing Genomic Regions Associated with RootSystem Architecture in Rice Through an IntegrativeMeta-Analysis ApproachParisa Daryani
University of Mohaghegh ArdabiliHadi Darzi Ramandi
ABRII: Agricultural Biotechnology Research Institute of IranSara Dezhsetan
University of Mohaghegh ArdabiliRaheleh Mirdar Mansuri
ABRII: Agricultural Biotechnology Research Institute of IranGhasem Hosseini Salekdeh
Macquarie UniversityZahra-Sadat Shobbar ( [email protected] )
Agricultural Biotechnology Research Institute of Iran https://orcid.org/0000-0002-7011-5415
Research Article
Keywords: Root system architecture, Drought responsive genes, QTL meta-analysis, Oryza sativa,Genome-wide association studies.
Posted Date: July 6th, 2021
DOI: https://doi.org/10.21203/rs.3.rs-342601/v1
License: This work is licensed under a Creative Commons Attribution 4.0 International License. Read Full License
Version of Record: A version of this preprint was published at Theoretical and Applied Genetics onOctober 8th, 2021. See the published version at https://doi.org/10.1007/s00122-021-03953-5.

1
Pinpointing genomic regions associated with root system architecture in rice through an
integrative meta-analysis approach
Parisa Daryani1,2, Hadi Darzi Ramandi3, Sara Dezhsetan1*, Raheleh Mirdar Mansuri2, Ghasem Hosseini Salekdeh2,
Zahra-Sadat Shobbar2*
1- Department of Agronomy & Plant Breeding, University of Mohaghegh Ardabili, Ardabil, Iran.
2- Department of Systems Biology, Agricultural Biotechnology Research Institute of Iran (ABRII), Agricultural
Research Education and Extension Organization (AREEO), PO Box 31535-1897, Karaj, Iran.
3- Department of Molecular Physiology, Agricultural Biotechnology Research Institute of Iran, Agricultural Research
Education and Extension Organization (AREEO), Karaj, Iran.
*Corresponding authors:
Zahra-Sadat Shobbar: Email: [email protected]; Phone: +989123441775
Sara Dezhsetan: Email: [email protected]; Phone: +989143064277.
Key message: Applying an integrated meta-analysis approach lead to identification of meta-QTLs/ candidate genes
associated with rice root system architecture, which can be used in MQTL-assisted breeding/ genetic engineering of root
traits.
Abstract
Root system architecture (RSA) is an important factor for facilitating water and nutrient uptake from deep soils and
adaptation to drought stress conditions. In the present research, an integrated meta-analysis approach was employed to
find candidate genes and genomic regions involved in rice RSA traits. A whole-genome meta-analysis was performed for
425 initial QTLs reported in 34 independent experiments controlling RSA traits under control and drought stress
conditions in the previous twenty years. Sixty-four consensus meta-QTLs (MQTLs) were detected, unevenly distributed
on twelve rice chromosomes. The confidence interval (CI) of the identified MQTLs was obtained as 0.11-14.23 cM with
an average of 3.79 cM, which was 3.88 times narrower than the mean CI of the original QTLs. Interestingly, 52 MQTLs
were co-located with SNP peak positions reported in rice genome-wide association studies (GWAS) for root
morphological traits. The genes located in these RSA related MQTLs were detected, and explored to find the drought-

2
responsive genes in the rice root based on the RNA-seq and microarray data. Multiple RSA and drought tolerance
associated genes were found in the MQTLs including the genes involved in auxin biosynthesis or signaling (e.g. YUCCA,
WOX, AUX/IAA, ARF), root angle (DRO1-related genes), lateral root development (e.g. DSR, WRKY), root diameter (e.g.
OsNAC5), plant cell wall (e.g. EXPA) and lignification (e.g. C4H, PAL, PRX and CAD). The genes located both in the
SNP peak positions and in the high-overview-index MQTLs for root architecture traits are suggested as novel candidate
genes for further functional analysis.. The promising candidate genes and MQTLs would be applicable to genetic
engineering and MQTL-assisted breeding of root phenotypes aimed at improving yield potential, stability and
performance in a water-stressed environment.
Keywords: Root system architecture, Drought responsive genes, QTL meta-analysis, Oryza sativa, Genome-wide
association studies.
Introduction
Rice (Oryza sativa L.) is one of the most important staple crops of the world, which is consumed by more than
one-third of the world’s population. Among the abiotic factors, drought is one of the most damaging factors affecting rice
growth and productivity and it is estimated that by the year 2050, more than 50% of the world’s arable land will be
affected by drought (Singhal et al. 2016). Therefore, improving rice for drought-prone upland environments is a priority.
Dynamic responses of root system architecture (RSA) play a key role in efficiently using water and nutrients in
crops (De Smet et al. 2012; Paez-Garcia et al. 2015), and also in drought avoidance mechanism and drought tolerance
performance (Blum 2005). Improving the architecture and function of roots will be the key for the second green revolution
in the future (Gewin 2010). However, breeding for root morphological traits has rarely been addressed, mostly because
of the costs and time constraints as well as lack of reliable and efficient phenotyping techniques for root related traits
(Carvalho et al. 2014; Toyofuku et al. 2015). The RSA indicates the organization of the primary roots, lateral roots, and
as well as other accessory roots including the crown, and seminal roots in the soil environment (De Smet et al. 2012). The
genetic factors and interact with environmental conditions mainly affect the RSA adaptation (Malamy 2005). Genotypic
background determines the intrinsic morphological characters, whereas environmental factors modify the root
morphologies on the basis of requirements for dynamically adapting to undesirable environmental conditions (Gruber et
al. 2013; Soriano and Alvaro 2019). Mapping of quantitative trait loci (QTL) has been used as a powerful statistical
method to identify genomic regions associated with traits of interest for breeding (Wang et al. 2019b). To date, many
QTLs related to RSA traits were identified by linkage analysis from different population types and sizes across diverse

3
moisture conditions (Courtois et al. 2003; de Dorlodot et al. 2007; Uga et al. 2011; Uga et al. 2013). In many QTL
mapping studies, the overlap of QTLs for root and agronomic traits has been revealed, suggesting the profound
implications that breeding for RSA will have on improving crop genotypes through enhancing crop productivity and high
water/nutrients use efficiency under water-limited conditions (Jia et al. 2019; Ju et al. 2018; Maccaferri et al. 2016;
Tuberosa et al. 2002). The growth angle and length of roots mainly determine the root system distribution of rice
throughout the soil profile (Araki et al. 2002).
Various positions of a QTL in different mapping populations lead to large confidence interval and uncertain
position of the QTL. This can be further exacerbated by several additional factors such as different sizes of mapping
populations and sampling errors (Darvasi and Soller 1997; Darvasi et al. 1993), differences in experimental replicates,
marker density and QTL mapping models. Various approaches have been used so far to confirm the QTL results such as
QTL mapping using first-generation populations, and getting validated in advanced generation breeding populations of
the same cross (Gelli et al. 2017). In other cases, QTL confirmation is performed using the candidate gene approach or
positional cloning, followed by integrating functional and genetic data within a breeding process (de Dorlodot et al. 2007).
This challenging process, however, requires high-density linkage maps, extensive genomic resources and logical
informatics data (de Dorlodot et al. 2007).
To identify consensus QTL regions across multiple studies, QTL meta-analysis method was initially developed by
(Goffinet and Gerber 2000) using maximum likelihood estimation and was then improved by (Veyrieras et al. 2007).
Meta-analysis clearly estimates the numbers, positions and CI of meta-QTL regions in each chromosome. This method
has been used to identify consensus regions of the genome across multiple QTL studies for their effect and consistency
across different genetic backgrounds and environments, also to refine and confirm QTL positions on a consensus map via
mathematical models. The QTL meta-analysis have been performed on root morphological traits in different species,
including maize (Guo et al. 2018), bread wheat (Darzi-Ramandi et al. 2017; Soriano and Alvaro 2019; Bilgrami et al.
2020), durum wheat (Iannucci et al. 2017) and oilseed rape (Zhang et al. 2018).
In the current study, we integrated 425 QTLs from the 34 published QTL mapping studies for root traits in rice,
and identified consensus genomic regions through QTL meta-analysis method into a novel integrated consensus genetic
map with 5447 loci. Thus far, only one QTL meta-analysis on rice root morphological traits have been reported based on
the QTLs collected from 24 studies from 1995 to 2007, mostly using AFLP and RFLP markers, and detecting MQTLs
with 1.98 Mb average CI with a reduction of 61% in the number of QTLs (Courtois et al. 2009). However, out of 34 QTL
mapping studies used in the current research, 27 studies including 268 QTLs were reported after 2007, using mostly SSR

4
and some SNP markers, which had not been included in the QTL meta-analysis so far. Moreover, the supporting intervals
of the identified MQTLs reduced to an average of 1.57 Mb corresponded to with a reduction of 85% in the number of
initial QTLs and then validated by the related GWAS studies. The genes located in the MQTLs were detected and
functionally classified. As well, the differentially expressed genes (DEGs) in the rice root under drought conditions were
detected through the analysis of RNA-seq and microarray datasets, and the MQTL regions associated with RSA were
explored to find the drought-responsive genes in the rice root. The objectives of this meta-analysis included integrating
QTLs, GWAS and transcriptome data obtained in different studies to refine QTL positions and identify "QTL-hotspot"
genomic region which can be used in MQTL-assisted breeding, and finding the promising candidate genes for functional
analyses and genetic engineering / molecular breeding to improve RSA related traits in rice.
Materials and methods
Collecting RSA trait-associated QTLs from independent studies
A comprehensive review of literature was conducted by searching the articles published from 2001 to 2020 on rice
QTLs associated with RSA traits in normal conditions and drought stress (Table 1(. The data collected for each QTL
region included 1) root architecture traits, 2) parents of the population, 3) types of mapping population: F2, backcross
(BC), double haploids (DH), recombinant inbred lines (RILs) and near-isogenic lines (NILs), 4) population size (N), 5)
logarithm of odds ratio (LOD score), 6) proportion of phenotypic variance explained by the QTL (R²), 7) the flanking or
single marker(s) for interval mapping and single-marker analysis (SMA), respectively. The present study assumed an
LOD score of 3 in a few cases in which the published article reported a p-value statistic or stated that a minimum LOD
score of 3 was adopted as the threshold for QTL analyses. Equation (1) proposed by (Nagelkerke 1991) was used to
estimate the LOD score (where N represents the population size), which is the explanatory power of QTLs if the LOD
score was not reported.
22 1 10
LOD
NR
öæ ÷ç- ÷ç ÷÷çè ø= - (1)
Ten traits associated with root architecture analyzed in the present study under normal and drought stress
conditions included deep root ratio, root number (RN), root length (RL), root thickness (RT), root volume (RV), root to
shoot ratio (RSR), root fresh weight (RFW), root dry weight (RDW), deep root ratio (DRR), root growth rate (RGR) and
root surface area (RSA) were analyzed. The analysis encompassed the QTLs whose map positions, LOD scores and R2
values were available. All the QTL studies related to RSA conducted on these traits using markers including AFLP, SSR,

5
SNP and RFLP were applied in the QTL meta-analysis, but the articles lacking proper genetic maps or QTL-associated
data were excluded. The QTL mapping studies with any missing parameters were also discarded.
Developing the consensus map and projecting the QTLs
A novel integrated consensus genetic map was developed from four previous studies with high-density markers
by BioMercator V4.2 (https://urgi.versailles.inra.fr/Tools/BioMercator-V4) with default parameters. The selected maps
included (i) the map of the International Rice Microsatellite Initiative (IRMI) comprising 1684 SSR markers developed
by (McCouch et al. 2002) and available at https://archive.gramene.org (IRMI_2003), (ii) the high-density rice genetic
map comprising 3267 RFLP markers available at https://rgp.dna.affrc.go.jp (RGP_2001), (iii) the Cornel_SSR_2006 map
comprising 706 markers, including 455 SSRs, 133 RFLPs and 116 specific gene markers, available at
https://archive.gramene.org (Cornel_SSR_2001) and (iv) the CIAT_SSR_2006 map comprising 408 SSR markers
available at https://archive.gramene.org (CIAT_SSR_2006). All the markers from the aforementioned maps were used to
develop the consensus marker map. The meta-analysis was performed after eliminating the markers showing inversion
on the consensus map. The projection of the QTLs position was performed on the basis of a simple scaling method
between the interval of the QTL flanking markers on their original map and the interval of these markers on the consensus
map (Supplementary Table S1).
After estimating the new confidence interval of the initial QTL on their original genetic map using the Gaussian
distribution, the QTLs were projected on the consensus map. The 95% Cl for a QTL position was calculated according to
the type of population used in the equations (2)-(4), in which N represents the population size, R2 the percentage of the
phenotypic variance of the QTLs and CI the supporting or confidence interval for each initial QTL.
( )2
530CI
R N=
´ (2),
( )2
287CI
R N=
´ (3),
( )2
163CI
R N=
´ (4)
Equation (2) is presented by modeling to calculate the 95% CI of F2 and BC populations by (Darvasi and Soller
1997). Equation (3) was used for the population of DH lines (Visscher and Goddard 2004), and equation (4) for both RIL
and NIL populations (Guo et al. 2006).
Meta-analysis and QTL-overview index
After projecting the QTLs on the consensus map, meta-analysis was conducted according to the QTL clusters on
each chromosome using BioMercator V4.2 (Arcade et al. 2004) which contains algorithms from the MetaQTL software
(Sosnowski et al. 2012; Veyrieras et al. 2007). Two different approaches were used depending on the number of initial

6
QTLs in a chromosome, which was below 10 when the meta-analysis proposed by Gerber and Goffinet was employed.
Based on this method, the most likely assumption is estimated in BioMercator among five MQTL models (1, 2, 3, 4, or
N) with different AIC values. Moreover, the model with the minimum AIC was selected for QTL integration and
identification of consensus MQTL positions. The method proposed by Veyrieras et al. was employed in case the number
of QTLs in a chromosome equaled at least 10. According to this approach, two stages are taken in QTL meta-analyses.
In the first stage, the QTLs collected are clustered on individual chromosomes with default parameters. The number of
potential MQTLs is then estimated on the basis of the model choice criteria from AIC, the modified AIC (AICc and
AIC3), Bayesian information criterion (BIC), and Approximate Weight of Evidence (AWE). A model with the minimum
values of the selection criteria in at least 3 out of the 5 models was selected as the optimal MQTL model. In the next
stage, the 95% CIs and positions of each MQTL were obtained as per the optimal model selected in the first stage. The
QTLs were integrated in a way that the peak position of the initial QTLs lay in the MQTL confidence interval. The QTLs
whose probability of membership in an MQTL exceeded 60% were assigned to the same MQTL.
Moreover, the QTL-overview statistic proposed by Chardon et al. (2004) was calculated to measure the contribution of a
chromosome region to trait variations. The "pnorm" function in R software (R. Core Team. 2018) was used to obtain the
QTL-overview statistic through a step-by-step calculation of the uniform probability that a 0.5-cM long segment (x and
x + 0.5) included a QTL in a test as per equation (5).
( )( ) ( )
0.52
1,
, 0.5i
xnbQTL
ii xN p S d x
p x xnbE
+
=+ =
å ò (5)
, in which nbE represents the total number of experiments, Si2 the variance position of the individual QTLs on a
chromosome and nbQTL the number of QTLs. The value of the QTL-overview was obtained in a given chromosome
interval based on (i) the number of QTLs lying in the vicinity of the chromosome interval and (ii) the power and accuracy
in mapping for these QTLs (high R2 value or small CI). To observe genomic zones with a significant QTL peak, the mean
statistic [U(x)] and a threshold for high values [H(x)] were empirically calculated as 5 times the mean value (Chardon et
al. 2004). Equations (6)-(7) were respectively used to calculate U(x) and H(x).
( ) 0.5Total length of map
nbQTL nbEU x = ´ (6)
( ) 5 0.5Total length of map
nbQTL nbEH x = ´ ´ (7)
Identifying the genes located in the MQTL regions
7
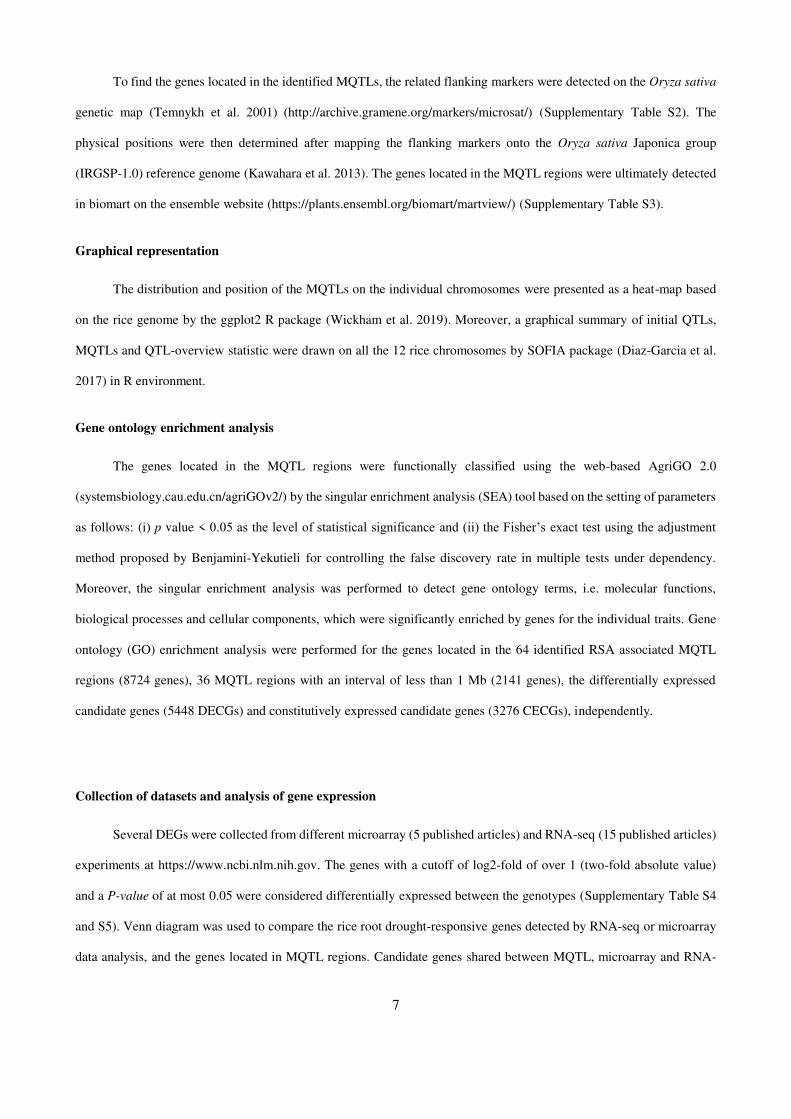
To find the genes located in the identified MQTLs, the related flanking markers were detected on the Oryza sativa
genetic map (Temnykh et al. 2001) (http://archive.gramene.org/markers/microsat/) (Supplementary Table S2). The
physical positions were then determined after mapping the flanking markers onto the Oryza sativa Japonica group
(IRGSP-1.0) reference genome (Kawahara et al. 2013). The genes located in the MQTL regions were ultimately detected
in biomart on the ensemble website (https://plants.ensembl.org/biomart/martview/) (Supplementary Table S3).
Graphical representation
The distribution and position of the MQTLs on the individual chromosomes were presented as a heat-map based
on the rice genome by the ggplot2 R package (Wickham et al. 2019). Moreover, a graphical summary of initial QTLs,
MQTLs and QTL-overview statistic were drawn on all the 12 rice chromosomes by SOFIA package (Diaz-Garcia et al.
2017) in R environment.
Gene ontology enrichment analysis
The genes located in the MQTL regions were functionally classified using the web-based AgriGO 2.0
(systemsbiology.cau.edu.cn/agriGOv2/) by the singular enrichment analysis (SEA) tool based on the setting of parameters
as follows: (i) p value < 0.05 as the level of statistical significance and (ii) the Fisher’s exact test using the adjustment
method proposed by Benjamini-Yekutieli for controlling the false discovery rate in multiple tests under dependency.
Moreover, the singular enrichment analysis was performed to detect gene ontology terms, i.e. molecular functions,
biological processes and cellular components, which were significantly enriched by genes for the individual traits. Gene
ontology (GO) enrichment analysis were performed for the genes located in the 64 identified RSA associated MQTL
regions (8724 genes), 36 MQTL regions with an interval of less than 1 Mb (2141 genes), the differentially expressed
candidate genes (5448 DECGs) and constitutively expressed candidate genes (3276 CECGs), independently.
Collection of datasets and analysis of gene expression
Several DEGs were collected from different microarray (5 published articles) and RNA-seq (15 published articles)
experiments at https://www.ncbi.nlm.nih.gov. The genes with a cutoff of log2-fold of over 1 (two-fold absolute value)
and a P-value of at most 0.05 were considered differentially expressed between the genotypes (Supplementary Table S4
and S5). Venn diagram was used to compare the rice root drought-responsive genes detected by RNA-seq or microarray
data analysis, and the genes located in MQTL regions. Candidate genes shared between MQTL, microarray and RNA-

8
seq data were analyzed in MapMan (Jung and An 2012). Four overviews, i.e. regulation, metabolism, proteasome and
transcription were used for describing any genes up-regulated in response to drought stress.
Collecting RSA related genome-wide association studies (GWAS) and comparing with MQTLs
GWAS studies for root morphological traits in rice were reviewed (Bettembourg et al. 2017; Biscarini et al. 2016;
Courtois et al. 2013; Kadam et al. 2017; Li et al. 2017; Mai et al. 2020; Pariasca-Tanaka et al. 2020; Phung et al. 2016;
Wang et al. 2018; Xu et al. 2020), and the reported SNP peak positions were collected to find the overlaps between their
positions with MQTLs. The genes located in the SNP peak positions (+/- 25 kb) were extracted from Oryza sativa
Japonica group (IRGSP-1.0) reference genome according to their physical positions.
Results
Genetic consensus map construction
A novel integrated consensus genetic map comprising 5447 markers was constructed in BioMercator V4.2 using
1923 SSRs, 3223 RFLPs, 25 ESTs, and 152 other genomic loci based on 5 previously-published genetic maps
(Supplementary Table S1). The total length of this consensus map was 1528.3 cM, with an average chromosome length
of 127.4 cM and a range of 83.0 cM (Chromosome 10) to 181.8 cM (Chromosome 1). The mean number of markers in
individual chromosomes was obtained as 454, with the lowest and highest numbers of markers being respectively
associated with chromosome 10 (n=256) and chromosome 1 (n=833). The marker density was obtained as 2.6 to 4.6
markers per cM on chromosomes 12 and 1, respectively, with an average of 3.6 per cM.
Distribution of initial QTLs associated with RSA traits in rice
The reports in literature and rice database (http://qtaro.abr.affrc.go.jp) were reviewed to collect QTLs data on the
RSA of rice in normal and drought conditions (Table 1). The studies covered 34 different experimental crosses involving
56 parental lines and 9461 progeny lines, while population size ranged from 75 (Anis et al. 2019) to 480 individual
genotypes (Catolos et al. 2017). The present QTL meta-analysis employed 425 out of the 568 initial QTLs associated
with RSA traits (Supplementary Table S6). One hundred and forty-three QTLs were not used in the meta-analysis because
either there was no common marker between individual genetic maps and the consensus genetic map, or some of QTLs
showed a large confidence interval. Among the 425 initial QTLs, 233 (54.82%) and 192 (49%) were found under normal
and water deficit conditions, respectively (Fig. 1a). The present study investigated different populations of QTL mapping
studies on root traits, which included F2 (2 populations), backcross (11 populations), recombinant inbred lines (17

9
populations), doubled haploid (5 populations) and near isogenic lines (8 populations) (Table 1). The number of markers
used in the previous reports of QTL mapping studies ranged from 215 (Courtois et al. 2003) to 584 (Catolos et al. 2017).
The distribution pattern of the initial QTLs on all the twelve rice chromosomes showed that the highest frequency of
initial QTLs was related to chromosomes 1 (n=60), 4 (n=59) and 7 (n=58) and the lowest to chromosomes 10 (n=5), 12
(n=6) and 5 (n=16) (Table 2 and Fig. 1b). The QTLs were unevenly distributed on rice chromosomes, with different
combinations of QTLs for different root traits. The average number of initial QTLs for each individual RSA traits was
39, ranging from 13 for the root-to-shoot ratio to 97 for the root length, followed by 65 (15.3%) initial QTLs for root
weight traits (i.e. root fresh weight and root dry weight) (Fig. 1b and Table 3). With an average value of 14.83 cM, the
95% confidence intervals (CI) varied between 1.18-58.40 cM, which approximately 42% of the collected initial QTLs
had a CI lower than 10 cM, and 75% had a CI lower than 20 cM (Fig. 2a). The proportion of phenotypic variance explained
(PVE) by the single QTLs ranged from 2.0 to 66.6% with an average of 13.4% (Fig. 2b). The proportion of phenotypic
variance explained by each of the 425 initial QTLs was used to rank them in terms of all the RSA traits (Fig. 2c). A total
of 271(59.3%) of the 425 QTLs showed a PVE of more than 10%, whereas 186 QTLs (40.7%) explained less than 10%
of the phenotypic variance. For the root length, among the 97 represented QTLs, 87 QTLs explained more than 10% of
the phenotypic variance (Fig. 2c).
Map projection and meta-analysis of QTLs controlling RSA traits
The collected initial QTLs were projected on the integrated consensus map with its high-density SSR and RFLP
markers. A total of 64 MQTLs were developed from the 425 initial QTLs for RSA traits with at least 2 MQTLs on each
of the twelve rice chromosomes. The number of MQTLs per chromosome ranged from 9 MQTL on chromosome 2, to 2
MQTL on chromosomes 10 and 12 (Fig. 2d, 3 and 4; Table 3). Integrated QTL data showed that all rice chromosomes
seemed to be involved in genetic control of root traits. The frequency of clustered initial QTLs per MQTL lay between 2
QTLs in 8 MQTLs (MQTL1-8, MQTL2-1, MQTL6-2, MQTL7-4, MQTL9-2, MQTL10-1, MQTL11-2 and MQTL12-1)
and 22 QTLs in MQTL3-1 on chromosome 3 (Table 3). Forty-four (67.8%) MQTLs were obtained by clustering QTLs
from at least 3 different experiments, which involved diverse types of mapping population. The stability of these MQTLs
was more likely to be preserved in a variety of environments. The mean of phenotypic variance explained (PVE) by each
MQTL ranged from 6.8 to 30.7% with an average of 13.6%, while the 95% CIs reported for the MQTLs ranged from 0.11
cM (0.16 Mb) for the intervals C847 - RM473A on chromosome 7 to 14.23 cM (7.98 Mb) for the intervals RM6179 -
RM4455 on chromosome 10 (Table 3).

10
The confidence interval was narrower in the individual MQTL regions than the mean CI of the original QTLs in
that position. At 17 MQTL regions, the CI was reduced to less than 2 cM, with a reduction in length by 12.6 times of the
mean CI initial QTLs. Moreover, the maximum decrease was observed in the CI of the initial QTLs on chromosome 7,
whereas the MQTL7-7 CI was by 136.9 times lower than the CI mean in the clustered QTLs and corresponded to a
confidence interval of merely 0.11 cM (0.16 Mb). A total of 14 MQTLs had physical length of around 500 kb and 10 of
which also had less than 2 cM genetic distance (Table 3). These ten MQTL regions also had a mean phenotypic variance
of 14.8%. The flanking markers of these ten MQTL regions were appropriate for molecular breeding and marker-assisted
selection in future genetic improvement programs of root morphological traits in rice. The physical intervals of 36 (56.2%)
MQTLs were below 1 Mb. The physical length of MQTL ranged from 0.08 Mb (MQTL3-5) to 7.98 Mb (MQTL10-1).
The number of RSA traits in each MQTL ranged from one (root length) in 1 MQTL (MQTL1-8) to eight in 4 MQTLs
(MQTL1-6, MQTL4-3, MQTL4-4 and MQTL7-7). The individual QTLs for the root length and root thickness were
present in 49 MQTLs out of the 64 detected MQTL regions, the most for any root morphological traits, while the
individual QTLs for the root surface area was only present in 11 MQTLs, the least among the RSA traits (Table 2).
Estimation of QTL-overview index for RSA QTLs in rice
After projecting the 425 QTLs onto the consensus genetic map, the density of the presence of QTLs described as
“QTL-overview index” was calculated for the considered interval of 0.5 cM on each chromosome to identify genomic
regions significantly-associated with RSA traits (Fig. 3 and Supplementary Fig. S1). Sixty-four out of 73 overview index
peaks obtained were higher than 0.0122 as the mean value of the statistic over the genome and showed real QTLs that
affect RSA traits in rice. According to Supplementary Fig. S1, fifteen out of the 64 peaks also exceeded 0.061 as the high-
value threshold. The number of significant peaks ranged from one in chromosome 1, 2 and 5 to three in chromosomes 4
and 9. In the latter case, all the 5 peaks exceeded the high-value threshold. The results revealed that the estimated CIs
identified through the QTL-overview analysis were similar to the meta-analysis method. The QTL-overview index is a
statistical approach that has been widely used for traits such as flowering time in maize (Chardon et al. 2004), response
of leaf growth to water deficit in maize (Welcker et al. 2007), yield and related traits in maize (Adrian-Martinez et al.
2016), fatty acid content in soybean (Qin et al. 2018) and root-related traits in bread wheat (Soriano and Alvaro 2019).
Detecting differentially expressed genes (DEGs) in the rice root under drought conditions
The drought-responsive genes in the rice root were collected from RNA-seq and microarray datasets
(Supplementary Table S5). Based on the RNA-seq data analysis, 10239 up-regulated and 7214 down-regulated rice root
DEGs were observed at drought compared to normal conditions. Microarray meta-analysis suggested 22307 DEGs,

11
among which, 16290 and 6017 were up- and down-regulated, respectively (Supplementary Table S7 and Fig. S2). Finally,
MQTL regions associated with RSA were explored to find the drought-responsive genes in the rice root. A total of 5448
and 1338 common genes were revealed using the venn diagram between the DEGs derived from RNA-seq and microarray
data and the genes located in MQTL regions (Supplementary Table S8 and Fig. S2) for all the 64 MQTLs (Supplementary
Fig. S2b) and the 36 MQTLs with CI of less than 1Mb (Supplementary Fig. S2a), respectively. These genes that are both
differentially expressed at drought conditions in rice roots and located in MQTL regions can be considered as
differentially expressed candidate genes (DECGs).
Gene ontology analysis of the genes located in the RSA associated MQTL regions
Enrichment analysis of the genes located in the 64 MQTLs, 36 MQTLs, DECGs and CECGs, independently,
revealed many shared and a few diverged enriched GO terms (Supplementary Table S9 and Fig. S3). It confirm the
significance of the results and provides evidence that genes with associated functions might be clustered and contributed
to the QTL traits. The common terms included gene expression, protein modification process, RNA metabolic process,
phosphotransferase activity, protein serine/threonine kinase activity, calcium ion binding transporter activity, nucleus,
membrane part and ribosome. However, as expected, some terms were enriched in the drought responsive candidate
genes, but not in the constitutively expressed candidate genes, such as ARF protein signal transduction, response to stress,
ion transport, response to oxidative stress, and plant-type cell wall organization. Under the gene expression term, many
RSA related genes were observed such as members from WRKY, NAC, ARF, WOX, AUX/IAA, RR, RAA, and HSFA2
families, which were also detected by MapMan as drought responsive TFs. Likewise, other significant GO terms such as
the protein modification processes were significant through both MapMan and GO analysis, and contained RSA related
genes (e.g. ACA8, SAPK 6,10,7 and CCR3).
Analyzing the drought responsive candidate genes in MapMan
The fold-change data and Locus IDs for 5448 and 1338 drought-responsive genes of the 64 and 36 MQTLs (with
an interval of less than 1 Mb), respectively, were uploaded to MapMan toolkit (Supplementary Table S10) and the various
overviews were obtained (Supplementary Fig. S4a to S4f). It is worth noting that mapman analysis results of the DEGs
located in the 64 and 36 MQTL regions were somehow similar. Investigating the regulation overview of the 5448 genes
showed the up-regulation of 417 transcription factors (TFs), 276 genes related to protein degradation and 192 genes
associated with protein modification in the rice root under drought stress (Supplementary Fig. S4b). The highest frequency
of TFs and their importance in the regulation of the root response and structure under drought stress, warrant further
investigations (Supplementary Fig. S4c).

12
The most significantly enriched genes in the signaling pathway, included those for G-protein and calcium
regulation. Thioredoxin as the reduction-oxidation response element dominated the cellular processes of drought-
responsive genes in rice. A G protein-mediating calcium-signaling cascade therefore functions upstream of drought-
responsive TFs in the hierarchy of signaling pathways to regulate the reduction-oxidation reaction through the thioredoxin
activity and trigger the drought tolerance. This evidence suggests the cooperative role of thioredoxin, G-proteins and
calcium regulation in responding to drought in the rice root. It is worth noting that mapman analysis results of the DEGs
located in the 64 and 36 MQTL regions were somehow similar (Supplementary Fig. S4a to S4f).
Validation of MQTLs with the related GWAS studies
Significant overlaps existed between the MQTLs detected using meta-analysis and the SNPs detected using the
GWAS method that are linked to RSA traits in rice genome. Interestingly, 52 MQTLs out of the 64 identified MQTLs,
were co-located with 171 SNP peak positions reported in rice GWAS for root morphological traits (Fig. 5 and Fig. 6). A
total of 755 rice genes were located in the SNP peak positions (+/- 25 kb) overlapping with MQTLs, among them 49
SNPs were occurred exactly within a gene (Supplementary Table S11).
Discussion
MQTLs for RSA traits and the perspective of their implications in MQTL-assisted breeding
The RSA plays a key role in absorbing nutrients and water by a plant, its anchoring to the soil and its yield (Subira
et al. 2016). Linkage analysis and linkage disequilibrium mapping indicate that root morphology in rice is a complex trait
that involves multiple loci with small effects. Meta-analysis is a powerful statistical technique that can be performed on
QTL data collected from different genetic backgrounds and environments to determine consistent QTLs, enhance the
accuracy of their chromosomal locations and integrate the QTL data collected from numerous independent experiments
(Goffinet and Gerber 2000). In the present QTL meta-analysis, we collected the data of 425 QTLs from 34 articles
published between 2001 and 2020 (Supplementary Table S6) to identify genomic regions linked to RSA and the drought
stress tolerance in rice. We could detect 64 MQTLs by performing a meta-analysis based on the modified Akaike
information criterion (AIC) (Table 3). The supporting intervals of the identified MQTLs with an average of 3.79 cM (1.57
Mb) reduced 3.88 times as compared to the mean of corresponding original QTLs. The only similar previous work
(Courtois et al. 2009) just covered 306 QTLs reported until 2007, detecting 119 MQTLs with 4.14 Mb average CI for the
initial QTLs and 1.98 Mb for MQTLs. In our study, 376 out of the 425 initial QTLs were SSR flanking markers, of which

13
268 QTLs were belonged to the reports after 2007. In other QTL meta-analyses on diverse quantitative traits in various
crops, including bread wheat, barley, maize and soybean, has been reported a reduction of 10%-21% in the total number
of initial QTLs compared to the number of MQTLs, and the average reduction in the CI of the MQTLs varied from two
to four times of the initial QTLs (Ballini et al. 2008; Courtois et al. 2009; Darzi-Ramandi et al. 2017; Hao et al. 2010;
Khahani et al. 2020; Lanaud et al. 2009; Rong et al. 2007; Soriano and Alvaro 2019). In the current research, the genetic
CI of 71.8% and physical CI of 75% MQTL’s were narrower than 5 cM and 2 Mb, respectively. The present study found
several MQTLs in recombination hot spot regions with a narrow CI such as MQTL7-7 (0.16 Mb, 0.11 cM), MQTL3-5
(0.08 Mb, 0.22 cM), MQTL6-6 (0.27 Mb, 0.47 cM), MQTL9-6 (0.27 Mb, 0.48 cM), MQTL5-3 (0.21 Mb, 0.71 cM) and
MQTL7-2 (0.51 Mb, 0.82 cM) to be useful for the fine-mapping studies of quantitative trait loci (Table 3). The present
findings suggested that analyzing MQTLs can help discover consensus genomic regions and accurately locate linked
QTLs for RSA traits in rice.
Although there is still a high diversity for the quantitative inheritance nature of RSA traits, rice breeders can take
advantage of the current genetic diversity to select the most appropriate MQTLs for improving the root characteristics
and drought tolerance in their elite breeding materials. According to Löffler et al. (2009), the MQTLs selected for breeding
purposes should have (i) a narrow CI, (ii) comprise a large number of initial QTLs, and (iii) a high proportion of its mean
phenotypic variance is explained by initial QTLs. Using some of the identified MQTLs for MQTL-assisted breeding to
improve the RSA traits to enhance drought tolerance appears promising. Interestingly, eleven of the identified MQTLs
contained at least 10 initial QTLs with a 95% CI of below 2 cM (Table 3). Among them, the MQTL1-7, MQTL3-5,
MQTL4-3, MQTL4-5, MQTL6-6, MQTL7-7, and MQTL9-6 span less than 500 kb and the original QTLs constitute six
to nine independent studies. These MQTLs could be used as multi-effect hotspot regions affecting RSA traits, which is
worth applying in breeding programs in the near future.
Potential candidate genes involved in RSA and drought tolerance
Multiple genes associated with root-related traits in rice were found to be located in MQTL intervals
(Supplementary Table S3) which were used to reconstruct the related molecular network, and will be discussed in the
following (Fig. 7 and Supplementary Table S4).
Plant hormone mediated root growth and development
We observed several genes involved in auxin biosynthesis or signaling located in the MQTL regions (Fig. 7 and
Supplementary Table S4). Auxins regulates many growth and development dimensions of root through elongating

14
primary roots and root hairs and raising the number of lateral root primordia (Overvoorde et al. 2010). Some members of
the rice YUCCA gene family involved in the biosynthesis of indole-3-acetic acid (IAA), including OsYUCCA1 located in
MQTL1-5, OsCOW1, OsYUCCA8 and OsNAL7 located in MQTL3-1, play a key role in the root growth (Fujino et al.
2008; Woo et al. 2007). It is reported that overexpression of a YUCCA gene, which encodes the rate limiting enzyme of
auxin biosynthesis, significantly increase the proliferation of crown roots depending on the presence of WOX TFs (Zhang
et al. 2018). The WOX6 transcription factor lay in MQTL3-3. The WOX transcription is activated by auxin, which then
initiates the crown root development in rice by establishing the YUC-Auxin-WOX module (Zhang et al. 2018). WOX
was also found to interact with ERF and bind to the OsRR2 (MQTL2-3) promoter as a response regulator of cytokinin
signaling to regulate crown root morphological traits, root number, root to shoot ratio and root volume (Zhao et al. 2015).
As a RING-H2 membrane-anchor E3 ubiquitin ligase, EL5 (MQTL2-5) preserves cell viability after initiating root
primordia through cytokinin-mediated signaling (Koiwai et al. 2007).
A rice zinc finger protein (OsZFP) in MQTL1-2 interacts with a cyclophilin (LRT2/OsCYP2) and influences root
development through the IAA pathway (Cui et al. 2017). LRT2 (LATERAL ROOTLESS2), the cyclophilin protein
(OsCYP2) located in MQTL2.1 regulates auxin signaling and lateral root initiation in rice (Zheng et al. 2013).
LRT2/OsCYP2 was found to contribute to degrading AUX/IAA proteins (Kang et al. 2013). Several OsAUX/IAA15 and
OsAUX/IAA22 members found in MQTL5-1 and MQTL6-3 regions, which act as the negative regulators of ARFs
(Mockaitis and Estelle 2008). Based on our GO analysis results, regulation of ARF GTPase activity and ARF protein
signal transduction were enriched in the biological processes. The activity of ARF GTPase activator was also enriched
among the molecular functions. Two major protein families that regulate auxin signaling include ARF proteins as the
DNA-binding transcriptional regulators of auxin responses and, Aux/IAA proteins as the negative regulators of ARF
(Mockaitis and Estelle 2008). The rice lateral root formation requires Auxin/IAA protein and ARF-mediated signaling
(Yamauchi et al. 2019). OsARF1 was found to lie in MQTL5-2, OsARF7 in MQTL2-5 and OsARF16 in MQTL6-2. It is
reported that OsARF7 and OsARF16 regulate RSA through AUX/LAX in auxin signaling (Lee et al. 2019; Mockaitis and
Estelle 2008; Yamauchi et al. 2019). As functional auxin influx carriers, the AUX/LAX family of proteins mediate auxin-
related developmental programs. Responses to abiotic stress, root gravitropism and root hair development are controlled
by AUX1. Lateral root development is affected by LAX3 and AUX1 (Swarup and Bhosale 2019; Swarup and Péret 2012).
OsAUX3 is expressed in root hairs, primary and lateral roots. OsAUX3 mutations were found to decrease the length of
primary roots and lateral root density and increase the length of root hairs (Wang et al. 2019a). OsAUX3/LAX2 was located
in MQTL3-2. Adventitious root formation in Arabidopsis to be affected by LBD18 and LBD16 functioning downstream

15
of ARF19 and ARF7 (Lee et al. 2019). We found LBD38 gene in the MQTL3-4 region that is class II type LBD proteins,
acting as a transcriptional activator (Pan et al. 2017).
Oryza sativa root architecture associated 1 (OsRAA1) located in MQTL1-2, play a role in the auxin-mediated
development of root in rice (Ge et al. 2004). Transition from metaphase to anaphase during cell division is inhibited by
OsRAA1, and its degradation by the ubiquitin-proteasome system is essential for initiating anaphase in mitosis during root
development (Xu et al. 2010). OsMADS57, a MADS-box transcription factor, was found in MQTL2-8. The inhibition of
seminal root elongation in osmads57 mutants can be explained by elevated auxin and polar auxin transport to the root tips
of the mutant plants (Huang et al. 2019). MAIF1, a rice F-box domain gene located in MQTL2-5, was found to contribute
to several signaling pathways in the regulation of the root growth. Auxin, abscisic acid, cytokinin and abiotic stress can
induce the expression of MAIF1. The root growth in rice can be stimulated through the over-expression of MAIF1 (Yan
et al. 2011).
OsEIL1, located in the MQTL3-3 interval, activates the OsYUCCA8 transcription and therefore auxin biosynthesis,
regulating ethylene-inhibited root elongation in rice seedlings (Qin et al. 2017). ACC (1-aminocyclopropane-1-carboxylic
acid) oxidase gene of OsACO1 (MQTL9-4) was enhanced in transgenic plants overexpressing OsEIL1 (Mao et al. 2006).
Ethylene signaling is regulated in rice through activating OsEIL1 by RAVL1 (MQTL4-4), as an upstream component of
brassinosteroid biosynthesis and signaling (Zhu et al. 2018). Mediating the degradation of OsEIL1 through the
ubiquitination pathway by OsEBF1 (MQTL6-4) as an E3 ligase suggested the negative regulation of the ET signaling
pathway in response to the infestation of BPH (Ma et al. 2020).
Abscisic acid (ABA) plays a key role in raising the length of root hairs in plants. It can accumulate auxin along
the root hair by promoting the biosynthesis and polar transport of auxin in the root tip (Qin et al. 2017). Expression of
some ABA biosynthesis genes could regulate early signaling genes, e.g. OsPP2C68 (MQTL9-2), SAPK6 (MQTL2-5) and
late responsive gene OsLEA3 (MQTL6-3) during droughts (Xiong et al. 2014). SAPK6 is effective in root elongation
during drought conditions (Xiong et al. 2014), and longer root hairs were reported in transgenic rice overexpressing
SAPK10 (MQTL3-4) (Qin et al. 2017). Jasmonate (JA) signaling components such as OsJAZ1 (MQTL4-6) was also
found, of which OsJAZ1 is reported to play a negative role in regulating drought tolerance through ABA and JA pathways
(Fu et al. 2017). The degradation of jasmonate ZIM-domain (JAZ) proteins releases TFs known to interact with JAZ
proteins, which can generate responses to growth and stress (Tian et al. 2019). OsJAZ1 was found to be associated with
the root weight, and potentially regulate rice root development at different developmental steps (Pan et al. 2017). OsCKI1,

16
a rice casein kinase I detected in MQTL2-6, was found to contribute to different hormone-signaling pathways and regulate
development of rice lateral roots (Liu et al. 2003).
Root growth angle
Deeper rooting 1 (DRO1) (MQTL9-4), regulated through ARF by auxin, appears to contribute in elongating root
tip cells causing the asymmetric growth of root and its downward bending in response to gravity. Induction of the DRO1
expression rises the angle of root growth, increasing the downward growth of the root (Uga et al. 2013). Controlling RSA
by DRO1 raises the rice yield during drought stress (Uga et al. 2013). Moreover, DRO1 was found to be expressed in the
root tip in the vicinity of the root apical meristem as well as in basal shoots in the crown root primordia (Uga et al. 2013).
Interestingly, we further found some other candidate genes which might regulate branching and angle in lateral roots; for
example, OsLAZY1 (MQTL6-1), OsSOL1 (suppressor of lazy1) (MQTL6-1) and OsTAC3 (MQTL3-5). DRO1-related
genes, including TAC1 and LAZY1, belong to the IGT gene family, contain a C-terminal EAR-like motif IVLEI and are
observed in different plant phyla (Ashraf et al. 2019). The gravitropism of the root and shoots is affected by LAZY1 and
its orthologues in rice, maize, Medicago and Arabidopsis (Ashraf et al. 2019). HSFA2D located in MQTL3.1 functions
as a positive regulator of the LAZY1-dependent asymmetric distribution of auxin in the upstream. Auxin causes the
asymmetrical expression of WOX6 (MQTL3.3) to connect gravitropism to controlling the tiller angle in rice (Zhang et al.
2018). PROG1 (PROSTRATE GROWTH1) (MQTL7.1), and LPA1 (LOOSE PLANT ARCHITECTURE1) (MQTL3.2)
were reported as the main genetic regulators of the tiller angle in rice (Li et al. 2007).
Lateral root development
The enhancement of lateral root formation causes a potentially-useful adaptation to drought in lowland rice under
drought stress (Hazman and Brown 2018). A panel of lateral root development-related potential candidate genes was
located in MQTL regions (Fig. 7 and Supplementary Table S4). O. sativa drought stress response-1 (OsDSR-1), a
calmodulin-like gene, was found in MQTL10-1. Binding of its protein to Ca2+ leads to conformational changes, and
increases drought tolerance by scavenging the reactive oxygen species in rice (Yin et al. 2017). The expression of OsDSR-
1 in Arabidopsis was found to enhance developing lateral root in high K+ concentrations and improve sensitivity to ABA
(Yin et al. 2011). OsWRKY31 found in MQTL6-3 can act in the auxin signal transduction pathway, and its ectopic
expression reduced the length and formation of lateral roots (Zhang et al. 2008). OsWRKY76 lying in MQTL9-3 was
found to regulate cellular responses to abiotic and biotic types of stress (Yokotani et al. 2013) partly by regulating the
expression of RSOsPR10 in the lateral roots of rice, improving the mass and growth of root and increasing tolerance to
high salt environments and soil desiccation (Yamamoto et al. 2018).

17
Root diameter
As a transcriptional activator and stress-responsive protein lying in MQTL11-2, OsNAC5 improves stress tolerance
through the up-regulation of stress-inducible genes of rice, e.g. DjC10 (MQTL1-4) and OsLEA3 (MQTL6-3). The
overexpression of OsNAC5 increases the root diameter in rice and improves grain yield and drought tolerance (Jeong et
al. 2013). The root specific overexpression of OsNAC10 (MQTL7-6) significantly improves the rice yield, especially
during drought stress (Redillas et al. 2012). OsNAC10 was found to induce 34 root specific target genes such as those
encoding cytochrome P450, mitogen-activated protein kinase kinases (MAPKK), LEA and TFs such as WRKYs and
NACs (Jeong et al. 2010). As a key factor in preserving calcium homoeostasis, calcium‐transporting ATPase serves as an
early response to drought, salinity stress and low temperature in plant cells (Knight 1999). A member of this family ACA8
(Ca2+ P-Type ATPase 8) (Knight 1999) was located in MQTL10-2. ACA8 was upregulated in OsNAC5 overexpressed
plants (Jeong et al. 2013).
Cell wall organization
Plant-type cell wall organization were significantly enriched based on the GO analysis of DECGs. Several genes
of expansins were found in MQTL positions including OsEXPA8, EXPA9 (MQTL1-2), ExpA10 (MQTL4-4), ExpA4
(MQTL5-2), EXPA14, EXPA13, EXPA22 (MQTL2-3) and EXPA6 (MQTL3-3) (Fig. 7 and Supplementary Table S4).
With key roles in the cell growth of plants and cell elongation of root tips, expansins serve as a family of closely-related
nonenzymatic proteins in the cell wall of plants (Shin et al. 2005). The cell wall relaxation required for the cell expansion
can be achieved through the actions of expansin genes (EXPs) and endoglucanases (GLUs)(Hayashi et al. 1984;
McQueen-Mason et al. 1992; Okamoto and Okamoto 1995). Some members of the endoglucanases such as OsGLU1
(MQTL3-3), OsGLU14 (MQTL2-1) and OsGLU30 (MQTL9-5) were found in MQTL regions. OsGLU1 mutation lead
to a decrease in the cellulose content and cell elongation (Zhou et al. 2006). OsARD4 lying in MQTL10-2 encodes an
acireductone dioxygenase, which improves RSA in rice (Ramanathan et al. 2018). The OsARD4 overexpression
contributed to the root growth by increasing the rates of radical emergence, elongation of primary roots and initiation of
lateral/crown roots and raising the root biomass compared to that of nontransgenic plants (Ramanathan et al. 2018). Plant
root lignification play an effective role in tolerance to abiotic stresses such as drought (Seo et al. 2020). As an important
enzyme of the lignin biosynthetic pathway, Cinnamoyl-CoA reductase (CCR) controls the quality and quantity of lignin
(Jones et al. 2001). The other important enzymes in the lignin biosynthesis include C4H, PAL, PRX and CAD (Lee et al.
2016). whose members including CAD3 (MQTL10-2), CAD1 (MQTL10-1), CCR3 (MQTL5-1), CCR19 (MQTL9-3),

18
PAL1 (MQTL2-6), PAL, PAL8 (MQTL2-6), PAL5, PAL3 (MQTL2-6), PAL1, PAL6, PAL06, ZB8, pal/zb8 (MQTL2-6)
and Prx15 (MQTL1-3) were found in MQTL regions.
Multi-level data integration to discover novel candidate genesA large number of studies have shown that QTL
mapping and genome-wide association study (GWAS) are two complementary methods for mapping causal genes and
dissecting the genetic basis of the traits of interest (Mahuku et al. 2016; Tao et al. 2013). Meta-analysis is an effective
approach to integrate QTLs from several independent experiments and GWAS as a robust method for detection of
significant effects of genomic loci, each have their own merits and demerits which can complement each other (Sonah et
al., 2015). A major challenge of QTL analysis is the reduction of the CI to discover the most relevant genomic regions,
and the integration of GWAS results with meta-analysis of QTLs could help to do so very effectively. In our study,
significant overlaps existed between the MQTLs detected using meta-analysis and the SNPs detected using the GWAS
method linked to RSA traits in rice genome. Out of the 64 identified MQTLs, 52 MQTLs were overlapped with 171 SNP
peak positions reported for root morphological traits (Fig. 5 and Fig. 6). Among them, all MQTLs on chromosomes 1, 2,
8, 10 and 12 were in co-linear region with GWAS signals. This integrative approach lead to the detection of 49 rice genes
located in both the MQTL regions and SNP peak positions reported in rice GWAS for root morphological traits including
genes encoding EXPA6, MADS59 and RR3. In addition, looking at a range of +/- 25 kb around SNP peak positions, 755
genes were found comprising many novel genes and some genes with known RSA related functions such as DRO1,
WRKY62, CKI1, ARF8, SAUR30 and HOX11 (Supplementary Table S11).
To find the chromosome regions with the most contribution to a desired phenotype, the QTL-overview index is
calculated based on the number of original QTLs, accuracy in mapping for these QTLs and the high phenotypic variance
(Chardon et al. 2004). In the current research, the genes located both exactly in the SNP peak positions and in the high-
value threshold MQTLs for root architecture traits were considered as novel candidate genes (Table 4). These 10 novel
genes are interesting candidates for functional analysis, while the transcript level of rNBS41, GELP58, EME1 and bZIP64
were also drought-responsive in the rice roots.
Conclusion
Root system architecture play critical roles in plant growth and productivity as well as plant tolerance to abiotic
stresses such as drought. Therefore, improving RSA through molecular breeding or genetic engineering is a promising
strategy to develop the yield and stress tolerance in rice. In the present research, a genome-wide meta-analysis of RSA in
rice lead to identification of 64 MQTLs. Interestingly, seven of these MQTLs has physical length of around 500 kb and

19
genetic distance of less than 2 cM, contained at least 10 initial QTLs while the original QTLs were derived from six to
nine independent studies, and cover a mean phenotypic variance of 14.8%. Two of them (MQTL1-7 and MQTL6-6) were
further confirmed with SNP peak positions reported in rice GWAS for root morphological traits. Conclusively, these
MQTL regions can be appropriate for MQTL-assisted breeding in future genetic improvement programs of RSA related
traits in rice. On the other hand, the DEGs in the rice root under drought conditions were detected through the analysis of
RNA-seq and microarray datasets, and the MQTL regions associated with RSA were explored to find the drought-
responsive genes in the rice root. Gene ontology enrichment analysis of the genes located in these MQTLs provides
evidence that the genes with RSA associated functions are clustered and contributed to the QTL traits. Multiple genes
with function associated with RSA and drought tolerance were found in the MQTLs comprising some genes from YUCCA,
WOX, RR, LRT2/CYP2, AUX/IAA, ARF, RAA, MAIF1, EIL, PP2C, SAPK, DRO, DSR, WRKY, RSOsPR, NAC, C4H, PAL,
PRX and CAD, EXPA, GLU and ARD families. The genes located both in the SNP peak positions and in the high-
overview-index MQTLs for root architecture traits are suggested as interesting candidate genes for further functional
analysis. Conclusively, we integrated meta-analysis of QTLs associated with RSA traits in normal and drought stress
conditions, GWAS studies results for root morphological traits, and the transcriptome analysis data of the root under
drought conditions leading to find 100 candidate genes (Supplementary Fig. S5), which might play an important role in
rice RSA under drought stress. After functional analysis, the promising candidate genes would be applicable for root
genetic engineering aimed at improving yield potential, stability and performance in drought conditions.
Funding
This study was financially supported by Agricultural Biotechnology Research Institute of Iran (ABRII) (grant No: 013-
15-1505-114-97027-971295) and Biotechnology Development Council of the Islamic Republic of Iran (grant No:
970801).
Conflicts of interest/Competing interests
The authors declare that they have no conflicts of interests /competing interests.
Ethics approval
Not applicable.
Consent to participate
Not applicable.

20
Consent for publication
Not applicable.
Availability of data and materials
All data supporting the conclusions of this article are provided within the article and it’s supplementary.
Author Contributions
PD and HDR performed the meta-analysis, drafted the manuscript and drawing graphs. PD and RMM analyzed the
microarray data. The project was conceived, coordinated and supervised by Z-SS, who also revised the manuscript. The
final manuscript was checked by SD and GHS. The final version of the manuscript was reviewed and approved by all the
authors.
Acknowledgments
The authors would like to express their gratitude to the authorities of Agricultural Biotechnology Research Institute of
Iran (ABRII) and Biotechnology Development Council of the Islamic Republic of Iran (grant No: 970801) for their
supports, and Mr. Mohammad Jedari to help in creating the artworks.
Table and Figure captions
Table 1 A summary of the studies on QTL mapping used in the MQTL analysis of RSA traits in rice
Table 2 Summary of root system architectural traits data and distribution of initial QTLs on the 12 rice chromosomes
used in MQTL analysis
Table 3 Results of meta-analysis of the QTLs controlling RSA traits in rice
Table 4 The novel candidate genes located both in the SNP peak positions and in the high-overview-index MQTLs for root architecture traits
Fig. 1 Distribution of QTLs for root architecture traits on all the rice chromosomes; (a) The number of initial QTLs
distributed on the individual rice chromosomes under normal and water shortage conditions, (b) The number of initial
QTLs for root traits on each rice chromosome used in meta-analysis of QTL
Fig. 2 Summary of 425 initial QTLs related to RSA traits used in the QTL meta-analysis. (a) The frequency distribution
of initial QTLs density based on different levels of the 95% confidence interval, (b) The phenotypic variance explained

21
(PVE), (c) The number of initial QTLs with different phenotypic variance explained (R2 < 10 and R2 ≥ 10) for each
root morphology trait, (d) The distribution of initial QTLs and MQTLs on the twelve chromosomes in rice. DRR: deep
root length ratio, RDR: ratio of deep rooting, RDW: root dry weight, RFW: root fresh weight, RGR: root growth rate,
RL: root length, RN: root number, RSA: root surface area, RSR: root to shoot ratio, RT: root thickness, RV: root volume
Fig. 3 Concentric circles show different features drawn in SOFIA package (Diaz-Garcia et al. 2017) in the R environment.
The twelve rice chromosomes portrayed along the perimeter of every circle; (a) Colored bars showing the twelve rice
chromosomes and chromosomal positions (cM) presented along the chromosomes. (b) Flanking markers of each MQTL
on the consensus genetic map. (c) Distribution of the initial QTLs on the twelve chromosomes of rice (blue lines) and
position of MQTLs with the 95% confidence intervals (red). (d) QTL-overview index (probability density) for the root
traits QTLs on consensus genetic map. (e) Proportion of phenotypic variance explained (R2) for each initial QTLs. (f)
Density of initial QTL for each MQTL
Fig. 4 Circos diagram for initial QTLs and MQTLs associated with root traits on the physical map of the rice japonica
variety Nipponbare. The twelve rice chromosomes are portrayed along the perimeter of each circle. (a) Colored bars
showing the twelve rice chromosomes and physical positions (100 Kb) are presented along the chromosomes. (b) Flanking
markers of each MQTL on the rice physical map. (c) Distribution of initial QTLs on twelve chromosomes of rice (black
lines) and position of MQTLs with confidence intervals (red areas). (d) Coefficient of reduction in physical CI from mean
original QTLs to MQTL. (e) Number of genes involved in each MQTL interval
Fig. 5 Genomic collinearity of the MQTLs with the significant loci in the recent GWAS results for RSA traits. The
MQTLs are shown on the right side of each chromosome, with black segments indicating their physical intervals. The
genomic positions of the MQTL regions correspond to Table 3. The significant SNPs identified by GWAS for RSA traits
are displayed on the left side of each chromosome, along with the related traits and the genomic position of the significant
loci with base pairs (bp) positions (Supplementary Table S11)
Fig. 6 Genetic loci controlling phenotypic variations of RSA traits in rice. The rectangles filled with red colour were
MQTLs identified on the 12 chromosomes of rice, with rectangle width to be confidence interval of MQTLs supported
through meta-analysis method. The mean of phenotypic variance explained (PVE) by each MQTL was ruled on the left
side of plot. Points with different colours represented significant SNPs identified by previous GWAS studies in different
root traits. RA: root angle, RDW: root dry weight, RL: root length, RN: root number, RSR: root to shoot ratio, RT: root
thickness, RV: root volume

22
Fig. 7 The molecular network associated with rice root development using potential candidate genes located in MQTLs.
An arrow shows a positive regulatory action and lines with a flat head in their end show negative regulatory actions. Text
color code: biological processes: purple, hormones: blue, genes/proteins located in MQTLs: black, genes/proteins located
in both MQTLs and SNP peak positions reported in rice GWAS for root morphological traits: dark blue, Ca+2: red, root
traits: pink, root parts: green
Supplementary Tables and Figures
Supplementary Table S1. Integrated high-density consensus genetic map comprising 5447 markers
Supplementary Table S2. Physical map (Temnykh et al., 2001)
Supplementary Table S3. Genes located in the identified MQTLs regions
Supplementary Table S4. Drought responsive genes located in the identified MQTL regions
Supplementary Table S5. A summary of RNA-seq and microarray studies utilized to identify rice root drought-
responsive genes
Supplementary Table S6. QTL data collected to perform MQTL analysis in this study
Supplementary Table S7. The differentially expressed genes at drought conditions in rice roots based on RNA-seq and
microarray data (Supplementary table S5) analysis. Fold change (FC) is reported along the gene ID
Supplementary Table S8. The common genes between the DEGs (derived from RNA-seq and microarray data) and the
genes located in MQTL regions and their expression levels.
Supplementary Table S9. The gene ontology enrichment analysis of the genes located in the 64 MQTL and 36 MQTL
regions.
Supplementary Table S10. MapMan analysis of the candidate genes (the genes that are both differentially expressed at
drought conditions in rice roots and located in MQTL regions)
Supplementary Table S11. MQTLs overlapping with the significant SNPs in reported rice GWAS studies.
Supplementary Figure S1. Illustration of QTL-overview index for root architecture traits on the rice consensus genetic
map. The QTL dataset was collected from 34 independent studies including 425 QTLs and 26 experiments. The two
dashed lines with value of 0.01077 and 0.05386 indicate the average index and high-value threshold, respectively. Upper
labels indicate the position of nineteen "real QTLs" regions

23
Supplementary Figure S2. Venn diagram revealed the common genes between the DEGs (derived from RNA-seq and
microarray data) and the genes located in MQTL regions (a) 36 MQTLs with CI of below 1Mb (b) regions for all the 64
MQTLs
Supplementary Figure S3. Gene ontology (GO) analysis of the genes located in RSA related MQTL regions: The bar
chart of GO term enrichment analysis of the genes located in the 64 MQTLs (a-c) and 36 MQTLs (with an interval of less
than 1Mb) (d-f), which were grouped into the three major GO categories included biological process (a, d), molecular
function (b, e), and cellular component (c, f). Cumulative chart showing GO classification for the differentially expressed
candidate genes (DECGs) and constitutively expressed candidate genes (CECGs) (g, h, i). Venn diagram revealing
common enriched terms among the genes located in the 64 MQTLs, DECGs and CECGs (j)
Supplementary Figure S4. MapMan analysis of the drought-responsive candidate genes located in the 64 (a-c) and 36
(d-f) RSA related MQTLs. Overview (a, d), Regulation (b, e), Transcription (c, f), blue: up-regulated genes and red:
down-regulated genes. Detailed information is presented in the supplementary table S10.
Supplementary Figure S5. Venn diagram of the genes located in the identified MQTLs associated with RSA (M-QTL),
genes located in SNP peak positions reported in the GWAS studies for root morphological traits (GWAS), and the
differentially expressed genes (DEGs) derived from RNA-seq (RNA-seq) and microarray data (Microarray). Based on
this comparison, 100 drought responsive genes in rice root were found in both the MQTL regions and SNP positions
associated with RSA.
References
Adrian-Martinez S, Ageron M, Aharonian F, Aiello S, Albert A, Ameli F, Anassontzis E, Andre M, Androulakis G, Anghinolfi M (2016) Letter of intent for KM3NeT 2.0. Journal of Physics G: Nuclear and Particle Physics 43:084001
Anis GB, Zhang Y, Islam A, Zhang Y, Cao Y, Wu W, Cao L, Cheng S (2019) RDWN6 XB, a major quantitative trait locus positively enhances root system architecture under nitrogen deficiency in rice. BMC plant biology 19:12
Araki H, Morita S, Tatsumi J, Iijima M (2002) Physiol-morphological analysis on axile root growth in upland rice. Plant production science 5:286-293
Arcade A, Labourdette A, Falque M, Mangin B, Chardon F, Charcosset A, Joets J (2004) BioMercator: integrating genetic maps and QTL towards discovery of candidate genes. Bioinformatics 20:2324-2326
Ashraf A, Rehman OU, Muzammil S, Leon J, Naz AA, Rasool F, Ali GM, Zafar Y, Khan MR (2019) Evolution of Deeper Rooting 1-like homoeologs in wheat entails the C-terminus mutations as well as gain and loss of auxin response elements. PloS one 14
Ballini E, Morel J-B, Droc G, Price A, Courtois B, Notteghem J-L, Tharreau D (2008) A genome-wide meta-analysis of rice blast resistance genes and quantitative trait loci provides new insights into partial and complete resistance. Molecular Plant-Microbe Interactions 21:859-868

24
Bettembourg M, Dardou A, Audebert A, Thomas E, Frouin J, Guiderdoni E, Ahmadi N, Perin C, Dievart A, Courtois B (2017) Genome-wide association mapping for root cone angle in rice. Rice 10:1-17
Bilgrami SS, Ramandi HD, Shariati V, Razavi K, Tavakol E, Fakheri BA, Mahdi Nezhad N, Ghaderian M (2020) Detection of genomic regions associated with tiller number in Iranian bread wheat under different water regimes using genome-wide association study. Scientific reports 10: 1-17.
Biscarini F, Cozzi P, Casella L, Riccardi P, Vattari A, Orasen G, Perrini R, Tacconi G, Tondelli A, Biselli C (2016) Genome-wide association study for traits related to plant and grain morphology, and root architecture in temperate rice accessions. PloS one 11:e0155425
Blum A (2005) Drought resistance, water-use efficiency, and yield potential—are they compatible, dissonant, or mutually exclusive? Australian Journal of Agricultural Research 56:1159-1168
Carvalho P, Azam‐Ali S, Foulkes MJ (2014) Quantifying relationships between rooting traits and water uptake under drought in Mediterranean barley and durum wheat. Journal of integrative plant biology 56:455-469
Catolos M, Sandhu N, Dixit S, Shamsudin NA, Naredo ME, McNally KL, Henry A, Diaz MG, Kumar A (2017) Genetic loci governing grain yield and root development under variable rice cultivation conditions. Frontiers in plant science 8:1763
Chardon F, Virlon B, Moreau L, Falque M, Joets J, Decousset L, Murigneux A, Charcosset A (2004) Genetic architecture of flowering time in maize as inferred from quantitative trait loci meta-analysis and synteny conservation with the rice genome. Genetics 168:2169-2185
Courtois B, Ahmadi N, Khowaja F, Price AH, Rami J-F, Frouin J, Hamelin C, Ruiz M (2009) Rice root genetic architecture: meta-analysis from a drought QTL database. Rice 2:115-128
Courtois B, Audebert A, Dardou A, Roques S, Ghneim-Herrera T, Droc G, Frouin J, Rouan L, Gozé E, Kilian A (2013) Genome-wide association mapping of root traits in a japonica rice panel. PloS one 8:e78037
Courtois B, Shen L, Petalcorin W, Carandang S, Mauleon R, Li Z (2003) Locating QTLs controlling constitutive root traits in the rice population IAC 165× Co39. Euphytica 134:335-345
Cui P, Liu H, Ruan S, Ali B, Gill RA, Ma H, Zheng Z, Zhou W (2017) A zinc finger protein, interacted with cyclophilin, affects root development via IAA pathway in rice. Journal of integrative plant biology 59:496-505
Darvasi A, Soller M (1997) A simple method to calculate resolving power and confidence interval of QTL map location. Behavior genetics 27:125-132
Darvasi A, Weinreb A, Minke V, Weller J, Soller M (1993) Detecting marker-QTL linkage and estimating QTL gene effect and map location using a saturated genetic map. Genetics 134:943-951
Darzi-Ramandi H, Shariati J V, Tavakol E, Najafi-Zarini H, Bilgrami SS, Razavi K (2017) Detection of consensus genomic regions associated with root architecture of bread wheat on groups 2 and 3 chromosomes using QTL meta-analysis. Australian Journal of Crop Science 11:777
de Dorlodot S, Forster B, Pagès L, Price A, Tuberosa R, Draye X (2007) Root system architecture: opportunities and constraints for genetic improvement of crops. Trends in plant science 12:474-481
De Smet I, White PJ, Bengough AG, Dupuy L, Parizot B, Casimiro I, Heidstra R, Laskowski M, Lepetit M, Hochholdinger F (2012) Analyzing lateral root development: how to move forward. The Plant Cell 24:15-20
Diaz-Garcia L, Covarrubias-Pazaran G, Schlautman B, Zalapa J (2017) SOFIA: an R package for enhancing genetic visualization with Circos. Journal of Heredity 108:443-448

25
Fu J, Wu H, Ma S, Xiang D, Liu R, Xiong L (2017) OsJAZ1 attenuates drought resistance by regulating JA and ABA signaling in rice. Frontiers in plant science 8:2108
Fujino K, Matsuda Y, Ozawa K, Nishimura T, Koshiba T, Fraaije MW, Sekiguchi H (2008) NARROW LEAF 7 controls leaf shape mediated by auxin in rice. Molecular Genetics and Genomics 279:499-507
Ge L, Chen H, Jiang J-F, Zhao Y, Xu M-L, Xu Y-Y, Tan K-h, Xu Z-H, Chong K (2004) Overexpression of OsRAA1 causes pleiotropic phenotypes in transgenic rice plants, including altered leaf, flower, and root development and root response to gravity. Plant Physiology 135:1502-1513
Gelli M, Konda AR, Liu K, Zhang C, Clemente TE, Holding DR, Dweikat IM (2017) Validation of QTL mapping and transcriptome profiling for identification of candidate genes associated with nitrogen stress tolerance in sorghum. BMC plant biology 17:1-18
Gewin V (2010) An underground revolution: plant breeders are turning their attention to roots to increase yields without causing environmental damage. Virginia Gewin unearths some promising subterranean strategies. Nature 466:552-554
Goffinet B, Gerber S (2000) Quantitative trait loci: a meta-analysis. Genetics 155:463-473
Gruber BD, Giehl RF, Friedel S, von Wirén N (2013) Plasticity of the Arabidopsis root system under nutrient deficiencies. Plant physiology 163:161-179
Guo B, Sleper D, Lu P, Shannon J, Nguyen H, Arelli P (2006) QTLs associated with resistance to soybean cyst nematode in soybean: meta-analysis of QTL locations. Crop Science 46:595-602
Guo J, Chen L, Li Y, Shi Y, Song Y, Zhang D, Li Y, Wang T, Yang D, Li C (2018) Meta-QTL analysis and identification of candidate genes related to root traits in maize. Euphytica 214:223
Hao Z, Li X, Liu X, Xie C, Li M, Zhang D, Zhang S (2010) Meta-analysis of constitutive and adaptive QTL for drought tolerance in maize. Euphytica 174:165-177
Hayashi T, Wong Y-S, Maclachlan G (1984) Pea xyloglucan and cellulose: II. Hydrolysis by pea endo-1, 4-β-glucanases. Plant physiology 75:605-610
Hazman M, Brown KM (2018) Progressive drought alters architectural and anatomical traits of rice roots. Rice 11:62
Huang S, Liang Z, Chen S, Sun H, Fan X, Wang C, Xu G, Zhang Y (2019) A transcription factor, OsMADS57, regulates long-distance nitrate transport and root elongation. Plant Physiology 180:882-895
Iannucci A, Marone D, Russo MA, De Vita P, Miullo V, Ferragonio P, Blanco A, Gadaleta A, Mastrangelo AM (2017) Mapping QTL for root and shoot morphological traits in a durum wheat× T. dicoccum segregating population at seedling stage. International Journal of Genomics 2017
Jeong JS, Kim YS, Baek KH, Jung H, Ha S-H, Do Choi Y, Kim M, Reuzeau C, Kim J-K (2010) Root-specific expression of OsNAC10 improves drought tolerance and grain yield in rice under field drought conditions. Plant physiology 153:185-197
Jeong JS, Kim YS, Redillas MC, Jang G, Jung H, Bang SW, Choi YD, Ha SH, Reuzeau C, Kim JK (2013) OsNAC5 overexpression enlarges root diameter in rice plants leading to enhanced drought tolerance and increased grain yield in the field. Plant Biotechnology Journal 11:101-114
Jia Z, Liu Y, Gruber BD, Neumann K, Kilian B, Graner A, Von Wirén N (2019) Genetic dissection of root system architectural traits in spring barley. Frontiers in Plant Science 10:400
Jones L, Ennos AR, Turner SR (2001) Cloning and characterization of irregular xylem4 (irx4): a severely lignin‐deficient mutant of Arabidopsis. The Plant Journal 26:205-216

26
Ju C, Zhang W, Liu Y, Gao Y, Wang X, Yan J, Yang X, Li J (2018) Genetic analysis of seedling root traits reveals the association of root trait with other agronomic traits in maize. BMC plant biology 18:171
Jung K-H, An G (2012) Application of MapMan and RiceNet drives systematic analyses of the early heat stress transcriptome in rice seedlings. Journal of Plant Biology 55:436-449
Kadam NN, Tamilselvan A, Lawas LM, Quinones C, Bahuguna RN, Thomson MJ, Dingkuhn M, Muthurajan R, Struik PC, Yin X (2017) Genetic control of plasticity in root morphology and anatomy of rice in response to water deficit. Plant physiology 174:2302-2315
Kang B, Zhang Z, Wang L, Zheng L, Mao W, Li M, Wu Y, Wu P, Mo X (2013) Os CYP 2, a chaperone involved in degradation of auxin‐responsive proteins, plays crucial roles in rice lateral root initiation. The Plant Journal 74:86-97
Kawahara Y, de la Bastide M, Hamilton JP, Kanamori H, McCombie WR, Ouyang S, Schwartz DC, Tanaka T, Wu J, Zhou S (2013) Improvement of the Oryza sativa Nipponbare reference genome using next generation sequence and optical map data. Rice 6:1-10
Khahani B, Tavakol E, Shariati V, Fornara F (2020) Genome wide screening and comparative genome analysis for Meta-QTLs, ortho-MQTLs and candidate genes controlling yield and yield-related traits in rice. BMC genomics 21:1-24
Knight H (1999) Calcium signaling during abiotic stress in plants. International review of cytology 195:269-324
Koiwai H, Tagiri A, Katoh S, Katoh E, Ichikawa H, Minami E, Nishizawa Y (2007) RING‐H2 type ubiquitin ligase EL5 is involved in root development through the maintenance of cell viability in rice. The Plant Journal 51:92-104
Lanaud C, Fouet O, Clément D, Boccara M, Risterucci A-M, Surujdeo-Maharaj S, Legavre T, Argout X (2009) A meta–QTL analysis of disease resistance traits of Theobroma cacao L. Molecular Breeding 24:361-374
Lee D-K, Jung H, Jang G, Jeong JS, Kim YS, Ha S-H, Do Choi Y, Kim J-K (2016) Overexpression of the OsERF71 transcription factor alters rice root structure and drought resistance. Plant physiology 172:575-588
Lee HW, Cho C, Pandey SK, Park Y, Kim M-J, Kim J (2019) LBD16 and LBD18 acting downstream of ARF7 and ARF19 are involved in adventitious root formation in Arabidopsis. BMC plant biology 19:46
Li P, Wang Y, Qian Q, Fu Z, Wang M, Zeng D, Li B, Wang X, Li J (2007) LAZY1 controls rice shoot gravitropism through regulating polar auxin transport. Cell research 17:402-410
Li X, Guo Z, Lv Y, Cen X, Ding X, Wu H, Li X, Huang J, Xiong L (2017) Genetic control of the root system in rice under normal and drought stress conditions by genome-wide association study. PLoS Genetics 13:e1006889
Liu W, Xu ZH, Luo D, Xue HW (2003) Roles of OsCKI1, a rice casein kinase I, in root development and plant hormone sensitivity. The Plant Journal 36:189-202
Ma F, Yang X, Shi Z, Miao X (2020) Novel crosstalk between ethylene‐and jasmonic acid‐pathway responses to a piercing–sucking insect in rice. New Phytologist 225:474-487
Maccaferri M, El-Feki W, Nazemi G, Salvi S, Canè MA, Colalongo MC, Stefanelli S, Tuberosa R (2016) Prioritizing quantitative trait loci for root system architecture in tetraploid wheat. Journal of experimental botany 67:1161-1178
Mahuku G, Chen J, Shrestha R, Narro LA, Guerrero KVO, Arcos AL, Xu Y (2016) Combined linkage and association mapping identifies a major QTL (qRtsc8-1), conferring tar spot complex resistance in maize. Theoretical and applied genetics 129:1217-1229
Mai NT, Mai CD, Van Nguyen H, Le KQ, Duong LV, To HTM (2020) Discovery of new genetic determinants controlling the morphological plasticity in rice root and shoot under phosphate starvation using GWAS. bioRxiv

27
Malamy J (2005) Intrinsic and environmental response pathways that regulate root system architecture. Plant, cell & environment 28:67-77
Mao C, Wang S, Jia Q, Wu P (2006) OsEIL1, a rice homolog of the Arabidopsis EIN3 regulates the ethylene response as a positive component. Plant molecular biology 61:141
McCouch SR, Teytelman L, Xu Y, Lobos KB, Clare K, Walton M, Fu B, Maghirang R, Li Z, Xing Y (2002) Development and mapping of 2240 new SSR markers for rice (Oryza sativa L.). DNA research 9:199-207
McQueen-Mason S, Durachko DM, Cosgrove DJ (1992) Two endogenous proteins that induce cell wall extension in plants. The Plant Cell 4:1425-1433
Mockaitis K, Estelle M (2008) Auxin receptors and plant development: a new signaling paradigm. Annual review of cell and developmental biology 24
Nagelkerke NJ (1991) A note on a general definition of the coefficient of determination. Biometrika 78:691-692
Okamoto A, Okamoto H (1995) Two proteins regulate the cell wall extensibility and the yield threshold in glycerinated hollow cylinders of cowpea hypocotyl. Plant, Cell & Environment 18:827-830
Overvoorde P, Fukaki H, Beeckman T (2010) Auxin control of root development. Cold Spring Harbor perspectives in biology 2:a001537
Paez-Garcia A, Motes CM, Scheible W-R, Chen R, Blancaflor EB, Monteros MJ (2015) Root traits and phenotyping strategies for plant improvement. Plants 4:334-355
Pan Y, Hu X, Li C, Xu X, Su C, Li J, Song H, Zhang X, Pan Y (2017) SlbZIP38, a tomato bZIP family gene downregulated by abscisic acid, is a negative regulator of drought and salt stress tolerance. Genes 8:402
Pariasca-Tanaka J, Baertschi C, Wissuwa M (2020) Identification of loci through genome-wide association studies to improve tolerance to Sulfur deficiency in rice. Frontiers in plant science 10:1668
Phung NTP, Mai CD, Hoang GT, Truong HTM, Lavarenne J, Gonin M, Le Nguyen K, Ha TT, Do VN, Gantet P (2016) Genome-wide association mapping for root traits in a panel of rice accessions from Vietnam. BMC plant biology 16:1-19
Qin H, Liu Z, Wang Y, Xu M, Mao X, Qi H, Yin Z, Li Y, Jiang H, Hu Z (2018) Meta‐analysis and overview analysis of quantitative trait locis associated with fatty acid content in soybean for candidate gene mining. Plant breeding 137:181-193
Qin H, Zhang Z, Wang J, Chen X, Wei P, Huang R (2017) The activation of OsEIL1 on YUC8M transcription and auxin biosynthesis is required for ethylene-inhibited root elongation in rice early seedling development. PLoS genetics 13:e1006955
Ramanathan V, Rahman H, Subramanian S, Nallathambi J, Kaliyaperumal A, Manickam S, Ranganathan C, Muthurajan R (2018) OsARD4 encoding an acireductone dioxygenase improves root architecture in rice by promoting development of secondary roots. Scientific reports 8:1-15
Redillas MC, Jeong JS, Kim YS, Jung H, Bang SW, Choi YD, Ha SH, Reuzeau C, Kim JK (2012) The overexpression of OsNAC9 alters the root architecture of rice plants enhancing drought resistance and grain yield under field conditions. Plant Biotechnology Journal 10:792-805
Rong J, Feltus FA, Waghmare VN, Pierce GJ, Chee PW, Draye X, Saranga Y, Wright RJ, Wilkins TA, May OL (2007) Meta-analysis of polyploid cotton QTL shows unequal contributions of subgenomes to a complex network of genes and gene clusters implicated in lint fiber development. Genetics 176:2577-2588

28
Seo DH, Seomun S, Choi YD, Jang G (2020) Root Development and Stress Tolerance in rice: The Key to Improving Stress Tolerance without Yield Penalties. International Journal of Molecular Sciences 21:1807
Shin J-H, Jeong D-H, Park MC, An G (2005) Characterization and Transcriptional Expression of the α-Expansin Gene Family in Rice. Molecules & Cells (Springer Science & Business Media BV) 20
Singhal P, Jan AT, Azam M, Haq QMR (2016) Plant abiotic stress: a prospective strategy of exploiting promoters as alternative to overcome the escalating burden. Frontiers in Life Science 9:52-63
Sonah H, O’Donoughue L, Cober E, Rajcan I, Belzile F (2015) Identification of loci governing eight agronomic traits using a GBS-GWAS approach and validation by QTL mapping in soybean. Plant Biotechnol Journal 3:211–221
Soriano JM, Alvaro F (2019) Discovering consensus genomic regions in wheat for root-related traits by QTL meta-analysis. Scientific reports 9:1-14
Sosnowski O, Charcosset A, Joets J (2012) BioMercator V3: an upgrade of genetic map compilation and quantitative trait loci meta-analysis algorithms. Bioinformatics 28:2082-2083
Subira J, Ammar K, Álvaro F, Del Moral LFG, Dreisigacker S, Royo C (2016) Changes in durum wheat root and aerial biomass caused by the introduction of the Rht-B1b dwarfing allele and their effects on yield formation. Plant and Soil 403:291-304
Swarup R, Bhosale R (2019) Developmental roles of AUX1/LAX auxin influx carriers in plants. Frontiers in plant science 10:1306
Swarup R, Péret B (2012) AUX/LAX family of auxin influx carriers-an overview. Frontiers in plant science 3:225
Tao Y, Jiang L, Liu Q, Zhang Y, Zhang R, Ingvardsen CR, Frei UK, Wang B, Lai J, Lübberstedt T (2013) Combined linkage and association mapping reveals candidates for Scmv1, a major locus involved in resistance to sugarcane mosaic virus (SCMV) in maize. BMC plant biology 13:1-13
Temnykh S, DeClerck G, Lukashova A, Lipovich L, Cartinhour S, McCouch S (2001) Computational and experimental analysis of microsatellites in rice (Oryza sativa L.): frequency, length variation, transposon associations, and genetic marker potential. Genome research 11:1441-1452
Tian J, Cao L, Chen X, Chen M, Zhang P, Cao L, Persson S, Zhang D, Yuan Z (2019) The OsJAZ1 degron modulates jasmonate signaling sensitivity during rice development. Development 146:dev173419
Toyofuku K, Matsunami M, Ogawa A (2015) Genotypic variation in osmotic stress tolerance among rice cultivars and its association with L-type lateral root development. Plant production science 18:246-253
Tuberosa R, Sanguineti MC, Landi P, Giuliani MM, Salvi S, Conti S (2002) Identification of QTLs for root characteristics in maize grown in hydroponics and analysis of their overlap with QTLs for grain yield in the field at two water regimes. Plant molecular biology 48:697-712
Uga Y, Okuno K, Yano M (2011) Dro1, a major QTL involved in deep rooting of rice under upland field conditions. Journal of experimental botany 62:2485-2494
Uga Y, Sugimoto K, Ogawa S, Rane J, Ishitani M, Hara N, Kitomi Y, Inukai Y, Ono K, Kanno N (2013) Control of root system architecture by DEEPER ROOTING 1 increases rice yield under drought conditions. Nature genetics 45:1097
Veyrieras J-B, Goffinet B, Charcosset A (2007) MetaQTL: a package of new computational methods for the meta-analysis of QTL mapping experiments. BMC bioinformatics 8:49
Visscher PM, Goddard ME (2004) Prediction of the confidence interval of quantitative trait loci location. Behavior genetics 34:477-482

29
Wang F, Longkumer T, Catausan SC, Calumpang CLF, Tarun JA, Cattin‐Ortola J, Ishizaki T, Pariasca Tanaka J, Rose T, Wissuwa M (2018) Genome‐wide association and gene validation studies for early root vigour to improve direct seeding of rice. Plant, cell & environment 41:2731-2743
Wang M, Qiao J, Yu C, Chen H, Sun C, Huang L, Li C, Geisler M, Qian Q, Jiang DA (2019a) The auxin influx carrier, OsAUX3, regulates rice root development and responses to aluminium stress. Plant, cell & environment 42:1125-1138
Wang X, Liu H, Pang M, Fu B, Yu X, He S, Tong J (2019b) Construction of a high-density genetic linkage map and mapping of quantitative trait loci for growth-related traits in silver carp (Hypophthalmichthys molitrix). Scientific reports 9:1-12
Welcker C, Boussuge B, Bencivenni C, Ribaut J, Tardieu F (2007) Are source and sink strengths genetically linked in maize plants subjected to water deficit? A QTL study of the responses of leaf growth and of anthesis-silking interval to water deficit. Journal of Experimental Botany 58:339-349
Wickham H, Averick M, Bryan J, Chang W, McGowan LDA, François R, Grolemund G, Hayes A, Henry L, Hester J (2019) Welcome to the Tidyverse. Journal of Open Source Software 4:1686
Woo Y-M, Park H-J, Su’udi M, Yang J-I, Park J-J, Back K, Park Y-M, An G (2007) Constitutively wilted 1, a member of the rice YUCCA gene family, is required for maintaining water homeostasis and an appropriate root to shoot ratio. Plant molecular biology 65:125-136
Xiong H, Li J, Liu P, Duan J, Zhao Y, Guo X, Li Y, Zhang H, Ali J, Li Z (2014) Overexpression of OsMYB48-1, a novel MYB-related transcription factor, enhances drought and salinity tolerance in rice. PLoS One 9
Xu X, Ye J, Yang Y, Zhang M, Xu Q, Feng Y, Yuan X, Yu H, Wang Y, Yang Y (2020) Genome-wide association study of rice rooting ability at the seedling stage. Rice 13:1-15
Xu Y, Cao H, Chong K (2010) APC-targeted RAA1 degradation mediates the cell cycle and root development in plants. Plant signaling & behavior 5:218-223
Yamamoto T, Yoshida Y, Nakajima K, Tominaga M, Gyohda A, Suzuki H, Okamoto T, Nishimura T, Yokotani N, Minami E (2018) Expression of RSOsPR10 in rice roots is antagonistically regulated by jasmonate/ethylene and salicylic acid via the activator OsERF87 and the repressor OsWRKY76, respectively. Plant direct 2:e00049
Yamauchi T, Tanaka A, Inahashi H, Nishizawa NK, Tsutsumi N, Inukai Y, Nakazono M (2019) Fine control of aerenchyma and lateral root development through AUX/IAA-and ARF-dependent auxin signaling. Proceedings of the National Academy of Sciences 116:20770-20775
Yan Y-S, Chen X-Y, Yang K, Sun Z-X, Fu Y-P, Zhang Y-M, Fang R-X (2011) Overexpression of an F-box protein gene reduces abiotic stress tolerance and promotes root growth in rice. Molecular plant 4:190-197
Yin X, Huang L, Wang M, Cui Y, Xia X (2017) OsDSR-1, a calmodulin-like gene, improves drought tolerance through scavenging of reactive oxygen species in rice (Oryza sativa L.). Molecular Breeding 37:75
Yin XM, Rocha PS, Wang ML, Zhu YX, Li LY, Song SF, Xia X (2011) Rice gene OsDSR-1 promotes lateral root development in Arabidopsis under high-potassium conditions. Journal of Plant Biology 54:180-189
Yokotani N, Sato Y, Tanabe S, Chujo T, Shimizu T, Okada K, Yamane H, Shimono M, Sugano S, Takatsuji H (2013) WRKY76 is a rice transcriptional repressor playing opposite roles in blast disease resistance and cold stress tolerance. Journal of experimental botany 64:5085-5097
Zhang J, Peng Y, Guo Z (2008) Constitutive expression of pathogen-inducible OsWRKY31 enhances disease resistance and affects root growth and auxin response in transgenic rice plants. Cell Research 18:508-521

30
Zhang N, Yu H, Yu H, Cai Y, Huang L, Xu C, Xiong G, Meng X, Wang J, Chen H (2018) A core regulatory pathway controlling rice tiller angle mediated by the LAZY1-dependent asymmetric distribution of auxin. The Plant Cell 30:1461-1475
Zhao Y, Cheng S, Song Y, Huang Y, Zhou S, Liu X, Zhou D-X (2015) The interaction between rice ERF3 and WOX11 promotes crown root development by regulating gene expression involved in cytokinin signaling. The Plant Cell 27:2469-2483
Zheng H, Li S, Ren B, Zhang J, Ichii M, Taketa S, Tao Y, Zuo J, Wang H (2013) LATERAL ROOTLESS2, a cyclophilin protein, regulates lateral root initiation and auxin signaling pathway in rice. Molecular plant 6:1719-1721
Zhou H-L, He S-J, Cao Y-R, Chen T, Du B-X, Chu C-C, Zhang J-S, Chen S-Y (2006) OsGLU1, a putative membrane-bound endo-1, 4-ß-d-glucanase from rice, affects plant internode elongation. Plant molecular biology 60:137-151
Zhu XF, De Peng Yuan CZ, Li TY, Xuan YH (2018) RAVL1, an upstream component of brassinosteroid signalling and biosynthesis, regulates ethylene signalling via activation of EIL1 in rice. Plant biotechnology journal 16:1399

Figures
Figure 1
Distribution of QTLs for root architecture traits on all the rice chromosomes; (a) The number of initialQTLs distributed on the individual rice chromosomes under normal and water shortage conditions, (b)The number of initial QTLs for root traits on each rice chromosome used in meta-analysis of QTL

Figure 2
Summary of 425 initial QTLs related to RSA traits used in the QTL meta-analysis. (a) The frequencydistribution of initial QTLs density based on different levels of the 95% con�dence interval, (b) Thephenotypic variance explained (PVE), (c) The number of initial QTLs with different phenotypic varianceexplained (R2 < 10 and R2 ≥ 10) for each root morphology trait, (d) The distribution of initial QTLs andMQTLs on the twelve chromosomes in rice. DRR: deep root length ratio, RDR: ratio of deep rooting, RDW:root dry weight, RFW: root fresh weight, RGR: root growth rate, RL: root length, RN: root number, RSA: rootsurface area, RSR: root to shoot ratio, RT: root thickness, RV: root volume

Figure 3
Concentric circles show different features drawn in SOFIA package (Diaz-Garcia et al. 2017) in the Renvironment. The twelve rice chromosomes portrayed along the perimeter of every circle; (a) Colored barsshowing the twelve rice chromosomes and chromosomal positions (cM) presented along thechromosomes. (b) Flanking markers of each MQTL on the consensus genetic map. (c) Distribution of theinitial QTLs on the twelve chromosomes of rice (blue lines) and position of MQTLs with the 95%con�dence intervals (red). (d) QTL-overview index (probability density) for the root traits QTLs onconsensus genetic map. (e) Proportion of phenotypic variance explained (R2) for each initial QTLs. (f)Density of initial QTL for each MQTL

Figure 4
Circos diagram for initial QTLs and MQTLs associated with root traits on the physical map of the ricejaponica variety Nipponbare. The twelve rice chromosomes are portrayed along the perimeter of eachcircle. (a) Colored bars showing the twelve rice chromosomes and physical positions (100 Kb) arepresented along the chromosomes. (b) Flanking markers of each MQTL on the rice physical map. (c)Distribution of initial QTLs on twelve chromosomes of rice (black lines) and position of MQTLs withcon�dence intervals (red areas). (d) Coe�cient of reduction in physical CI from mean original QTLs toMQTL. (e) Number of genes involved in each MQTL interval
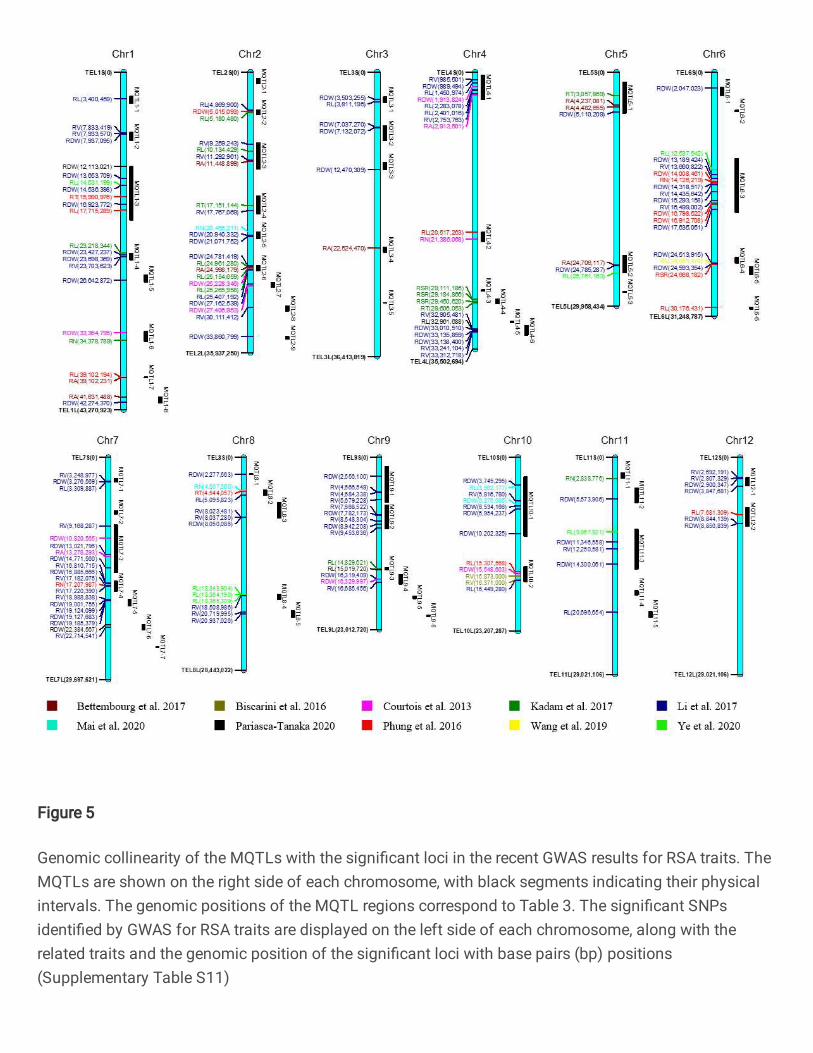
Figure 5
Genomic collinearity of the MQTLs with the signi�cant loci in the recent GWAS results for RSA traits. TheMQTLs are shown on the right side of each chromosome, with black segments indicating their physicalintervals. The genomic positions of the MQTL regions correspond to Table 3. The signi�cant SNPsidenti�ed by GWAS for RSA traits are displayed on the left side of each chromosome, along with therelated traits and the genomic position of the signi�cant loci with base pairs (bp) positions(Supplementary Table S11)

Figure 6
Genetic loci controlling phenotypic variations of RSA traits in rice. The rectangles �lled with red colourwere MQTLs identi�ed on the 12 chromosomes of rice, with rectangle width to be con�dence interval ofMQTLs supported through meta-analysis method. The mean of phenotypic variance explained (PVE) byeach MQTL was ruled on the left side of plot. Points with different colours represented signi�cant SNPsidenti�ed by previous GWAS studies in different root traits. RA: root angle, RDW: root dry weight, RL: rootlength, RN: root number, RSR: root to shoot ratio, RT: root thickness, RV: root volume

Figure 7
The molecular network associated with rice root development using potential candidate genes located inMQTLs. An arrow shows a positive regulatory action and lines with a �at head in their end show negativeregulatory actions. Text color code: biological processes: purple, hormones: blue, genes/proteins locatedin MQTLs: black, genes/proteins located in both MQTLs and SNP peak positions reported in rice GWASfor root morphological traits: dark blue, Ca+2: red, root traits: pink, root parts: green
Supplementary Files
This is a list of supplementary �les associated with this preprint. Click to download.
SupplementaryFigsTAGRS.docx
SupplementaryTableS1.Consensusgeneticmap.xlsx
SupplementaryTableS2.Temnykhetal.2001.xlsx
SupplementaryTableS3.Candidategenes.xlsx
SupplementaryTableS4.DEGsinMQTLs.xlsx
SupplementaryTableS5.RNAseqmicroarrystudy.docx
SupplementaryTableS6.QTLmap.xlsx
SupplementaryTableS7.DEGs.xlsx
SupplementaryTableS9.GO6436MQTL.xlsx
SupplementaryTableS10.Mapmananalysis.xlsx
SupplementaryTableS11.GWASMQTLs.xlsx