
Pinellas County Board of County Commissioners
163
Pinellas County Board of County Commissioners (BCC) BCC Assembly Room 315 Court Street Clearwater, Florida 33756 REVISED APRIL 6, 2011 April 7, 2011 BUDGET INFORMATION WORK SESSION AGENDA 9:30 a.m. to Noon 1. 2. Management and Budget 3. Real Estate Management 4. Fleet Management 5. Health and Human Services Utilities/Public Works Noon to 1:00 p.m. Recess 1:00 p.m. to 5:30 p.m. 6. Parks and Conservation Resources Order of Items is Subject to Change. All Times are Approximate. ***************** Citizens’ Comments Will be Taken After Each Agenda Item Any Person Wishing to Speak During the “Citizens’ Comments” Portion of the Work or Budget Information Session Agenda Must Have a Yellow Card Completed and Given to Staff at the Staff Table. The Chairman Will Call the Speakers, One by One, to the Podium to be Heard. Each Speaker May Speak up to Three (3) Minutes.
Transcript of Pinellas County Board of County Commissioners
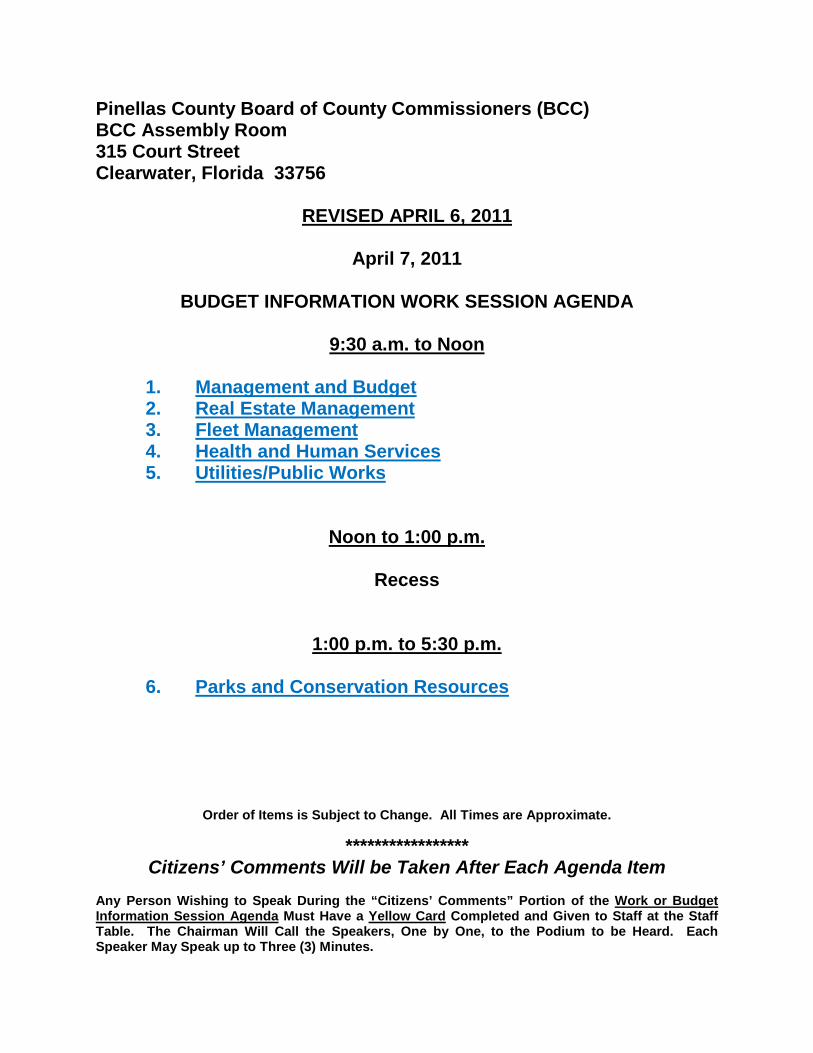
Pinellas County Board of County Commissioners (BCC) BCC Assembly Room 315 Court Street Clearwater, Florida 33756
REVISED APRIL 6, 2011
April 7, 2011
BUDGET INFORMATION WORK SESSION AGENDA
9:30 a.m. to Noon
1. 2.
Management and Budget
3. Real Estate Management
4. Fleet Management
5. Health and Human Services
Utilities/Public Works
Noon to 1:00 p.m.
Recess
1:00 p.m. to 5:30 p.m.
6.
Parks and Conservation Resources
Order of Items is Subject to Change. All Times are Approximate.
***************** Citizens’ Comments Will be Taken After Each Agenda Item
Any Person Wishing to Speak During the “Citizens’ Comments” Portion of the Work or Budget Information Session Agenda Must Have a Yellow Card Completed and Given to Staff at the Staff Table. The Chairman Will Call the Speakers, One by One, to the Podium to be Heard. Each Speaker May Speak up to Three (3) Minutes.
FY2011 Mid-Year
Budget Status ReportApril 7, 2011
Outline of Department Presentations
Management & Budget
Real Estate Management
Fleet Management
Purchasing
Risk Management
Communications
Parks & Conservation Resources
Health & Human Services
Public Works/Utilities
2

Management & BudgetJohn Woodruff
4
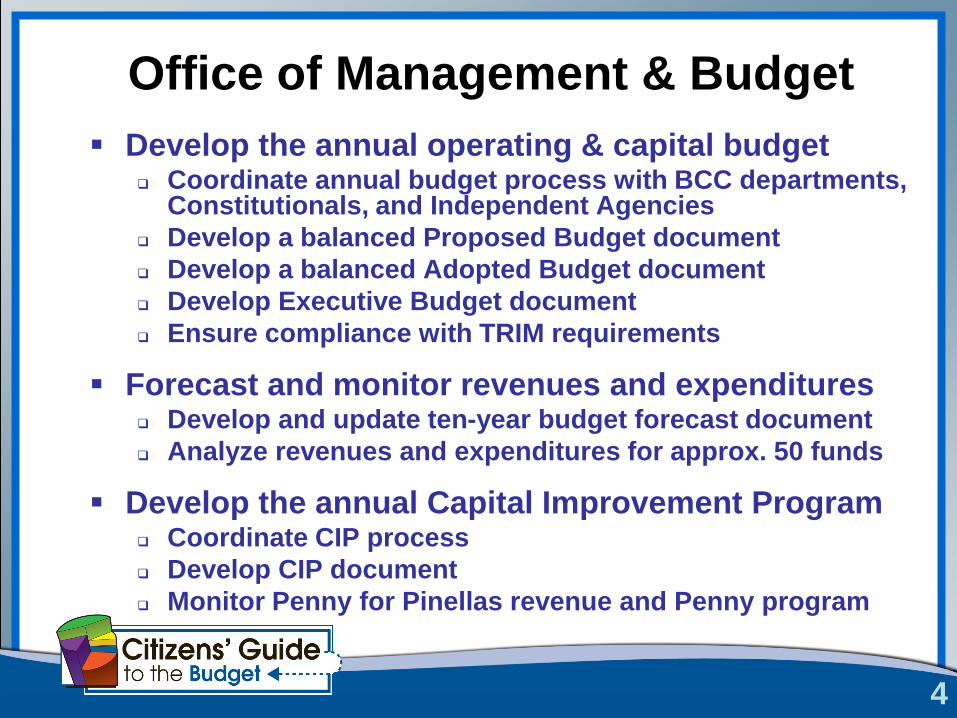
Office of Management & Budget
Develop the annual operating & capital budget Coordinate annual budget process with BCC departments,
Constitutionals, and Independent Agencies
Develop a balanced Proposed Budget document
Develop a balanced Adopted Budget document
Develop Executive Budget document
Ensure compliance with TRIM requirements
Forecast and monitor revenues and expenditures Develop and update ten-year budget forecast document
Analyze revenues and expenditures for approx. 50 funds
Develop the annual Capital Improvement Program Coordinate CIP process
Develop CIP document
Monitor Penny for Pinellas revenue and Penny program
5
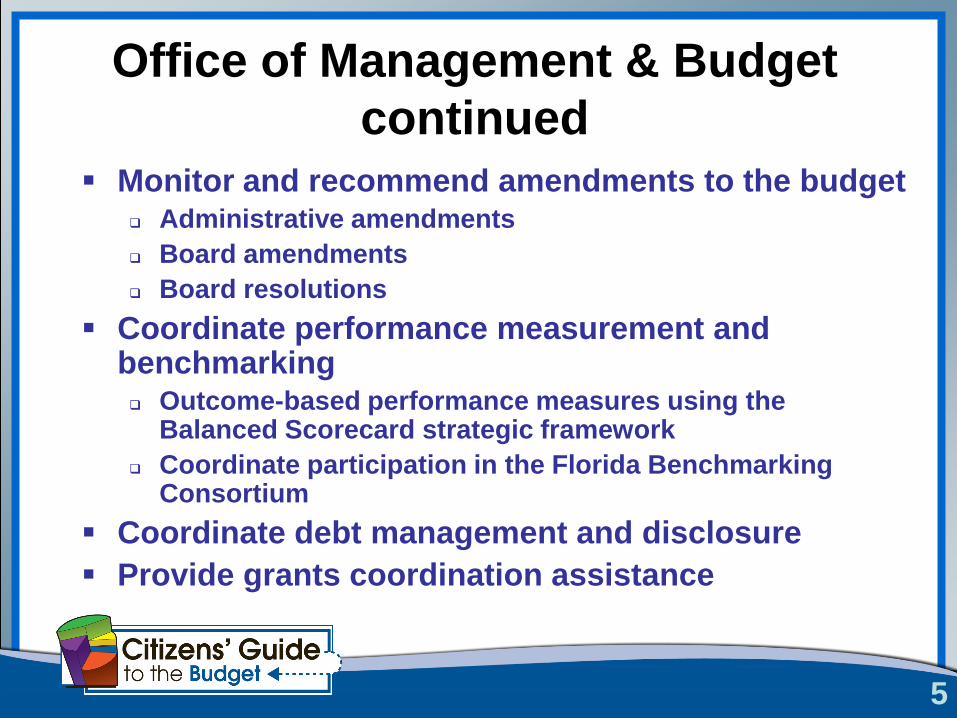
Office of Management & Budget
continued
Monitor and recommend amendments to the budget Administrative amendments
Board amendments
Board resolutions
Coordinate performance measurement and benchmarking Outcome-based performance measures using the
Balanced Scorecard strategic framework
Coordinate participation in the Florida Benchmarking Consortium
Coordinate debt management and disclosure
Provide grants coordination assistance
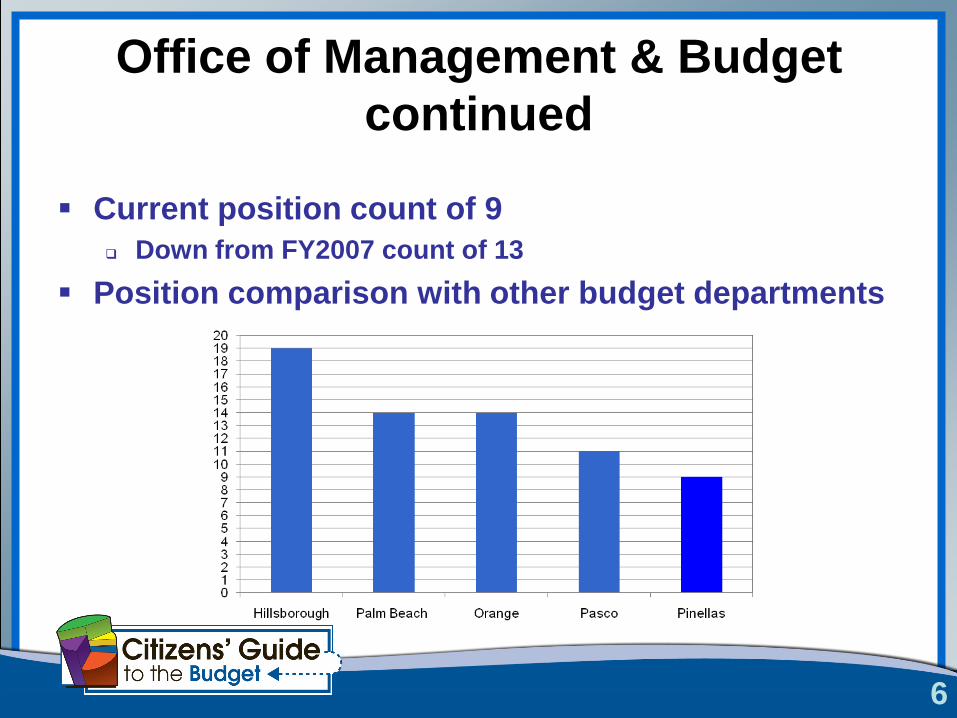
Office of Management & Budget
continued
Current position count of 9
Down from FY2007 count of 13
Position comparison with other budget departments
6
7
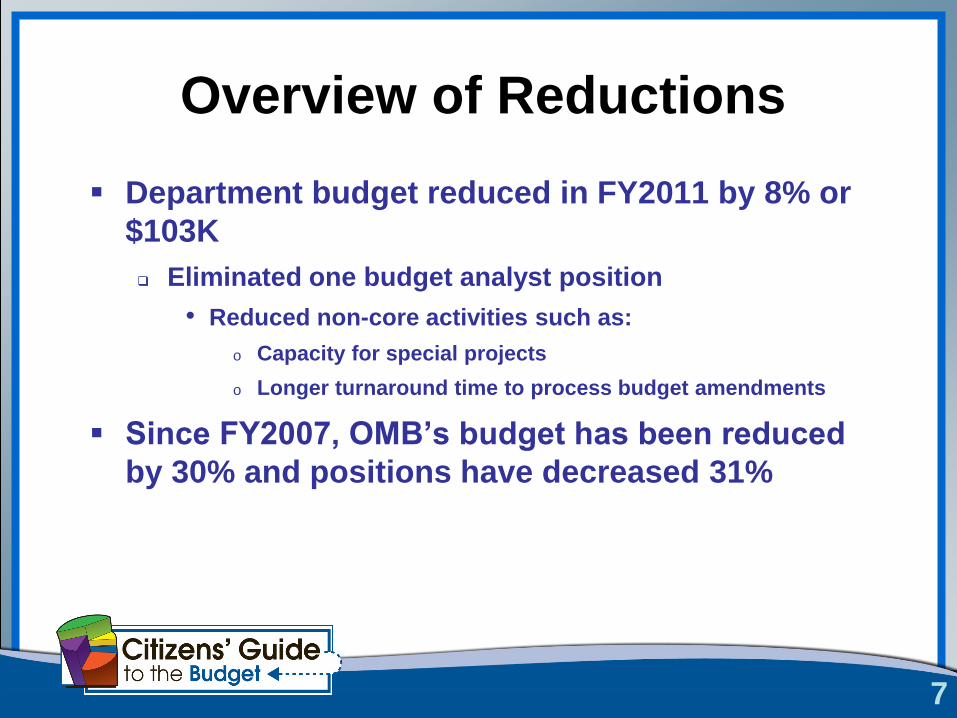
Overview of Reductions
Department budget reduced in FY2011 by 8% or
$103K
Eliminated one budget analyst position
• Reduced non-core activities such as:
o Capacity for special projects
o Longer turnaround time to process budget amendments
Since FY2007, OMB‟s budget has been reduced
by 30% and positions have decreased 31%
8
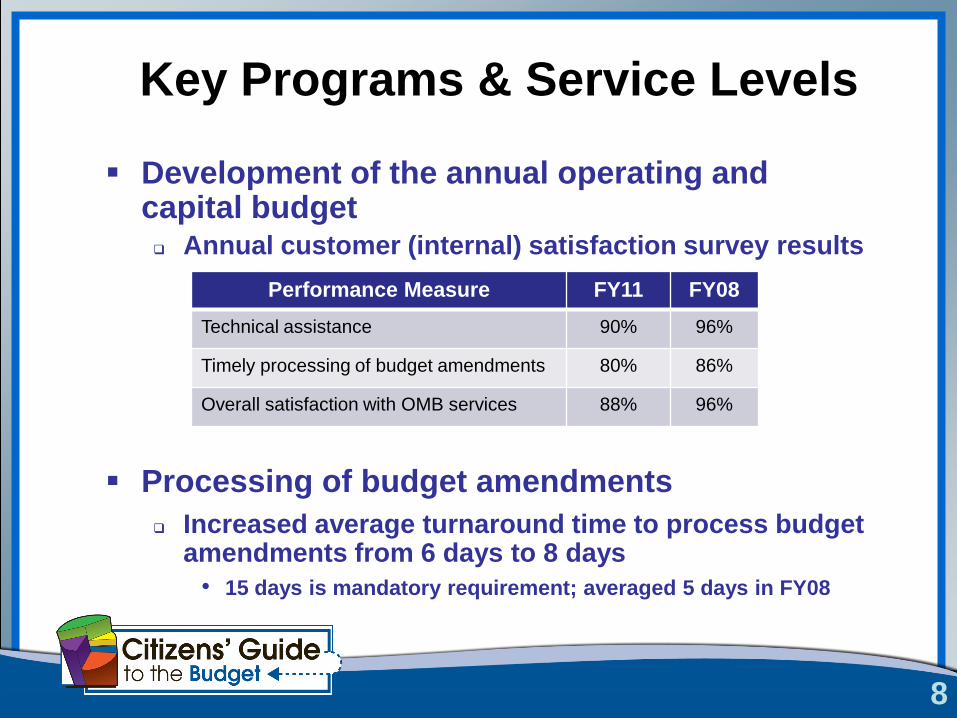
Key Programs & Service Levels
Development of the annual operating and capital budget Annual customer (internal) satisfaction survey results
Processing of budget amendments
Increased average turnaround time to process budget amendments from 6 days to 8 days
• 15 days is mandatory requirement; averaged 5 days in FY08
Performance Measure FY11 FY08
Technical assistance 90% 96%
Timely processing of budget amendments 80% 86%
Overall satisfaction with OMB services 88% 96%
9
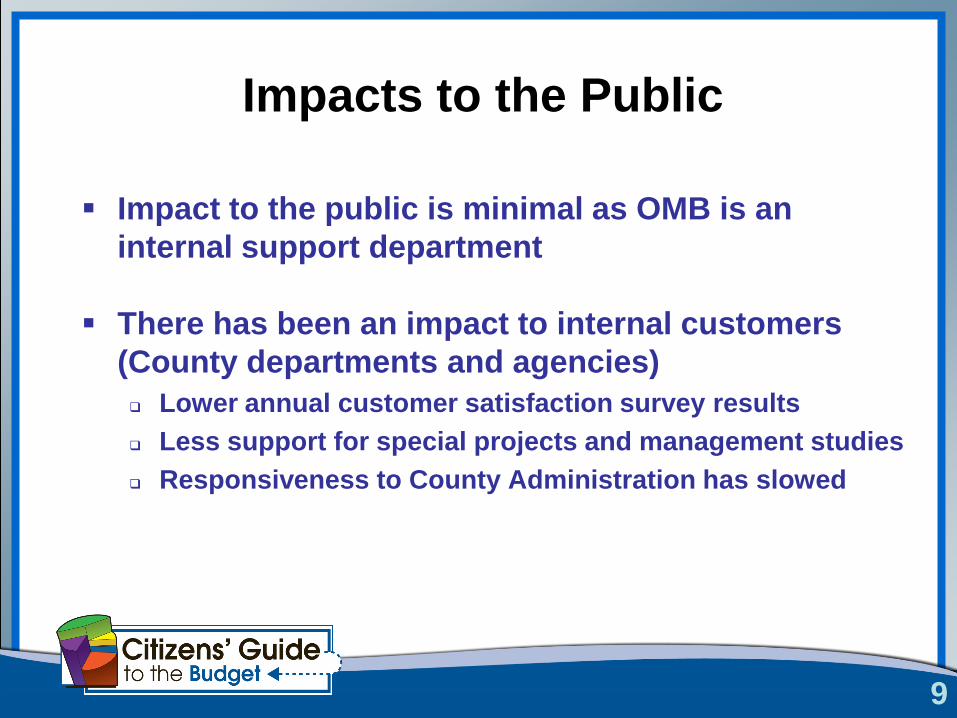
Impacts to the Public
Impact to the public is minimal as OMB is an
internal support department
There has been an impact to internal customers
(County departments and agencies)
Lower annual customer satisfaction survey results
Less support for special projects and management studies
Responsiveness to County Administration has slowed
10
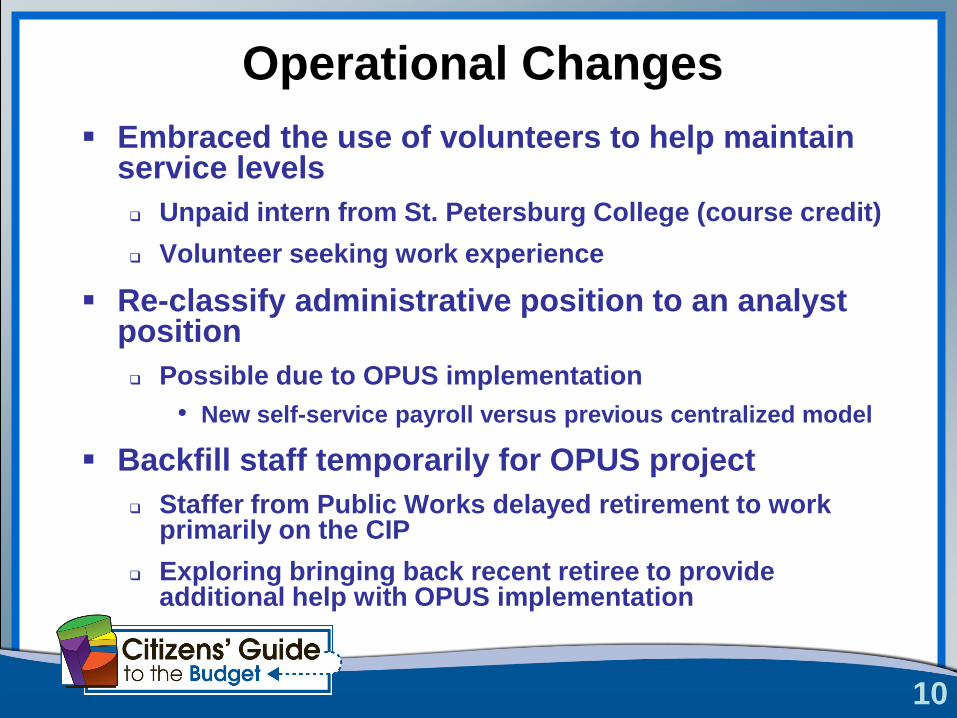
Operational Changes
Embraced the use of volunteers to help maintain service levels
Unpaid intern from St. Petersburg College (course credit)
Volunteer seeking work experience
Re-classify administrative position to an analyst position
Possible due to OPUS implementation
• New self-service payroll versus previous centralized model
Backfill staff temporarily for OPUS project
Staffer from Public Works delayed retirement to work primarily on the CIP
Exploring bringing back recent retiree to provide additional help with OPUS implementation

11
Operational Changes
Other operational changes made last year
Increased the workload of individual analysts
Reorganized the department to better distribute “peaks” and “valleys” of workload
Created well-documented procedures for all key activities
Increased communications amongst staff
Limit non-core activities such as participation in special projects and management studies
Avoid significant unplanned changes to the budget process
Reduced support for performance measurement, benchmarking, strategic planning, and training offerings
12
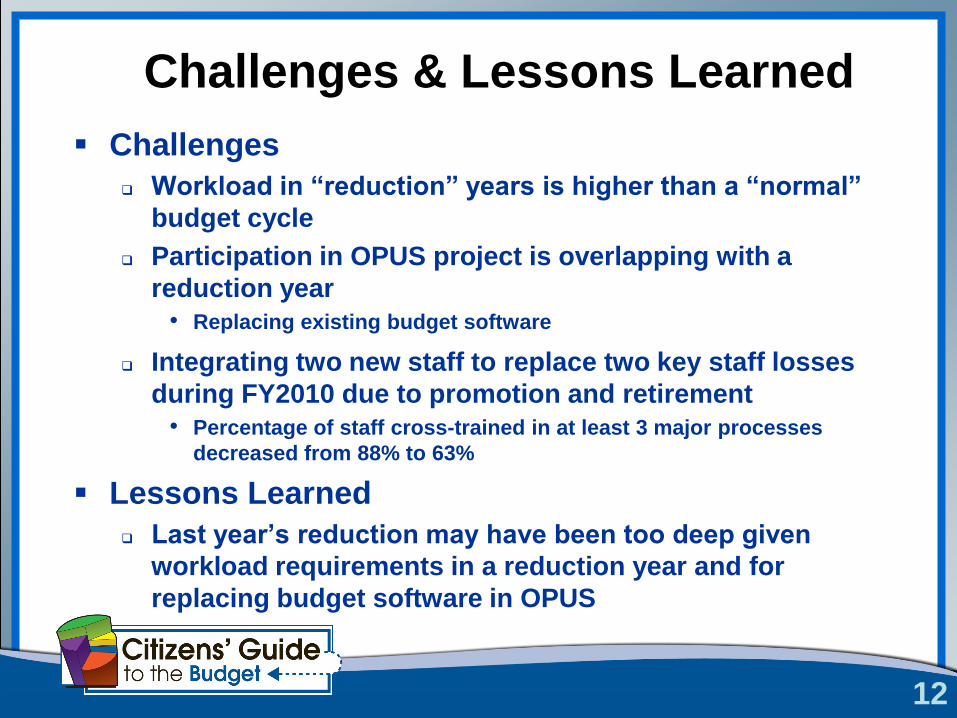
Challenges & Lessons Learned
Challenges
Workload in “reduction” years is higher than a “normal”
budget cycle
Participation in OPUS project is overlapping with a
reduction year
• Replacing existing budget software
Integrating two new staff to replace two key staff losses
during FY2010 due to promotion and retirement
• Percentage of staff cross-trained in at least 3 major processes
decreased from 88% to 63%
Lessons Learned
Last year‟s reduction may have been too deep given
workload requirements in a reduction year and for
replacing budget software in OPUS
13
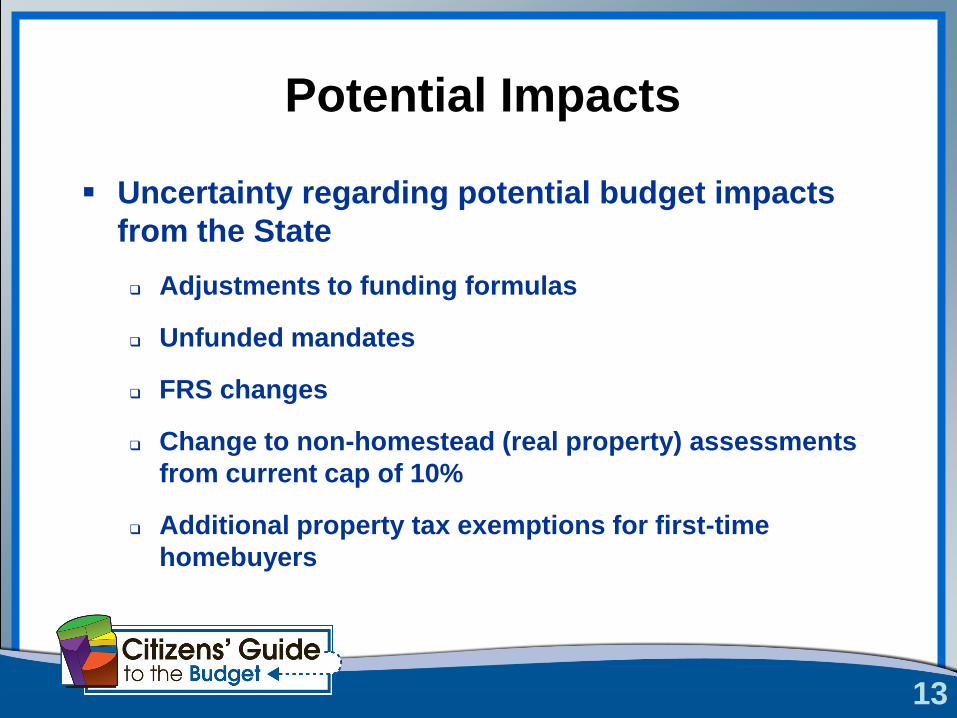
Potential Impacts
Uncertainty regarding potential budget impacts
from the State
Adjustments to funding formulas
Unfunded mandates
FRS changes
Change to non-homestead (real property) assessments
from current cap of 10%
Additional property tax exemptions for first-time
homebuyers

Real Estate ManagementPaul Sacco
15
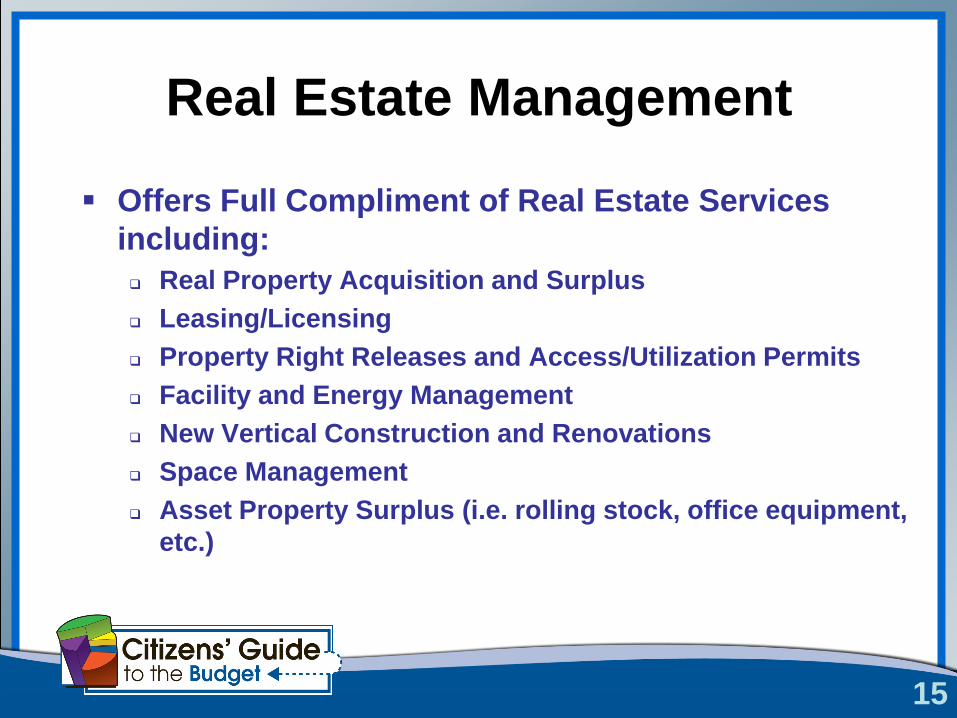
Real Estate Management
Offers Full Compliment of Real Estate Services
including:
Real Property Acquisition and Surplus
Leasing/Licensing
Property Right Releases and Access/Utilization Permits
Facility and Energy Management
New Vertical Construction and Renovations
Space Management
Asset Property Surplus (i.e. rolling stock, office equipment,
etc.)
16
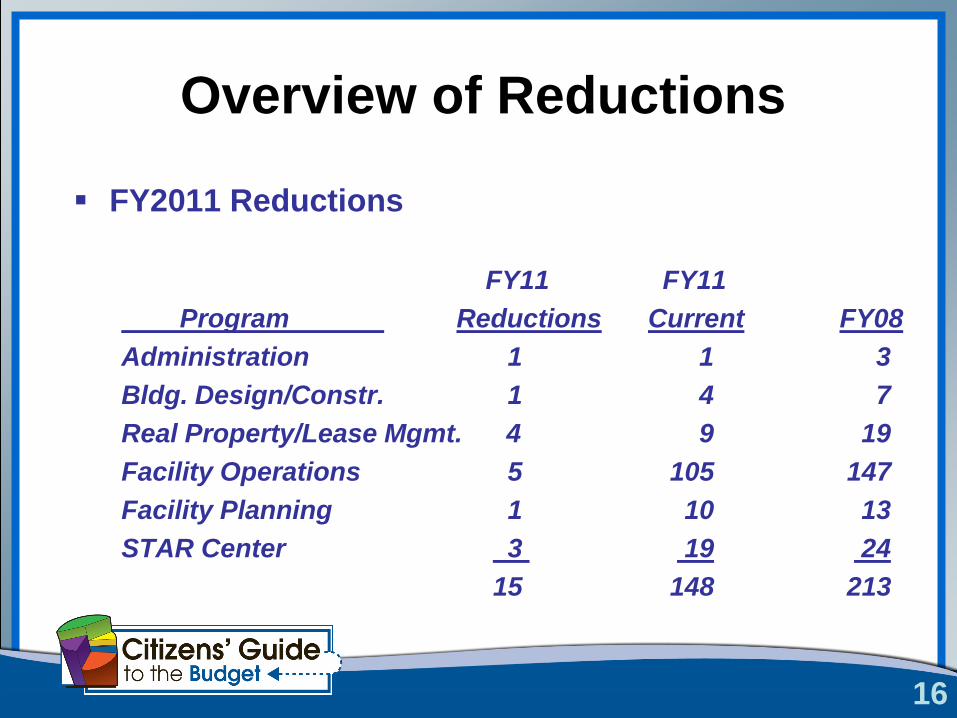
Overview of Reductions
FY2011 Reductions
FY11 FY11
Program Reductions Current FY08
Administration 1 1 3
Bldg. Design/Constr. 1 4 7
Real Property/Lease Mgmt. 4 9 19
Facility Operations 5 105 147
Facility Planning 1 10 13
STAR Center 3 19 24
15 148 213
17
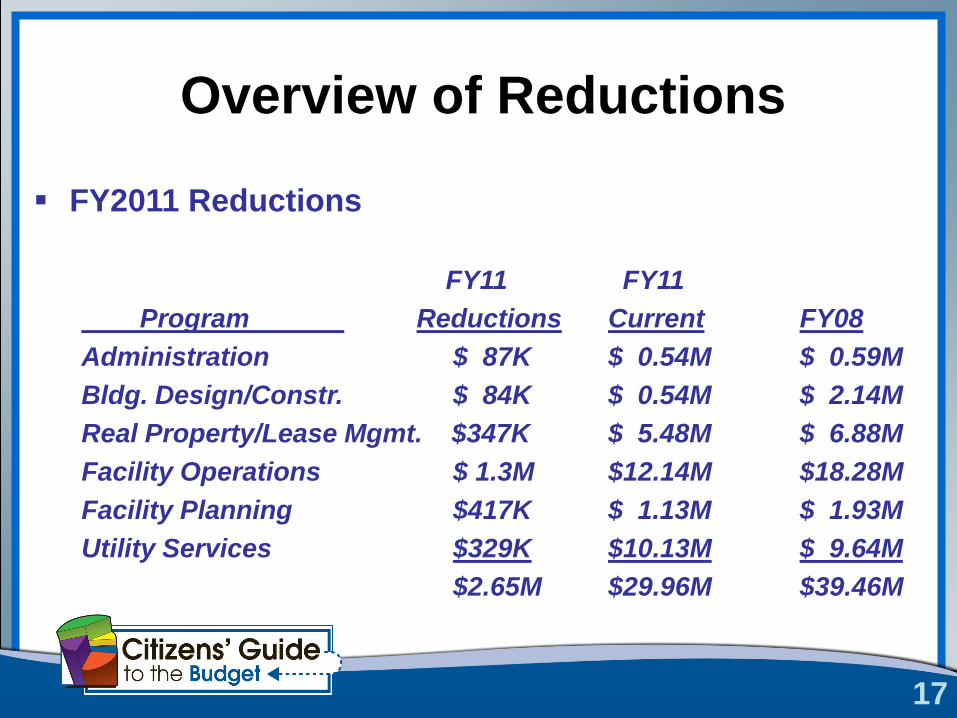
Overview of Reductions
FY2011 Reductions
FY11 FY11
Program Reductions Current FY08
Administration $ 87K $ 0.54M $ 0.59M
Bldg. Design/Constr. $ 84K $ 0.54M $ 2.14M
Real Property/Lease Mgmt. $347K $ 5.48M $ 6.88M
Facility Operations $ 1.3M $12.14M $18.28M
Facility Planning $417K $ 1.13M $ 1.93M
Utility Services $329K $10.13M $ 9.64M
$2.65M $29.96M $39.46M
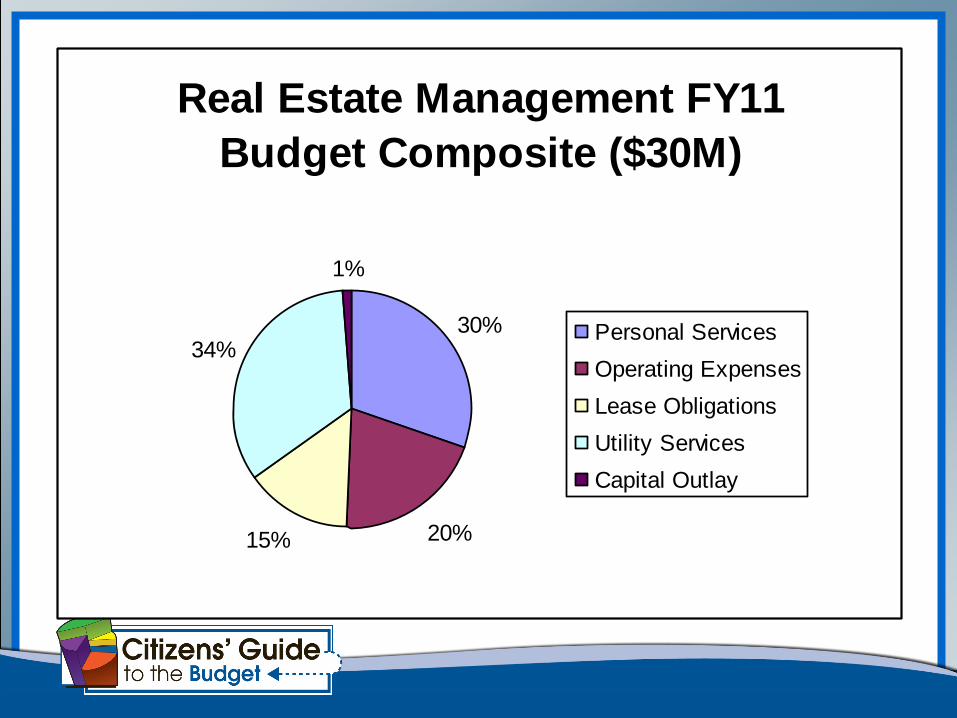
Real Estate Management FY11
Budget Composite ($30M)
30%
20%15%
34%
1%
Personal Services
Operating Expenses
Lease Obligations
Utility Services
Capital Outlay
19
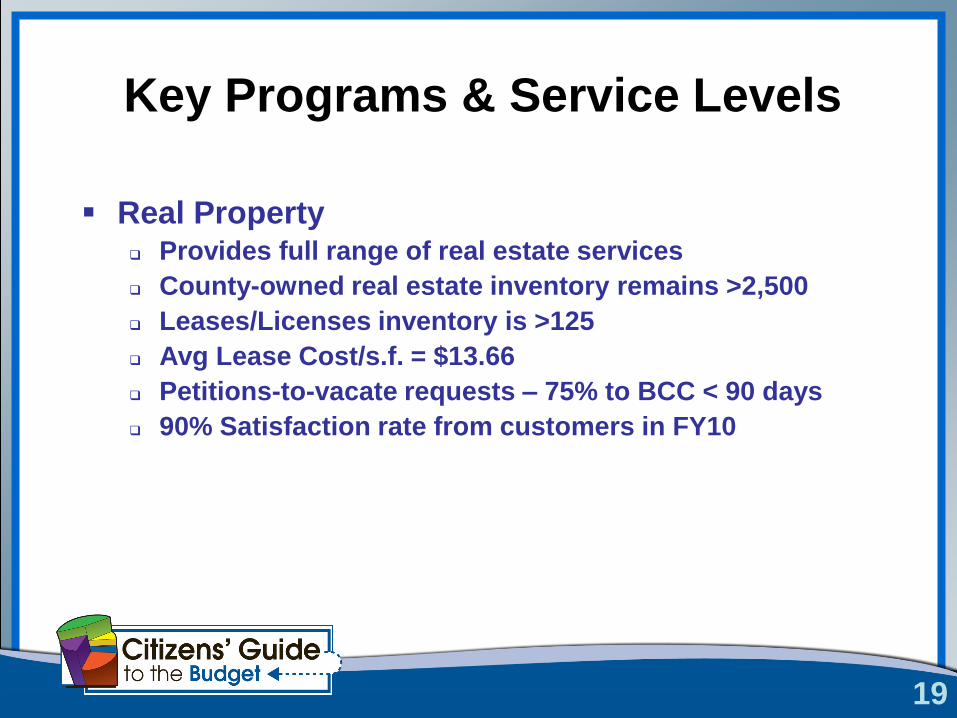
Key Programs & Service Levels
Real Property Provides full range of real estate services
County-owned real estate inventory remains >2,500
Leases/Licenses inventory is >125
Avg Lease Cost/s.f. = $13.66
Petitions-to-vacate requests – 75% to BCC < 90 days
90% Satisfaction rate from customers in FY10
20
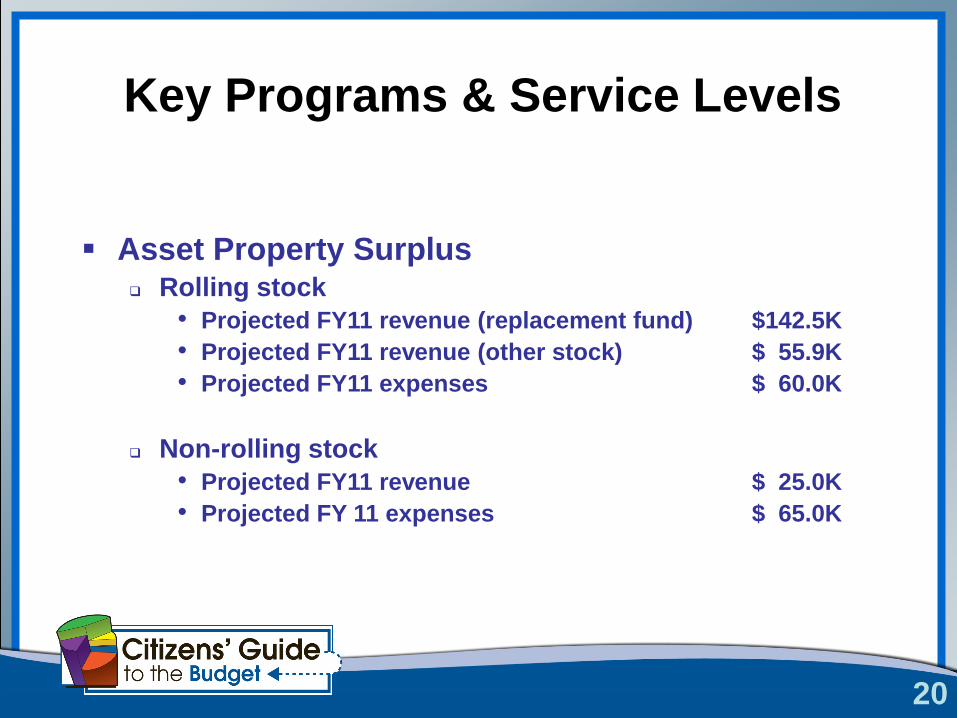
Key Programs & Service Levels
Asset Property Surplus Rolling stock
• Projected FY11 revenue (replacement fund) $142.5K
• Projected FY11 revenue (other stock) $ 55.9K
• Projected FY11 expenses $ 60.0K
Non-rolling stock
• Projected FY11 revenue $ 25.0K
• Projected FY 11 expenses $ 65.0K
21
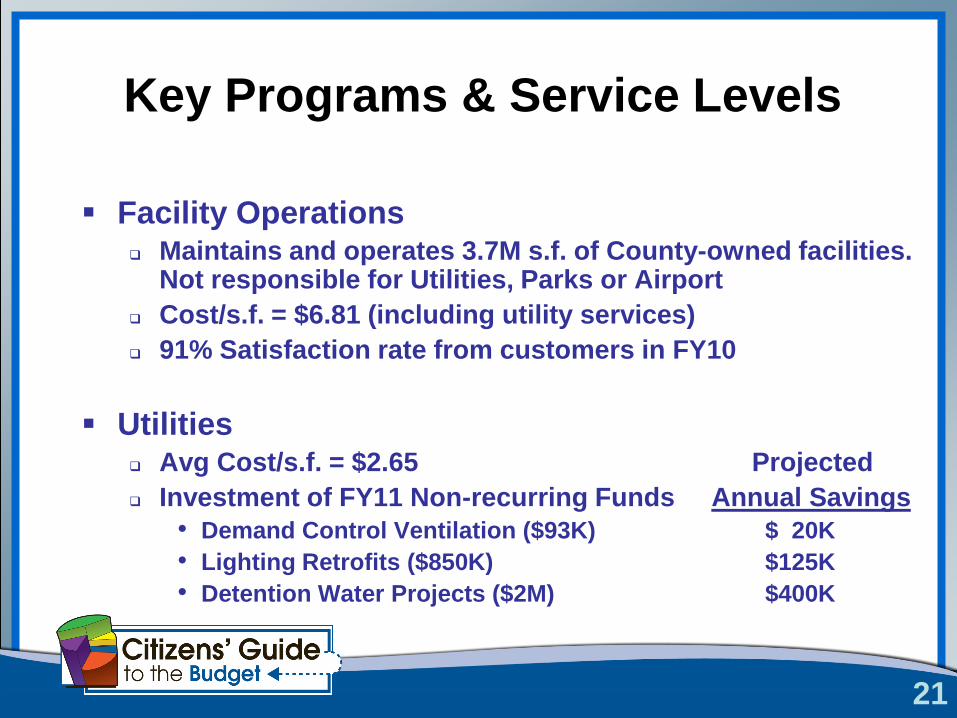
Key Programs & Service Levels
Facility Operations Maintains and operates 3.7M s.f. of County-owned facilities.
Not responsible for Utilities, Parks or Airport
Cost/s.f. = $6.81 (including utility services)
91% Satisfaction rate from customers in FY10
Utilities Avg Cost/s.f. = $2.65 Projected
Investment of FY11 Non-recurring Funds Annual Savings
• Demand Control Ventilation ($93K) $ 20K
• Lighting Retrofits ($850K) $125K
• Detention Water Projects ($2M) $400K
22
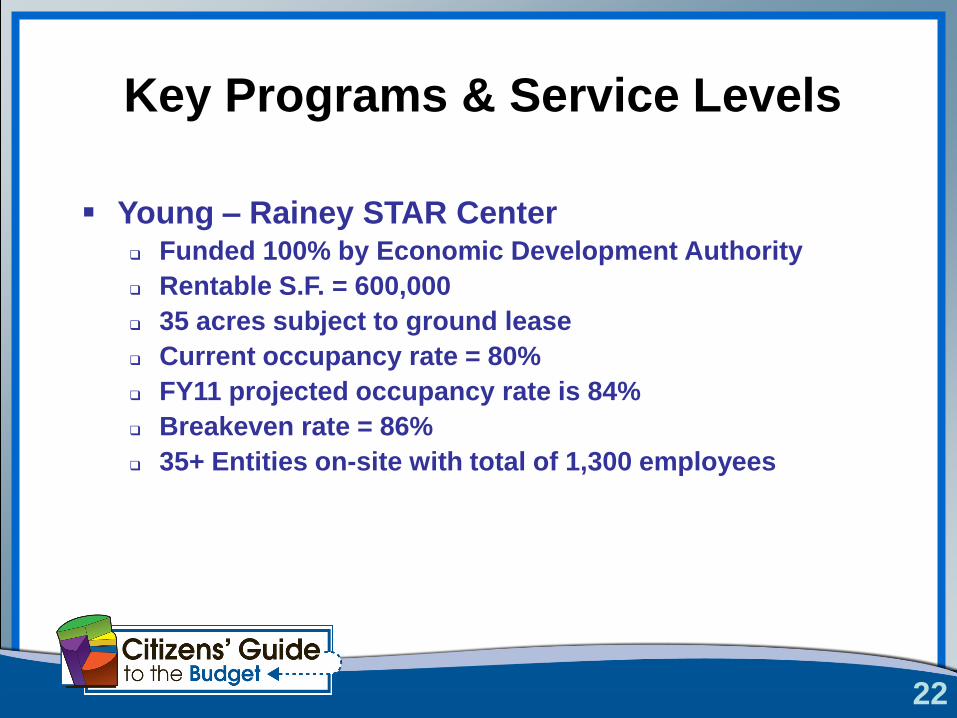
Key Programs & Service Levels
Young – Rainey STAR Center Funded 100% by Economic Development Authority
Rentable S.F. = 600,000
35 acres subject to ground lease
Current occupancy rate = 80%
FY11 projected occupancy rate is 84%
Breakeven rate = 86%
35+ Entities on-site with total of 1,300 employees
23
Impacts to the Customer
Non-maintenance project requests remained
reduced by 80% when compared to FY09. Feedback
has been neutral.
Space Consolidation Plan delayed. Feedback has
been „understanding‟.
24
Operational Changes
Implemented a proactive maintenance strategy
Implemented Inventory Control utilizing Maximo
Investment in energy/water conservation projects
Continued lease renegotiations
Space Consolidation Plan is in progress
Real Estate and Lease Management Software
Procurement is in progress
25
Challenges & Lessons Learned
Challenges Scheduling and physical moves associated with Space
Consolidation Plan
Increases to the number of declarations of surplus and sale of County properties will burden other staff (i.e. research, survey, purchasing, etc.)
Lessons Learned Remain in touch with Customer‟s needs
One-time funding investments into energy/water conservation projects is very wise
Continue focus on process improvement and technology integration.
26
Potential Impacts
Consolidation of Fleet Management under Real
Estate Management (positive impact)
Public Safety Campus Project
Clearwater Campus Centralized Energy Plant
Feasibility of Consolidated Service Center and
Judicial Operations
27
Potential Impacts
Fuel Increases could result in increased utilities,
construction materials and goods/services
(negative impact)
Potential Legislation
Restrictions siting Cellular Facilities on County
properties (negative impact)
Non-competitive short term lease agreements (positive
impact)
Fleet ManagementKeith Grant
2929
Fleet Management
Fleet Management is responsible for supporting the transportation and equipment needs of Pinellas County.
The preventive maintenance and repair of the County‟s automobile, light truck, and heavy equipment fleets, emergency generators, pumps and other related emergency management equipment.
The management of the County‟s vehicle and equipment replacement plan.
The procurement, operation, and management of the County‟s fuel distribution program (1.2M gallons/year), which includes:
The operation of 6 major fuel distribution sites with capacities of 12K gallons or greater.
The operation of 11 satellite fuel distribution sites with capacities less than 1K gallons. Primarily located in County Parks.
3030
Overview of Reductions
FY2011 reductions
The 15% reduction target of $1,197,127 was met by staff reductions of 26% or 11 positions, totaling $796,441 and reductions in operating expenditures for fuel, inventory parts, and operating supplies of $400,686
2 Administrative Support Specialist
1 Body Shop Manager
2 Certified Mechanics
1 Certified Mechanic Supervisor
1 Equipment Operator Trainer
1 Equipment Acquisition Specialist
1 Operations Manager
1 Parts Manager
1 Welder Fabricator
3131
Key Programs & Service Levels
Equipment Acquisition:
Vehicles and equipment which have met the County‟s requirements for replacement. Pinellas County‟s requirements for unit life and utilization exceed federal standards by 42% & 68 % respectively.
Fleet Standardization efforts have reduced the number of Sedan types in use from 5 to 3 , with light, medium and heavy specialty truck configurations being reduced from 65 to 29.
Fleet size reduced from 1881 to 1726 units, or 155 units, for a total reduction of 8.2%.
32
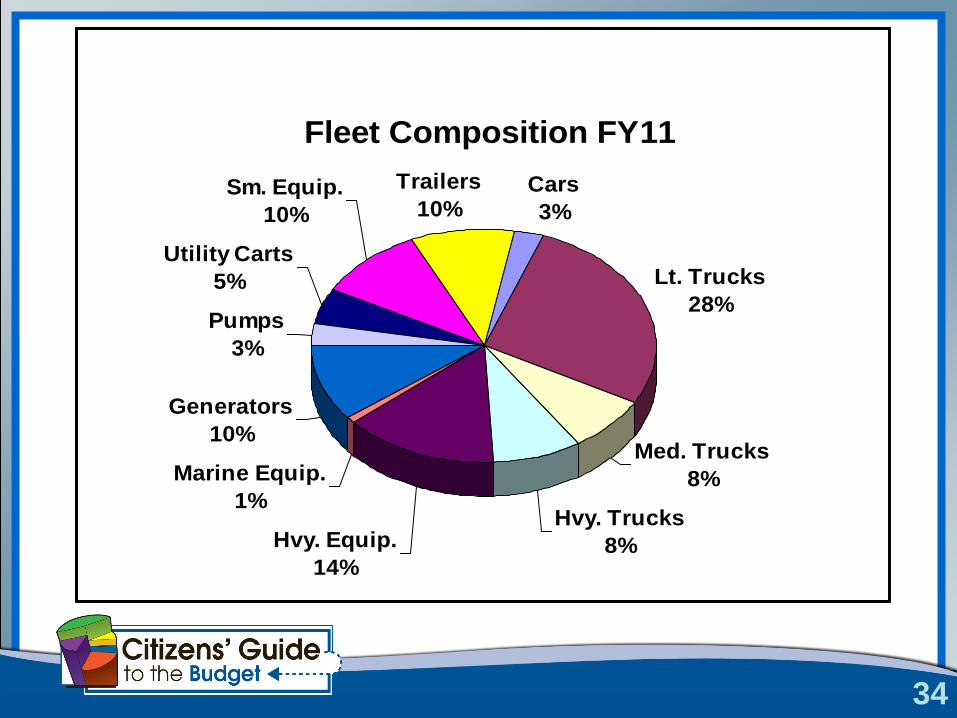
Key Programs & Service Levels
Repair & Maintenance:
Diverse fleet of vehicles & equipment totaling 1726 units.
46% or 802, Total rolling stock units, i.e. Cars, Light, medium & heavy trucks.
54% or 924, Total portable and fixed equipment units, i.e. generators, pumps, carts, trailers, marine and heavy earth moving equipment.
Avg. daily fleet availability = 94% compared to industry & ICMA standard of 86%.
Maintenance and repair support to the County‟s emergency power program encompassing 181 stationary and portable generators Countywide.
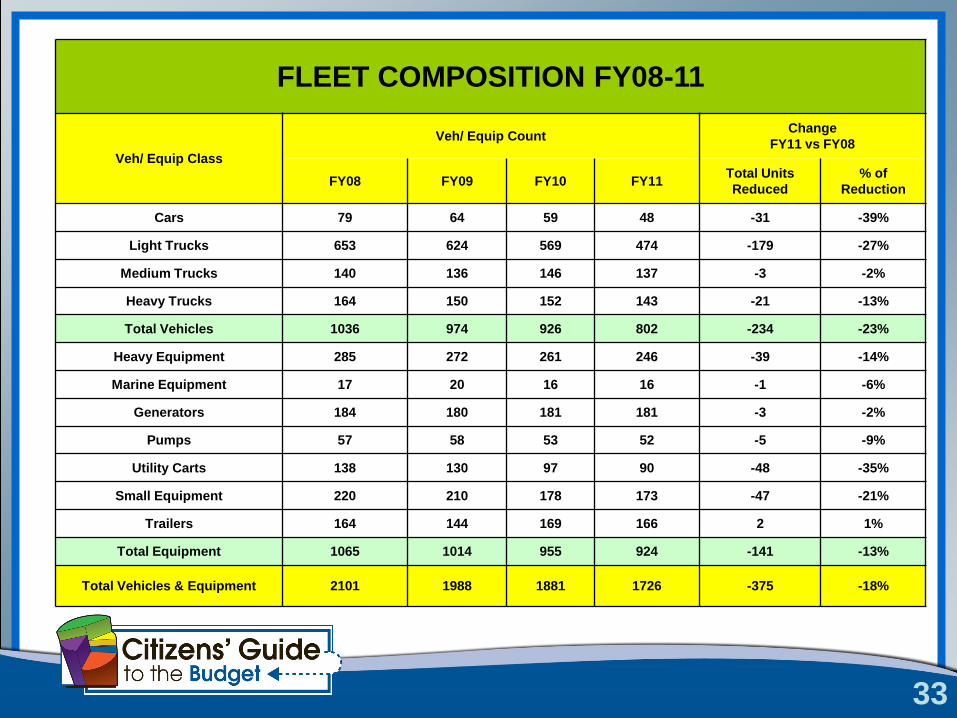
33
FLEET COMPOSITION FY08-11
Veh/ Equip Class
Veh/ Equip CountChange
FY11 vs FY08
FY08 FY09 FY10 FY11Total Units
Reduced
% of
Reduction
Cars 79 64 59 48 -31 -39%
Light Trucks 653 624 569 474 -179 -27%
Medium Trucks 140 136 146 137 -3 -2%
Heavy Trucks 164 150 152 143 -21 -13%
Total Vehicles 1036 974 926 802 -234 -23%
Heavy Equipment 285 272 261 246 -39 -14%
Marine Equipment 17 20 16 16 -1 -6%
Generators 184 180 181 181 -3 -2%
Pumps 57 58 53 52 -5 -9%
Utility Carts 138 130 97 90 -48 -35%
Small Equipment 220 210 178 173 -47 -21%
Trailers 164 144 169 166 2 1%
Total Equipment 1065 1014 955 924 -141 -13%
Total Vehicles & Equipment 2101 1988 1881 1726 -375 -18%
34
Fleet Composition FY11
Cars
3%
Lt. Trucks
28%
Med. Trucks
8%
Hvy. Trucks
8%Hvy. Equip.
14%
Marine Equip.
1%
Generators
10%
Pumps
3%
Utility Carts
5%
Sm. Equip.
10%
Trailers
10%
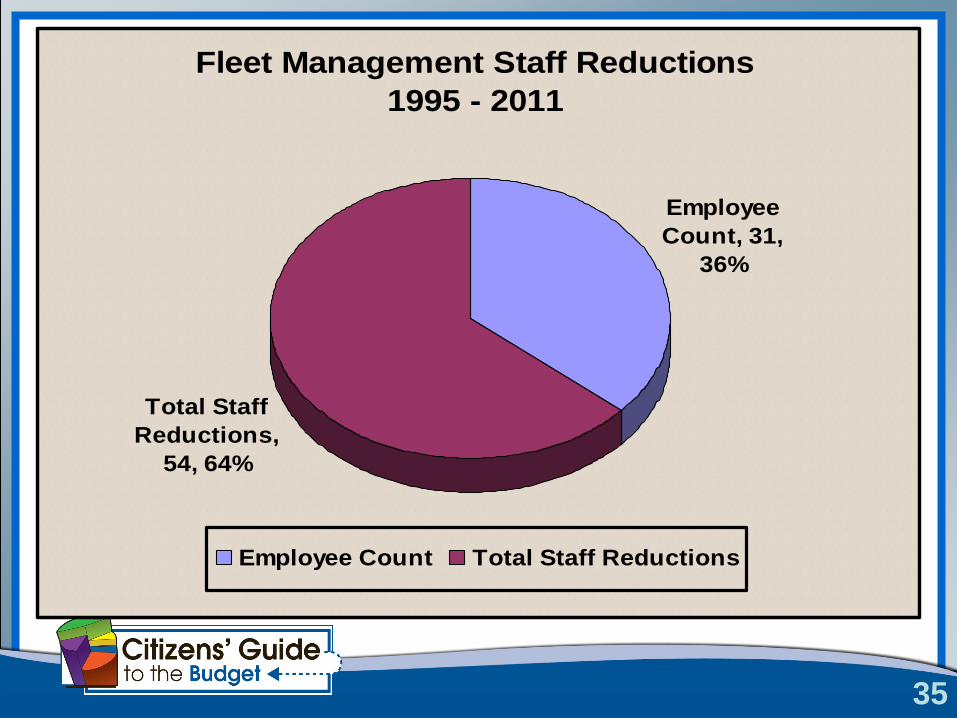
35
Fleet Management Staff Reductions
1995 - 2011
Employee
Count, 31,
36%
Total Staff
Reductions,
54, 64%
Employee Count Total Staff Reductions
36
Key Programs & Service Levels
Inventory Parts:
73% of inventory parts are “just in time” delivery.
Annual inventory shrinkage <0.78% as compared to
the national average of 1- 3%.
Fuel:
1.2 million gallons dispensed annually with 100%
regulatory compliance.
Unleaded gallons dispensed = 396K or 33%
Diesel gallons dispensed = 804K or 67%
3737
Impacts to the Public
Fleet Management serves the public through its internal customers.
The downsizing of the fleet coupled with standardization has allowed customers needs to be met without impact to the public.
Capacity to provide vehicles and equipment in support of organizational emergency response efforts is more limited as a result of ongoing reductions within the fleet.
3838
Operational Changes
Departmental consolidation into Real Estate Management effective May 8th 2011.
Memorandum of Understanding between County and Sheriff for Fleet Maintenance and Service. Sheriff to provide maintenance & repair service to cars &
sedans classes of vehicles.
County to provide maintenance & repair service to diesel and heavy duty classes of vehicles and equipment.
County & Sheriff to share unified fueling functionality inclusive of procurement contracts and fueling locations, anticipated closure of one Sheriff fueling location North County.
39
Operational Changes
Standardization of Vehicles & Equipment; includes make, model, accessories, vehicle color and identification.
Privatization of specific maintenance related tasks; (i.e. tire repair, custom fabrication, transmission repair and heavy accident repairs). 51 current contracts for fleet maintenance related activities and inventory procurements.
Increased Motorpool utilization for vehicle and equipment resource sharing.
Deletion of night shift
Extended service intervals
4040
Challenges & Lessons Learned
Challenges
Current FY11 vehicle & equipment replacements have
been deferred; upcoming FY12 fiscal period may require
additional funding for combined replacements of FY11 &
12 scheduled replacement units.
Funding predictability for fuel procurements will remain
unstable due to market volatility.
Ongoing organizational changes and reductions make it
difficult to plan for what the fleet organization is to
support.
41
Challenges & Lessons Learned
Lessons Learned Change is difficult, challenging and opportunistic.
Must be adaptable; the organizational structure & remaining staff must be flexible to meet the new needs of the organization.
Implementation of budgetary reductions as soon as possible; (i.e. vehicle & equipment reductions).
Unintended Consequences Reduction in fleet size has allowed for the
unanticipated redeployment of vehicles and equipment.
4242
Potential Impacts
Failure to replace FY11 deferred vehicles and
equipment will result in the following:
Decreased reliability of the fleet
Decreases in fleet availability
Increases in operations and maintenance cost
Decreases in resale and depreciated values

Health & Human ServicesCliff Smith
Mission
To improve the quality of life
for all residents of Pinellas County
by providing, coordinating
and advocating for
health care and
essential human services
for those most in need in our community
94
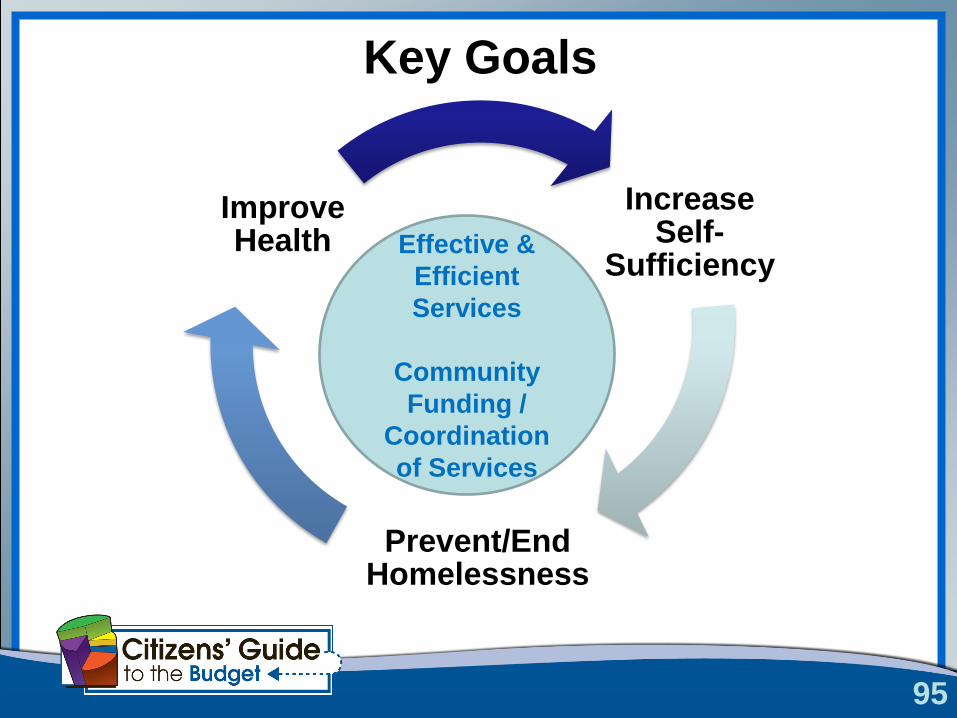
Key Goals
95
Increase Self-
Sufficiency
Prevent/End Homelessness
Improve Health Effective &
Efficient
Services
Community
Funding /
Coordination
of Services
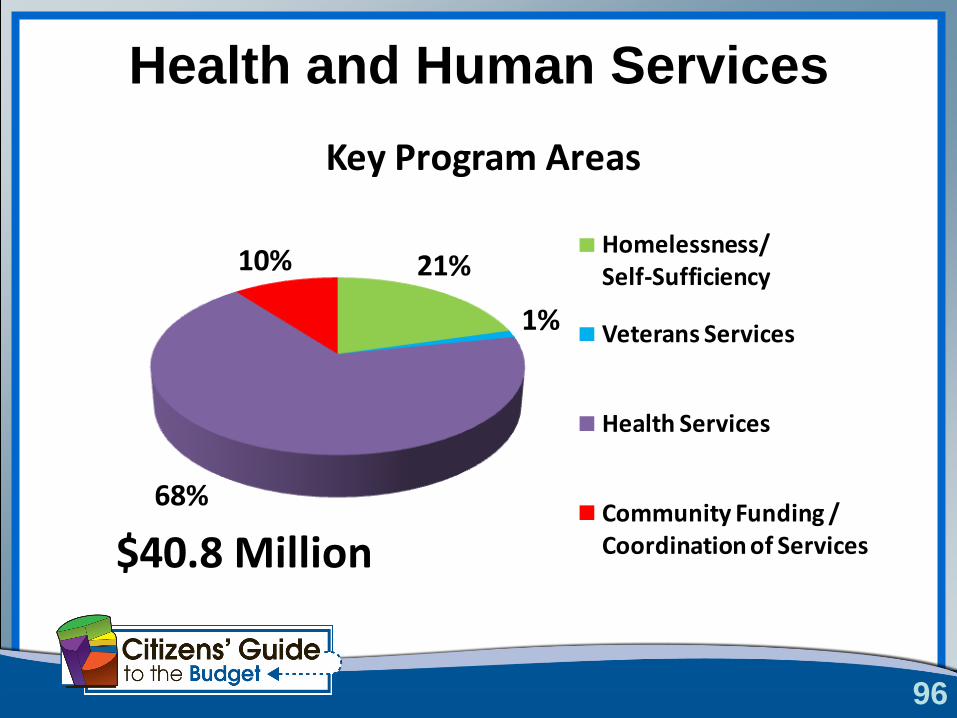
96
Health and Human Services
21%
1%
68%
10%
Key Program Areas
Homelessness/ Self-Sufficiency
Veterans Services
Health Services
Community Funding / Coordination of Services$40.8 Million
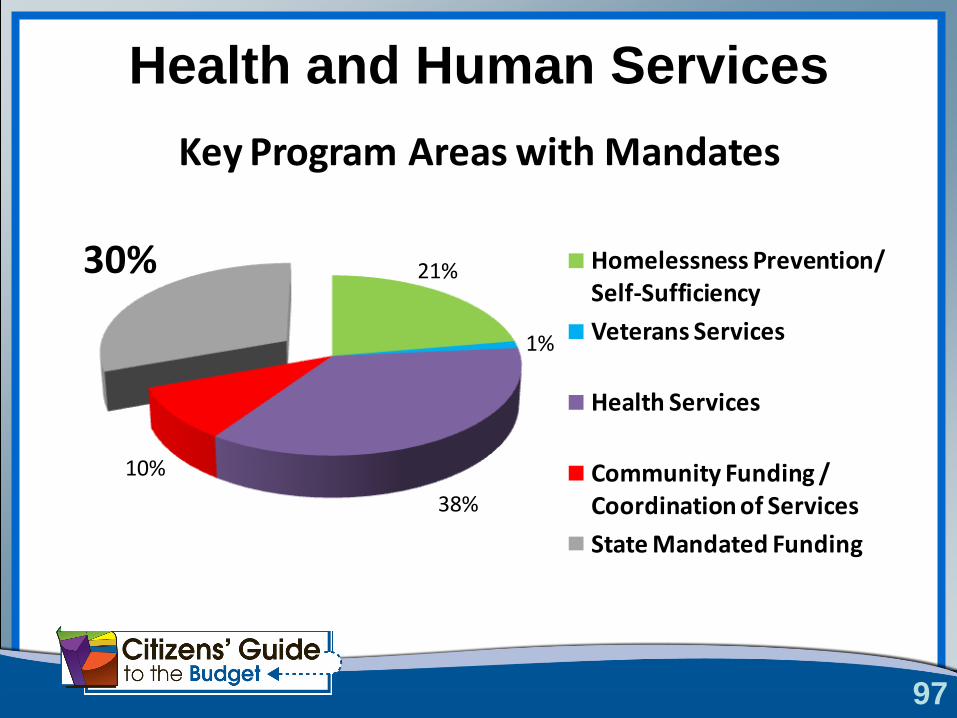
97
Health and Human Services
21%
1%
38%
10%
30%
Key Program Areas with Mandates
Homelessness Prevention/ Self-Sufficiency
Veterans Services
Health Services
Community Funding / Coordination of Services
State Mandated Funding
98
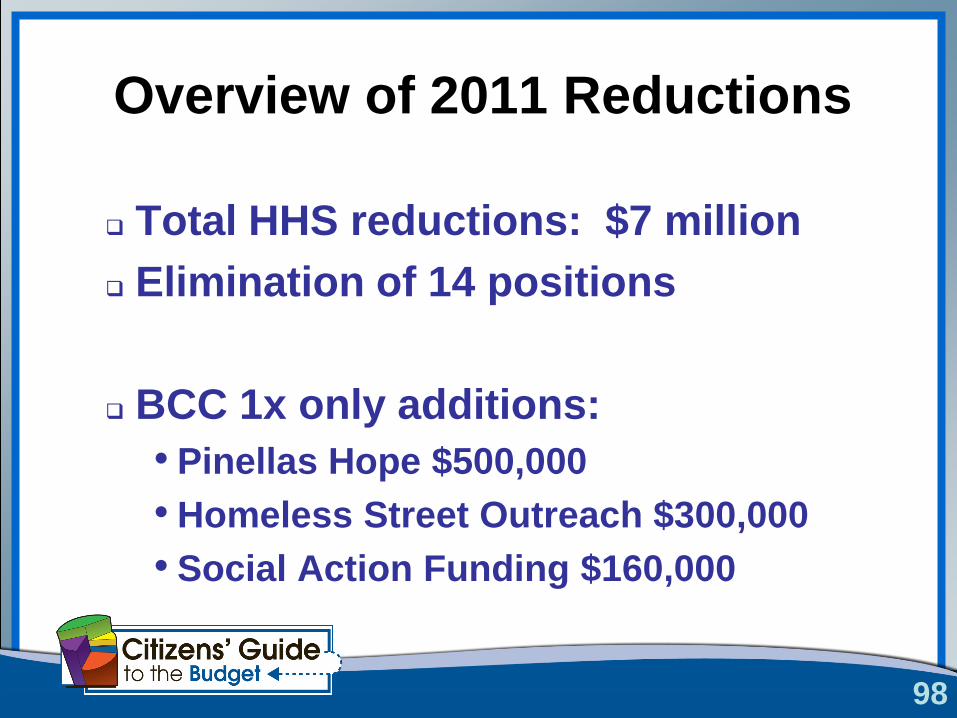
Overview of 2011 Reductions
Total HHS reductions: $7 million
Elimination of 14 positions
BCC 1x only additions:
• Pinellas Hope $500,000
• Homeless Street Outreach $300,000
• Social Action Funding $160,000
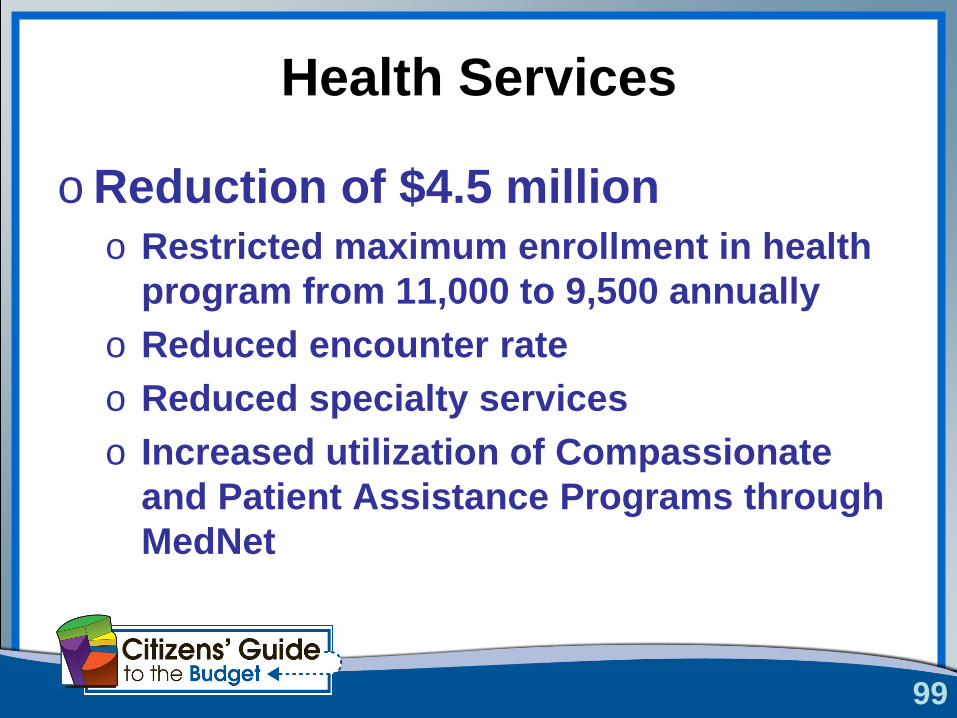
Health Services
o Reduction of $4.5 million o Restricted maximum enrollment in health
program from 11,000 to 9,500 annually
o Reduced encounter rate
o Reduced specialty services
o Increased utilization of Compassionate
and Patient Assistance Programs through
MedNet
99
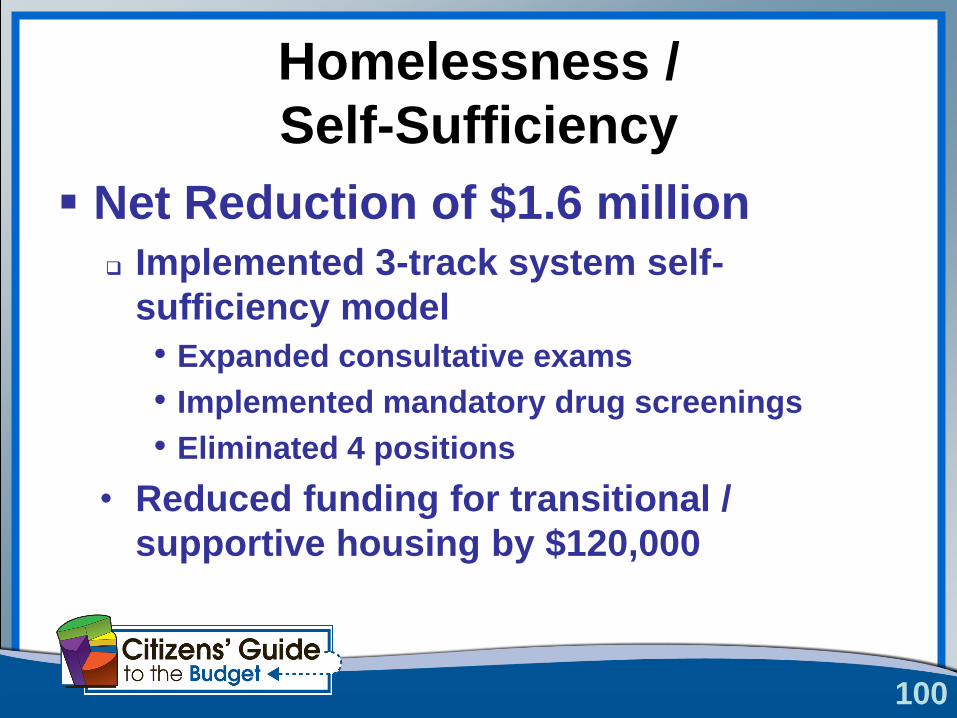
Homelessness /
Self-Sufficiency
Net Reduction of $1.6 million Implemented 3-track system self-
sufficiency model
• Expanded consultative exams
• Implemented mandatory drug screenings
• Eliminated 4 positions
• Reduced funding for transitional /
supportive housing by $120,000
100
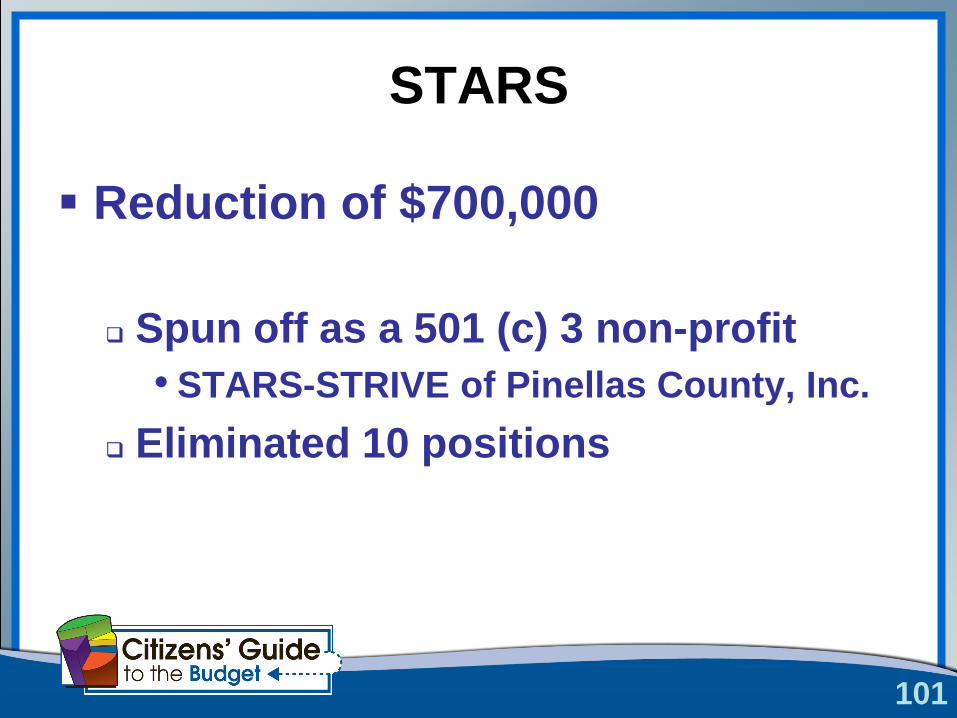
STARS
Reduction of $700,000
Spun off as a 501 (c) 3 non-profit
• STARS-STRIVE of Pinellas County, Inc.
Eliminated 10 positions
101
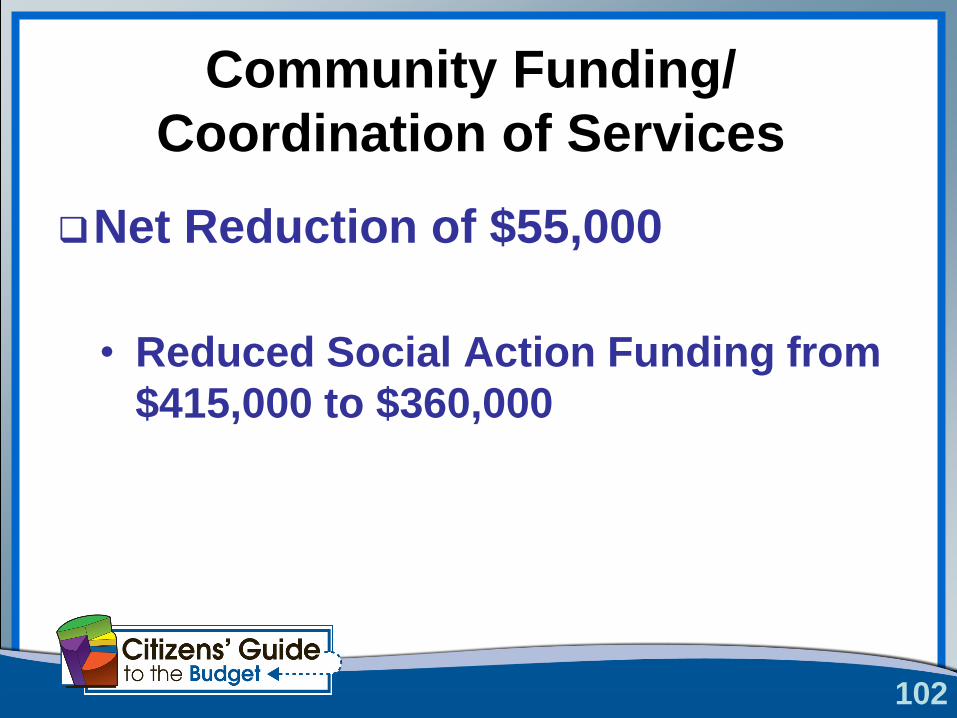
Community Funding/
Coordination of Services
Net Reduction of $55,000
• Reduced Social Action Funding from
$415,000 to $360,000
102
Key Programs & Service Levels
Pinellas County Health Program
Homelessness/Self-Sufficiency
Veterans Services
Community Funding/
Coordination of Services
State Mandated Funding
103
Health Services
104
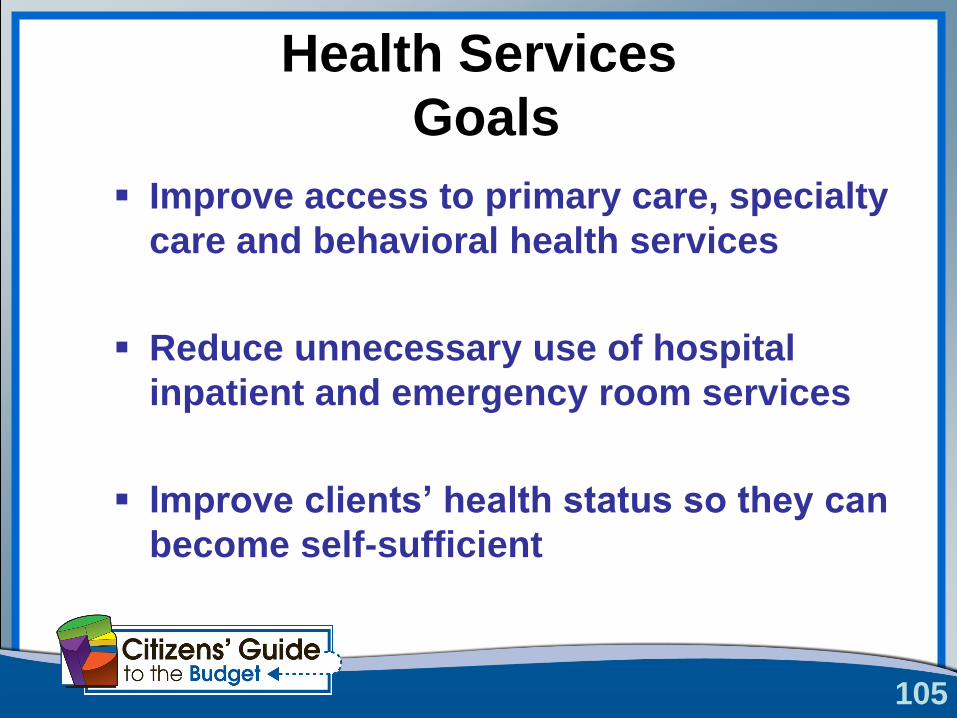
Health Services
Goals
Improve access to primary care, specialty
care and behavioral health services
Reduce unnecessary use of hospital
inpatient and emergency room services
Improve clients‟ health status so they can
become self-sufficient
105
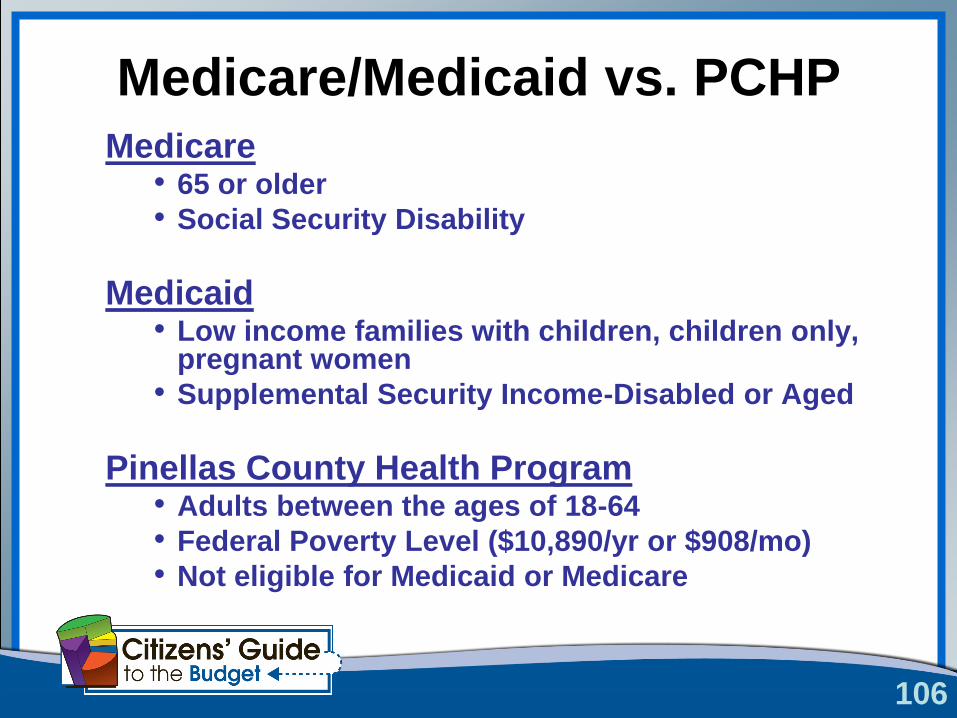
Medicare/Medicaid vs. PCHPMedicare
• 65 or older
• Social Security Disability
Medicaid• Low income families with children, children only,
pregnant women
• Supplemental Security Income-Disabled or Aged
Pinellas County Health Program• Adults between the ages of 18-64
• Federal Poverty Level ($10,890/yr or $908/mo)
• Not eligible for Medicaid or Medicare
106
107
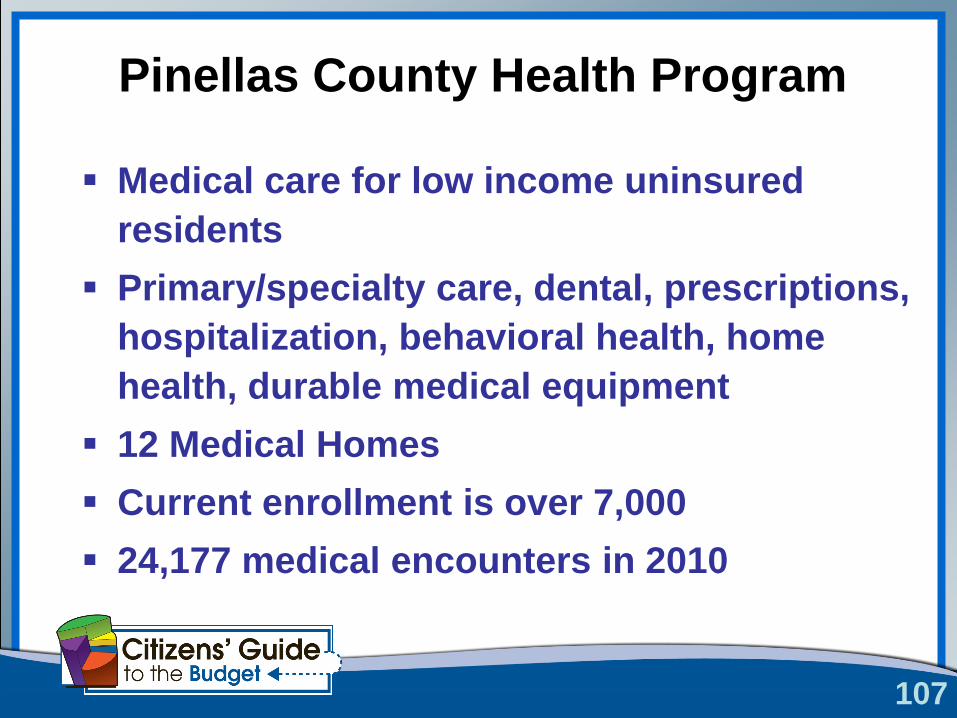
Pinellas County Health Program
Medical care for low income uninsured
residents
Primary/specialty care, dental, prescriptions,
hospitalization, behavioral health, home
health, durable medical equipment
12 Medical Homes
Current enrollment is over 7,000
24,177 medical encounters in 2010
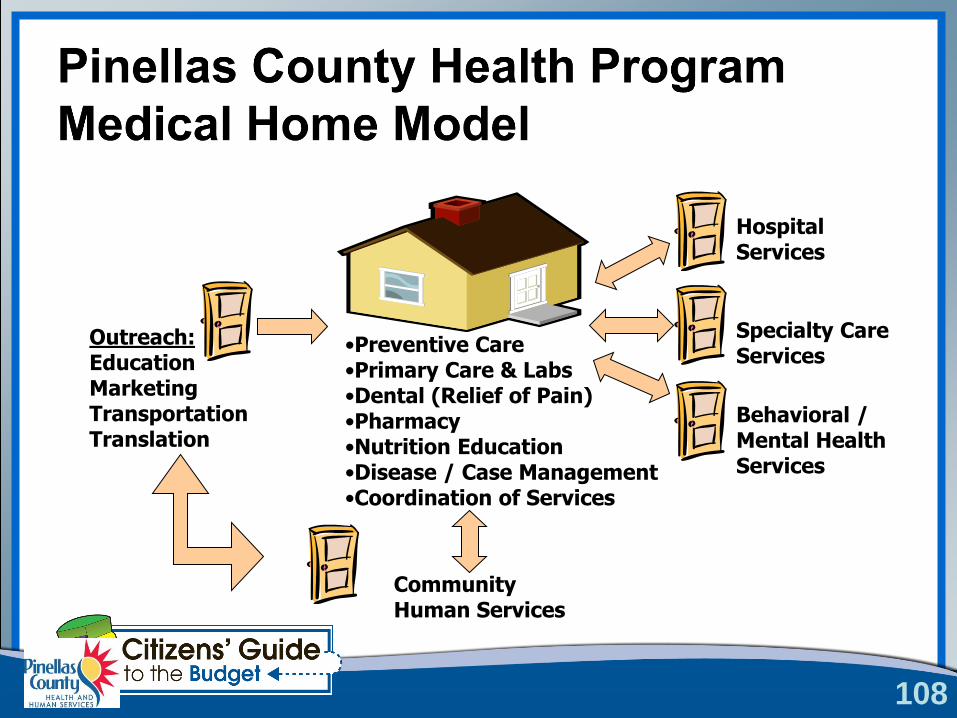
HospitalServices
Specialty CareServices
Behavioral /Mental HealthServices
CommunityHuman Services
Outreach:EducationMarketingTransportationTranslation
•Preventive Care•Primary Care & Labs•Dental (Relief of Pain)•Pharmacy•Nutrition Education•Disease / Case Management•Coordination of Services
108
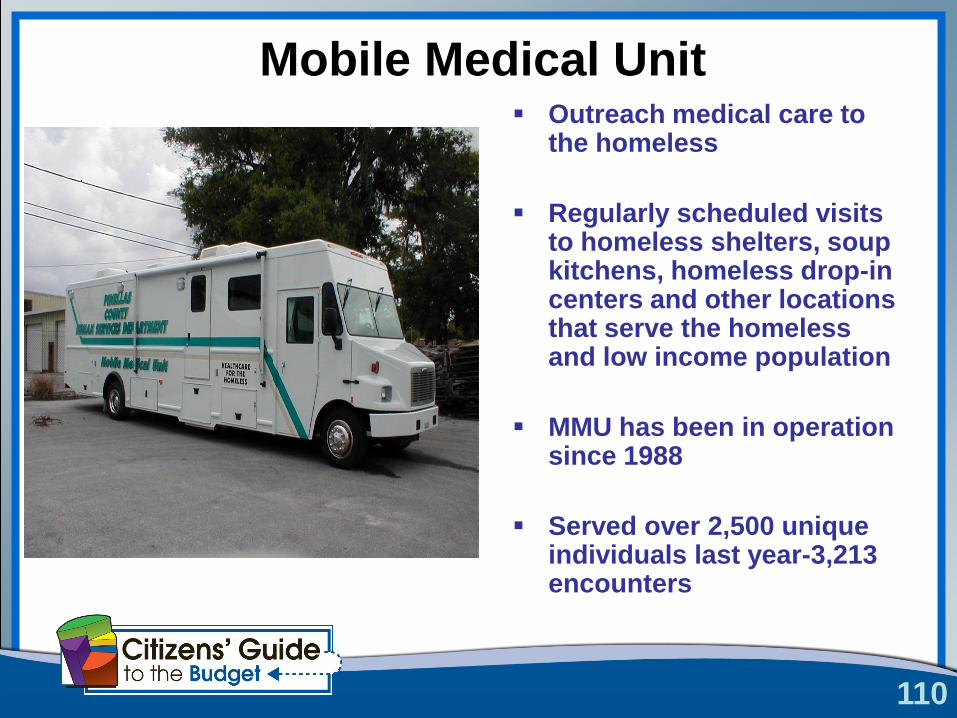
Mobile Medical Unit
110
Outreach medical care to the homeless
Regularly scheduled visits to homeless shelters, soup kitchens, homeless drop-in centers and other locations that serve the homeless and low income population
MMU has been in operation since 1988
Served over 2,500 unique individuals last year-3,213 encounters
Mobile Medical Unit
Homelessness/
Self-Sufficiency
111
Homelessness/Self-Sufficiency
Goals
Prevent and Reduce Homelessness
Increase Self-Sufficiency
112
113
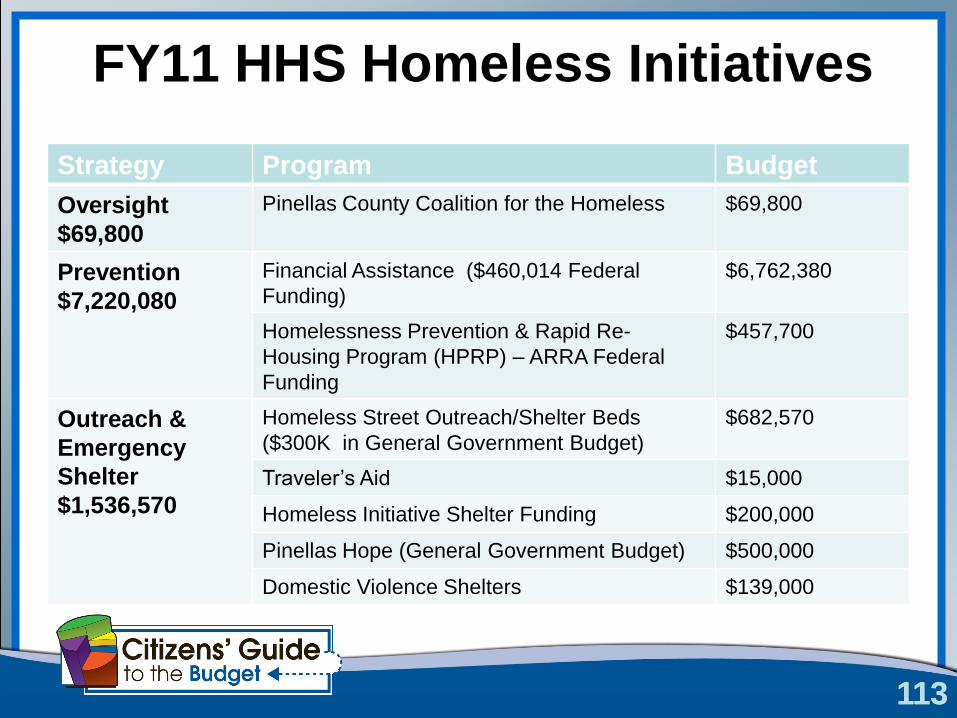
FY11 HHS Homeless Initiatives
Strategy Program Budget
Oversight
$69,800
Pinellas County Coalition for the Homeless $69,800
Prevention
$7,220,080
Financial Assistance ($460,014 Federal
Funding)
$6,762,380
Homelessness Prevention & Rapid Re-
Housing Program (HPRP) – ARRA Federal
Funding
$457,700
Outreach &
Emergency
Shelter
$1,536,570
Homeless Street Outreach/Shelter Beds
($300K in General Government Budget)
$682,570
Traveler’s Aid $15,000
Homeless Initiative Shelter Funding $200,000
Pinellas Hope (General Government Budget) $500,000
Domestic Violence Shelters $139,000
113
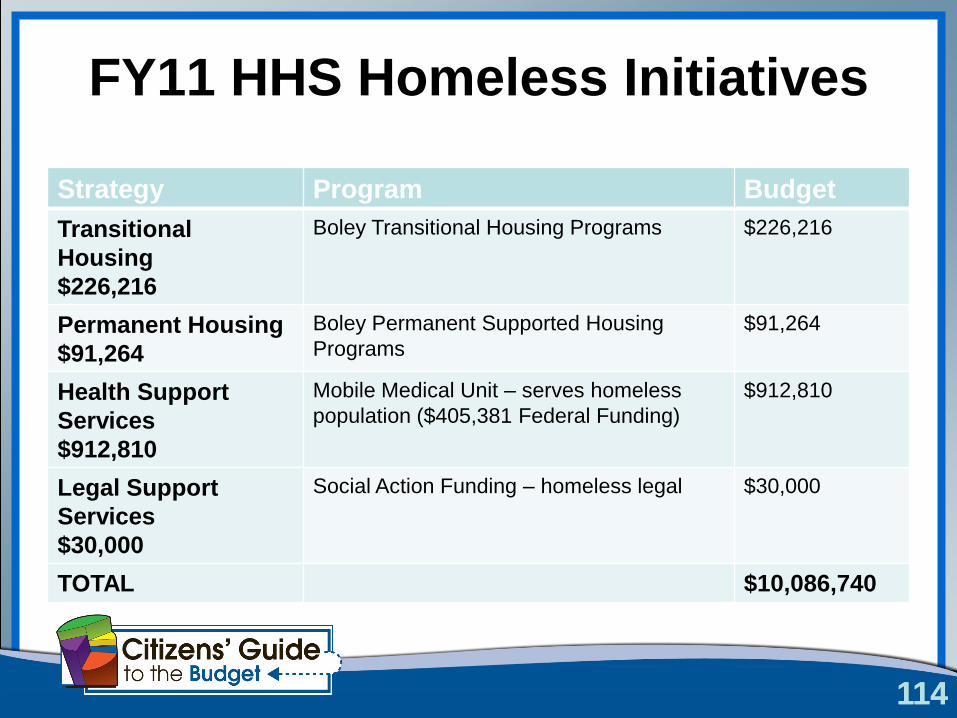
FY11 HHS Homeless Initiatives
Strategy Program Budget
Transitional
Housing
$226,216
Boley Transitional Housing Programs $226,216
Permanent Housing
$91,264
Boley Permanent Supported Housing
Programs
$91,264
Health Support
Services
$912,810
Mobile Medical Unit – serves homeless
population ($405,381 Federal Funding)
$912,810
Legal Support
Services
$30,000
Social Action Funding – homeless legal $30,000
TOTAL $10,086,740
114114
Financial Assistance for
Disabled Persons
Serving 600 disabled residents per month
3-Track System
Vocational Training/Job Placement
Disability Advocacy for SSI/SSD benefits
Last year recouped $3.2 M in SSI
reimbursements
115
Homelessness Prevention &
Rapid Re-Housing Program
Income below 50% Area Median Income
62% of households served were families with
minor children
ARRA funded, ending April 2011
Served 1,759 people and 674 households
75% remain housed after 6 months
116
Family Homelessness
Prevention
Financial Assistance to low-income families
with children
Enhancement of Emergency Assistance
Program – Began February 2011
Program in response to dramatic increase in
homeless families
In coordination with the HLN Families and
Unaccompanied Youth Subcommittee
117

Veterans Services
118
Veterans Services
Provides assistance to Pinellas County
veterans and their families in obtaining VA
monetary benefits and health services
101,000 veterans in Pinellas County
640 Veterans Services customers awarded
new monetary benefits annually
Generates over $9M in new VA revenue to
County citizens annually (FY 2010) - increase
of $1M over 2009
119
120
Community Funding/
Coordination of Services
Funding to non-profits providing health and
human services to county residents
Social Action Funding
2-1-1 Tampa Bay Cares Information and
Referral Services
Technology Grant created open, shared
TBIN system
121
State Mandated Funding
County matching share of Florida Medicaid
Program (inpatient hospital and nursing
home) – $9,500,000
County matching share of State of Florida
contracts for Mental Health/Substance
Abuse services (includes Baker Act) -
$2,174,710
Health Care Responsibility Act - $450,000
Disposition of Bodies - $280,000
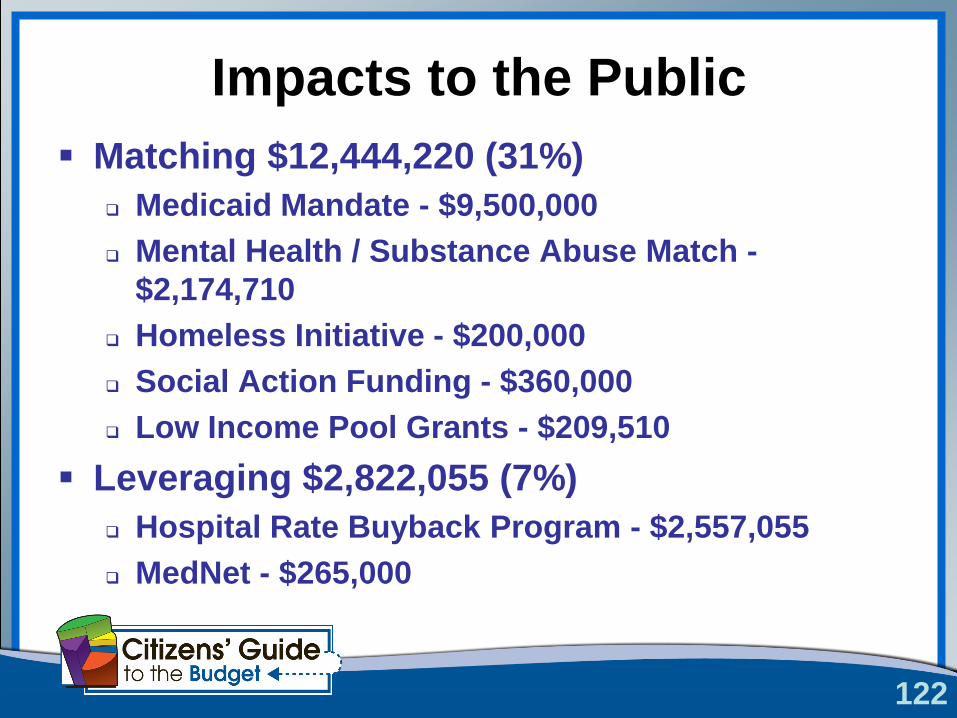
Impacts to the Public
Matching $12,444,220 (31%)
Medicaid Mandate - $9,500,000
Mental Health / Substance Abuse Match -
$2,174,710
Homeless Initiative - $200,000
Social Action Funding - $360,000
Low Income Pool Grants - $209,510
Leveraging $2,822,055 (7%)
Hospital Rate Buyback Program - $2,557,055
MedNet - $265,000
122
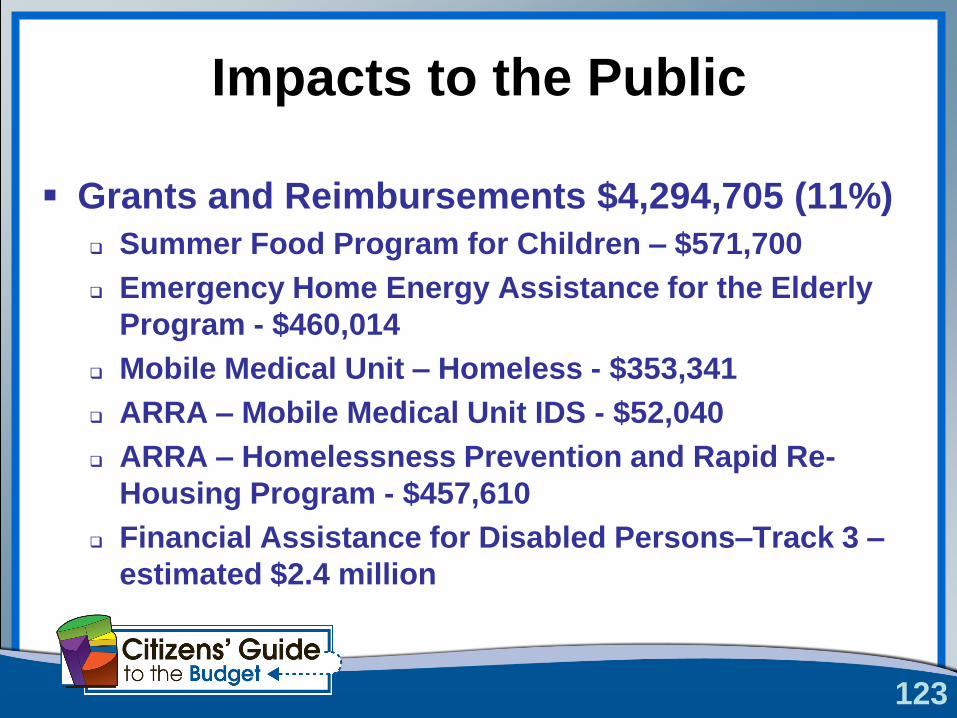
Impacts to the Public
Grants and Reimbursements $4,294,705 (11%)
Summer Food Program for Children – $571,700
Emergency Home Energy Assistance for the Elderly
Program - $460,014
Mobile Medical Unit – Homeless - $353,341
ARRA – Mobile Medical Unit IDS - $52,040
ARRA – Homelessness Prevention and Rapid Re-
Housing Program - $457,610
Financial Assistance for Disabled Persons–Track 3 –
estimated $2.4 million
123
124
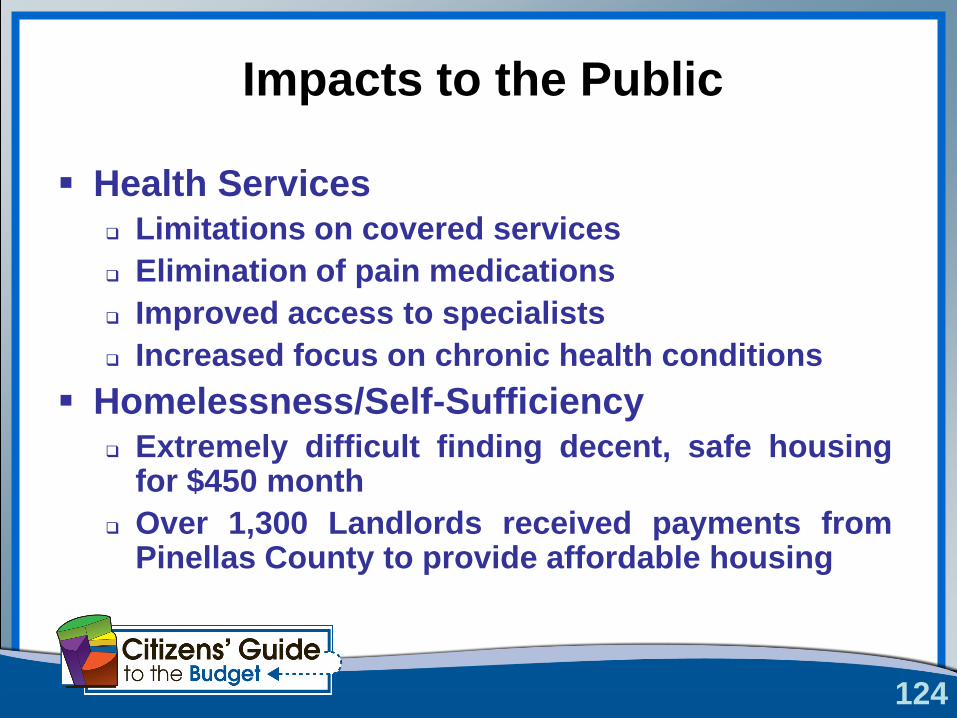
Impacts to the Public
Health Services Limitations on covered services
Elimination of pain medications
Improved access to specialists
Increased focus on chronic health conditions
Homelessness/Self-Sufficiency Extremely difficult finding decent, safe housing
for $450 month
Over 1,300 Landlords received payments fromPinellas County to provide affordable housing
125
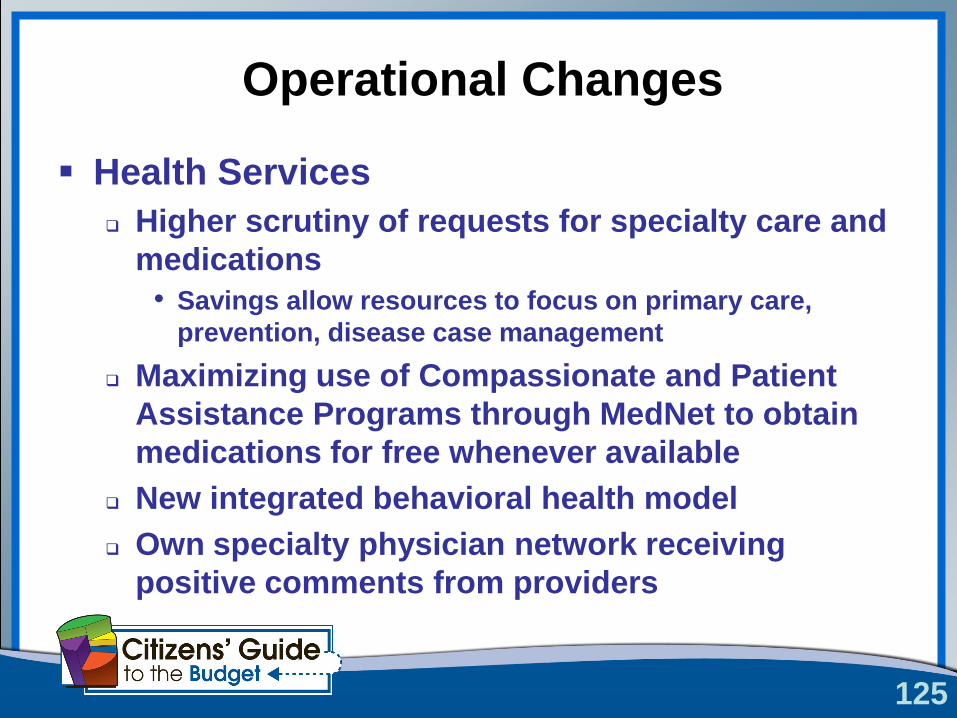
Operational Changes
Health Services
Higher scrutiny of requests for specialty care and
medications
• Savings allow resources to focus on primary care,
prevention, disease case management
Maximizing use of Compassionate and Patient
Assistance Programs through MedNet to obtain
medications for free whenever available
New integrated behavioral health model
Own specialty physician network receiving
positive comments from providers
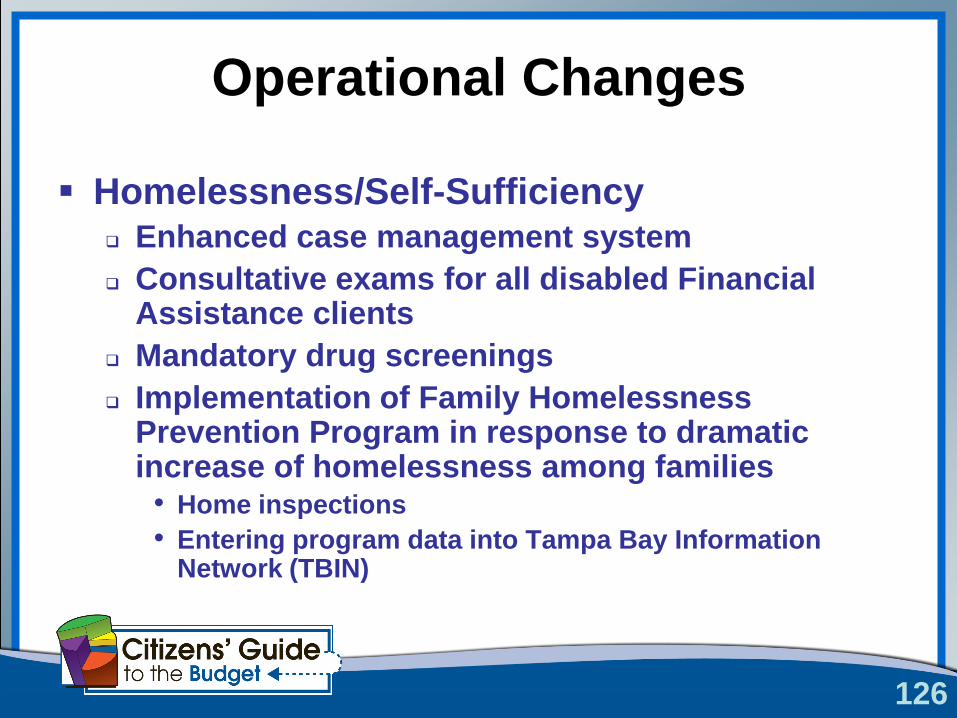
Operational Changes
Homelessness/Self-Sufficiency Enhanced case management system
Consultative exams for all disabled Financial Assistance clients
Mandatory drug screenings
Implementation of Family Homelessness Prevention Program in response to dramatic increase of homelessness among families
• Home inspections
• Entering program data into Tampa Bay Information Network (TBIN)
126
127
Challenges & Lessons Learned
Stay current with best practice research
Moving from a sick model to a prevention
model
Shift from a network model to “systems” of
care
Increased focus on outcomes has created
more efficient and effective programs
128
Potential Impacts
Affordable Care Act Preparing clients for transition to Medicaid in
2014
Medicaid Reform What will the impact be on counties?
HEARTH Act Future funding based on performance of entire
community homeless services system
Public WorksPete Yauch
130
Public Works
Engineering and Environmental Services
Merged engineering functions of Public Works, Utilities,
and Environmental Management
Includes Program Planning, Asset Management, Design,
Surveying, and Construction of major infrastructure
projects
Operations
Maintenance and operation of major infrastructure and
programs
Transportation
Design, maintenance, and operation of traffic management
facilities
131
Public Works - Engineering and
Environmental Services CIP & Planning Division
Programmatic planning for implementation
of the Capital Improvement Program
Asset Management
Stormwater Planning
Geographic Information Systems - Interface
Design Division
Engineering and design of roadways and
intersections; stormwater drainage systems (pipes
and open channels); ponds (water quality and flood
control); sidewalks and ADA features; utilities
(water and sewer facilities and lines); bridges; and
other structures.
Coordination and resolution of project related Haz-
Mat issues
Environmental permitting
132
Public Works - Engineering and
Environmental Services Construction and Development
Review Division
Construction inspection and progress
tracking for construction projects
Review of private connections to
public infrastructure
Land Survey and Mapping
Division
Professional land survey, mapping,
and research services in support of
CIP and PW Operations, and multiple
other County departments
Maintains records and tracks County
owned parcels and provides
information to private surveyors
133
Public Works - Engineering and
Environmental Services Environmental Services Division
Coastal Management program oversees beach renourishment
Watershed Management program coordinates the planning and
implementation of projects for improving water quality
Hydrogeology program provides information to multiple County
departments
Coordinates NPDES permitting and compliance
134
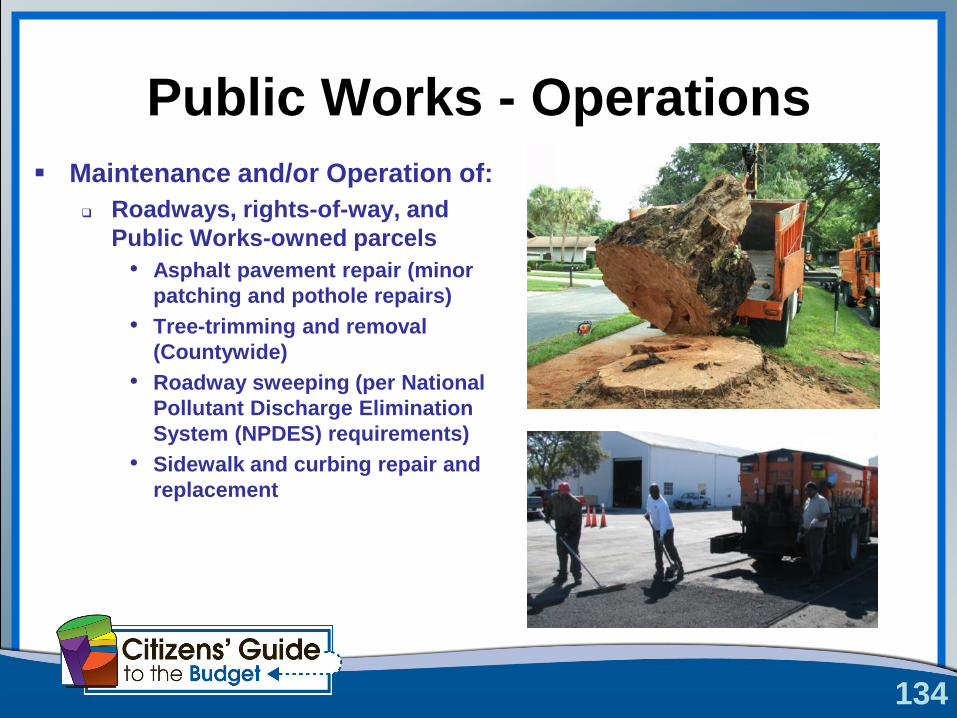
Public Works - Operations
Maintenance and/or Operation of:
Roadways, rights-of-way, and
Public Works-owned parcels
• Asphalt pavement repair (minor
patching and pothole repairs)
• Tree-trimming and removal
(Countywide)
• Roadway sweeping (per National
Pollutant Discharge Elimination
System (NPDES) requirements)
• Sidewalk and curbing repair and
replacement
135
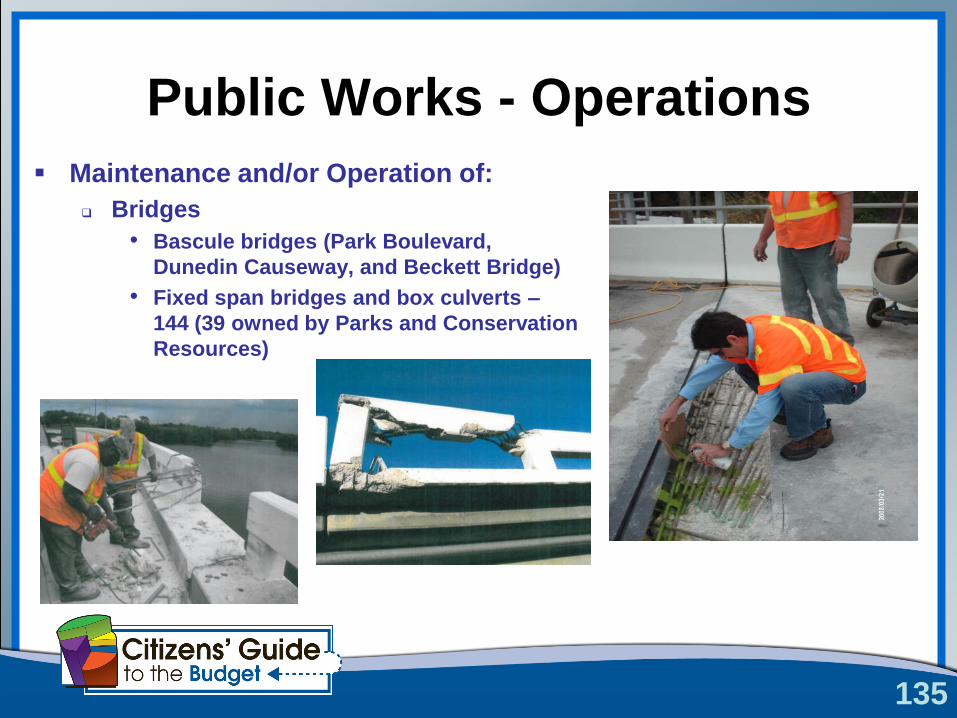
Public Works - Operations
Maintenance and/or Operation of:
Bridges
• Bascule bridges (Park Boulevard,
Dunedin Causeway, and Beckett Bridge)
• Fixed span bridges and box culverts –
144 (39 owned by Parks and Conservation
Resources)
136
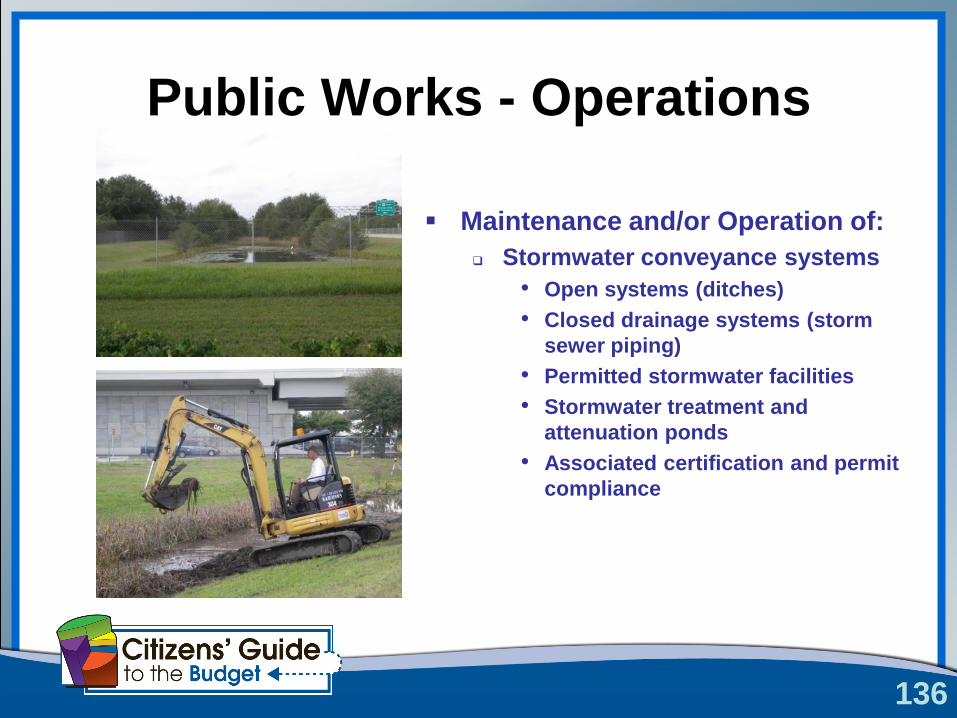
Public Works - Operations
Maintenance and/or Operation of:
Stormwater conveyance systems
• Open systems (ditches)
• Closed drainage systems (storm
sewer piping)
• Permitted stormwater facilities
• Stormwater treatment and
attenuation ponds
• Associated certification and permit
compliance
137
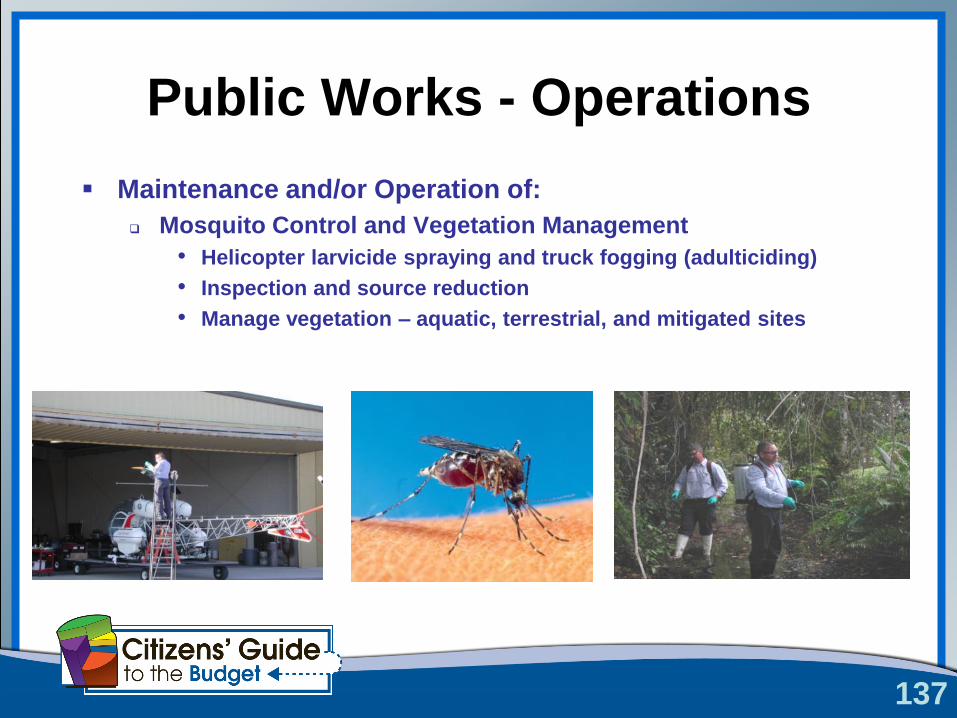
Public Works - Operations
Maintenance and/or Operation of:
Mosquito Control and Vegetation Management
• Helicopter larvicide spraying and truck fogging (adulticiding)
• Inspection and source reduction
• Manage vegetation – aquatic, terrestrial, and mitigated sites
138
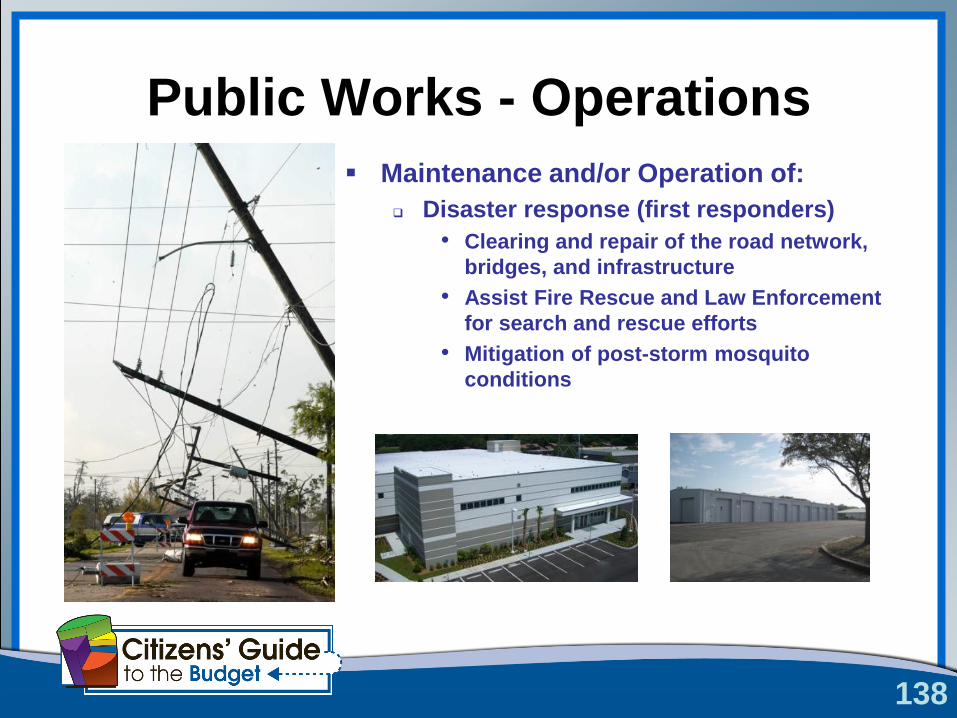
Public Works - Operations
Maintenance and/or Operation of:
Disaster response (first responders)
• Clearing and repair of the road network,
bridges, and infrastructure
• Assist Fire Rescue and Law Enforcement
for search and rescue efforts
• Mitigation of post-storm mosquito
conditions
139
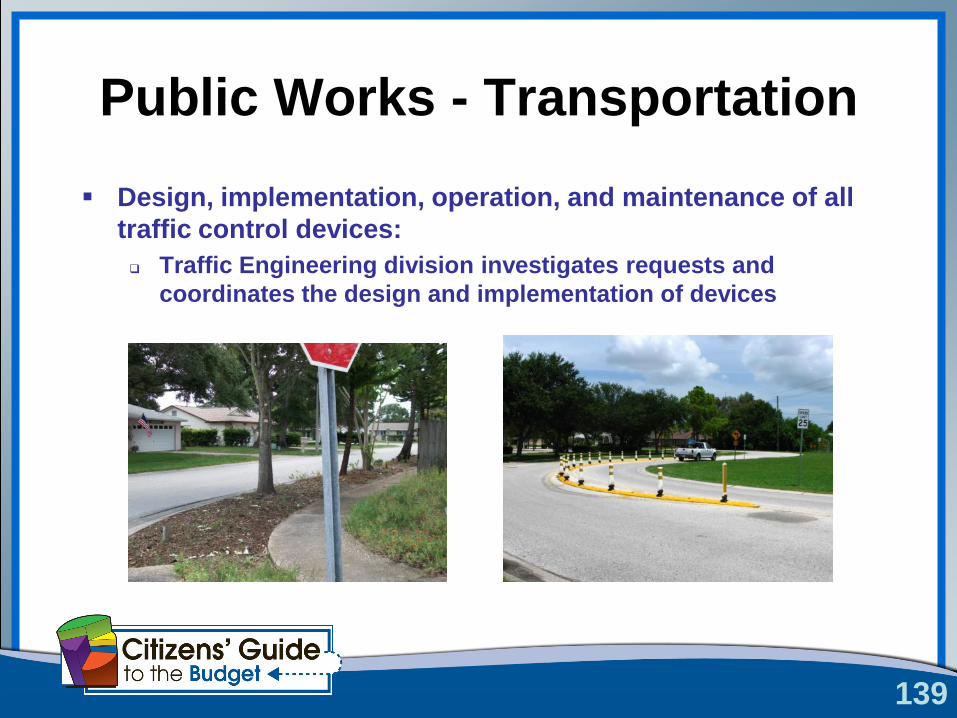
Public Works - Transportation
Design, implementation, operation, and maintenance of all
traffic control devices:
Traffic Engineering division investigates requests and
coordinates the design and implementation of devices
140
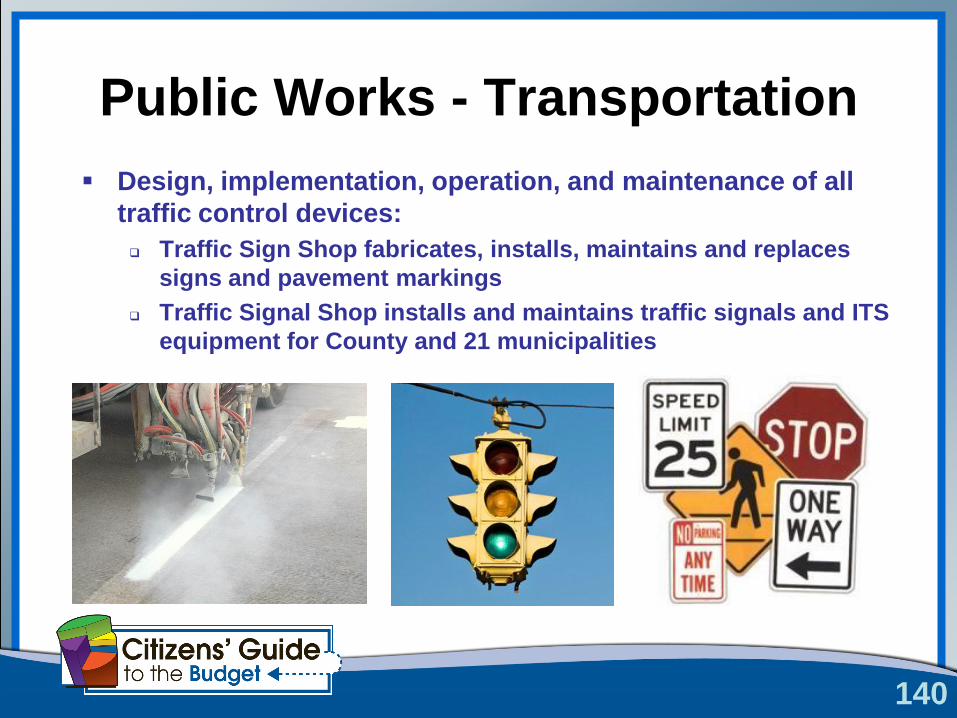
Public Works - Transportation
Design, implementation, operation, and maintenance of all
traffic control devices:
Traffic Sign Shop fabricates, installs, maintains and replaces
signs and pavement markings
Traffic Signal Shop installs and maintains traffic signals and ITS
equipment for County and 21 municipalities
141
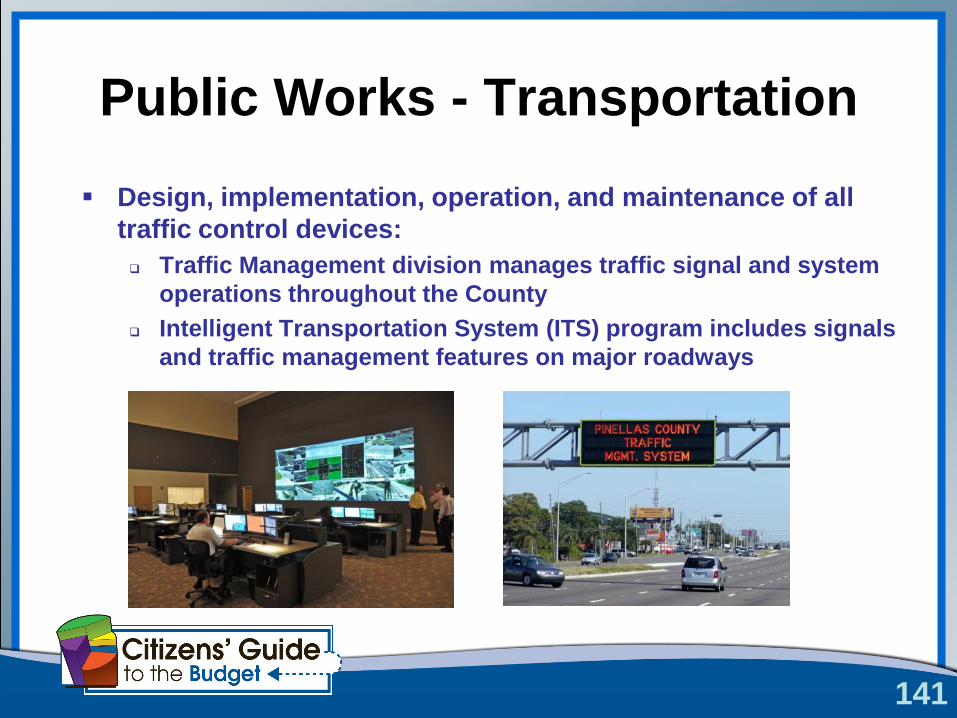
Public Works - Transportation
Design, implementation, operation, and maintenance of all
traffic control devices:
Traffic Management division manages traffic signal and system
operations throughout the County
Intelligent Transportation System (ITS) program includes signals
and traffic management features on major roadways
142
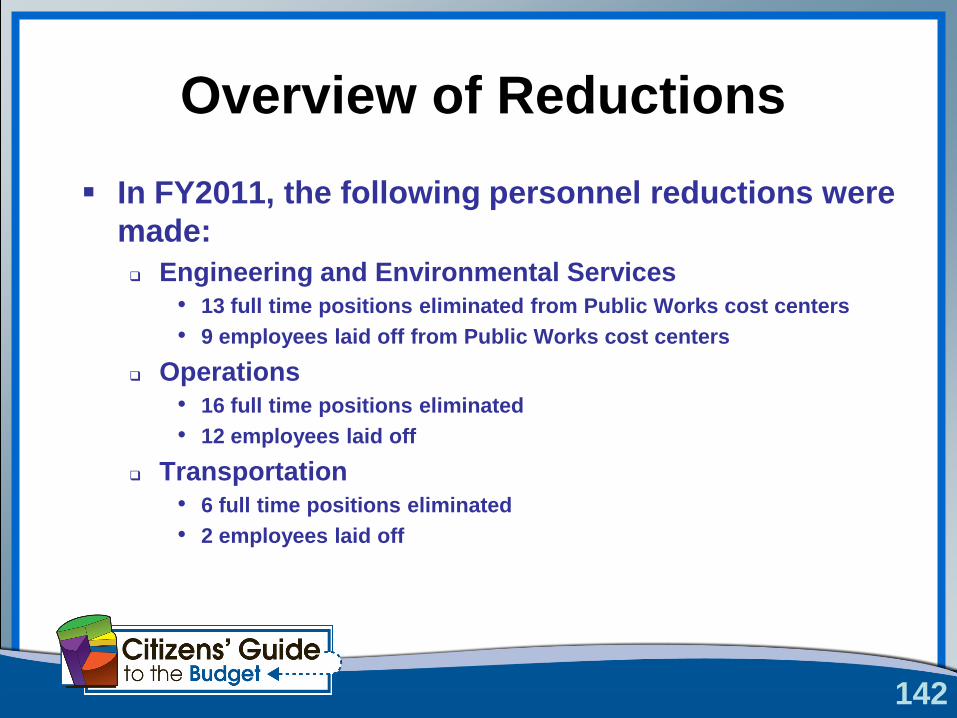
Overview of Reductions
In FY2011, the following personnel reductions were
made:
Engineering and Environmental Services
• 13 full time positions eliminated from Public Works cost centers
• 9 employees laid off from Public Works cost centers
Operations
• 16 full time positions eliminated
• 12 employees laid off
Transportation
• 6 full time positions eliminated
• 2 employees laid off
143
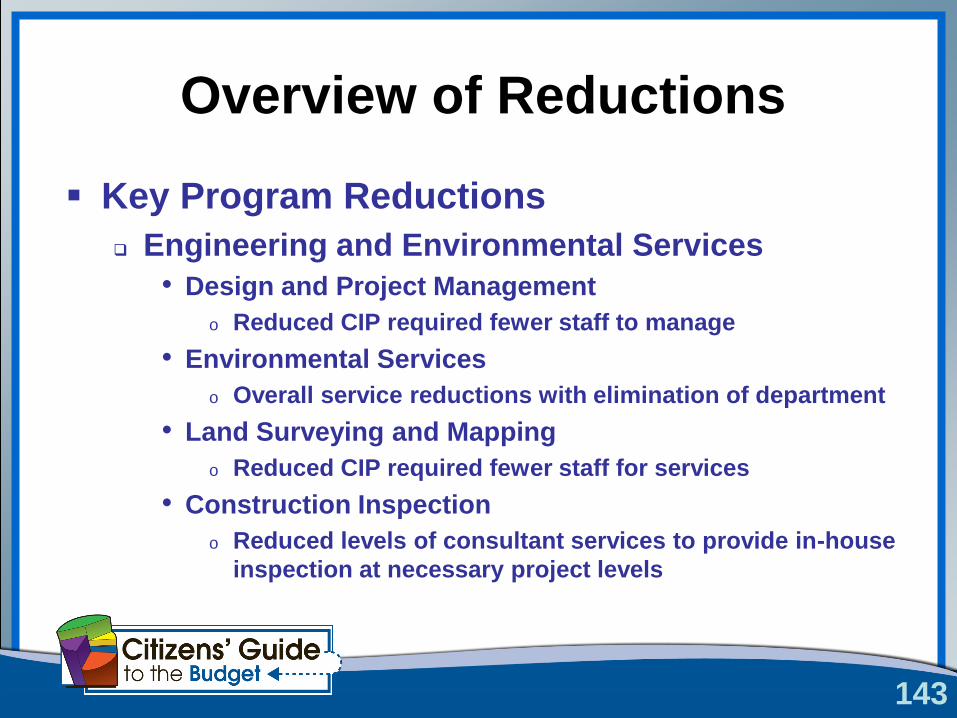
Overview of Reductions
Key Program Reductions
Engineering and Environmental Services
• Design and Project Management
o Reduced CIP required fewer staff to manage
• Environmental Services
o Overall service reductions with elimination of department
• Land Surveying and Mapping
o Reduced CIP required fewer staff for services
• Construction Inspection
o Reduced levels of consultant services to provide in-house
inspection at necessary project levels
144
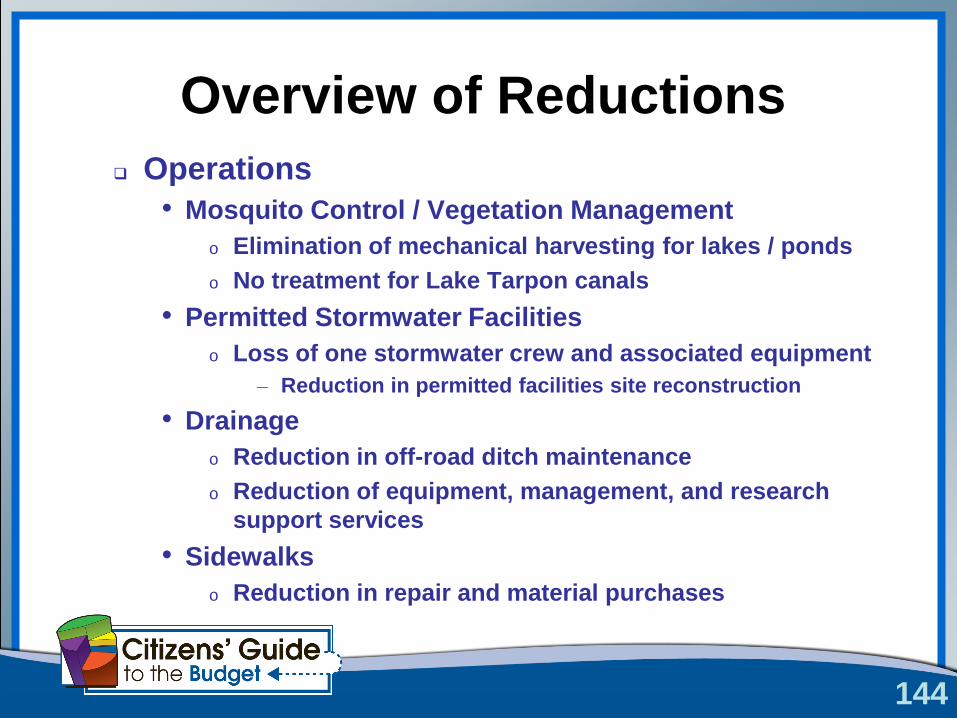
Overview of Reductions
Operations
• Mosquito Control / Vegetation Management
o Elimination of mechanical harvesting for lakes / ponds
o No treatment for Lake Tarpon canals
• Permitted Stormwater Facilities
o Loss of one stormwater crew and associated equipment
– Reduction in permitted facilities site reconstruction
• Drainage
o Reduction in off-road ditch maintenance
o Reduction of equipment, management, and research
support services
• Sidewalks
o Reduction in repair and material purchases
145
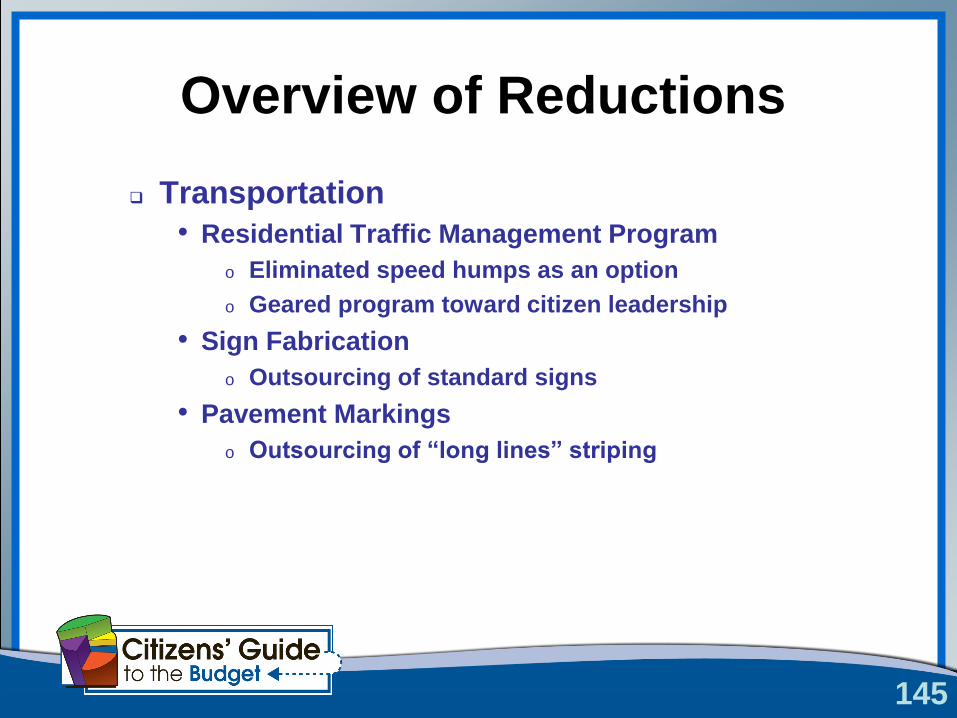
Overview of Reductions
Transportation
• Residential Traffic Management Program
o Eliminated speed humps as an option
o Geared program toward citizen leadership
• Sign Fabrication
o Outsourcing of standard signs
• Pavement Markings
o Outsourcing of “long lines” striping
146
Key Programs & Service Levels
CIP – Supporting Services
Planning, design, and construction inspection of capital
improvement projects in the transportation and stormwater
fields. Funded through the General Fund with partial
reimbursement from the associated Capital Fund
The current service level has reduced proportionally with
the reduction in the CIP. Production schedules are being
maintained for the projects still funded within the CIP.
Major projects currently in progress include:
• Keystone Road – US 19 to East Lake Road - $ 31.6 M
• Bryan Dairy Road – 72nd Street to Starkey Road - $ 11.6 M
• McMullen-Booth Road Improvements - $ 2.5 M
• Bear Creek Channel Improvements - $ 3.1 M
147
Key Programs & Service Levels
CIP – Supporting Services
Additional projects currently in progress include:
• 54th Avenue at 28th Street Safety Improvements - $ 1.6 M
• Dansville Area Phase III - $ 2.1 M
• Fort DeSoto – Rehabilitation of Fort - $ 1.1 M
• ADA, Sidewalk, Drainage and Roadway Improvements - $ 3.6 M
• Sidewalk Repair and ADA Ramps - $ 600 K
• General Bridge Repair - $ 1.8 M
• Pavement Preservation - $ 5.6 M
• La Plaza Avenue Bridge Replacement - $ 1.5 M
• Beckett Bridge Repairs - $ 363 K
148
Key Programs & Service Levels
Watershed Management
Planning, design, implementation, and monitoring of the
multiple stormwater basins / watersheds and coastal
waters throughout the County. Funded through the General
Fund.
With the reorganization of the Environmental Management
Department into multiple larger departments, and staff
reductions, service levels have dropped significantly.
• Support for other environmental functions in other departments
reduced.
• In order to accomplish necessary services, outsourcing is required.
• Upcoming water quality regulations will add to burden.
149
Key Programs & Service Levels
Permitted Facilities
Management, maintenance, and certification of permitted
stormwater facilities, such as ponds. Funded through the
General Fund.
Reduced level of service to provide minimum levels
necessary to maintain functionality and acceptance under
NPDES permitting.
Internal certification now performed by administrative
engineering staff instead of specialized engineer.

150
Key Programs & Service Levels
Mosquito Control
A multifaceted approach to the elimination of mosquitoes,
including the identification and mitigation of potential
breeding grounds; application of larvicides and adulticides;
and monitoring of potential diseases carried by mosquitoes.
Funded by General Fund and small state grant.
The proactive public education component of the program
was eliminated; program information is now distributed
through press releases or by field technicians.
Level of service represents the public health concerns of
mosquitoes:
• Known breeding sites are inspected weekly
• Service requests are responded to within one business day.
151
Key Programs & Service Levels
Response and Roadway Maintenance
This program provides for the unscheduled maintenance of
roadway and infrastructure, typically in response to a
citizen complaint.
Funded through Transportation Trust Fund
• Department provides an immediate response to an emergency to
“safe-up” the area.
• Initial contact to citizen within 48 hours of a complaint.
152
Key Programs & Service Levels
Drainage and Stormwater
Responsible for the maintenance of stormwater flow –
inlets, ditches, pipes and culverts – to reduce flooding.
Funded through General Fund and Transportation Trust
Fund.
• Geographic districts consolidated into a single division to reduce
administrative costs.
o Southwest maintenance yard in Largo considered for surplus
o Permitted Facilities yard in Pinellas Park considered for surplus
o North maintenance yard in Palm Harbor being maintained as remote
reporting site
• Street sweeping cycles reduced to permit minimums
o In-house costs for sweeping remain lower than contract amounts for same
service (less than $ 21 versus $ 26 per curb mile)
• Ditch cleaning cycles reduced from 4 times a year to 3 times a year.
153
Key Programs & Service Levels
Bridge Maintenance Responsible for the operation and cyclic preventative
maintenance of over 100 bridges (including culverts and single
span bridges) throughout the County.
Funded through Transportation Trust Fund.
Structural inspections are necessary on a regular basis;
contractual services for inspections were reduced and picked up
by county staff.
Drawbridge tending services are contracted for Park Boulevard
and Dunedin Causeway bridges; Beckett Bridge is opened by staff
when requested in advance.
No reductions in level of service.
154
Key Programs & Service Levels
Urban Forestry Division responsible for tree trimming and removal countywide.
Funded through Transportation Trust and General Fund.
Function consolidated this past year with crews from Culture,
Education and Leisure (now Conservation Resources)
Overall level of service increased to Parks and Conservation
Resources with scheduling of operations into a standard cycle.
155
Key Programs & Service Levels
Traffic Signs and Pavement Markings
Program includes the installation and maintenance of
traffic signs and markings
Funded by the Transportation Trust Fund
Sign fabrication has been limited to special signs for traffic
applications only.
• Standard signs procured from outside vendors
• Field maintenance of signs reduced
• Pavement marking cycles reduced.
156
Key Programs & Service Levels
Intelligent Transportation System (ITS)
Provides proactive management of major arterials –
adaptive traffic signal operations, real time motorist
information, and incident detection and confirmation.
Funded through the Ninth Cent motor fuels tax (within the
Transportation Trust Fund)
Operations and maintenance included in Ninth Cent plan –
system growth now requires additional staffing.
• Management has developed a proposal to shift ITS construction and
inspection tasks to new in-house staff instead of consultants; this will
allow funding of additional maintenance and operations staff without
increasing Ninth Cent demands.
157
Impacts to the Public
Service level reductions have resulted in impacts to
the public in multiple areas: Increased calls for sidewalk repair and replacement, roadway
repairs and resurfacing, and tree trimming.
Elimination of vegetation treatment on the Lake Tarpon canals has
impacted adjacent property owners by requiring residents to seek
vegetation control through their own methods and means.
Reductions in CIP has delayed multiple projects that had been
anticipated by the public.
Elimination of speed hump option has not been popular with
those requesting Residential Traffic Management programs.
Public Education in Mosquito Control has been reduced.
158
Operational Changes
Merger of Departments resulting in multiple
operational changes, extending over the next few
years
Engineering and Environmental Services
• Relocated Public Works Engineering staff from 440 Court
Street to Utilities Building at 14 S. Fort Harrison
• Five key functional areas:
o CIP and Planning
o Design
o Environmental Services
o Land Surveying and Mapping
o Construction Inspection
159
Operational Changes
Department mergers being guided by consultant to identify and
define organizational, operational, financial, and cultural issues• Overall organizational structure – department, division, section, etc.
• Operational functions and where best to locate these functions within the
organization, with consideration toward efficiency and effectiveness through
consolidation
• Addressing the financial tracking issues of a mega-department working in
multiple funds, including three enterprise funds.
• Merging three organizations with widely different cultures into a single
organization.
Management Council and Transition Team established, with
representation from all the major areas of the merging
departments• Group participation to encourage open communications and team building on
issues
• Subcommittees assigned for specific tasks
• Coordinating team developed to work with consultant on strategic issues
160
Operational Changes
Reduced capital program funding and strategy has impacted
project delivery Extended project schedules to accommodate “pay-as-you-go” cash flow limitations
Delayed / deferred lower priority projects
Modified project scopes to reduce project costs
Engineering consultants filling in gaps created by staff reductions Less in-house design capabilities, from both technical and capacity standpoints
Organizational changes in Operations Mowing transferred to Parks and Conservation Resources
Urban Forestry transferred from Parks and Conservation Resources
Consolidation of Permitted Stormwater Facilities and Drainage Maintenance into
single countywide program area (Stormwater Maintenance)
Traffic Sign shop and Traffic Signal shop field crews share resources
for larger tasks
161
Operational Changes
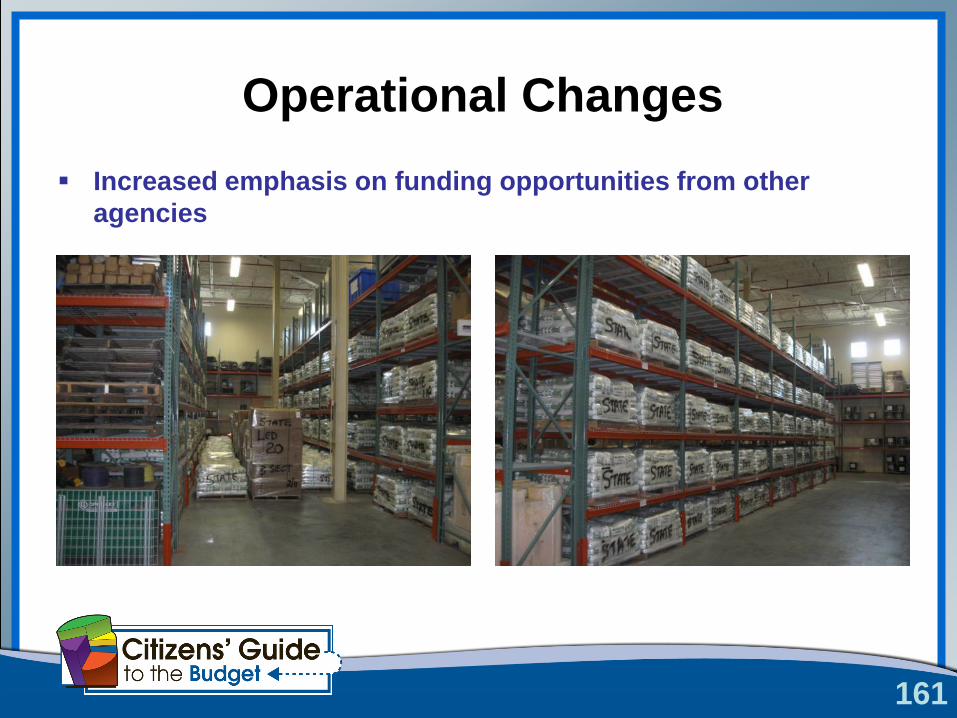
Increased emphasis on funding opportunities from other
agencies
162
Operational Changes
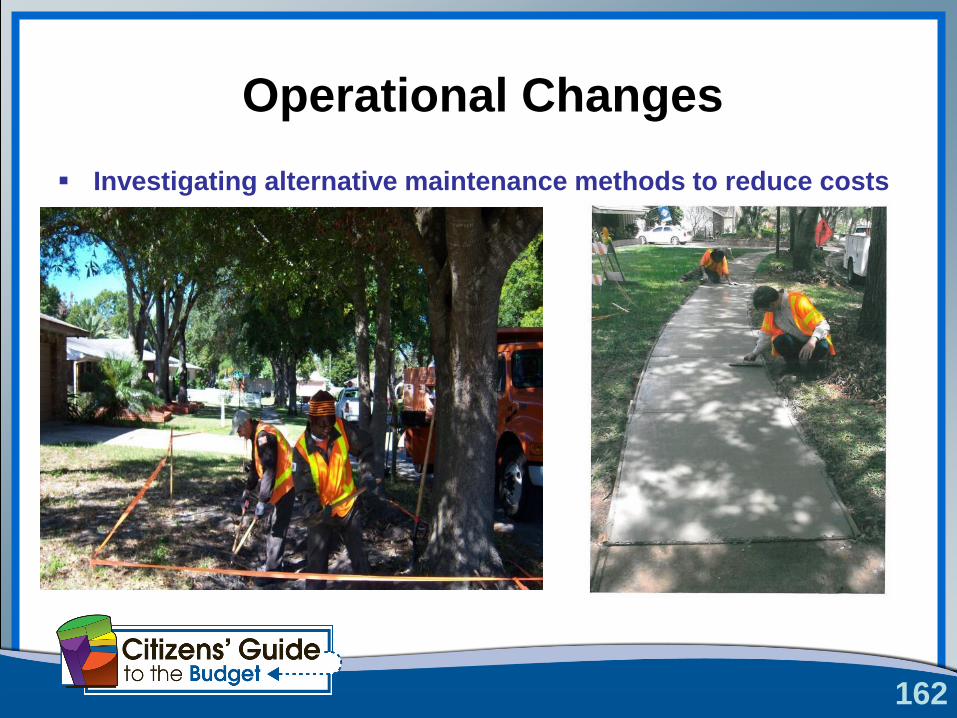
Investigating alternative maintenance methods to reduce costs
163
Challenges & Lessons Learned
Challenges
The reduction in Planning Department staff has resulted
in individual departments having to review and respond
on annexation requests directly to the municipality –
there is no coordinated response.
Loss of access to resources and expertise in Watershed
Management due to reductions and decentralization of
Environmental Management.
Accelerated department restructuring and continued
consolidations have been necessary without the benefit
of adequate time for planning efforts
164
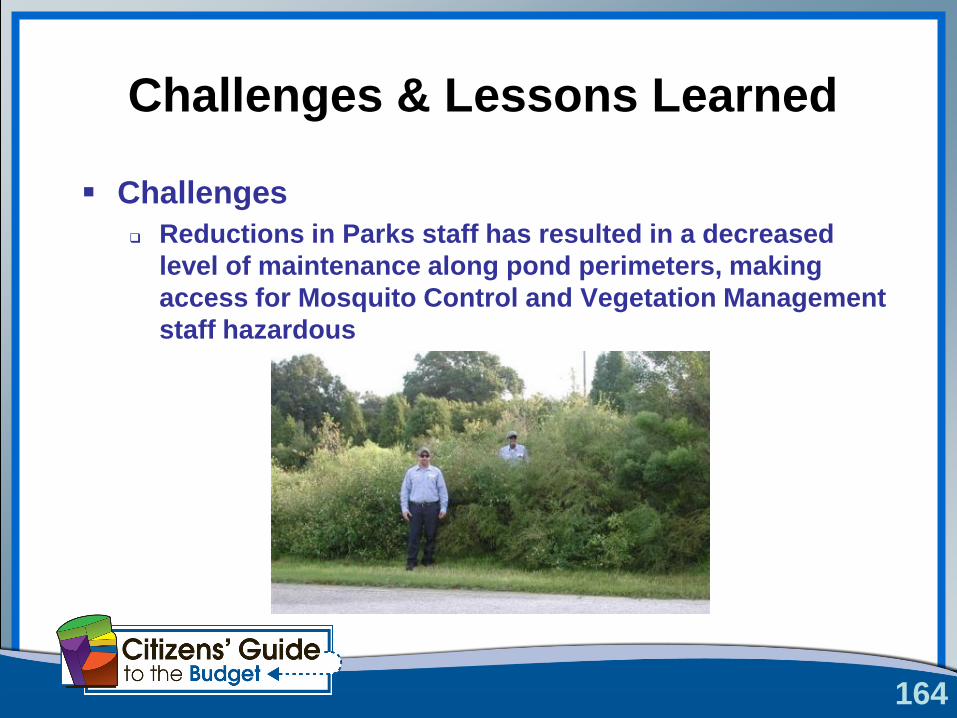
Challenges & Lessons Learned
Challenges
Reductions in Parks staff has resulted in a decreased
level of maintenance along pond perimeters, making
access for Mosquito Control and Vegetation Management
staff hazardous
165
Challenges & Lessons Learned
Challenges Critical need for cross training of remaining staff to ensure
versatility
Loss of opportunities for incentives to attract and retain staff
and continue succession management
Maintaining adequate staffing for emergency response to
disasters
Continued reductions in support areas (administrative and
supervisory) have increased the day-to-day challenges of
providing core services and implementing new County
initiatives
166
Challenges & Lessons Learned
Lessons Learned In-house design staff is more responsive and efficient than
engineering consultants for smaller projects
Proactive public communications helps deflect the criticism of
delayed projects
Versatility of staff is critical for organization consolidation
Existing work management tools and processes have proved
essential in improving productivity and service levels
Last year‟s revisions to the layoff and bumping process led to
the retention of best qualified employees and better addressed
the organizational needs of the department.
167
Potential Impacts
Upcoming revisions to water quality regulations will have a
significant financial impact on Pinellas County
National Pollutant Discharge Elimination System (NPDES)
Total Maximum Daily Loads, or TMDLs
Regulatory Reform Act could impact stormwater regulations
and wetland protection
Reductions to the Stormwater Program will require pond site
reconstruction to be transferred to the Capital Improvement
Program.
Legislation to override fertilizer ordinance and remove septic
tank inspection requirements will increase costs of
improving water quality
168
Potential Impacts
Loss of congressional appropriations for beach nourishment
would significantly impact the coastal management program
Impacts to tourism
Greater risk to storm damage
Traffic sign and marking reflectivity standards are being
increased
County proactively upgraded to sign standards and is in
compliance with new standards
Pavement marking standards are being modified and
may require more frequent application of materials.
169
Potential Impacts
Bridge Maintenance program is under-funded; bridge issues
become CIP-funded projects to repair, rather than addressed
through preventative maintenance
Any reduction in traffic enforcement efforts or the school
crossing guard program will likely increase requests for
assistance from Traffic Engineering and may have an impact
on public safety

UtilitiesKevin Becotte
171
Utilities
Utilities consists of three enterprise
funds and is organized and
operates as a business.
172172
Utilities
Utilities provides four Core Products and Services to
its customers.
The Products are Potable Water and Reclaimed
Water.
The Services are Wastewater and Solid Waste.
Revenue is primarily from rates and fees.
173
Utilities
Costs are controlled and reduced through:
Staff effort,
Performance measures,
Process improvement,
Grant acquisition, and
Budget reductions.
174
Overview of Reductions
Operating and Maintenance Budget reductions
for FY10/11:
Water – Reduced $4.8 million
Sewer – Reduced $1.9 million
175175
Overview of Reductions
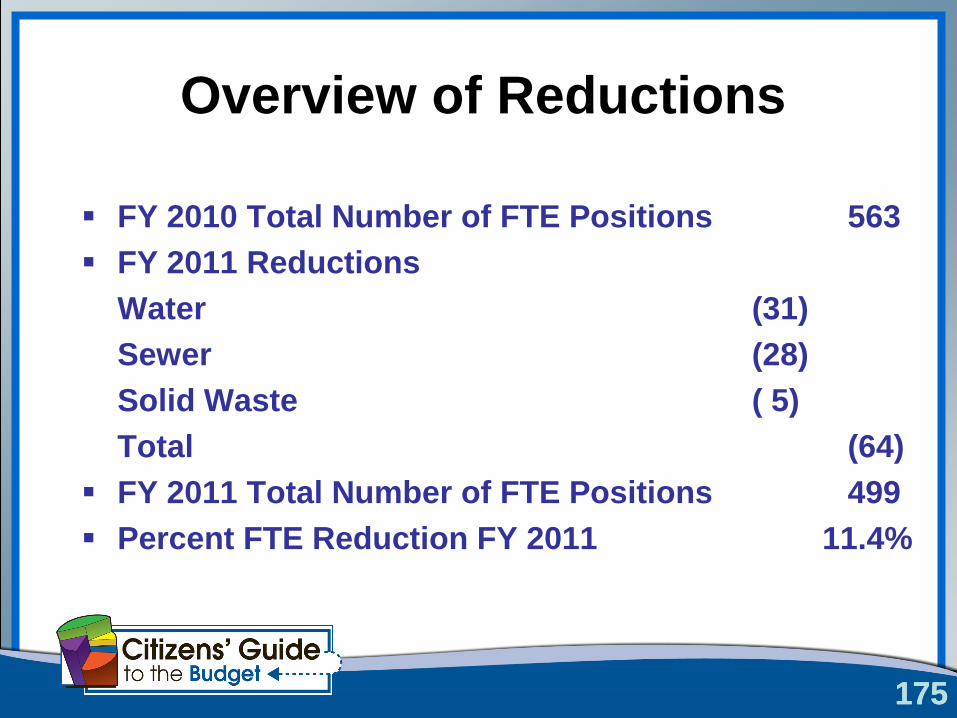
FY 2010 Total Number of FTE Positions 563
FY 2011 Reductions
Water (31)
Sewer (28)
Solid Waste ( 5)
Total (64)
FY 2011 Total Number of FTE Positions 499
Percent FTE Reduction FY 2011 11.4%
176
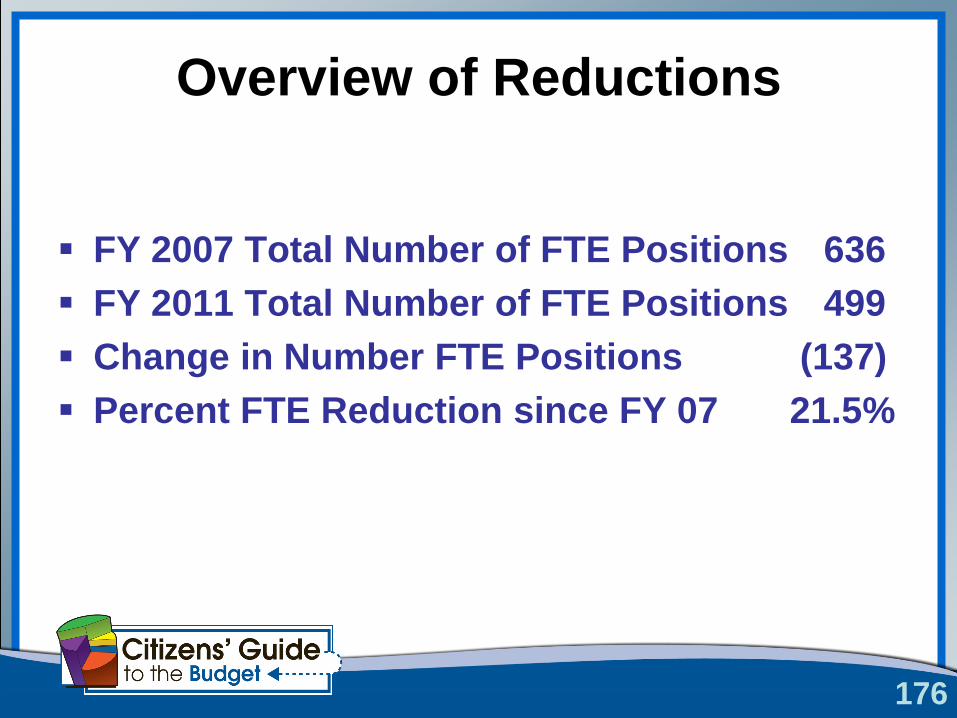
Overview of Reductions
FY 2007 Total Number of FTE Positions 636
FY 2011 Total Number of FTE Positions 499
Change in Number FTE Positions (137)
Percent FTE Reduction since FY 07 21.5%
177177
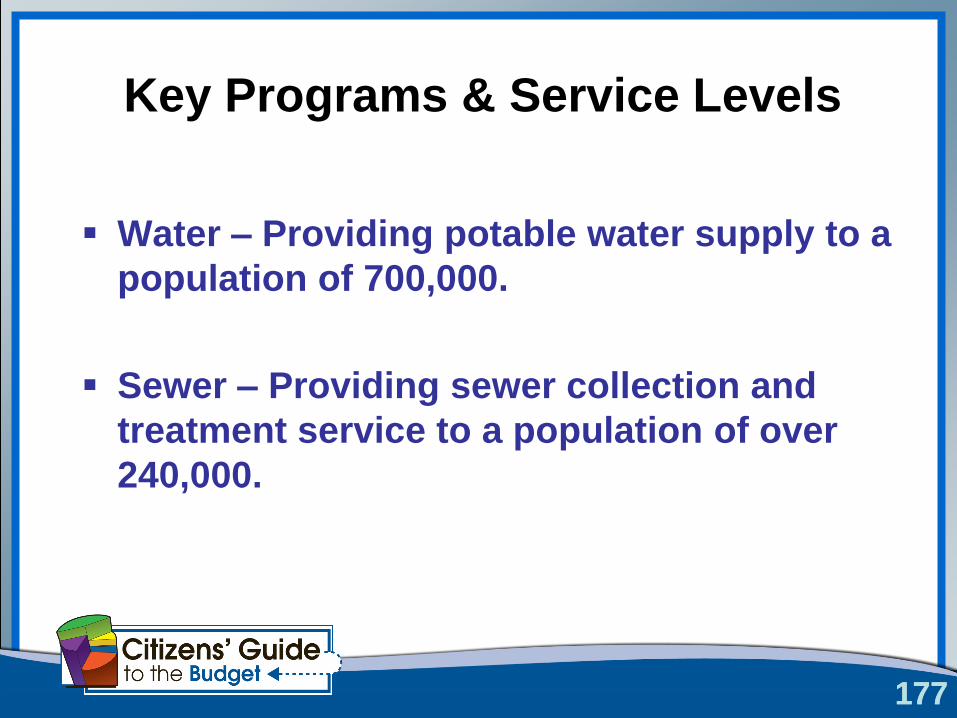
Key Programs & Service Levels
Water – Providing potable water supply to a
population of 700,000.
Sewer – Providing sewer collection and
treatment service to a population of over
240,000.
178
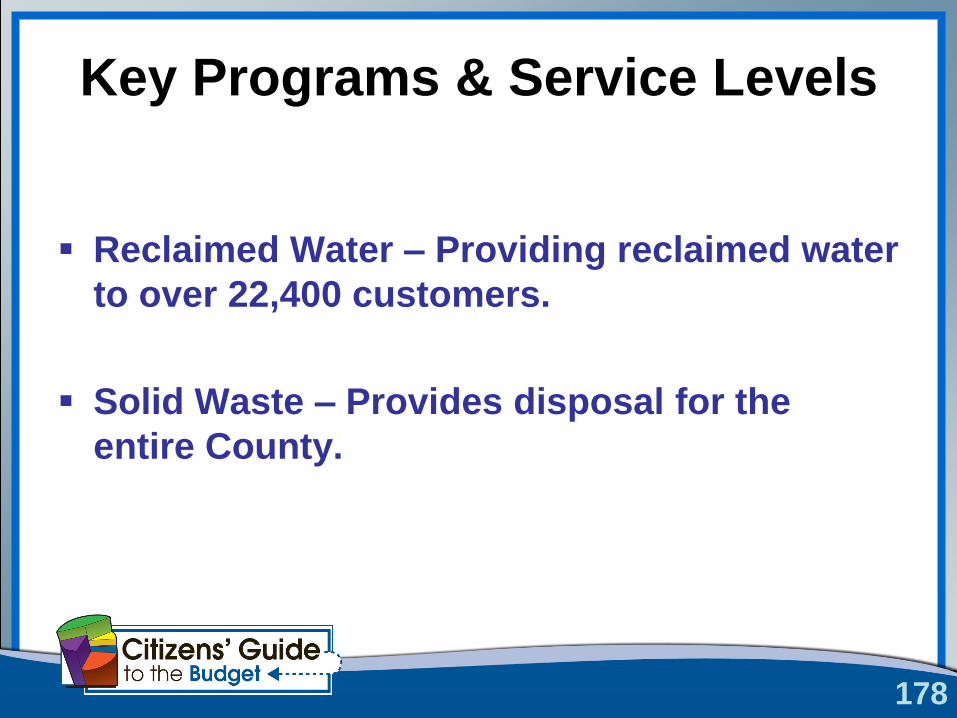
Key Programs & Service Levels
Reclaimed Water – Providing reclaimed water
to over 22,400 customers.
Solid Waste – Provides disposal for the
entire County.
179179
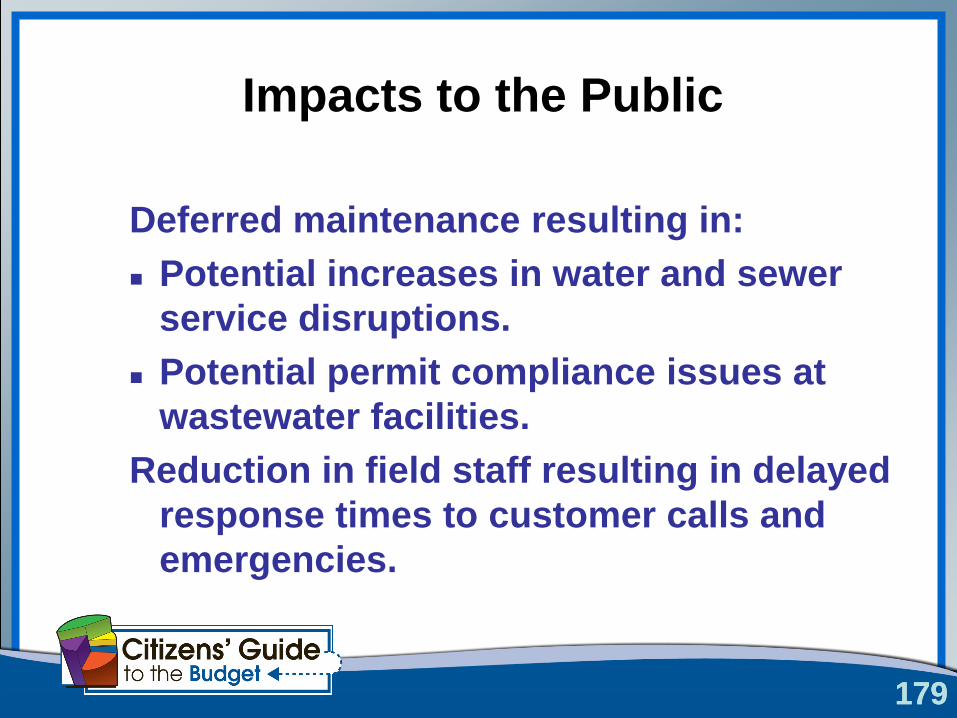
Impacts to the Public
Deferred maintenance resulting in:
Potential increases in water and sewer
service disruptions.
Potential permit compliance issues at
wastewater facilities.
Reduction in field staff resulting in delayed
response times to customer calls and
emergencies.
180
Impacts to the Public
Elimination of conservation rebate programs.
Concern over increasing rates and fees.
Longer customer service phone wait times
and increasing dropped calls.
181181
Operational Changes
Operations and Laboratory departments
combined.
Customer Services department revenue and
billing section moved to Finance.
Remainder of Customer Service combined
with Conservation department.
182
Operational Changes
Increased overtime charges due to staff
reductions.
Reduction in administrative and technical
support staff shifted workload to the
operating departments.
183
Operational Changes
Deferred maintenance of pipelines and
facilities.
Sewer TV and Cleaning (6 yrs to 9 yrs)
Water meter replacement program (on-hold)
Developing technology to work smarter.
Maximo (Asset Management)
SAP/CIS (Customer information and billing)
184184
Challenges & Lessons Learned
The delivery of utility products and services
is vital to public health and economy and
must continue 24/7.
Ensuring adequate funding to operate and
maintain assets is the most significant
challenge.
185
Challenges and Lessons Learned
Uncontrollable cost increases for:
chemicals,
electricity and
water purchase from TBW.
186
Challenges and Lessons Learned
Increased cost due to flow reductions resulting
from:
Loss of wholesale customers,
Conservation,
Reuse,
Vacancies and
the Economy.
187
Challenges and Lessons Learned
Solid Waste - Reduced electricity production
and revenue due to declining waste load at
the WTE facility.
188
Challenges and Lessons Learned
Cost control measures
Review products and services to establish
priority & reduce cost (clean-out program).
Streamline management, production and
delivery processes to reduce cost (TV/Clean,
Consolidation)
Asset management to control costs through
improved maintenance activity.
189
Challenges and Lessons Learned
Cost control measures (continued)
Reduce cost through goal based
performance improvement (Business Units)
Utilize strategic planning to better identify
and schedule expenditures (Tactical Budget)
Seek non-rate revenue sources such as
grants.
Utilize volunteers
190
Challenges and Lessons Learned
Budget related challenges
Maintenance schedules are being extended
increasing the risk of system failures.
Support staff reductions have shifted
workload to operating department staff
Tighter budgets with no capacity for
emergencies.
191
Challenges & Lessons Learned
Budget related challenges
Reduced technical training and professional
development.
Increased permit compliance issues due to
extended maintenance schedules
192192
Potential Impacts
Federal Numeric Nutrient Criteria may significantly
further restrict surface water discharge for:
wastewater treatment plants,
reclaimed water systems, and
Solid Waste facilities.
New permit conditions potentially require additional
Capital improvements and O&M funding.

Parks & Conservation
ResourcesPaul Cozzie
78
Parks & Conservation Resources
As a result of consolidation and merger of program functions in
FY 2011, the Culture, Education and Leisure Department became
the Parks & Conservation Resources Department. Programs
from the Department of Environmental Management (Air Quality
and Environmental Lands) and mowing functions from Public
Works and Utilities were reassigned to the renamed department.
The Cultural Affairs Division was eliminated from the department
with the intention of returning it to a 501(c)3 organization.
The department is now comprised of Parks & Environmental
Lands, County Extension, Natural & Historic Resource
Management, Horticulture Operations, Air Quality Division and
Marina Operations.
Parks & Conservation Resources Parks & Environmental Lands
Oversees the operations, maintenance and security of a regional and
community parks system, as well as the County‟s preserves and
management areas.
County Extension
In partnership with the University of Florida, Institute of Food and
Agricultural Sciences (IFAS), provides programming and information
in the areas of Commercial and Urban Horticulture, Natural Resources,
Family and Consumer Sciences, 4-H Youth Development, Florida
Yards and Neighborhoods, and Urban Sustainability. New
responsibilities in FY2011 include the programming and operation of
Brooker Creek and Weedon Island Education Centers.
Countywide Horticulture OperationsManages the landscaping and horticulture crews in the countywide
parks system, public lands, right of ways and other county facilities.
79
Parks & Conservation Resources
Natural and Historic Resources Management
Provides stewardship for the natural and cultural resources found
within the county‟s parks, preserves and management areas as well as
Heritage Village and the Florida Botanical Gardens.
Air QualityProvides local ambient air monitoring and compliance and
enforcement of federal, state and local air regulations relating to
potential pollutants.
Marina OperationsIncludes operation of the Belle Harbor and Sutherland Bayou marinas.
80
Parks & Conservation Resources
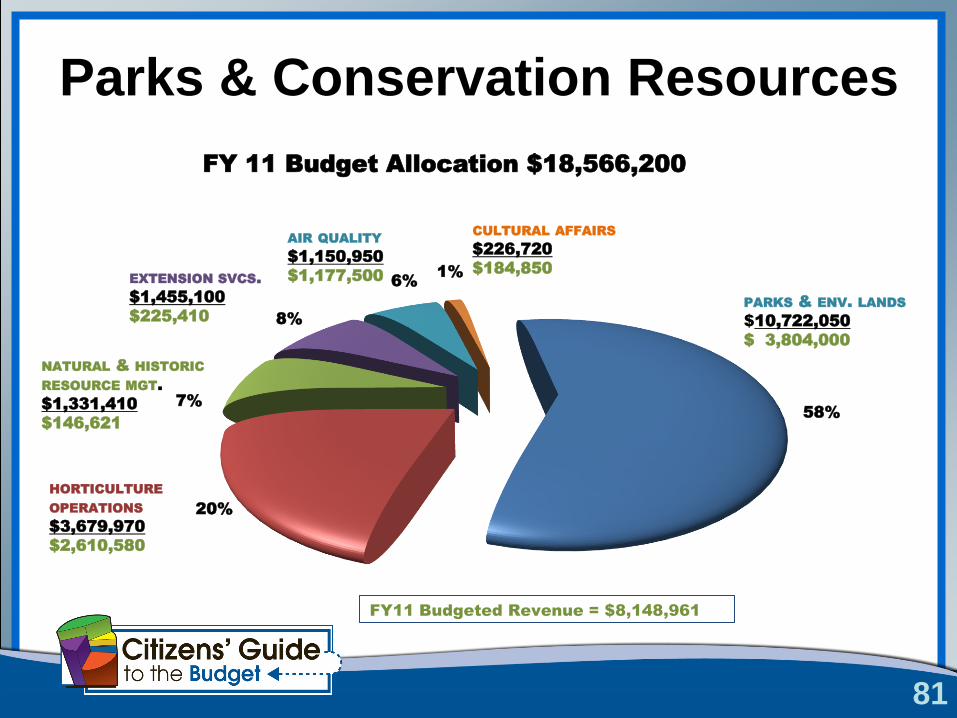
81
58%
20%
7%
8%
6%1%
FY 11 Budget Allocation $18,566,200
PARKS & ENV. LANDS
$10,722,050
$ 3,804,000
HORTICULTURE
OPERATIONS
$3,679,970
$2,610,580
NATURAL & HISTORIC
RESOURCE MGT.
$1,331,410
$146,621
EXTENSION SVCS.
$1,455,100
$225,410
CULTURAL AFFAIRS
$226,720
$184,850
AIR QUALITY
$1,150,950
$1,177,500
FY11 Budgeted Revenue = $8,148,961
82
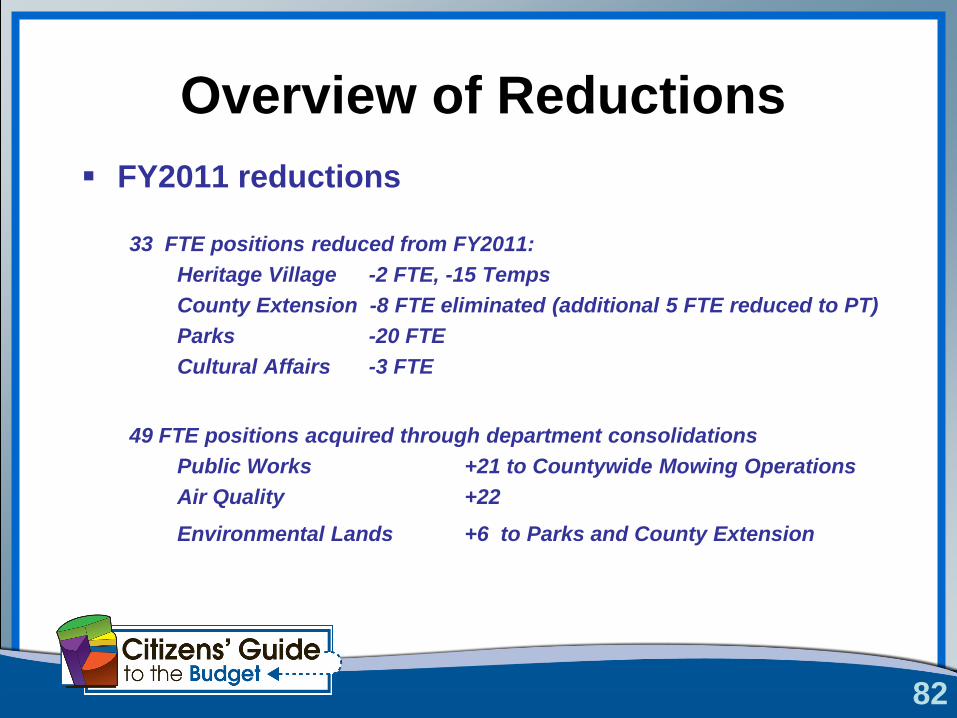
Overview of Reductions
FY2011 reductions
33 FTE positions reduced from FY2011:
Heritage Village -2 FTE, -15 Temps
County Extension -8 FTE eliminated (additional 5 FTE reduced to PT)
Parks -20 FTE
Cultural Affairs -3 FTE
49 FTE positions acquired through department consolidations
Public Works +21 to Countywide Mowing Operations
Air Quality +22
Environmental Lands +6 to Parks and County Extension
83
Key Programs & Service Levels
Parks & Environmental Lands
Operates and maintains over 20,000 acres of parks,
preserves and management areas, including 97 restroom
facilities, 116 picnic shelters, 74 boat ramp lanes, 241
campsites, the Fred Marquis Pinellas Trail, Progress
Energy Trail, and Belle Harbour Marina for approximately
16,000,000 annual visitations.
Current service level includes daily restroom and shelter
cleanup; daily litter pick up and emptying of trash cans;
park ranger patrol of publicly accessible properties; and 48
hour response time for complaints, inquiries and
information requests.
35% cost recovery through campground fees, shelter
reservation fees, concession fees and licenses.
84
Key Programs & Service Levels County Extension
Provides educational resources and programs from the
University of Florida to over 80,000 citizens in the areas of
youth development, natural resource conservation, health,
financial management, sustainable practices, and
horticulture and landscape management.
Provides operational and program support to Brooker
Creek Preserve and Weedon Island Education Centers.
Air Quality
Operates 40 ambient air monitors at 12 sites, seven days
per week, 365 days per year.
Perform 1000 site inspections for air regulation compliance.
Address 250 citizen complaints within 3 day response time.
85
Key Programs & Service Levels
Countywide Horticulture Operations
Provide landscape maintenance/mowing services for
approximately 1600 acres of county right-of-ways, over
1300 acres of parks and environmental lands, 85 acres of
Utilities properties and 287 lift stations, and approximately
42 miles of trail right-of-way.
Manage 17 landscape contracts and interlocal agreements
requiring daily, weekly or monthly inspection and
oversight.
In-house mowing operations strives to maintain 21-day
mowing cycle for most parks, Utilities facilities and right-of-
ways.
86
Key Programs & Service Levels
Natural & Historic Resource Management
Program provides stewardship for the natural and cultural
resources located within the County‟s parks, preserves and
management areas, including popular visitor attractions
such as Heritage Village Living History Museum and Florida
Botanical Gardens.
Current service levels include controlling exotics/nuisance
species on 3,275 acres of public lands, prescribed burning
of 150 acres of fire-dependent natural areas, and providing
public access to historic structures, artifacts and archives
housed at Heritage Village and Gulf Beaches Historical
Museum.
87
Impacts to the Public
Parks & Conservation Resources Reduction in number of facility maintenance work units from 5
districts to 3 districts has required additional driving time and
distance, and reduced staff visibility.
Park Rangers no longer assigned to Pinellas Trail; increased
reliance on Auxiliary Rangers and roving Park Rangers.
Reduction in general “housekeeping “ maintenance items such as
leaf blowing, pressure washing, and landscape bed maintenance
has impacted public perception of parks.
Increase in complaints over park rule violations, especially
related to unleashed animals and unruly visitors.
Parks maintenance staff has increased responsibilities associated
with preserves and management areas.
88
Impacts to the Public
County Extension 16% first quarter reduction in number of classes offered in areas of
financial planning, resource conservation, nutrition, and horticulture
compared to FY2010.
13% first quarter increase in number of programs provided at Brooker
Creek and Weedon Island Education Centers.
Weekend and offsite programming in horticulture have been eliminated
due to lack of staffing.
University of Florida Extension Agents have increased role in training of
volunteers, which reduces availability for other responsibilities.
Natural and Historic Resource Management Reduction in land management staff has decreased staff availability to
provide stewardship in natural areas and preserves.
Increased response time from 1.5 days to 3.5 days to respond to archive
requests.
89
Impacts to the Public
Horticulture Operations
Consolidation of mowing operations should improve
consistency of mowing practices and make it easier for
citizen concerns to be addressed.
Park mowing cycle intervals increased from every 17 days
to every 21 days due to staff reductions.
Air Quality
Reduced support for community clean air partners and
associated projects.
Field assistance reduced and assistance via phone calls
increased.
90
Operational Changes
The department continues to rely on volunteers to supplement service
levels, including some non-traditional roles.
Greater reliance on non-profits and “Friends” groups for financial
support, especially at Heritage Village and Florida Botanical Gardens.
The department has replaced several full-time mowing positions with
contractual labor, which has reduced mowing costs overall but
requires larger investment of time in training and supervision.
Reduction in support staff increases reliance on web sites and web
related programs to provide traditional office and telephone services.
Maintenance functions continue to operate under “roving” crews, but
area of responsibility has increased with merger of parks and
environmental lands.
Lower priority work is delayed or eliminated due to increasing work
load.
91
Challenges & Lessons Learned
Challenges Due to method by which our parks and public lands
maintenance is performed, rising gas prices may significantly
impact operating budgets.
As job market begins to thaw, employees are increasingly
looking outside of the County for employment opportunities
because of continued uncertainty.
Citizens are still having difficulty in grasping the new reality
related to many of our maintenance standards.
Lessons Learned Merging multiple programs and functions into a new system is
difficult. Highly recommend that future changes be initiated
over a longer time period.
92
Potential Impacts
Fertilizer legislation may have multiple impacts to the
department, both in operations and programming.
Potential federal and state budget cuts may significantly
impact funding for local air programs in the face of
anticipated new air quality ozone standards.
Consecutive winter freezes have degraded landscaping in
county parks, roadway medians and Florida Botanical
Gardens.
Municipal zoning and building department regulations
continue to impact revenue enhancement opportunities.

Budget Timeline
194
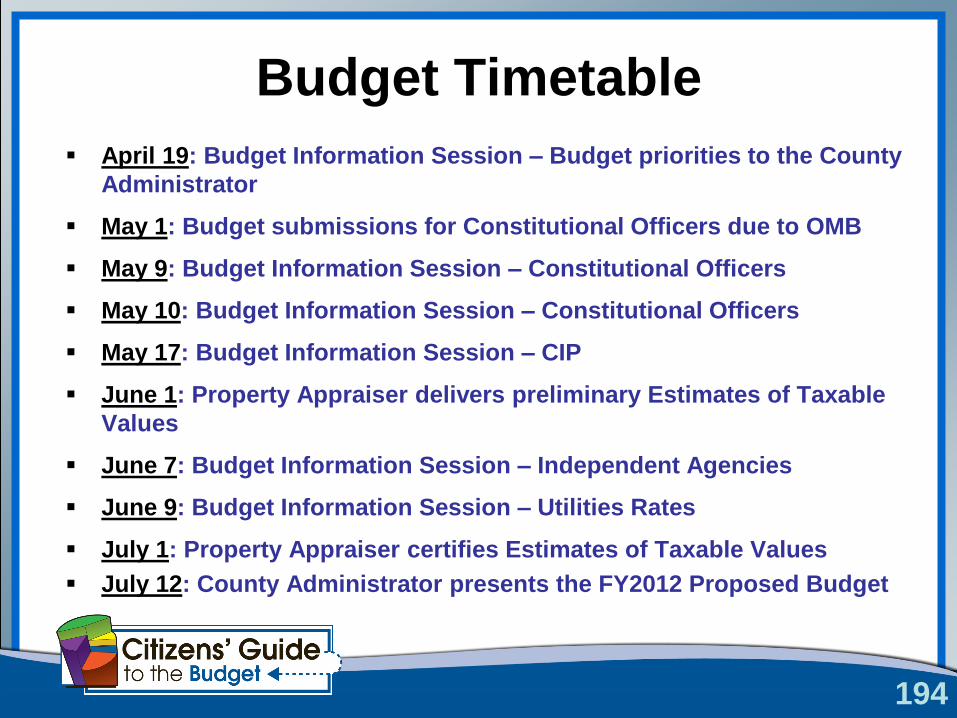
Budget Timetable
April 19: Budget Information Session – Budget priorities to the County
Administrator
May 1: Budget submissions for Constitutional Officers due to OMB
May 9: Budget Information Session – Constitutional Officers
May 10: Budget Information Session – Constitutional Officers
May 17: Budget Information Session – CIP
June 1: Property Appraiser delivers preliminary Estimates of Taxable
Values
June 7: Budget Information Session – Independent Agencies
June 9: Budget Information Session – Utilities Rates
July 1: Property Appraiser certifies Estimates of Taxable Values
July 12: County Administrator presents the FY2012 Proposed Budget
195
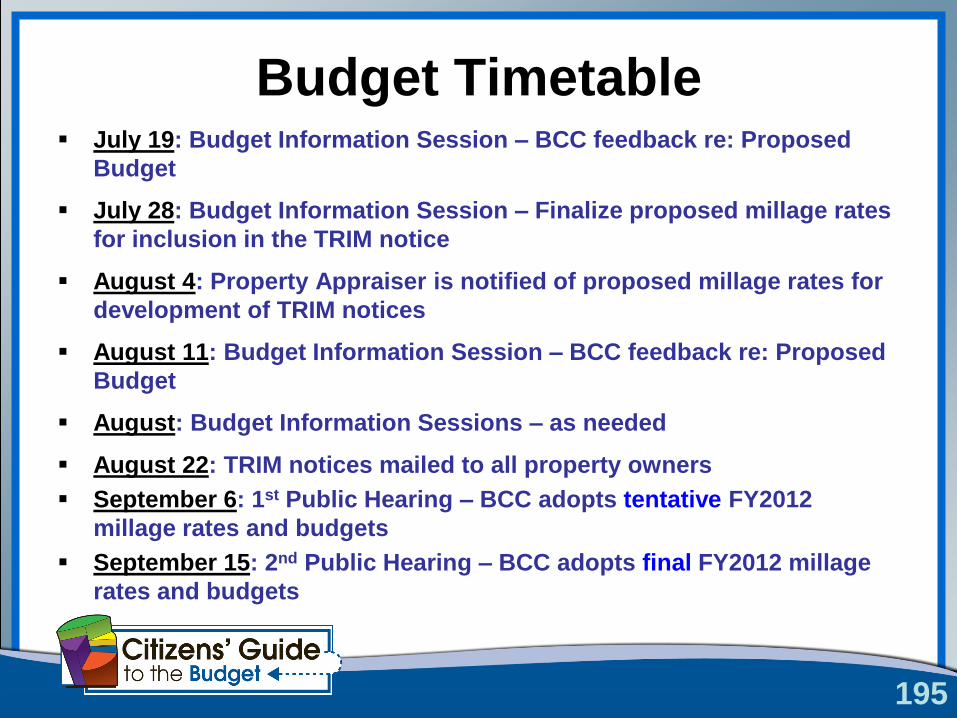
Budget Timetable July 19: Budget Information Session – BCC feedback re: Proposed
Budget
July 28: Budget Information Session – Finalize proposed millage rates
for inclusion in the TRIM notice
August 4: Property Appraiser is notified of proposed millage rates for
development of TRIM notices
August 11: Budget Information Session – BCC feedback re: Proposed
Budget
August: Budget Information Sessions – as needed
August 22: TRIM notices mailed to all property owners
September 6: 1st Public Hearing – BCC adopts tentative FY2012
millage rates and budgets
September 15: 2nd Public Hearing – BCC adopts final FY2012 millage
rates and budgets

Questions